Countries With the Widest Gaps Between Rich and Poor
May 23, 2019 by Grant SunesonIn American politics, the issue of income inequality comes up frequently. As wealth continues to concentrate at the top — now the wealthiest 10% of American households control nearly 75% of household net worth — the middle continues to shrink, and some previously thriving metro areas have been hard hit by extreme poverty.
But income inequality is not a uniquely American issue. Nations from all six populated continents have massive wealth gaps between their richest and poorest residents. Many of the most economically productive countries in the world have not been able to devise a way to stop, or even slow, the growing inequality.
Income inequality across a population is quantified using the Gini coefficient measure. On the Gini scale, inequality is measured from 0 to 1, where 0 represents a perfectly equal society and 1 represents extreme inequality where a single individual controls all the wealth.
24/7 Wall St. reviewed the Gini coefficient of 42 countries from the Organization for Economic Cooperation and Development to identify the countries with the widest gaps between the rich and the poor. Both OECD member states and affiliated states were considered. OECD members tend to be high income nations, and income inequality may be even more pronounced in poorer countries not considered.
Click here to see the countries with the widest gaps between rich and poor
To determine the countries with the most uneven distribution of income, 24/7 Wall St. reviewed post-tax and transfer Gini coefficients published by the Organization for Economic Cooperation and Development. We also considered data on GDP at purchasing power parity, poverty rate, unemployment, GDP per capita, as well as social spending (which the OECD defines as “cash benefits, direct in-kind provision of goods and services, and tax breaks with social purposes”) — all from the OECD. We also reviewed the Corruption Perceptions Index from global corruption watchdog Transparency International to gauge levels of public sector corruption. All figures are for the most recently available year. All ranks are for the OECD member and affiliated states with data available.

15. Latvia
> Gini coefficient: 0.35 (pre-tax + transfers: 0.48)
> Unemployment rate: 8.7%
> GDP per capita: $23,710
> Poverty rate: 16.8%
> Population: 1.9 million
Latvia’s Gini coefficient of 0.35 is the 15th highest among the 42 OECD member states and affiliates for which data exists. The Baltic nation narrowly edged out Israel for a spot on this list. Latvia may struggle in the future to sustain economic growth as it faces a declining population. The nation’s population contracted by nearly 0.9% over the last year. The decline in population will likely translate into a decline in the workforce and less economic activity, which could hamper economic growth in Latvia.
[in-text-ad]

14. New Zealand
> Gini coefficient: 0.35 (pre-tax + transfers: 0.46)
> Unemployment rate: 4.7%
> GDP per capita: $35,777
> Poverty rate: 10.9%
> Population: 4.8 million
Higher labor force participation can help drive down income inequality as a higher share of working people can reduce the poverty rate and shrink the gap between rich and poor. Yet this is not the case in New Zealand, which still has among the highest income inequalities despite having one of the highest labor force participation rates. More than 70% of New Zealanders aged 15 and older are in the labor force — the second highest rate among OECD member states and affiliates
 24/7 Wall St.
13. United Kingdom
> Gini coefficient: 0.35 (pre-tax + transfers: 0.51)
> Unemployment rate: 4.3%
> GDP per capita: $39,425
> Poverty rate: 11.1%
> Population: 66.0 million
Though the United Kingdom has one of the widest gaps between rich and poor residents, the country is doing more than any other on this list to reduce this inequality. Countries can redistribute wealth using personal income taxes, workers’ social security contributions, and cash transfers. The U.K.’s Gini coefficient, after factoring in these redistributions, drops by more than 30%, the greatest reduction among nations on this list.

12. South Korea
> Gini coefficient: 0.36 (pre-tax + transfers: 0.41)
> Unemployment rate: 3.7%
> GDP per capita: $35,020
> Poverty rate: 17.4%
> Population: 51.5 million
With just 3.7% of its labor force out of work, South Korea has one of the lowest unemployment rates among wealthy nations. Still, the high income inequality in the country is highlighted by the fact that, despite the low jobless rate, 17.4% of South Koreans live below the poverty line.
President Moon Jae-in took power in 2017, promising economic reforms, including an 11% minimum wage increase. The measure has been widely criticized, however. While businesses argue the increase is stifling growth, workers argue it was not large enough.
[in-text-ad-2]

11. Russia
> Gini coefficient: 0.38 (pre-tax + transfers: 0.49)
> Unemployment rate: 5.2%
> GDP per capita: $24,417
> Poverty rate: N/A
> Population: 144.5 million
Russia is one of the wealthiest countries in the world, but a disproportionate share of that wealth is concentrated at the top. The country’s income inequality is largely the product its system of government. Russia has a Corruption Perceptions Index score of 28 — tied for the worst among OECD member states and affiliates and one of the lowest in the world. Oligarchs with close ties to the Russian government can use those relationships to earn lucrative business deals, essentially mounting hurdles to upward economic mobility in the country.

10. Lithuania
> Gini coefficient: 0.38 (pre-tax + transfers: 0.52)
> Unemployment rate: 7.1%
> GDP per capita: $28,032
> Poverty rate: 16.9%
> Population: 2.8 million
Over the past year, Lithuania’s population shrank by more than 1.4% — the largest decline by far of any OECD member states and affiliates. A population decline can lead to reductions in the workforce and limit economic growth — especially in Lithuania, a small country with fewer than 3 million people. On the other hand, a well-educated workforce can help drive growth, and Lithuania has the highest bachelor’s degree attainment rate among OECD member states and affiliates, at 34%.
[in-text-ad]

9. United States
> Gini coefficient: 0.39 (pre-tax + transfers: 0.51)
> Unemployment rate: 4.4%
> GDP per capita: $53,632
> Poverty rate: 17.8%
> Population: 325.1 million
With a GDP per capita of $53,632 and an unemployment rate of 4.4%, the U.S. economy appears healthy. But the benefits of a strong economy are not evenly enjoyed by all Americans. Of the 325.1 million Americans, an estimated 17.8% live below the poverty line. U.S. taxes and transfers do a relatively poor job of leveling out the economic playing field. While most nations’ Gini coefficients declines by more than 30% after taxes and transfers, the U.S. Gini coefficient declines by only about 23%.

8. Turkey
> Gini coefficient: 0.40 (pre-tax + transfers: 0.43)
> Unemployment rate: 10.8%
> GDP per capita: $23,756
> Poverty rate: 17.2%
> Population: 80.7 million
Almost by definition, free-market economies will produce winners and losers, and like nearly every other country on this list, Turkey’s is a largely free-market economy. Turkey spans both Europe and Asia, and it has the worst income inequality of any European country and third worst of any Asian country considered.
In recent years, government officials have leveraged their power to target and harm political opponents economically. This has been followed by undermined confidence in Turkey’s financial institutions, several credit rating downgrades, and likely, increased inequality as power and money converge.

7. Chile
> Gini coefficient: 0.45 (pre-tax + transfers: 0.49)
> Unemployment rate: 7.0%
> GDP per capita: $22,614
> Poverty rate: 16.1%
> Population: 18.1 million
Chile has one of the most developed and fundamentally sound economies in South America. It also has some of the continent’s worst income inequality. Just over 16% of the coastal country’s 18.1 million residents live below the poverty line — and many of them are likely among the 7% of workers who are unemployed.
Chile implemented tax reforms in 2014 to help reduce economic inequality. What effect these reforms will have over the long term remains to be seen.
[in-text-ad-2]
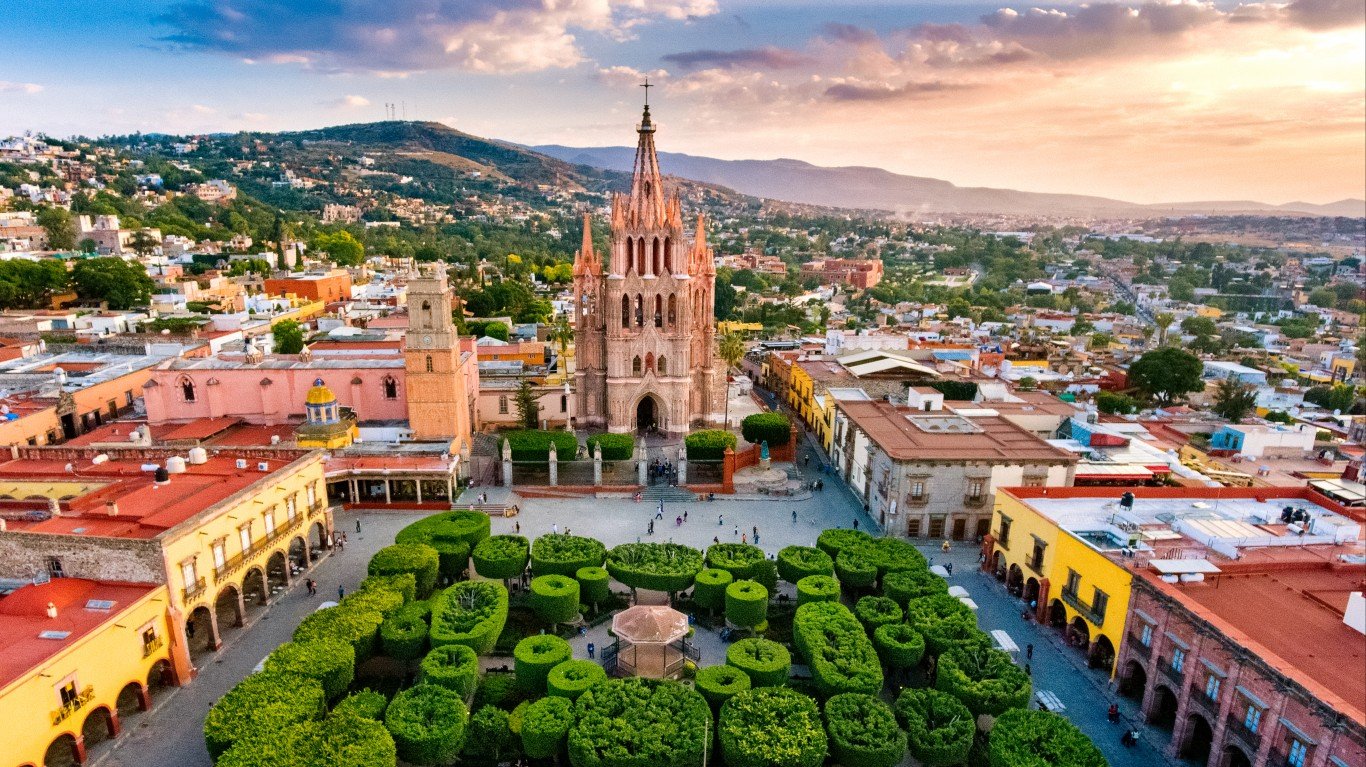
6. Mexico
> Gini coefficient: 0.46 (pre-tax + transfers: 0.47)
> Unemployment rate: 3.4%
> GDP per capita: $17,200
> Poverty rate: 16.6%
> Population: 129.2 million
Only five OECD member and affiliate states have worse income inequality than Mexico. In the majority of countries on this list, taxes and transfers reduce income inequality by well over 10%. In Mexico, however, taxes and transfers only close the income gap by 3.2%, the smallest improvement of any country on this list after India. Government corruption likely hampers progress toward greater income equality in Mexico as the country is tied with Russia as the most corrupt on this list.

5. Brazil
> Gini coefficient: 0.47 (pre-tax + transfers: 0.58)
> Unemployment rate: 12.8%
> GDP per capita: $14,098
> Poverty rate: 20%
> Population: 209.3 million
Slammed by its largest-ever recession in 2015 and 2016 and roiled by political corruption scandals, Brazil’s economy has struggled in recent years. Brazil ranks among the most corrupt countries on this list. Currently, one in every five Brazillians lives below the poverty line, and about 4% of the population lives on just $3.20 a day.
Jair Bolsonaro, Brazil’s new president, took office in January and pledged to end government corruption and reduce state intervention in the economy. What, if any, effect this will have on reducing income inequality remains to be seen.
[in-text-ad]
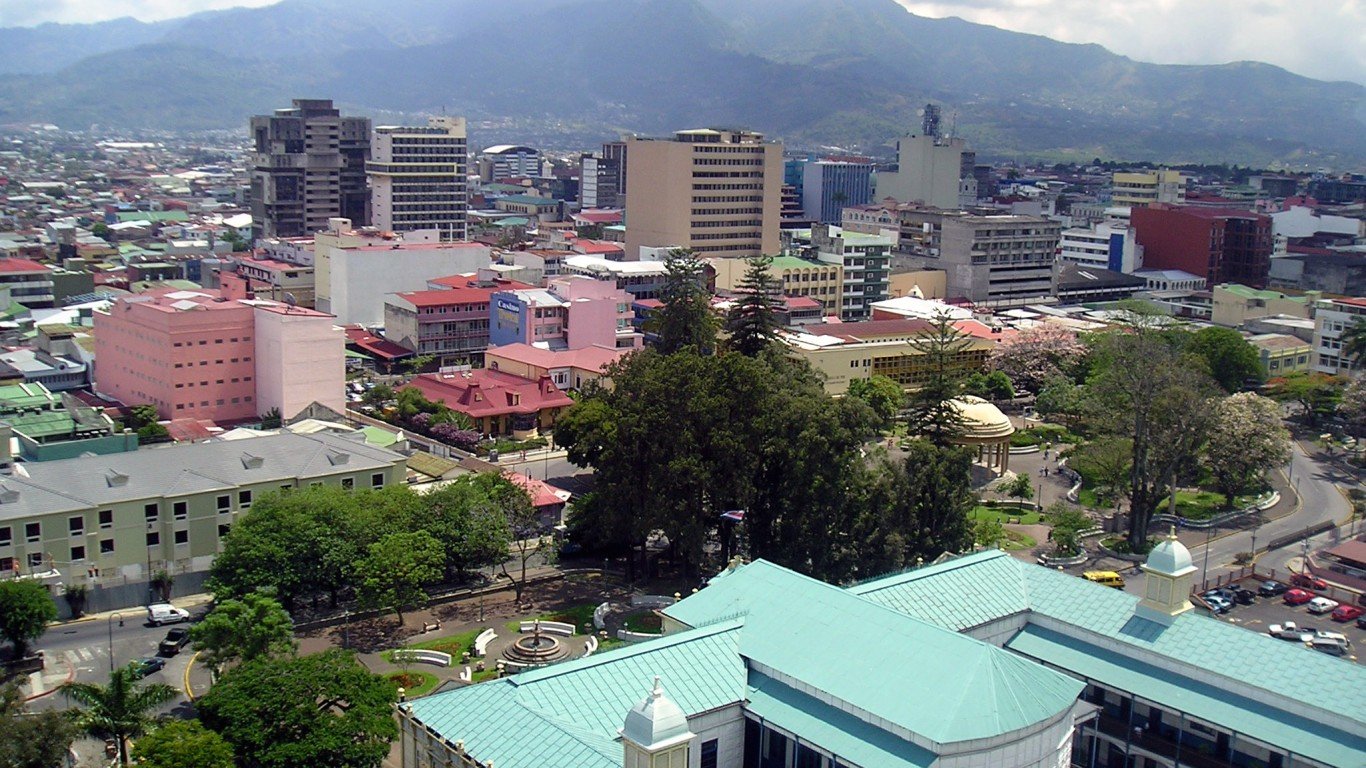
4. Costa Rica
> Gini coefficient: 0.48 (pre-tax + transfers: 0.53)
> Unemployment rate: 8.1%
> GDP per capita: $15,208
> Poverty rate: 20.4%
> Population: 4.9 million
Costa Rica enjoys some of the highest living standards of any Central American nation — as partially evidenced by a GDP per capita of $15,208. Formerly dependent primarily on agriculture, Costa Rica’s economy now relies mostly on tourism. Despite stable economic growth in recent years, the nation’s poverty rate has remained between 20% and 25% for the last two decades. Tighter budgets have diminished the country’s social safety net in recent years, and recent credit rating downgrades could slow economic growth going forward.

3. India
> Gini coefficient: 0.50 (pre-tax + transfers: 0.51)
> Unemployment rate: 2.6%
> GDP per capita: $6,147
> Poverty rate: N/A
> Population: 1.3 billion
Home to 1.3 billion people, India is the second most populous country in the world and has some of the worst income inequality. In the majority of countries on this list, taxes and transfers reduce income inequality by well over 10%. In India, however, taxes and transfers only close the income gap by 2.6%, the smallest improvement of any country on this list. With a diverse economy ranging from subsistence farming to major industrial companies competing at a global level, India is rapidly modernizing and transitioning to a more liberalized economy.
One major impediment to income equality in the country is a prevailing culture of discrimination against women. Fewer than one in every four women over age 15 in the country participate in the labor force, compared to about 79% of men of the same age.

2. China
> Gini coefficient: 0.51 (pre-tax + transfers: 0.55)
> Unemployment rate: 4.4%
> GDP per capita: $14,401
> Poverty rate: N/A
> Population: 1.4 billion
Having recently transitioned from a totalitarian socialist economy to a more market oriented one, China’s economy is unique on this list. As a result of the transition, economic growth has been rapid in recent years, but the country remains economically hamstrung by tight government controls and corruption. Likely due in part to the close relationship between government and business in the country, China has the third highest corruption score among the countries on this list. Taxes and transfers only reduce income inequality by 6.2% in China. In most countries on this list, taxes and transfers reduce inequality by well over 10%.
[in-text-ad-2]

1. South Africa
> Gini coefficient: 0.62 (pre-tax + transfers: 0.72)
> Unemployment rate: 27.3%
> GDP per capita: $12,287
> Poverty rate: 26.6%
> Population: 56.7 million
Income inequality in South Africa today is, in large part, the legacy of the government’s former policy of apartheid. The policy segregated the country’s black majority from the white minority to the great economic and political disadvantage of the former group. Apartheid was the law of the land from 1948 to 1994, and many of the economic disadvantages that were law during that near half century are now so deeply entrenched that South Africa has the worst income inequality of any OECD member or affiliate state. More than one in every four workers in the country are unemployed, and frequent labor strikes and skill shortages hinder the country’s economic growth outlook.
Sponsored: Find a Qualified Financial Advisor
Finding a qualified financial advisor doesn’t have to be hard. SmartAsset’s free tool matches you with up to 3 fiduciary financial advisors in your area in 5 minutes. Each advisor has been vetted by SmartAsset and is held to a fiduciary standard to act in your best interests. If you’re ready to be matched with local advisors that can help you achieve your financial goals, get started now.