
The U.S. economy added 263,000 jobs in April, pushing the monthly unemployment rate down to 3.6% — the lowest level since 1969. The historic low is the result of 103 consecutive months of job growth, by far the longest stretch in American history.
While these figures tell an encouraging story, not everyone has benefitted from the record-breaking growth as more than 6.3 million Americans were unemployed as of 2018. In every corner of the country, unemployment is undesirable for any individual, often resulting in a reduced standard of living and necessitates drawing from savings and retirement accounts. It can even lead to poor health.
While every state has a social safety net to help those who lose their jobs or are laid off, the restrictiveness and generosity of these programs vary. As a result, the severity of the toll unemployment can take may depend on where one lives. 24/7 Wall St. created an index of various measures related to a state’s job market and its unemployment insurance program to determine the best and worst states to be unemployed.
State UI programs vary, and not everyone who is unemployed is eligible to receive benefits. Nationwide, 26% of unemployed Americans receive UI benefits. In the majority of the highest-ranking states on this list, the recipiency rate is far higher. Inclusivity is one measure of a state’s UI benefit efficacy, and over half of the best states to be unemployed in also rank among the best-run states in the country.
Unemployment is also less likely to last for a prolonged period of time in states with a healthy job market — states that are adding jobs and have low unemployment rates. Several of the state ranking as the worst places to be unemployed also happen to be some of the hardest states to find full-time work.
Click here to see the best states to be unemployed
Click here to see the worst states to be unemployed
To identify the best (and worst) states in which to be unemployed, 24/7 Wall St. generated a rank composed of four measures: the unemployment insurance (UI) recipiency rate, the average weekly benefit amount as a share of the average weekly wage, the unemployment rate, and the one-year job growth rate. Data on unemployment came from the Bureau of Labor Statistics and are for 2018. One-year job growth was calculated using annual employment figures for 2017 and 2018. Data on UI recipiency, income replacement, and UI benefit exhaustion — those who use up their benefits before finding a job — came from the U.S. Department of Labor and are for the 12 months ending Q3 2018.
Best States to be Unemployed

Source: bluebeat76 / Getty Images
10. New Jersey
> Pct. unemployed receiving benefits: 52.3% (the highest)
> Avg. weekly UI payout: $433 (6th highest)
> 2018 unemployment rate: 4.1% (15th highest)
> 1-yr. job growth: -0.2% (5th lowest)
New Jersey is the only state in the country where over half of all unemployed residents receive unemployment insurance benefits. The typical UI recipient in the Garden State is paid $433 a week, slightly more than the average payout across all states of $347.
The stronger than average social safety net may be necessary due to the weaker than average job market. Overall employment in New Jersey dropped by 0.2% in the last year — making it one of just a handful of states losing jobs. The state’s 2018 unemployment rate of 4.1% is slightly above the comparable 3.9% national rate.
See all stories featuring: New Jersey
[in-text-ad]

Source: CodyHaskell / Getty Images
9. Utah
> Pct. unemployed receiving benefits: 14.9% (9th lowest)
> Avg. weekly UI payout: $413 (8th highest)
> 2018 unemployment rate: 3.1% (12th lowest)
> 1-yr. job growth: +1.7% (12th highest)
The average unemployment insurance recipient in the United States is paid the equivalent of less than a third of the average weekly earnings in UI benefits. In Utah, the average recipient is paid 45.2% of the average weekly wage, the second highest share of any state.
Though Utah’s UI benefit recipiency rate of 14.9% is among the lowest of any state, strong economic conditions make it less likely that workers in the state will face unemployment for a significant duration. Utah ranks among the best states for business, and in the last year, Utah’s 1.7% job growth over the last year was higher than most other states. Similarly, its annual unemployment rate of 3.1% was well below the 3.9% national rate.
See all stories featuring: Utah

Source: f11photo / iStock
8. Nevada
> Pct. unemployed receiving benefits: 26.1% (17th highest)
> Avg. weekly UI payout: $348 (19th highest)
> 2018 unemployment rate: 4.6% (7th highest)
> 1-yr. job growth: +3.4% (2nd highest)
The average weekly unemployment insurance payout in Nevada is $348, almost exactly in line with the national average. Working wages, however, tend to be slightly lower than average in Nevada, and as a result, unemployment insurance covers a larger than typical share of weekly wages in the state.
In the last year, the number of people working in Nevada climbed by 3.4%, the second highest employment growth of any state. Nevada’s near nation-leading job growth is driven in part by its entertainment and hospitality industry, which is centered around gaming in Las Vegas. On a per capita spending basis, Nevada spends more on gambling than any other state.
See all stories featuring: Nevada
Source: DenisTangneyJr / Getty Images
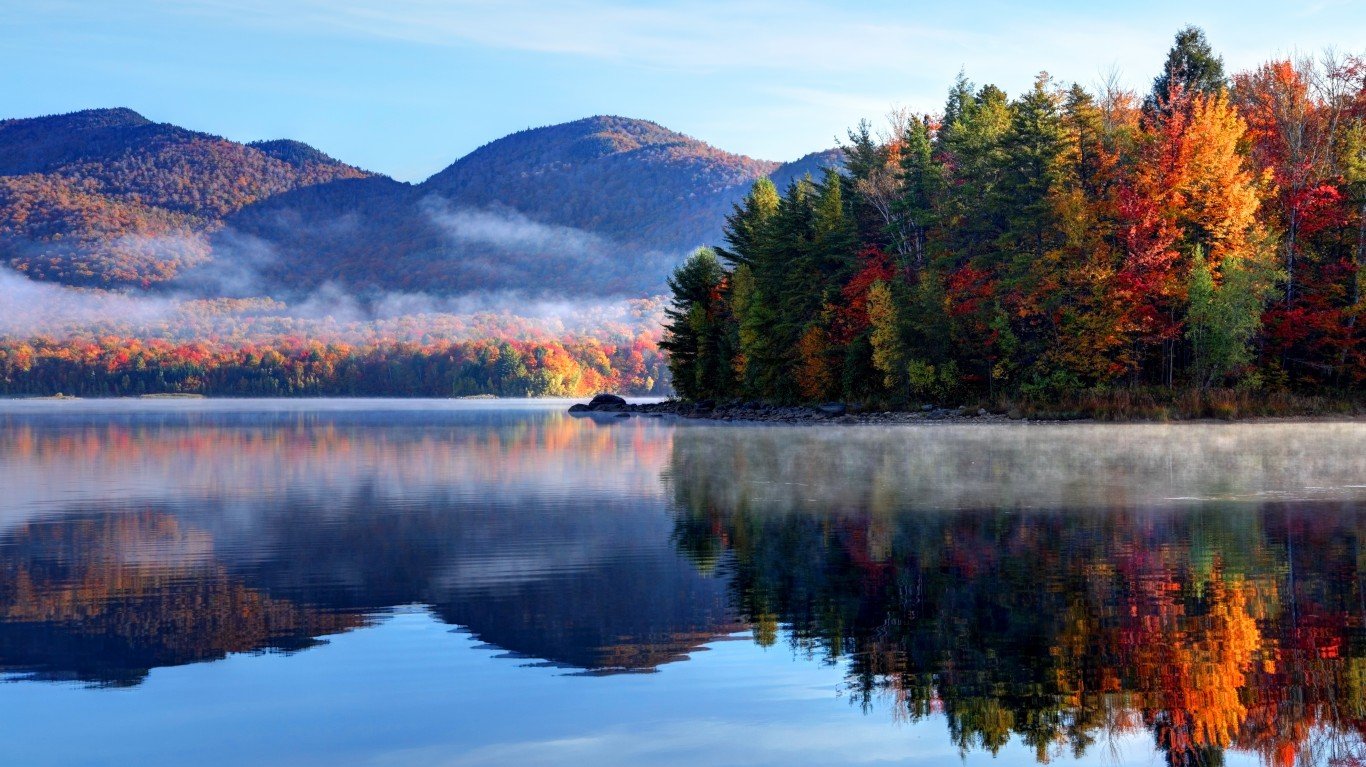
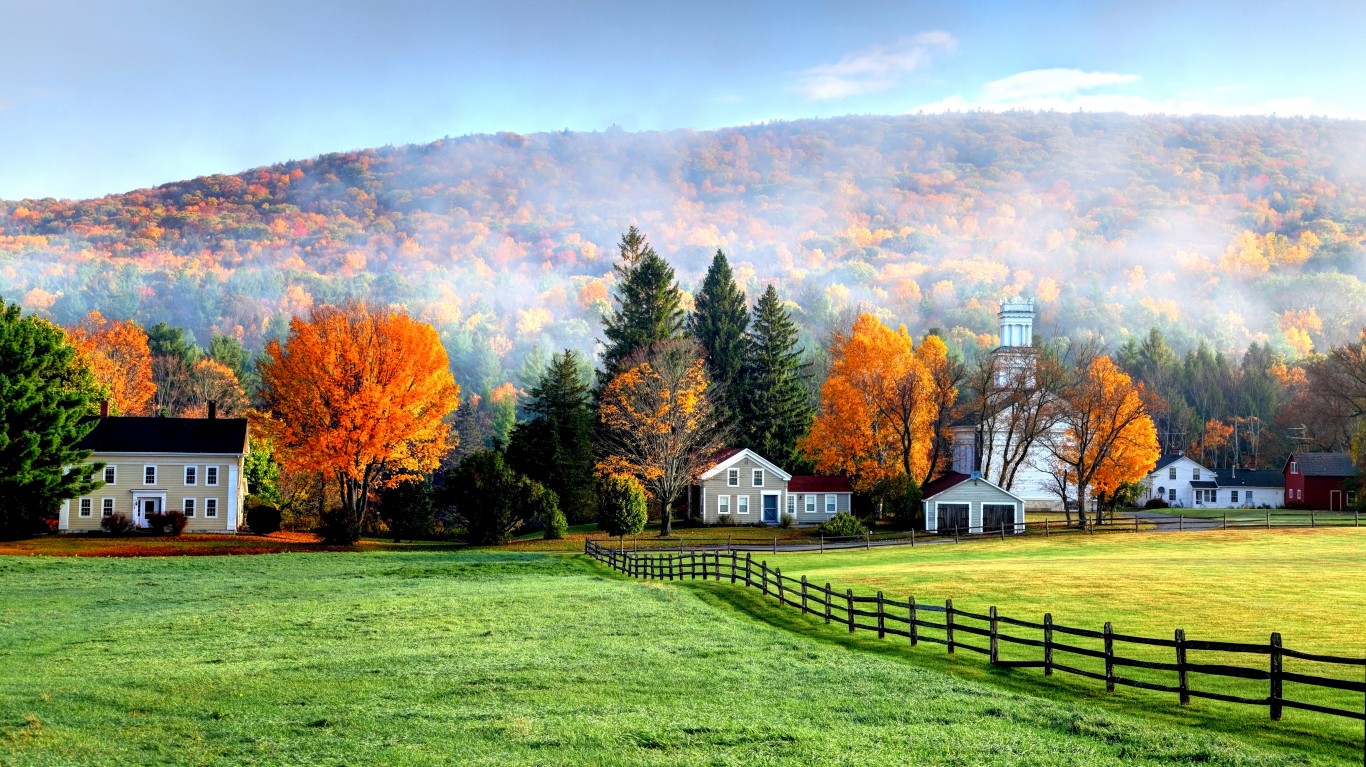
7. Vermont
> Pct. unemployed receiving benefits: 34.4% (10th highest)
> Avg. weekly UI payout: $347 (20th highest)
> 2018 unemployment rate: 2.7% (5th lowest)
> 1-yr. job growth: +0.3% (12th lowest)
Workers in Vermont are less likely to find themselves out of a job than those in nearly every other state. Just 2.7% of the state’s labor force was unemployed in 2018, well below the 3.9% national unemployment rate. A strong job market means that even those who are unemployed are less likely to remain so for long, and in Vermont, just 13.8% of unemployment benefit recipients exhaust their benefits before finding a job, the smallest share of any state. For reference, 35.9% of UI benefit recipients nationwide exhaust their benefits before finding work again.
See all stories featuring: Vermont
[in-text-ad-2]

Source: juliannafunk / Getty Images
6. Colorado
> Pct. unemployed receiving benefits: 18.5% (19th lowest)
> Avg. weekly UI payout: $432 (7th highest)
> 2018 unemployment rate: 3.3% (15th lowest)
> 1-yr. job growth: +2.9% (5th highest)
Unemployment benefit recipients in Colorado are paid an average of $432 a week, or about 39% of the average working wage in the state. Nationwide, the average weekly UI payout is $347, which is just 32% of the average weekly working wage.
Unemployment is also less common in Colorado than it is nationwide. Just 3.3% of the labor force was out of a job in 2018 compared to the 3.9% national unemployment rate. Due in no small part to a strong job market, Colorado ranks among the best states to live in.
See all stories featuring: Colorado

Source: Willard / Getty Images
5. Minnesota
> Pct. unemployed receiving benefits: 33.5% (11th highest)
> Avg. weekly UI payout: $453 (4th highest)
> 2018 unemployment rate: 2.9% (8th lowest)
> 1-yr. job growth: +0.9% (25th highest)
Only three states have a higher average weekly UI benefit payout than Minnesota. UI benefit recipients get an average of $453 a week while they look for work, well above the national average of $347. Minnesota’s strong job market — evidenced by a 2.9% annual unemployment rate — means the unemployed are less likely to remain jobless for long. Just 31.7% of UI recipients in Minnesota reach the end of their benefits before finding work, slightly lower than the 35.9% national UI exhaustion rate.
See all stories featuring: Minnesota
[in-text-ad]
Source: mattalberts / Getty Images
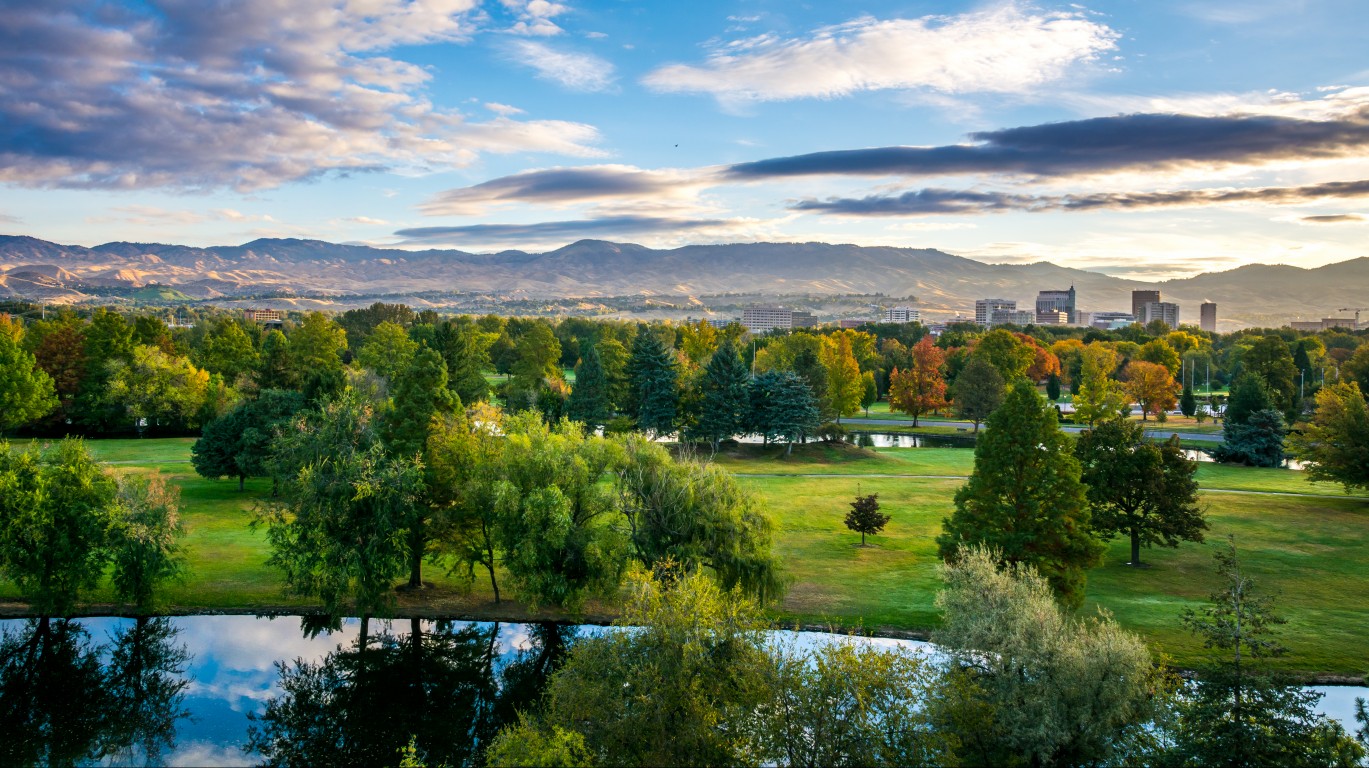
4. Idaho
> Pct. unemployed receiving benefits: 19.9% (21st lowest)
> Avg. weekly UI payout: $307 (18th lowest)
> 2018 unemployment rate: 2.8% (7th lowest)
> 1-yr. job growth: +3.1% (4th highest)
The unemployment insurance recipiency rate is lower than average in Idaho, as is the average weekly payout. Workers in the state, however, are less likely to have to rely on them for an extended period of time as workers nationwide thanks to a booming job market. Over the last year, overall employment climbed by 3.1% in Idaho, more than in all but three other states. Additionally, Idaho’s 2.8% unemployment rate in 2018 is among the lowest in the country — well below the comparable 3.9% national rate.
See all stories featuring: Idaho

Source: LarryLindell / Getty Images
3. Iowa
> Pct. unemployed receiving benefits: 36.6% (8th highest)
> Avg. weekly UI payout: $383 (11th highest)
> 2018 unemployment rate: 2.5% (3rd lowest)
> 1-yr. job growth: +1.1% (22nd highest)
Iowa appears to have one of the least restrictive unemployment insurance programs of any state. An estimated 36.6% of all unemployed residents are receiving UI benefits, well above the 26.3% national recipiency rate. Weekly payouts also go further than average, covering 42% of the average working wage compared to nationwide average weekly UI payout covers of only 32% of the average weekly wage.
Workers in Iowa also benefit from a strong job market. Just 2.5% of the state’s labor force are unemployed, nearly the lowest unemployment rate among states.
See all stories featuring: Iowa

Source: wingmar / Getty Images
2. Hawaii
> Pct. unemployed receiving benefits: 41.8% (4th highest)
> Avg. weekly UI payout: $503 (2nd highest)
> 2018 unemployment rate: 2.4% (the lowest)
> 1-yr. job growth: -0.7% (3rd lowest)
By several measures, Hawaii has one of the most generous unemployment insurance programs in the country. The average weekly UI payout in the state of $503 is well above the $347 national average. That amount covers 53% of the average weekly working wage in Hawaii, the largest share of any state.
Hawaii also has one of the best economies of any state. Just 2.4% of workers in Hawaii were out of a job in 2018, the lowest annual unemployment rate of any state.
See all stories featuring: Hawaii
[in-text-ad-2]
Source: DenisTangneyJr / Getty Images
1. Massachusetts
> Pct. unemployed receiving benefits: 48.0% (2nd highest)
> Avg. weekly UI payout: $515 (the highest)
> 2018 unemployment rate: 3.3% (15th lowest)
> 1-yr. job growth: +3.4% (3rd highest)
Massachusetts spends more on unemployment benefits on a per person basis than every other state. Of all unemployed persons in the state, 48.0% receive UI benefits, nearly double the 26.3% recipiency rate across all states. Additionally, those with UI benefits are paid an average of $515 per week, the highest average weekly payment in the country. The state’s strong social safety net does not stop with unemployment benefits. Massachusetts also spends more on health care than all but a handful of states.
See all stories featuring: Massachusetts
Worst States to be Unemployed

Source: Sean Pavone / Getty Images
10. Georgia
> Pct. unemployed receiving benefits: 12.6% (5th lowest)
> Avg. weekly UI payout: $290 (14th lowest)
> 2018 unemployment rate: 3.9% (21st highest)
> 1-yr. job growth: +1.7% (11th highest)
Only about 12.6% of unemployed workers in Georgia receive unemployment insurance benefits, less than half the national UI recipiency rate of 26.3%. For those receiving UI benefits, weekly payments are relatively low, at just $290 on average. Nationwide, the typical weekly UI payment is $347. However, unlike many of the other states that rank among the worst places to be unemployed, Georgia has a relatively healthy job market. Employment climbed by 1.7% in the state last year and just 3.9% of workers were unemployed in 2018, both of which are roughly in line with the respective U.S. rates.
See all stories featuring: Georgia
[in-text-ad]

Source: pawel.gaul / Getty Images
9. Michigan
> Pct. unemployed receiving benefits: 20.0% (22nd lowest)
> Avg. weekly UI payout: $305 (17th lowest)
> 2018 unemployment rate: 4.1% (15th highest)
> 1-yr. job growth: +0.8% (22nd lowest)
Only one in every five out-of-job workers in Michigan receive UI benefits, compared to more than one in four unemployed Americans. Joblessness is also a larger problem in Michigan than it is in most states, as 4.1% of the labor force were out of work in 2018 compared to 3.9% of American workers. Unemployment is far worse in certain pockets of the state, and largely because of weak economic conditions, half a dozen Michigan cities, including Detroit and Flint, rank among the 50 worst cities to live in.
See all stories featuring: Michigan
Source: Sean Pavone / Getty Images
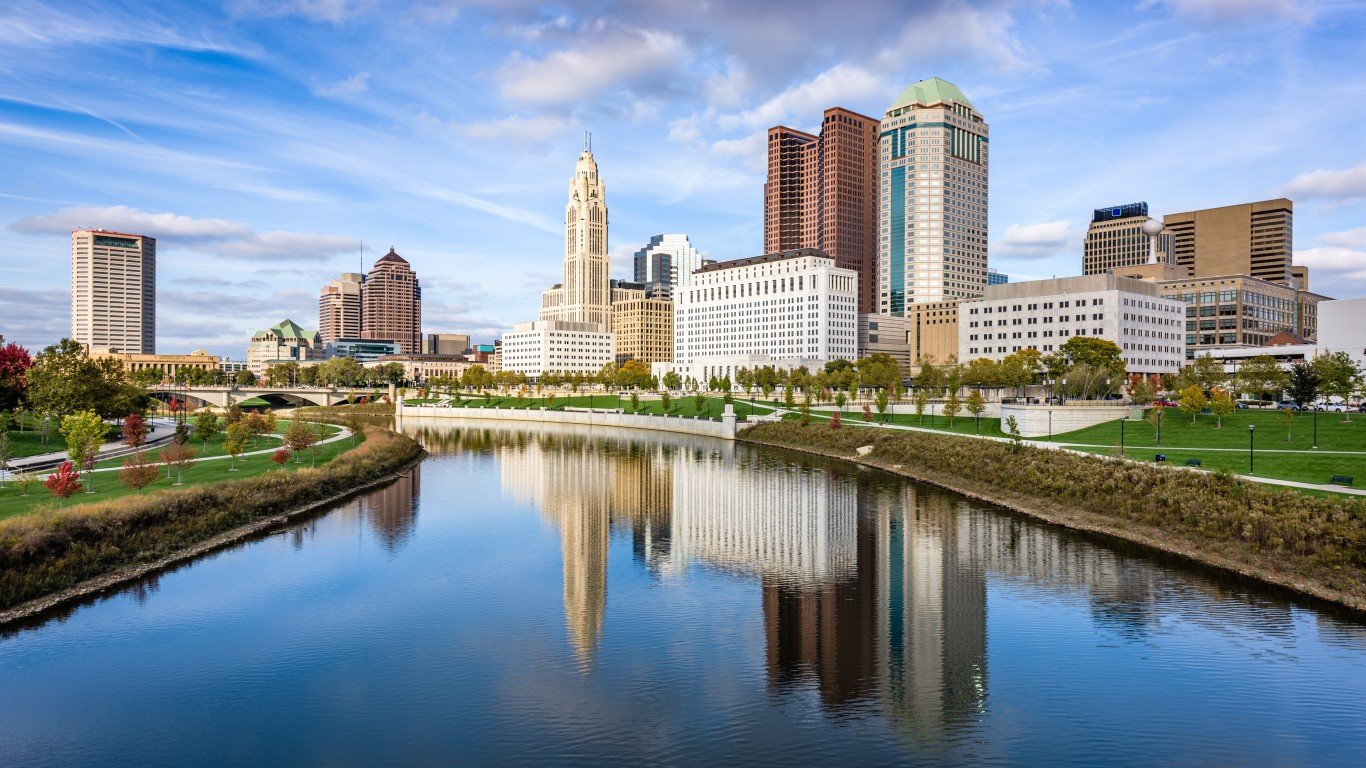
8. Ohio
> Pct. unemployed receiving benefits: 17.4% (15th lowest)
> Avg. weekly UI payout: $361 (17th highest)
> 2018 unemployment rate: 4.6% (7th highest)
> 1-yr. job growth: +0.2% (9th lowest)
Only 17.4% of unemployed workers in Ohio receive UI benefits, a smaller share than in most states. Nationwide, 26.3% of unemployed workers receive UI benefits. The lower than average coverage in Ohio comes with greater than average need. In 2018, an average of 4.6% of workers were unemployed in the Buckeye State, a higher unemployment rate than in all but half a dozen states.
See all stories featuring: Ohio

Source: RickSause / Getty Images
7. North Carolina
> Pct. unemployed receiving benefits: 10.1% (2nd lowest)
> Avg. weekly UI payout: $256 (10th lowest)
> 2018 unemployment rate: 3.9% (21st highest)
> 1-yr. job growth: +1.5% (15th highest)
Though North Carolina’s 3.9% unemployment rate in 2018 is the same as the comparable national rate, joblessness is much more likely to be a financial strain in the state than on average nationwide. Only about one in every 10 workers in the state who are out of a job receive UI benefits, compared to more than one in every four nationwide. Additionally, the average weekly UI benefit payout of $256 in North Carolina covers only about 27% of the average weekly working wage in the state. Meanwhile, the average national weekly UI payout of $347 covers 32% of the average worker’s weekly earnings.
See all stories featuring: North Carolina
[in-text-ad-2]
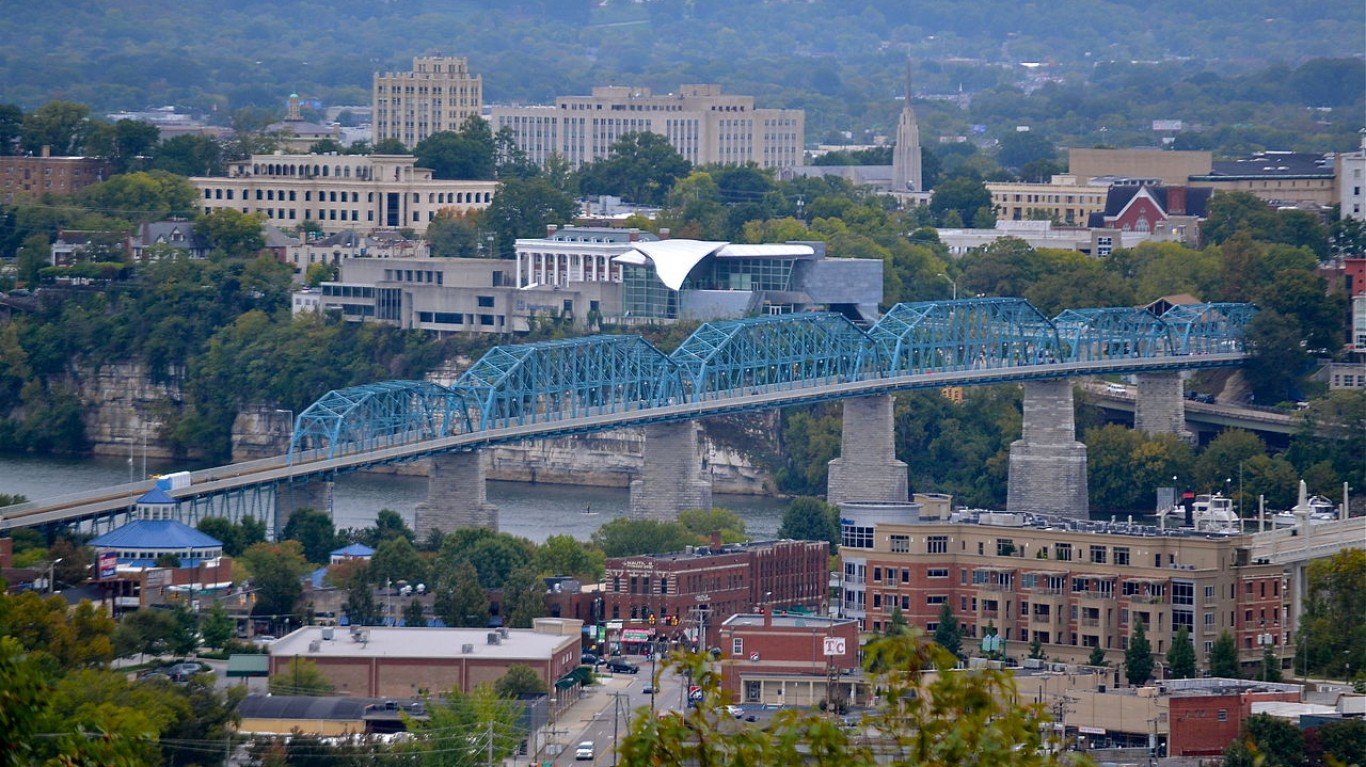
Source: Imilious / Wikimedia Commons
6. Tennessee
> Pct. unemployed receiving benefits: 13.9% (6th lowest)
> Avg. weekly UI payout: $144 (the lowest)
> 2018 unemployment rate: 3.5% (21st lowest)
> 1-yr. job growth: +2.0% (9th highest)
Tennessee pays unemployment insurance recipients an average of just $144 a week, the least of any state and less than half the average payment of $347 across all states. That payment covers just 15.2% of the average weekly working wage in the state, also the smallest share in the country and less than half the comparable 32.1% nationwide share.
Fortunately, Tennessee’s relatively strong job market reduces the number of people who need to depend on unemployment benefits. Just 3.5% of the state’s labor force are out of work, below the 3.9% national unemployment rate.
See all stories featuring: Tennessee
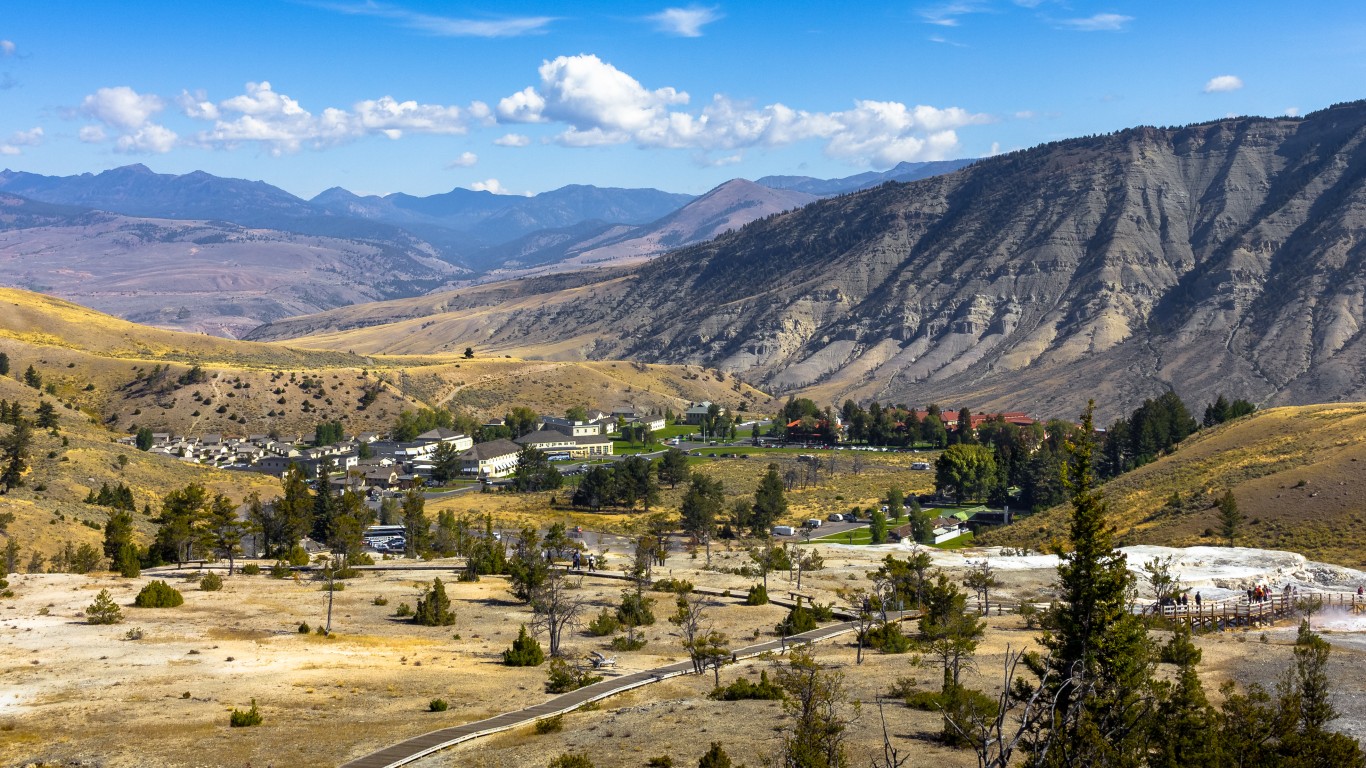
Source: collins_family / Flickr
5. Wyoming
> Pct. unemployed receiving benefits: 16.2% (12th lowest)
> Avg. weekly UI payout: $370 (13th highest)
> 2018 unemployment rate: 4.1% (15th highest)
> 1-yr. job growth: -1.0% (2nd lowest)
The average weekly unemployment insurance payout in Wyoming of $370 covers about 41% of the average weekly working wage, more than in the majority of states. However, a relatively small share of unemployed state residents are able to take advantage of the relatively large payout. Only 16.2% of unemployed Wyoming residents receive UI benefits compared to 26.3% of unemployed Americans. On top of that, finding a job in Wyoming may be more difficult than in many other states. The state’s unemployment rate is 4.1%, slightly higher than the 3.9% national unemployment rate.
See all stories featuring: Wyoming
[in-text-ad]
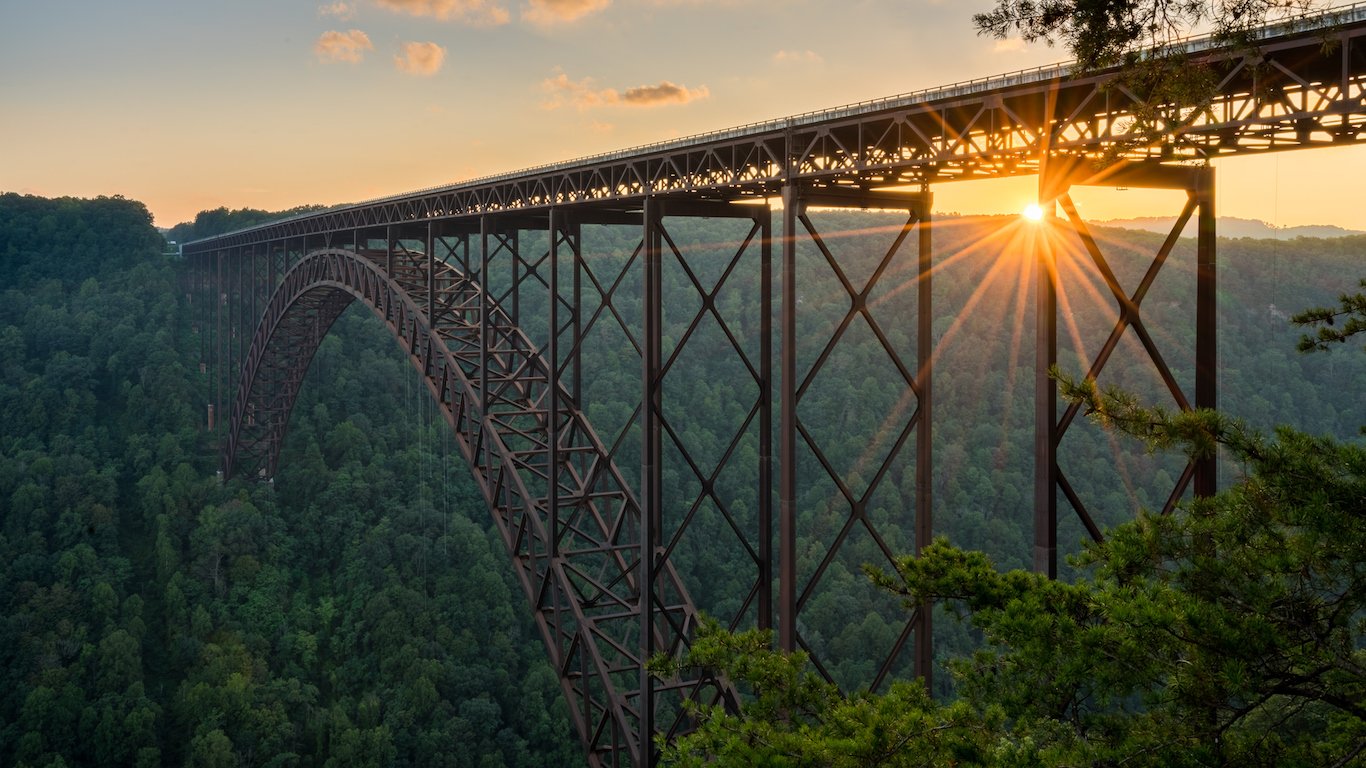
Source: BackyardProduction / iStock
4. West Virginia
> Pct. unemployed receiving benefits: 22.4% (25th highest)
> Avg. weekly UI payout: $287 (13th lowest)
> 2018 unemployment rate: 5.3% (2nd highest)
> 1-yr. job growth: +0.4% (15th lowest)
The average weekly unemployment insurance payout in West Virginia is $287, less than most states and well below the $347 national average. Joblessness is a widespread problem in West Virginia. The state’s annual unemployment rate of 5.3% is the second highest among states. Many employers may be driven away from the state as a broad range of economic conditions make West Virginia one of the worst states for business.
See all stories featuring: West Virginia
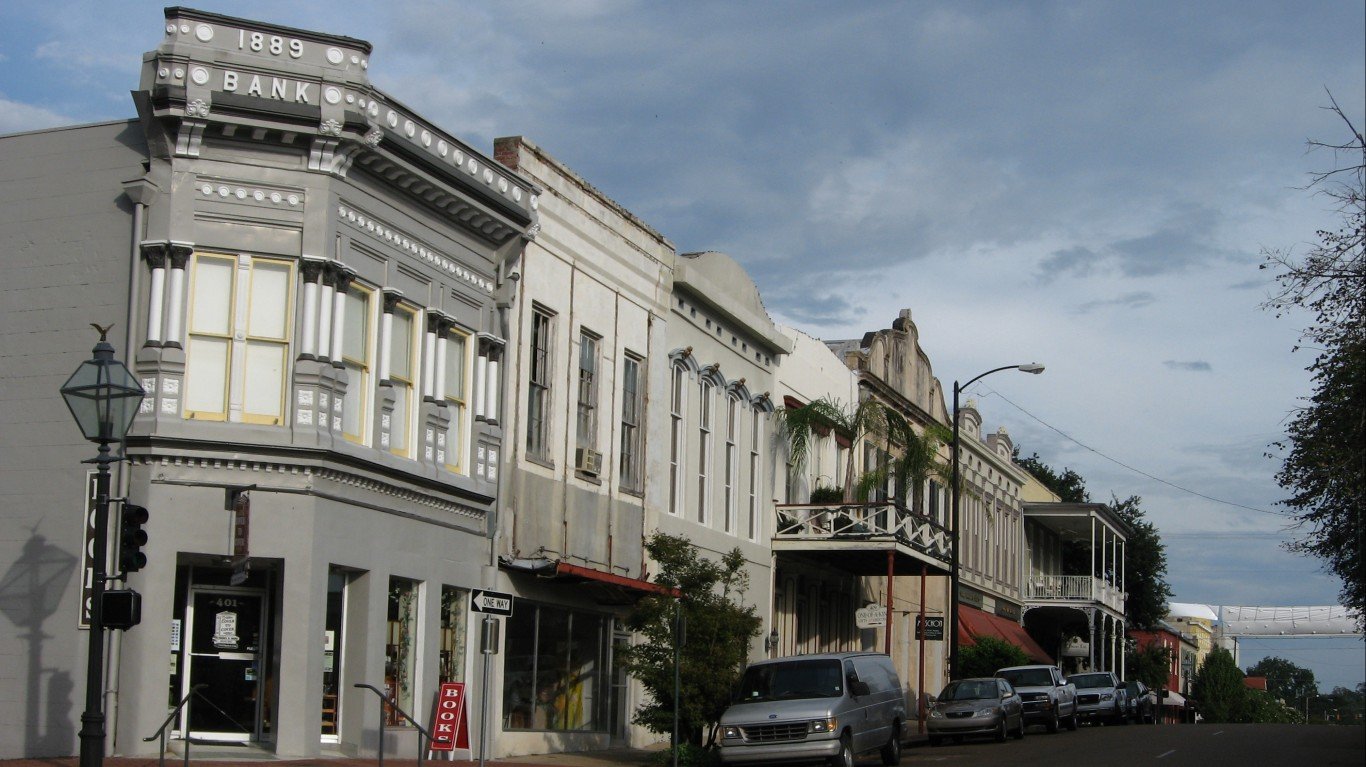
Source: kenlund / Flickr
3. Mississippi
> Pct. unemployed receiving benefits: 14.4% (7th lowest)
> Avg. weekly UI payout: $206 (2nd lowest)
> 2018 unemployment rate: 4.8% (5th highest)
> 1-yr. job growth: +0.0% (6th lowest)
Only 14.4% of unemployed Mississippi residents receive unemployment insurance benefits, a far smaller share than the 26.3% of unemployed Americans. Not only does the state’s unemployment insurance program appear to be more restrictive, but it is also less generous. The average weekly UI payout in MIssissippi is just $206, less than in every state other than Tennessee. Mississippi also has one of the highest annual unemployment rates in the country, at 4.8%, and the state is adding jobs at a slower pace than most states, with no net gain in overall employment in the last year.
See all stories featuring: Mississippi

Source: Robert John Photography / Getty Images
2. Louisiana
> Pct. unemployed receiving benefits: 12.3% (4th lowest)
> Avg. weekly UI payout: $210 (3rd lowest)
> 2018 unemployment rate: 4.9% (3rd highest)
> 1-yr. job growth: +0.2% (10th lowest)
Mississippi and Tennessee are the only states with a lower average weekly UI benefit payout than Louisiana. The typical UI benefit recipient in the state is paid just $210 a week, well below the $347 national average, and enough to cover only 23.1% of the average weekly working wage in the state.
Louisiana’s job market is also not particularly strong. Over the last year, the number of people working increased by just 0.2% in the state. Partially due to slower than average job growth and the state’s 4.9% unemployment rate, Louisiana has the worst economy of any state.
See all stories featuring: Louisiana
[in-text-ad-2]

Source: urbanglimpses / Getty Images
1. Alaska
> Pct. unemployed receiving benefits: 27.6% (15th highest)
> Avg. weekly UI payout: $261 (12th lowest)
> 2018 unemployment rate: 6.6% (the highest)
> 1-yr. job growth: -0.7% (4th lowest)
The average weekly UI benefit payout in Alaska of $261 is far lower than average and covers only about 25% of the average weekly working wage in the state. Nationwide, UI benefits cover 32.1% of average weekly wages. Alaska ranks as the worst state to be unemployed largely because it also ranks as the state where it is hardest to find full time work. Alaska reported negative employment growth in the last year, and the state’s 6.6% unemployment rate in 2018 is the highest among states. Due in part to the state’s weak job market, 44.4% of UI recipients exhaust their benefits before finding full-time work, nearly the largest share of any state and well above the 35.9% national exhaustion rate.
See all stories featuring: Alaska
Take This Retirement Quiz To Get Matched With A Financial Advisor (Sponsored)
Take the quiz below to get matched with a financial advisor today.
Each advisor has been vetted by SmartAsset and is held to a fiduciary standard to act in your best interests.
Here’s how it works:
1. Answer SmartAsset advisor match quiz
2. Review your pre-screened matches at your leisure. Check out the
advisors’ profiles.
3. Speak with advisors at no cost to you. Have an introductory call on the phone or introduction in person and choose whom to work with in the future
Take the retirement quiz right here.
Thank you for reading! Have some feedback for us?
Contact the 24/7 Wall St. editorial team.
Editors' Picks

