For the nearly 46.9 million Americans living below the poverty line, financial insecurity affects nearly every aspect of daily life — from physical and mental health to achievement in education to personal relationships. Just as poverty takes a toll on the individual, communities where a large share of the population lives in poverty can also suffer tremendously.
The U.S. poverty rate stands at 14.6%. Concentrated poverty is defined as neighborhoods with poverty rates of 40% or more, that is, 40% of the neighborhood’s population lives below the poverty line. Individuals living on poverty level income in concentrated-poverty neighborhoods face not only the personal effects of poverty, but also the broader, communal effects. These often include higher crime rates, underperforming schools, and limited economic opportunity.
To identify the cities hit hardest by concentrated poverty in every state, 24/7 Wall St. reviewed data from the U.S. Census Bureau on the share of the population living below the poverty line in concentrated-poverty neighborhoods in the nation’s 100 largest metro areas.
The cities on this list are not necessarily the poorest cities in the country. Several, including Ogden, Utah, and Dubuque, Iowa, actually have a lower poverty rate than the U.S. as a whole, but they still rank as the most economically segregated cities in their state. These are the cities with the highest poverty rates in the country. In five states, there are no metro areas with even one concentrated poverty tract. Four states — Delaware, New Hampshire, Rhode Island, and Vermont — have only one metro area, so that area is by default the one with the highest concentrated poverty rate.
Concentrated-poverty neighborhoods foster a vicious cycle of poverty among those who live there — economic and social mobility in these places tend to be limited. In most of these cities, residents of concentrated poverty neighborhoods are less than half as likely to be homeowners and have a college education and more than twice as likely to be unemployed as residents of neighborhoods with poverty rates below 40%.
Often, non-white minority residents of the cities on this list are disproportionately affected by concentrated poverty. Several cities on this list also can be found among this list of the 15 worst cities for black Americans.
Click here to see the city hit hardest by extreme poverty in every state
Click here to read our methodology

Source: SeanPavonePhoto / Getty Images
1. Alabama: Mobile
> Concentrated poverty rate: 20.6% of poor pop. (16,113 residents)
> Overall poverty rate: 19.3% (state: 18.0%)
> Neighborhoods with concentrated poverty: 18 out of 113
> Unemployment: 14.4% (poor neighborhoods) 7.2% (all other)
See all stories featuring: Alabama
[in-text-ad]

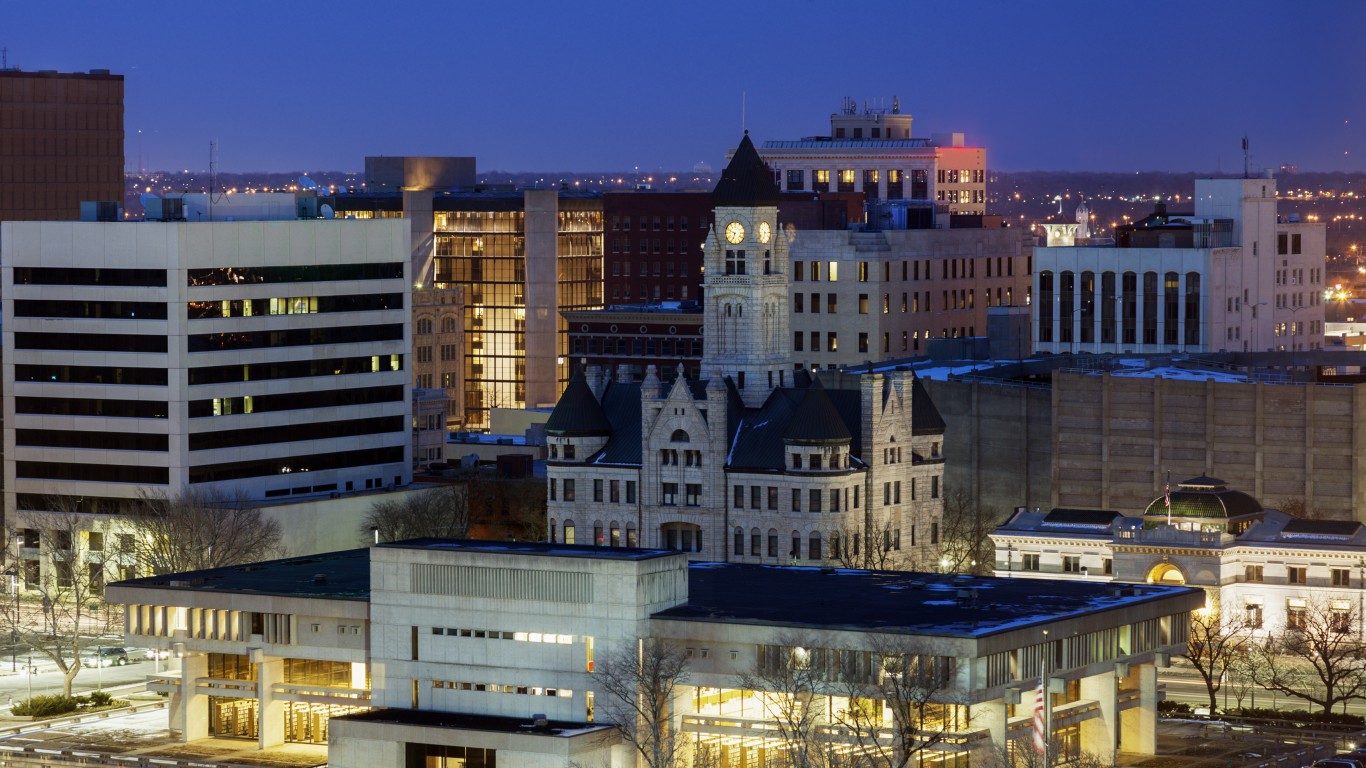
Source: urbanglimpses / Getty Images
2. Alaska: no metro area with concentrated poverty
> State poverty rate: 10.2%
See all stories featuring: Alaska
Source: Melikamp / Wikimedia Commons
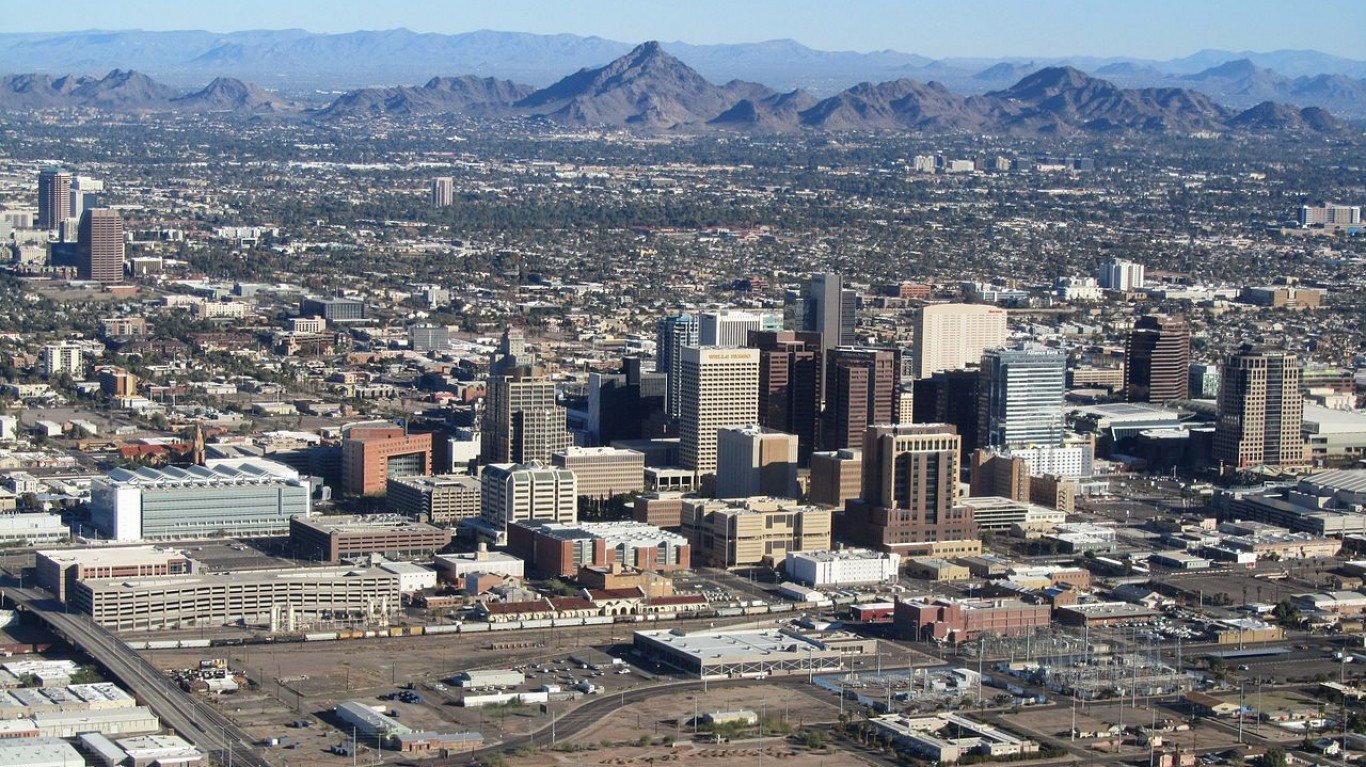
3. Arizona: Phoenix-Mesa-Scottsdale
> Concentrated poverty rate: 17.5% of poor pop. (122,909 residents)
> Overall poverty rate: 15.7% (state: 17.0%)
> Neighborhoods with concentrated poverty: 64 out of 976
> Unemployment: 10.1% (poor neighborhoods) 6.1% (all other)
See all stories featuring: Arizona

Source: danthi66 / Getty Images
4. Arkansas: Hot Springs
> Concentrated poverty rate: 13.7% of poor pop. (2,500 residents)
> Overall poverty rate: 19.1% (state: 18.1%)
> Neighborhoods with concentrated poverty: 2 out of 20
> Unemployment: 13.4% (poor neighborhoods) 8.8% (all other)
See all stories featuring: Arkansas
[in-text-ad-2]
Source: Esme7 / Getty Images
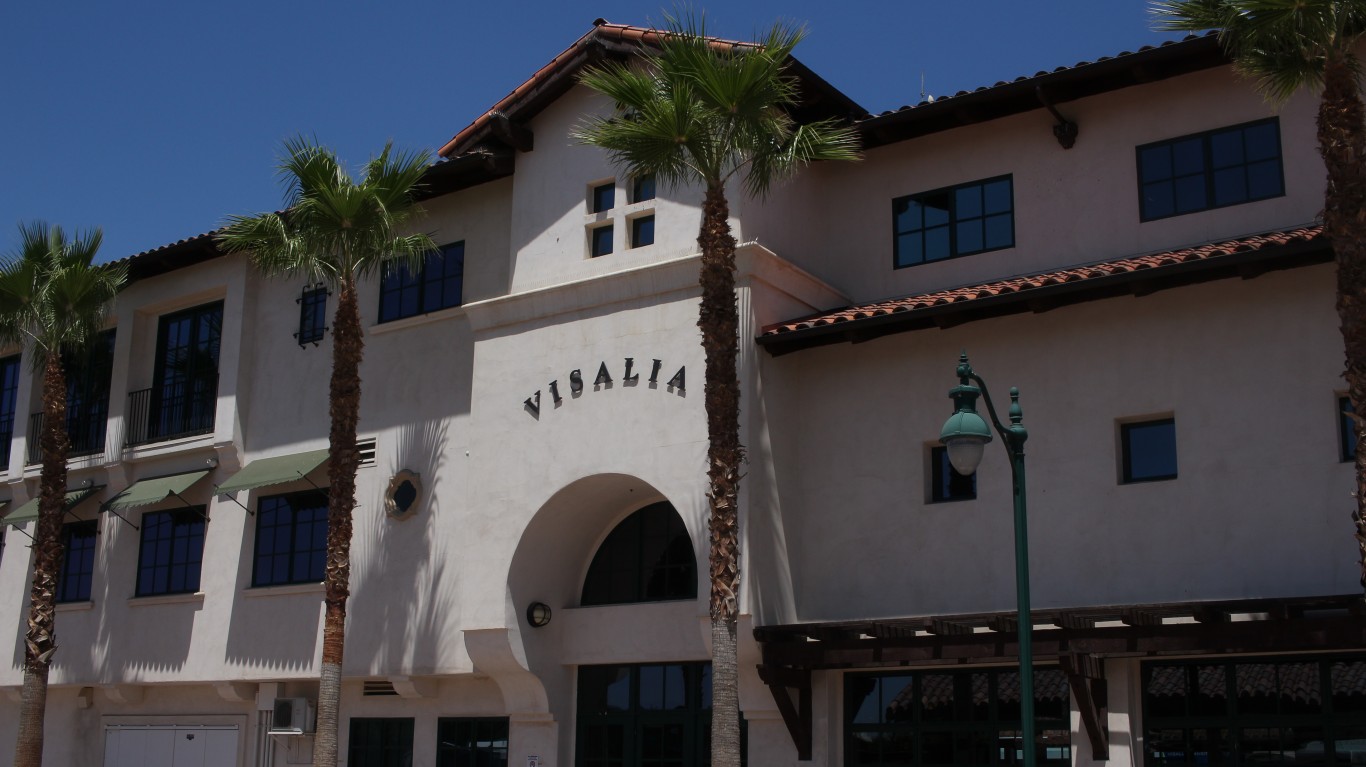
5. California: Visalia-Porterville
> Concentrated poverty rate: 31.1% of poor pop. (38,221 residents)
> Overall poverty rate: 27.1% (state: 15.1%)
> Neighborhoods with concentrated poverty: 15 out of 78
> Unemployment: 14.9% (poor neighborhoods) 9.1% (all other)
See all stories featuring: California

Source: chapin31 / Getty Images
6. Colorado: Pueblo
> Concentrated poverty rate: 14.8% of poor pop. (4,662 residents)
> Overall poverty rate: 19.8% (state: 11.5%)
> Neighborhoods with concentrated poverty: 4 out of 53
> Unemployment: 12.2% (poor neighborhoods) 9.0% (all other)
See all stories featuring: Colorado
[in-text-ad]

Source: DenisTangneyJr / Getty Images
7. Connecticut: New Haven-Milford
> Concentrated poverty rate: 14.4% of poor pop. (14,490 residents)
> Overall poverty rate: 12.1% (state: 10.1%)
> Neighborhoods with concentrated poverty: 11 out of 186
> Unemployment: 17.2% (poor neighborhoods) 7.6% (all other)
See all stories featuring: Connecticut
 24/7 Wall St.
Source: dougtone / Flickr
8. Delaware: no metro area with concentrated poverty
> State poverty rate: 12.1%
See all stories featuring: Delaware
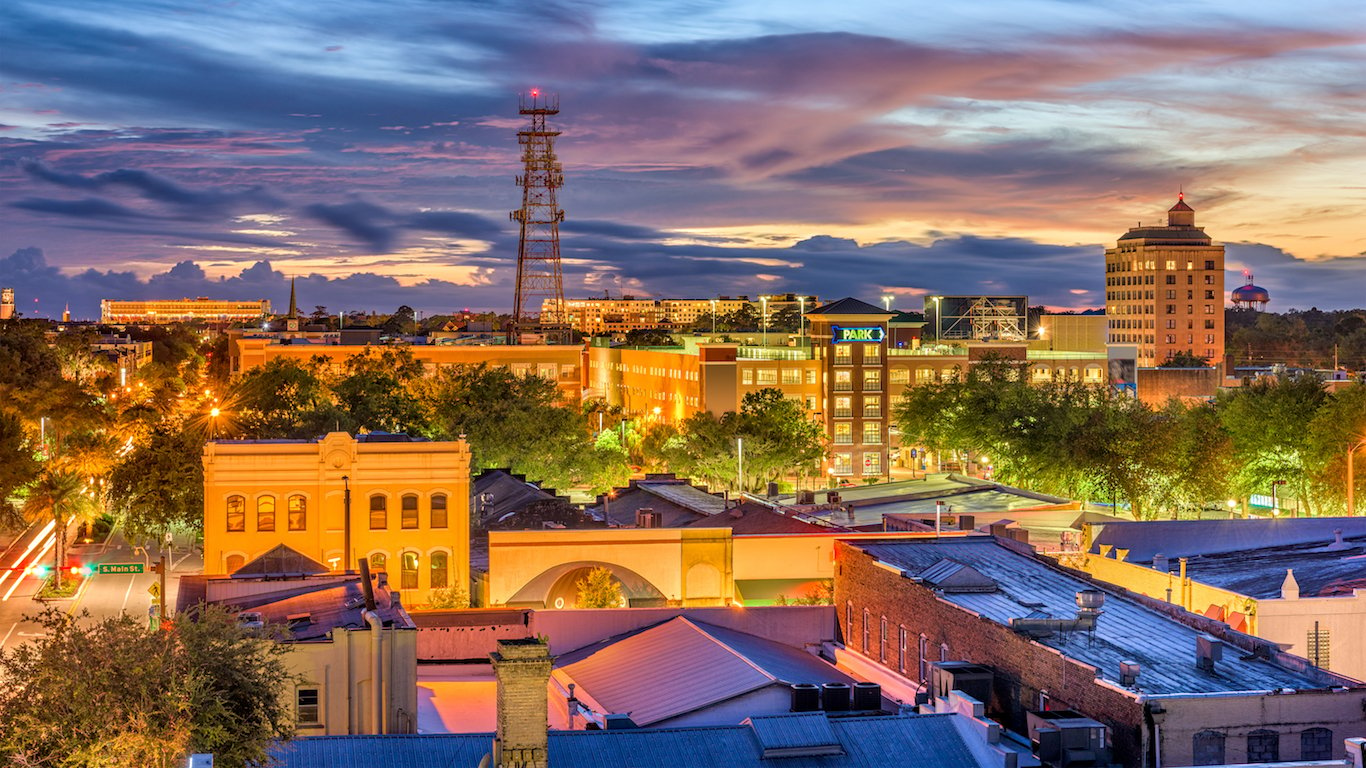
Source: Sean Pavone / Shutterstock.com
9. Florida: Gainesville
> Concentrated poverty rate: 21.6% of poor pop. (13,016 residents)
> Overall poverty rate: 23.1% (state: 15.5%)
> Neighborhoods with concentrated poverty: 8 out of 53
> Unemployment: 6.1% (poor neighborhoods) 6.5% (all other)
See all stories featuring: Florida
[in-text-ad-2]
Source: highlander411 / Flickr
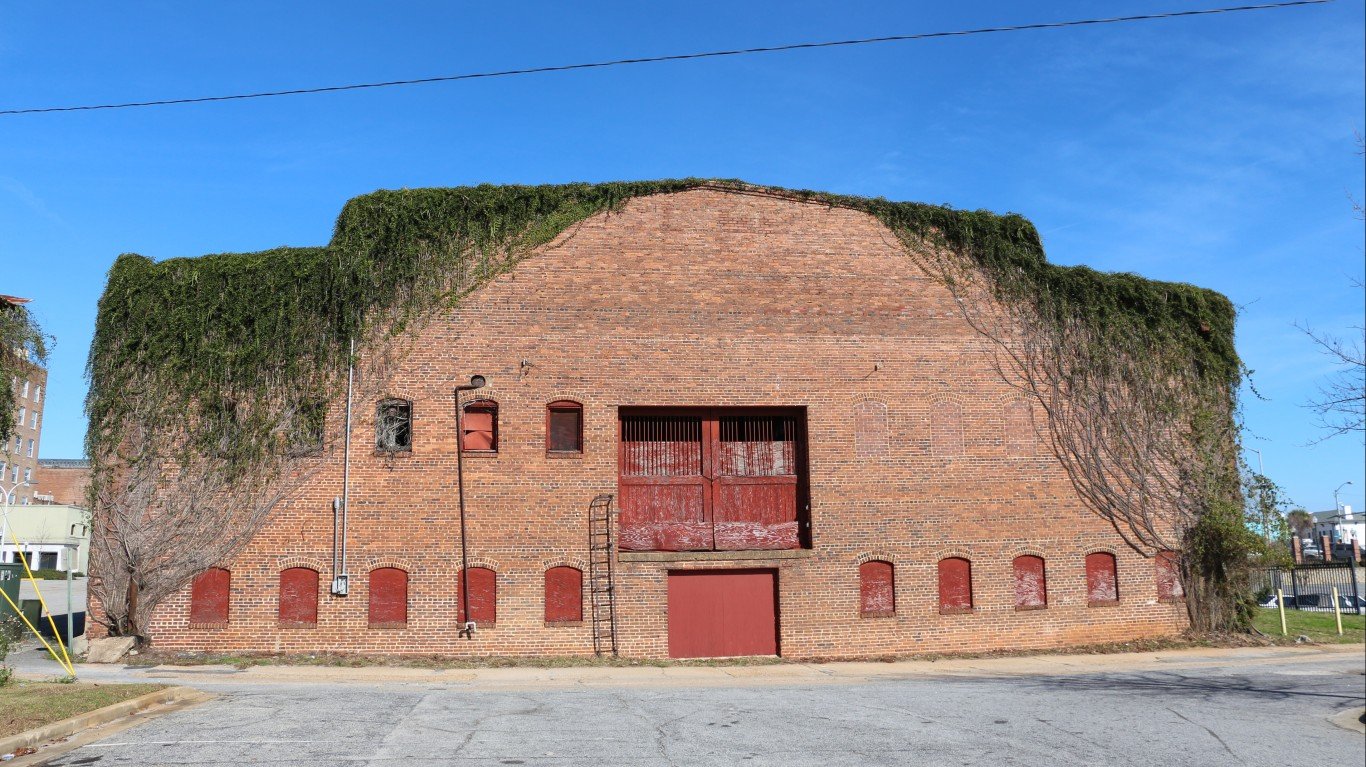
10. Georgia: Albany
> Concentrated poverty rate: 43.6% of poor pop. (16,646 residents)
> Overall poverty rate: 25.7% (state: 16.9%)
> Neighborhoods with concentrated poverty: 10 out of 43
> Unemployment: 25.0% (poor neighborhoods) 9.5% (all other)
See all stories featuring: Georgia
Source: Art Wager / Getty Images
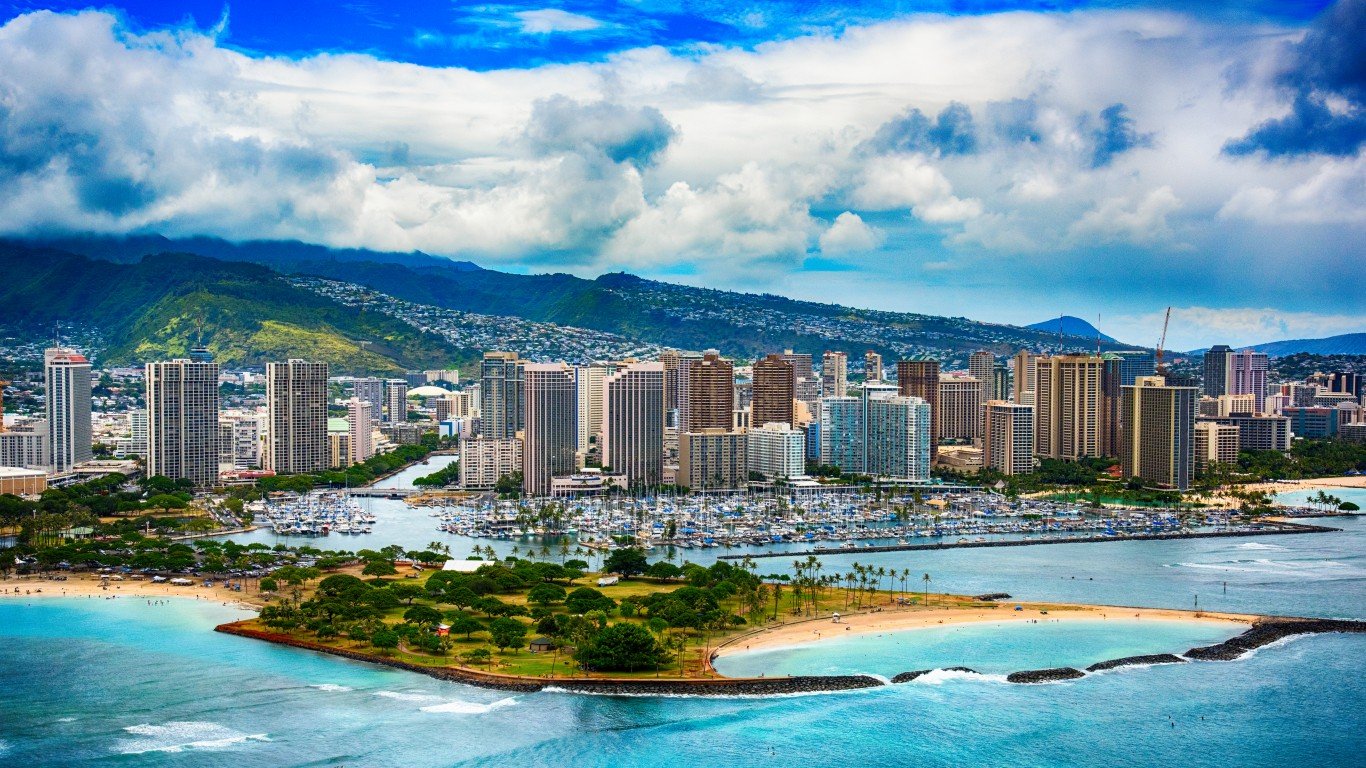
11. Hawaii: Urban Honolulu
> Concentrated poverty rate: 2.1% of poor pop. (1,860 residents)
> Overall poverty rate: 9.1% (state: 10.3%)
> Neighborhoods with concentrated poverty: 3 out of 228
> Unemployment: 12.6% (poor neighborhoods) 4.7% (all other)
See all stories featuring: Hawaii
[in-text-ad]
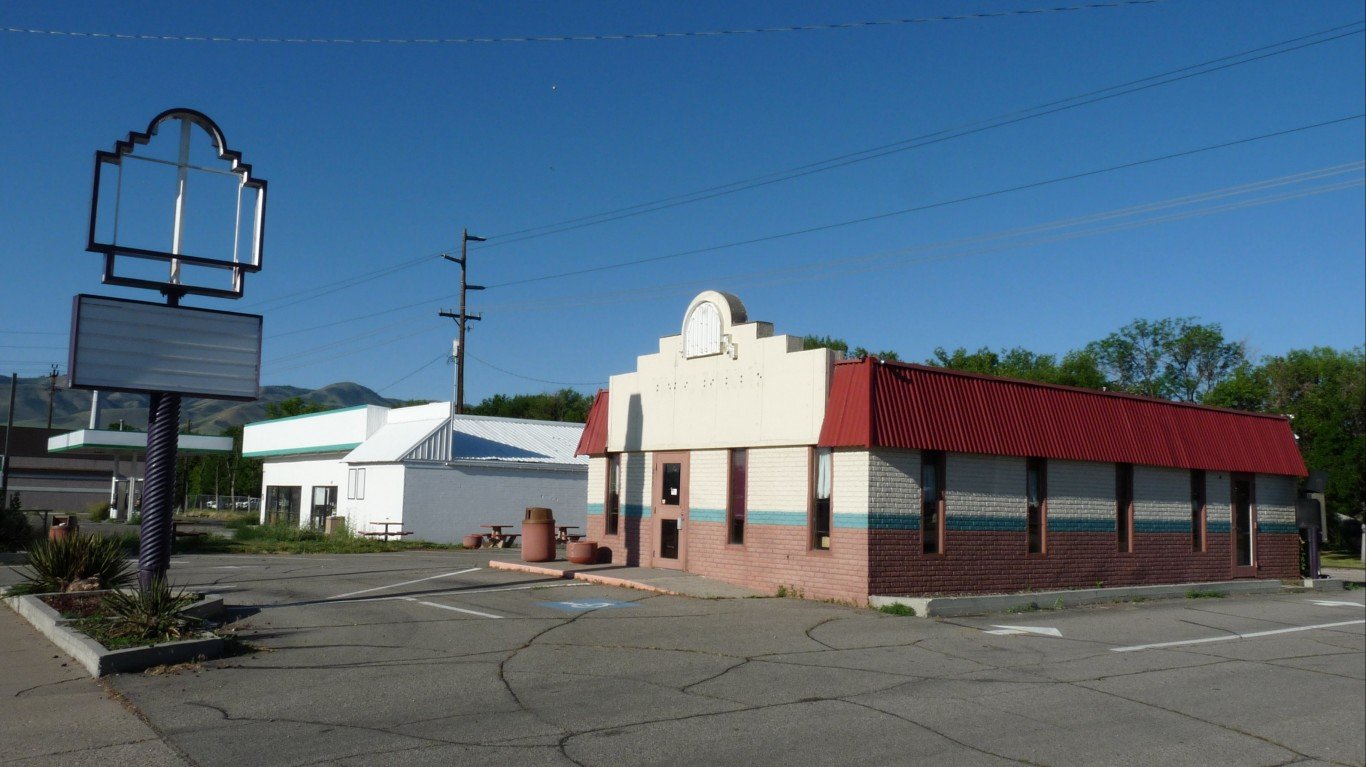
Source: Ethan Prater from San Bruno, CA, USA / Wikimedia Commons
12. Idaho: Pocatello
> Concentrated poverty rate: 8.9% of poor pop. (1,292 residents)
> Overall poverty rate: 17.6% (state: 14.5%)
> Neighborhoods with concentrated poverty: 1 out of 21
> Unemployment: 5.3% (poor neighborhoods) 6.4% (all other)
See all stories featuring: Idaho
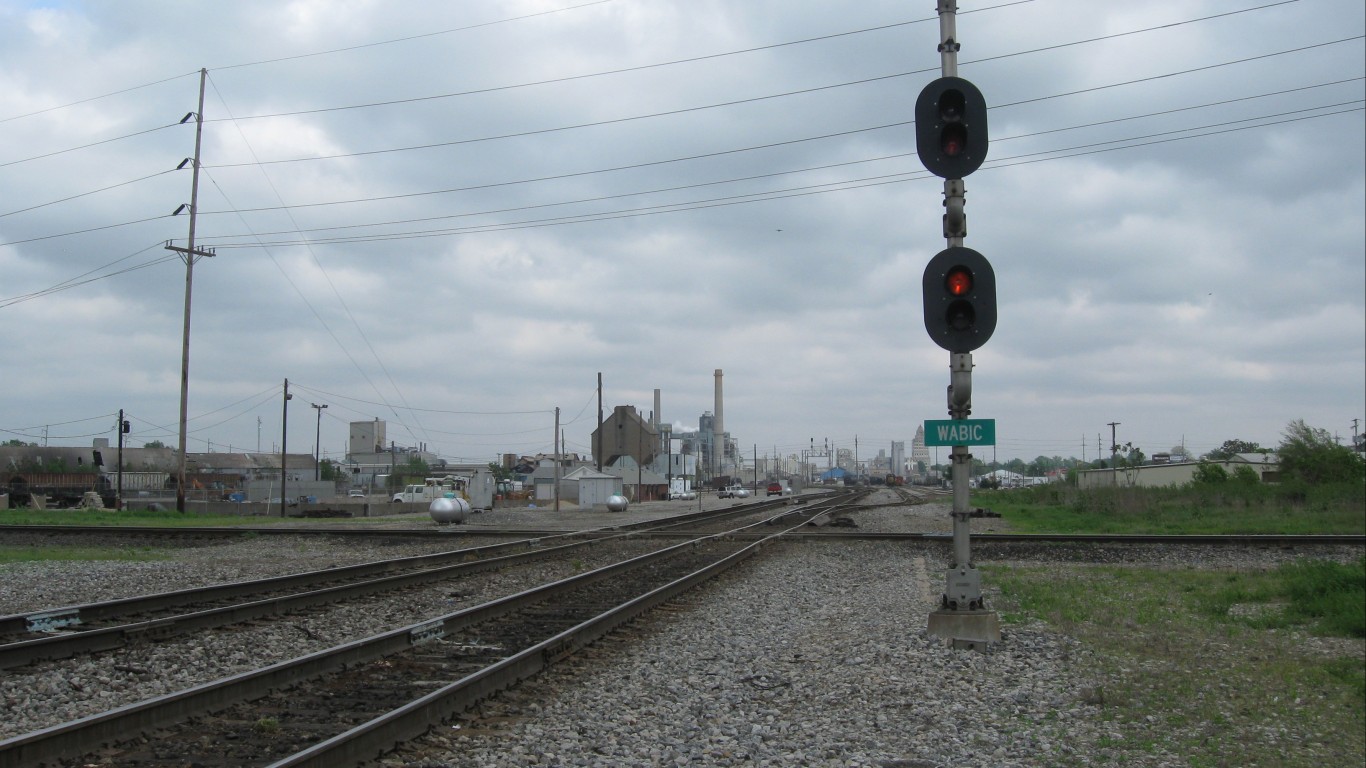
Source: gooseotter / Flickr
13. Illinois: Decatur
> Concentrated poverty rate: 32.1% of poor pop. (5,541 residents)
> Overall poverty rate: 16.6% (state: 13.5%)
> Neighborhoods with concentrated poverty: 6 out of 34
> Unemployment: 19.8% (poor neighborhoods) 8.2% (all other)
See all stories featuring: Illinois
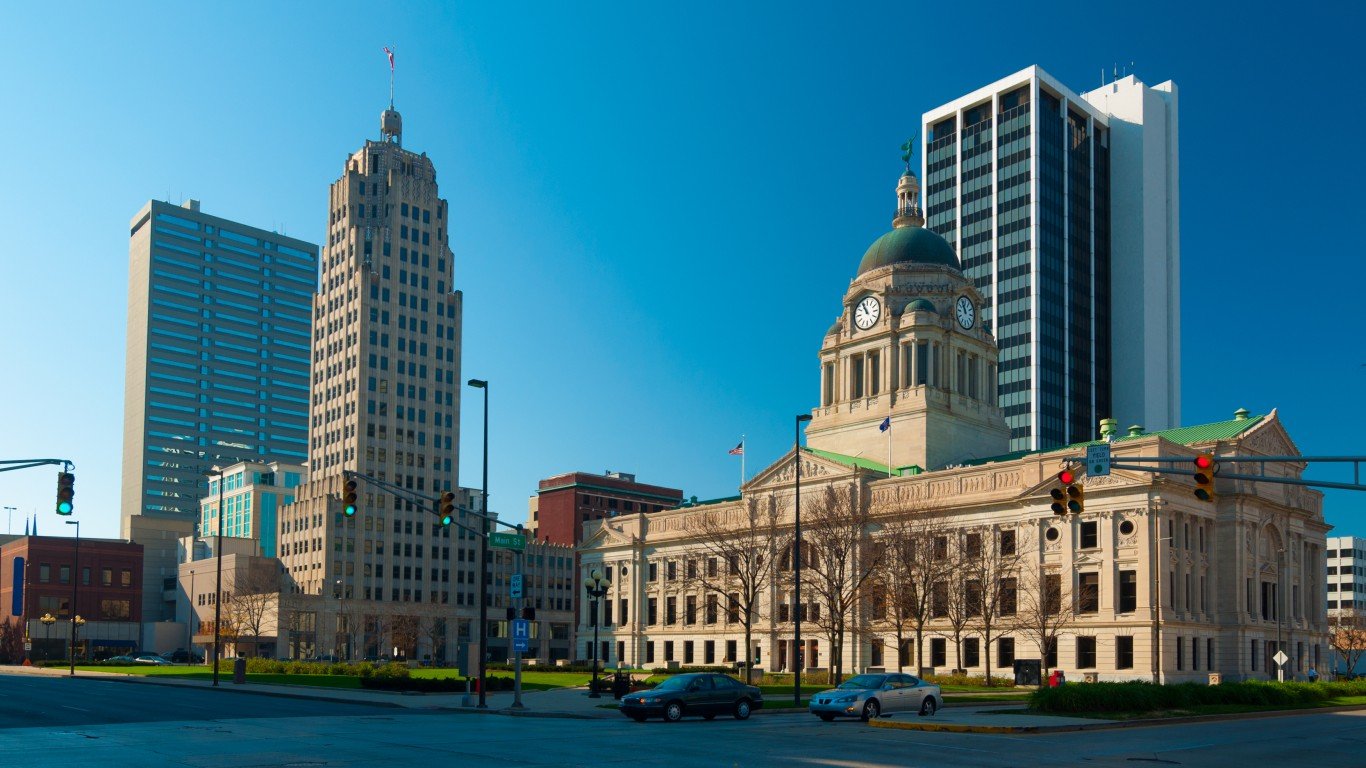
Source: Davel5957 / Getty Images
14. Indiana: Fort Wayne
> Concentrated poverty rate: 23.5% of poor pop. (13,944 residents)
> Overall poverty rate: 14.1% (state: 14.6%)
> Neighborhoods with concentrated poverty: 11 out of 108
> Unemployment: 13.1% (poor neighborhoods) 5.5% (all other)
See all stories featuring: Indiana
[in-text-ad-2]
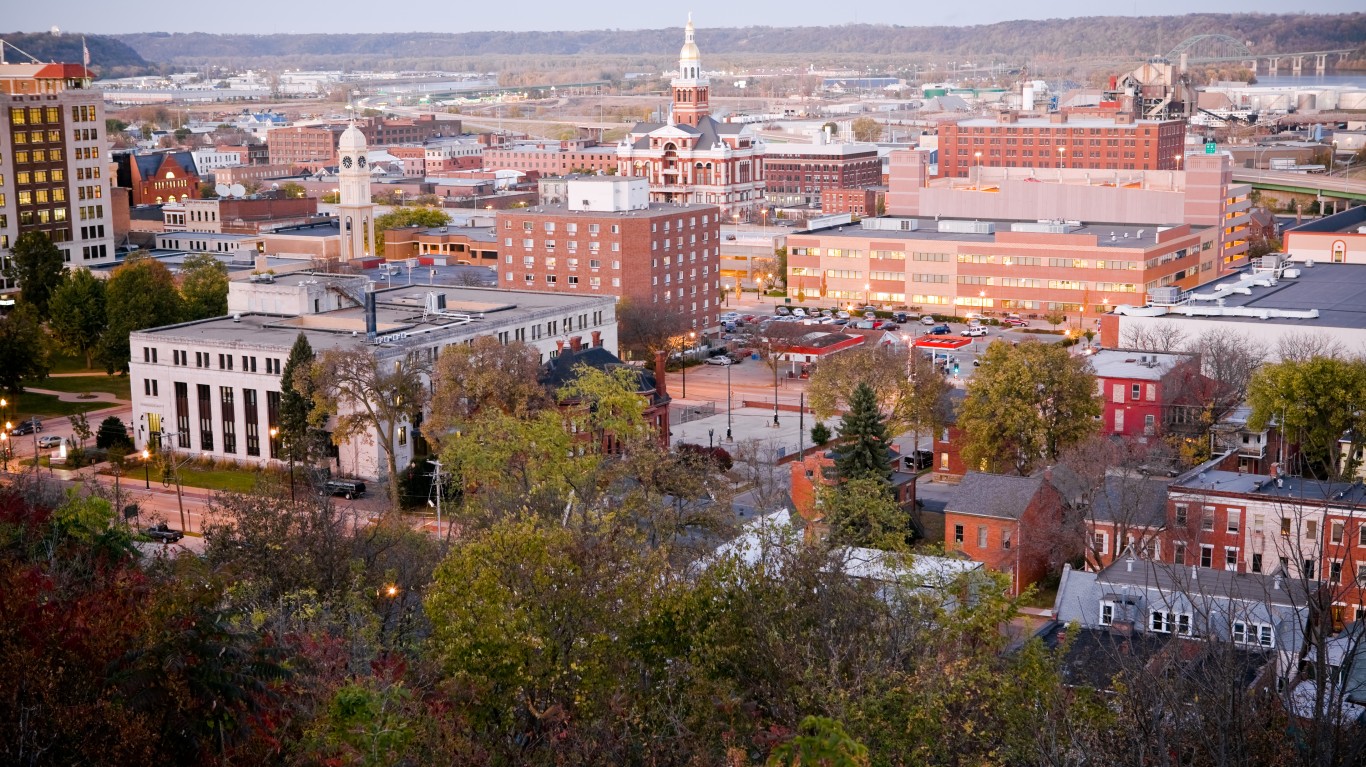
Source: cosmonaut / Getty Images
15. Iowa: Dubuque
> Concentrated poverty rate: 10.0% of poor pop. (1,109 residents)
> Overall poverty rate: 11.9% (state: 12.0%)
> Neighborhoods with concentrated poverty: 1 out of 26
> Unemployment: 4.0% (poor neighborhoods) 3.9% (all other)
See all stories featuring: Iowa
Source: benkrut / Getty Images
16. Kansas: Wichita
> Concentrated poverty rate: 9.7% of poor pop. (8,500 residents)
> Overall poverty rate: 13.9% (state: 12.8%)
> Neighborhoods with concentrated poverty: 7 out of 152
> Unemployment: 15.9% (poor neighborhoods) 5.1% (all other)
See all stories featuring: Kansas
[in-text-ad]
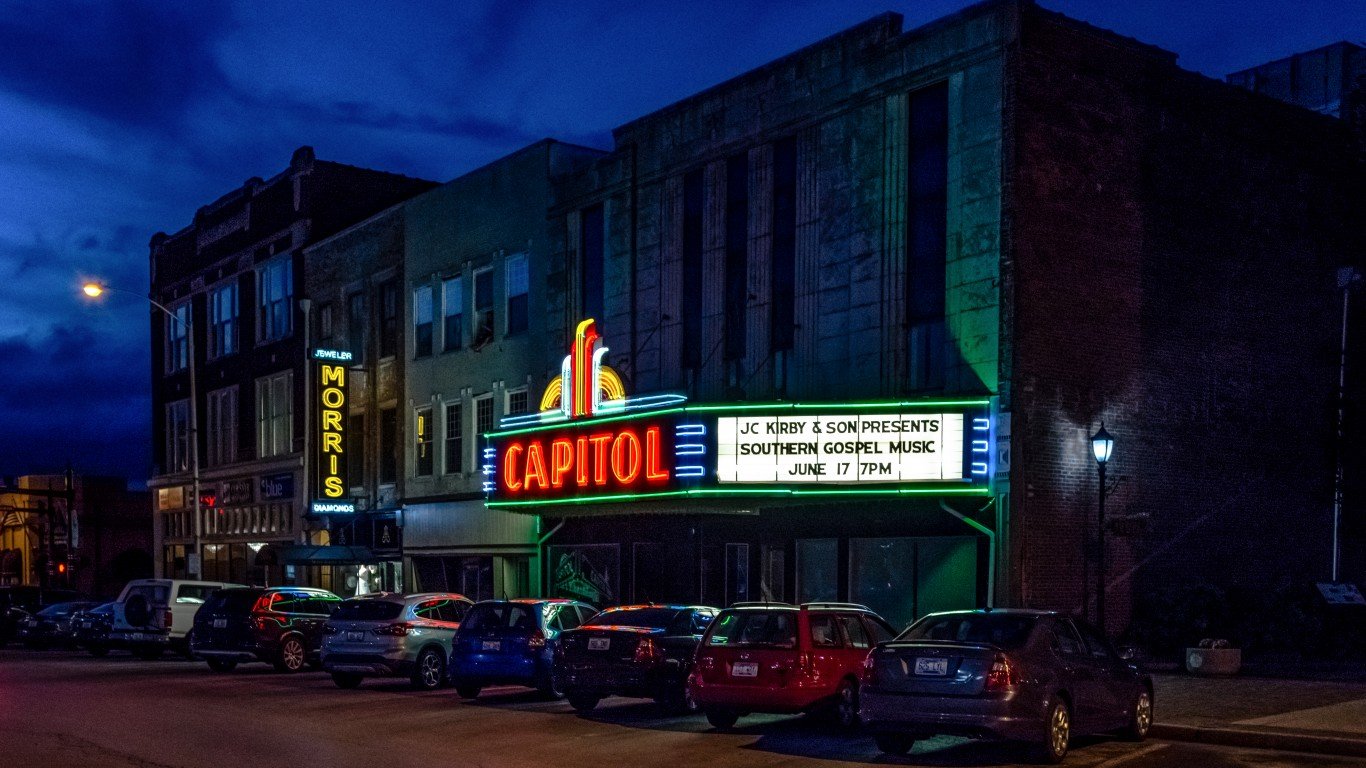
Source: Jacqueline Nix / Getty Images
17. Kentucky: Bowling Green
> Concentrated poverty rate: 23.8% of poor pop. (7,176 residents)
> Overall poverty rate: 18.7% (state: 18.3%)
> Neighborhoods with concentrated poverty: 5 out of 37
> Unemployment: 6.7% (poor neighborhoods) 5.6% (all other)
See all stories featuring: Kentucky
 24/7 Wall St.
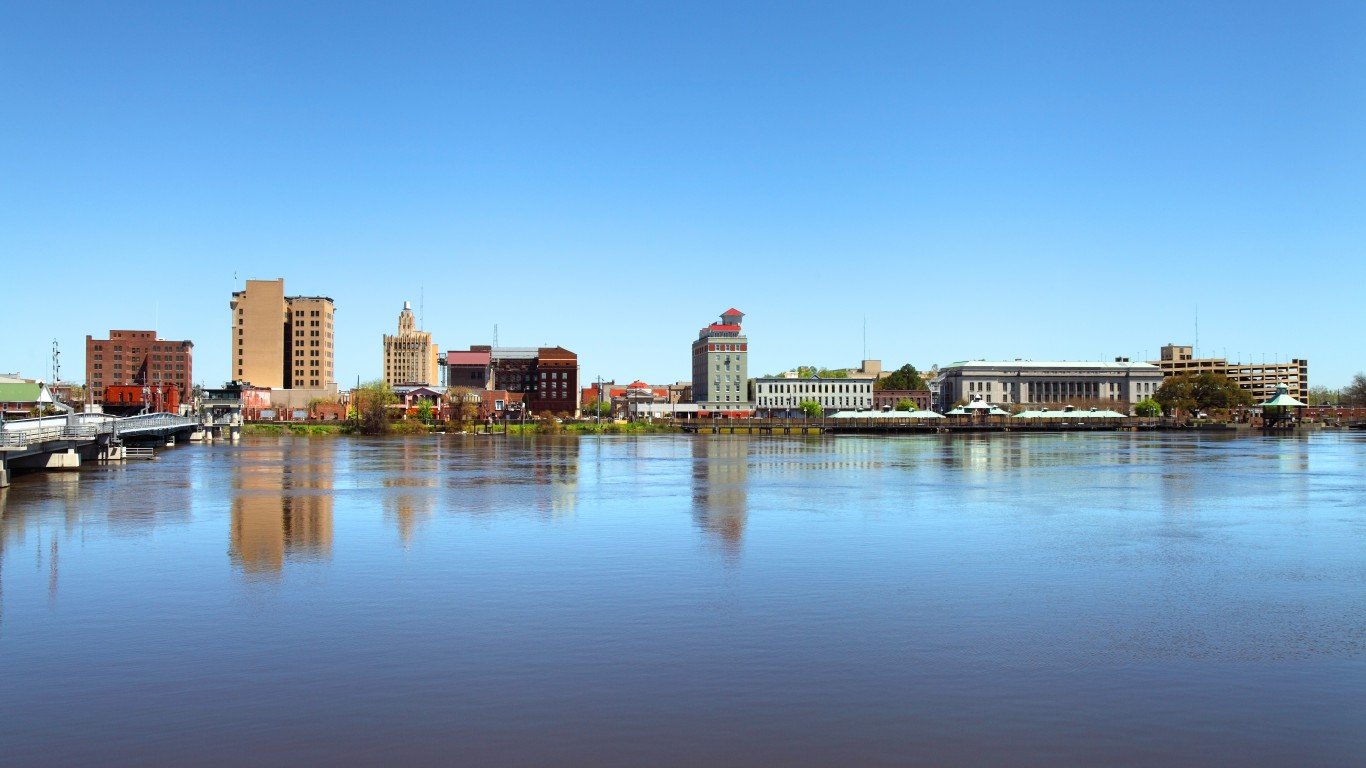
Source: DenisTangneyJr / Getty Images
18. Louisiana: Monroe
> Concentrated poverty rate: 35.4% of poor pop. (14,598 residents)
> Overall poverty rate: 24.2% (state: 19.6%)
> Neighborhoods with concentrated poverty: 11 out of 44
> Unemployment: 15.5% (poor neighborhoods) 5.5% (all other)
See all stories featuring: Louisiana
Source: apelletr / Getty Images
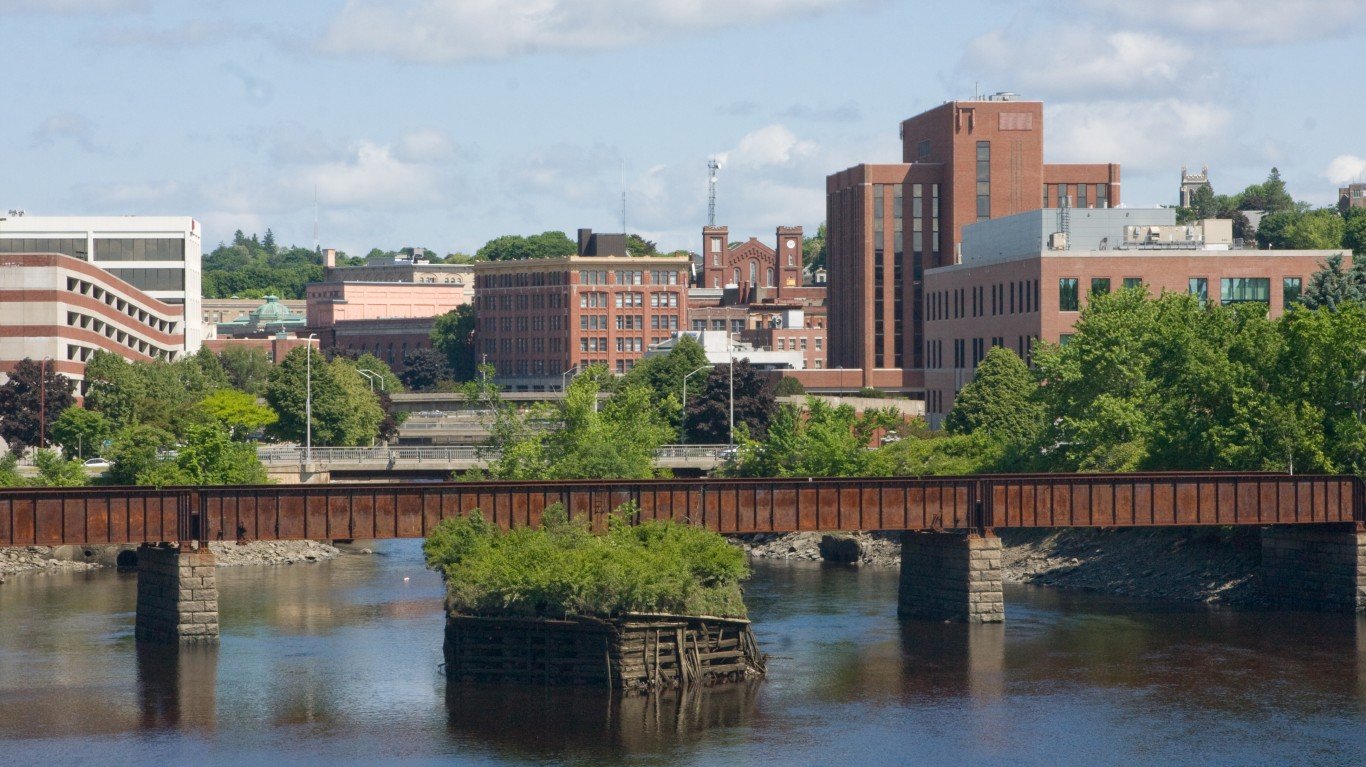
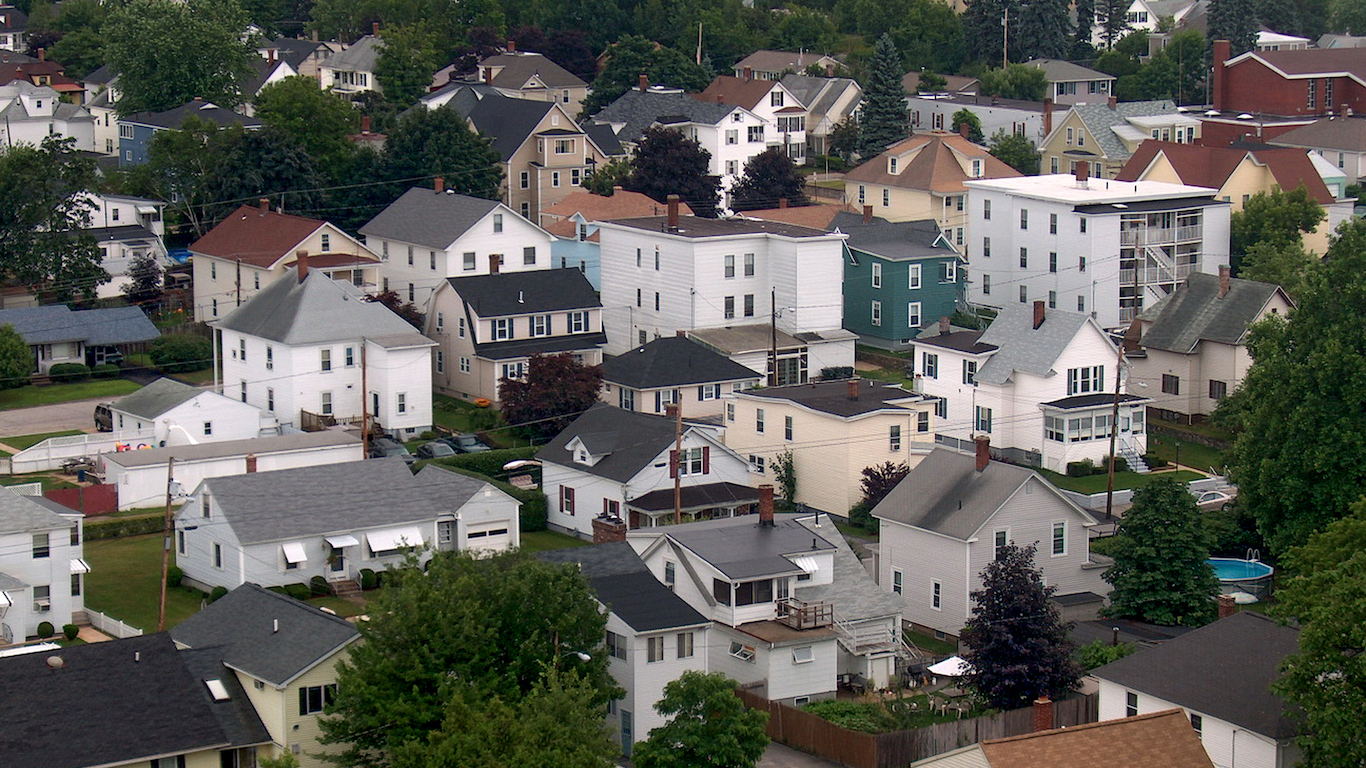
19. Maine: Bangor
> Concentrated poverty rate: 19.0% of poor pop. (4,393 residents)
> Overall poverty rate: 15.9% (state: 12.9%)
> Neighborhoods with concentrated poverty: 2 out of 45
> Unemployment: 11.6% (poor neighborhoods) 6.1% (all other)
See all stories featuring: Maine
[in-text-ad-2]

Source: SeanPavonePhoto / Getty Images
20. Maryland: Baltimore-Columbia-Towson
> Concentrated poverty rate: 8.8% of poor pop. (25,232 residents)
> Overall poverty rate: 10.5% (state: 9.7%)
> Neighborhoods with concentrated poverty: 26 out of 668
> Unemployment: 13.3% (poor neighborhoods) 6.1% (all other)
See all stories featuring: Maryland

Source: DenisTangneyJr / Getty Images
21. Massachusetts: Springfield
> Concentrated poverty rate: 26.1% of poor pop. (25,438 residents)
> Overall poverty rate: 16.4% (state: 11.1%)
> Neighborhoods with concentrated poverty: 15 out of 133
> Unemployment: 18.0% (poor neighborhoods) 6.8% (all other)
See all stories featuring: Massachusetts
[in-text-ad]
Source: DenisTangneyJr / Getty Images
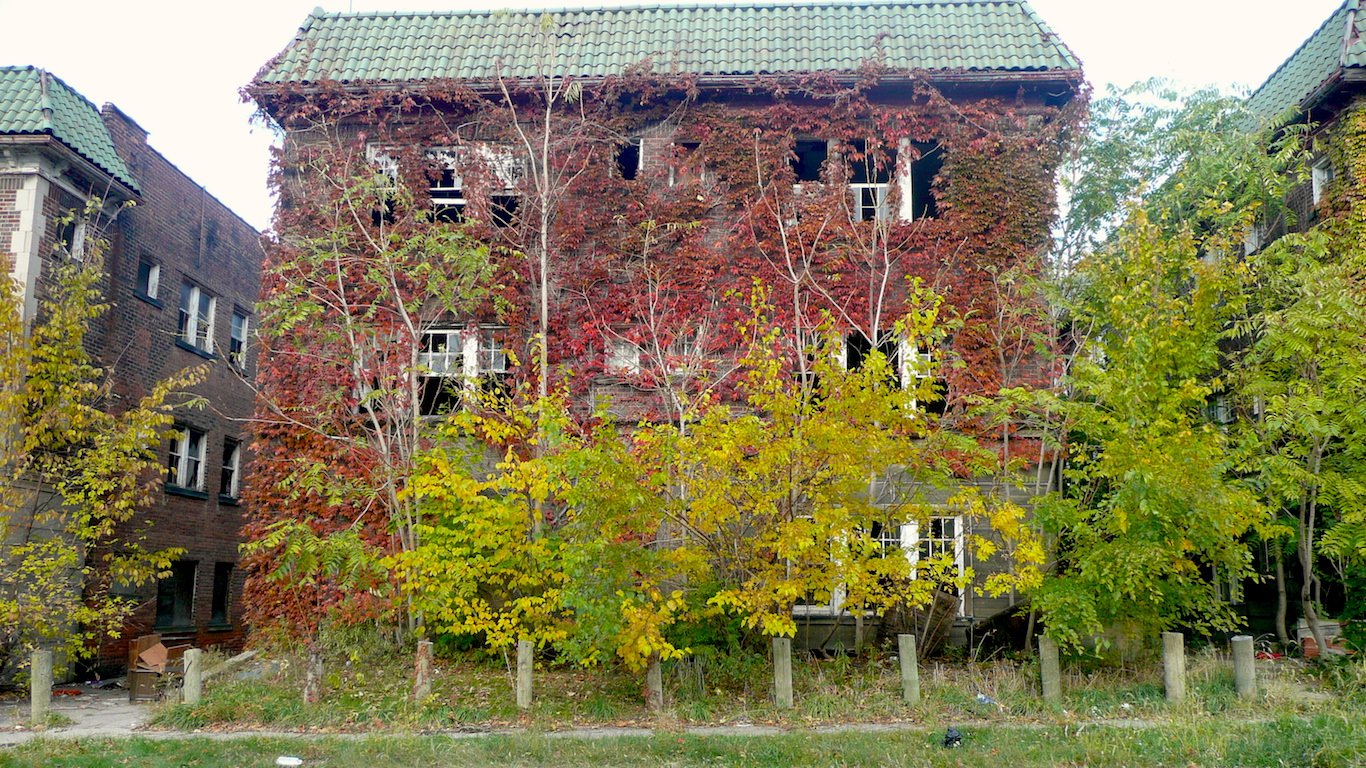
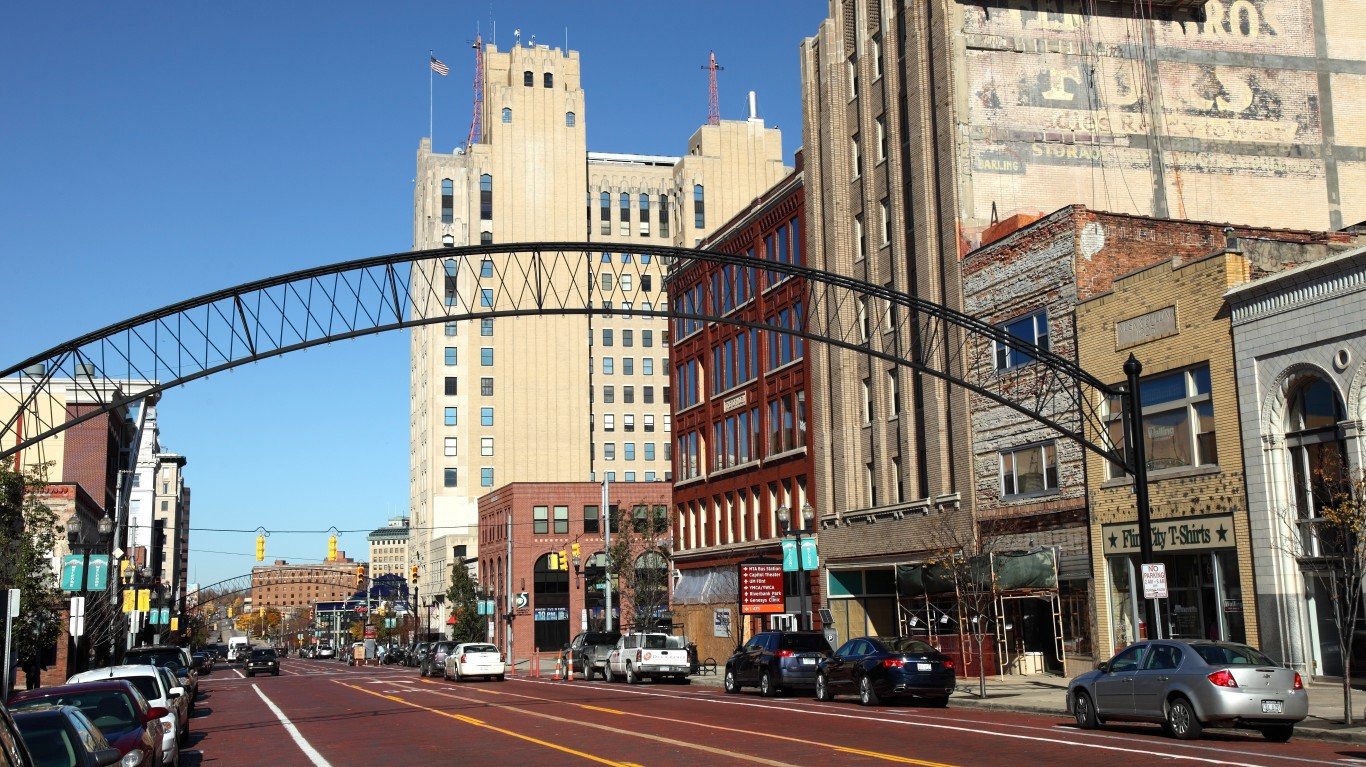
22. Michigan: Flint
> Concentrated poverty rate: 38.1% of poor pop. (30,998 residents)
> Overall poverty rate: 20.0% (state: 15.6%)
> Neighborhoods with concentrated poverty: 26 out of 129
> Unemployment: 23.2% (poor neighborhoods) 9.1% (all other)
See all stories featuring: Michigan
Source: Bobak Ha'Eri / Wikimedia Commons
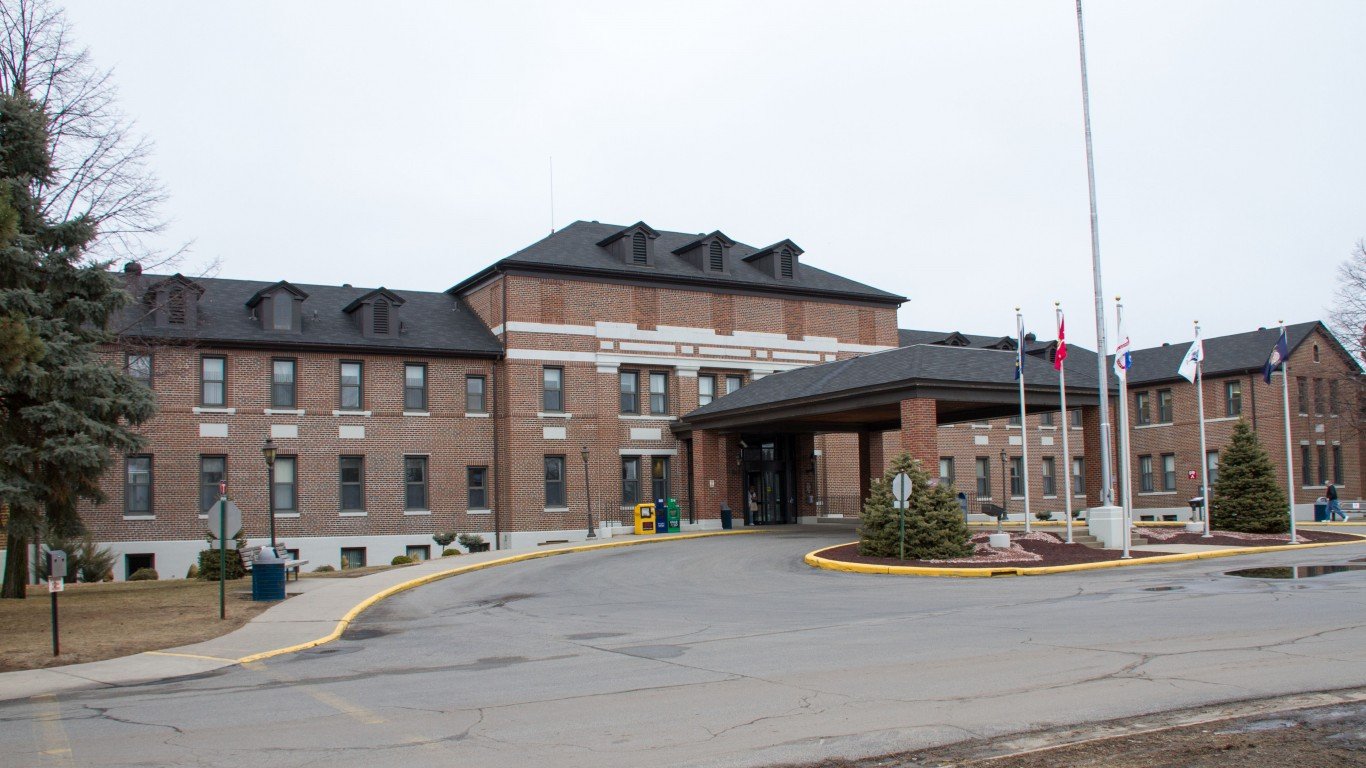
23. Minnesota: St. Cloud
> Concentrated poverty rate: 20.1% of poor pop. (4,968 residents)
> Overall poverty rate: 13.3% (state: 10.5%)
> Neighborhoods with concentrated poverty: 1 out of 37
> Unemployment: 7.2% (poor neighborhoods) 4.1% (all other)
See all stories featuring: Minnesota

Source: SeanPavonePhoto / Getty Images
24. Mississippi: Jackson
> Concentrated poverty rate: 26.2% of poor pop. (26,951 residents)
> Overall poverty rate: 18.5% (state: 21.5%)
> Neighborhoods with concentrated poverty: 21 out of 127
> Unemployment: 16.7% (poor neighborhoods) 7.0% (all other)
See all stories featuring: Mississippi
[in-text-ad-2]
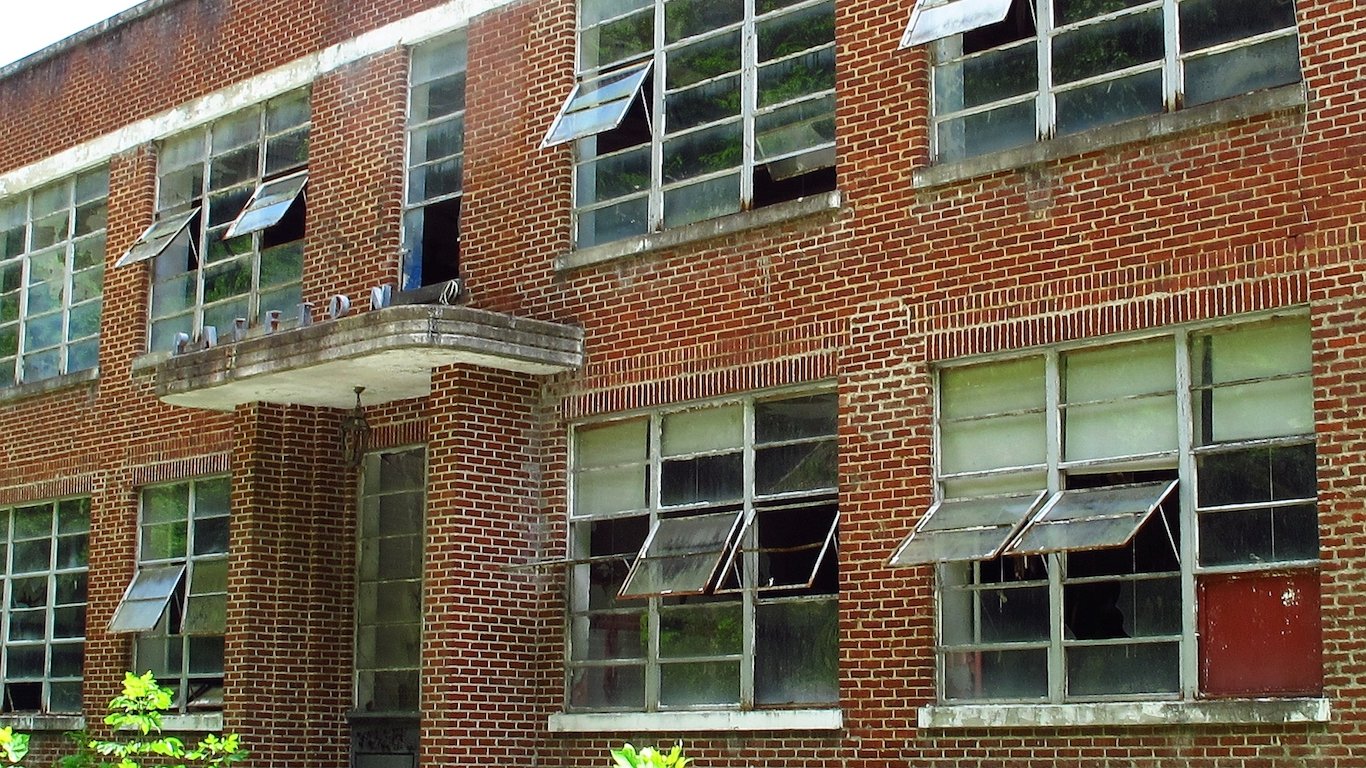
Source: fozzyb / Getty Images
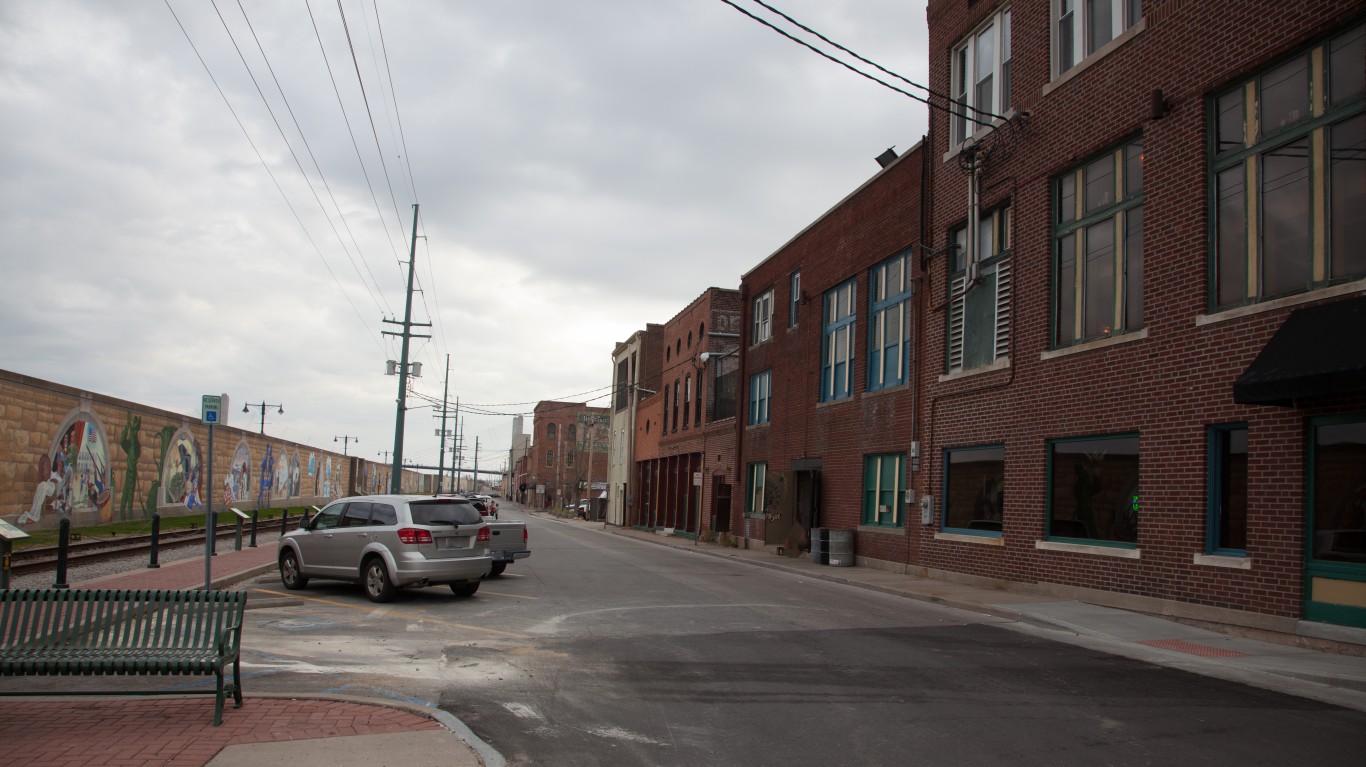
25. Missouri: Cape Girardeau
> Concentrated poverty rate: 30.4% of poor pop. (5,442 residents)
> Overall poverty rate: 19.1% (state: 14.6%)
> Neighborhoods with concentrated poverty: 5 out of 22
> Unemployment: 12.2% (poor neighborhoods) 4.5% (all other)
See all stories featuring: Missouri

Source: shanecotee / Getty Images
26. Montana: Great Falls
> Concentrated poverty rate: 11.2% of poor pop. (1,164 residents)
> Overall poverty rate: 13.1% (state: 14.4%)
> Neighborhoods with concentrated poverty: 1 out of 22
> Unemployment: 5.0% (poor neighborhoods) 4.6% (all other)
See all stories featuring: Montana
[in-text-ad]
Source: texasbackroads / Flickr
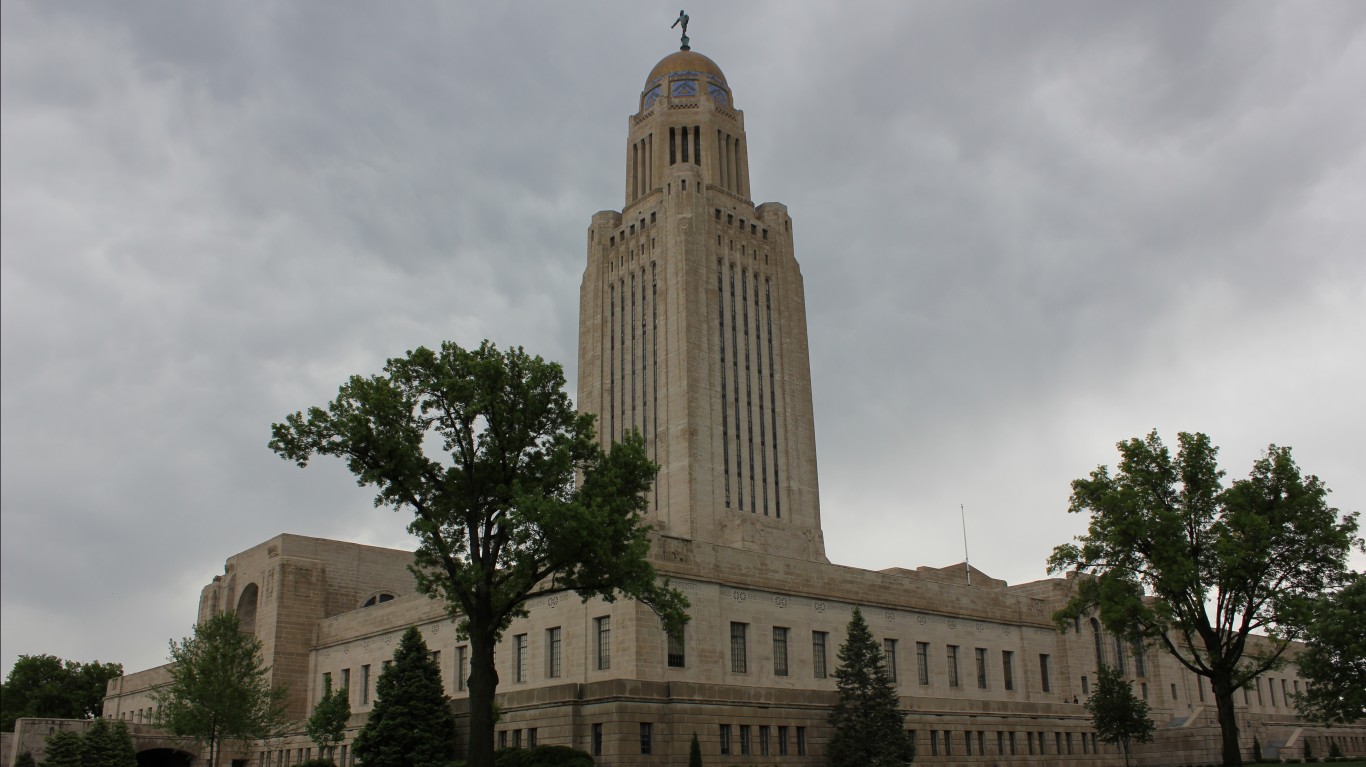
27. Nebraska: Lincoln
> Concentrated poverty rate: 15.8% of poor pop. (6,671 residents)
> Overall poverty rate: 13.7% (state: 12.0%)
> Neighborhoods with concentrated poverty: 6 out of 73
> Unemployment: 7.4% (poor neighborhoods) 3.2% (all other)
See all stories featuring: Nebraska

Source: f11photo / Getty Images
28. Nevada: Las Vegas-Henderson-Paradise
> Concentrated poverty rate: 6.5% of poor pop. (19,802 residents)
> Overall poverty rate: 14.6% (state: 14.2%)
> Neighborhoods with concentrated poverty: 13 out of 487
> Unemployment: 15.7% (poor neighborhoods) 8.3% (all other)
See all stories featuring: Nevada
Source: stockphoto52 / iStock
29. New Hampshire: no metro area with concentrated poverty
> State poverty rate: 8.1%
See all stories featuring: New Hampshire
[in-text-ad-2]

Source: DenisTangneyJr / Getty Images
30. New Jersey: Atlantic City-Hammonton
> Concentrated poverty rate: 23.9% of poor pop. (9,739 residents)
> Overall poverty rate: 15.3% (state: 10.7%)
> Neighborhoods with concentrated poverty: 9 out of 68
> Unemployment: 17.4% (poor neighborhoods) 10.4% (all other)
See all stories featuring: New Jersey
Source: renal / Getty Images
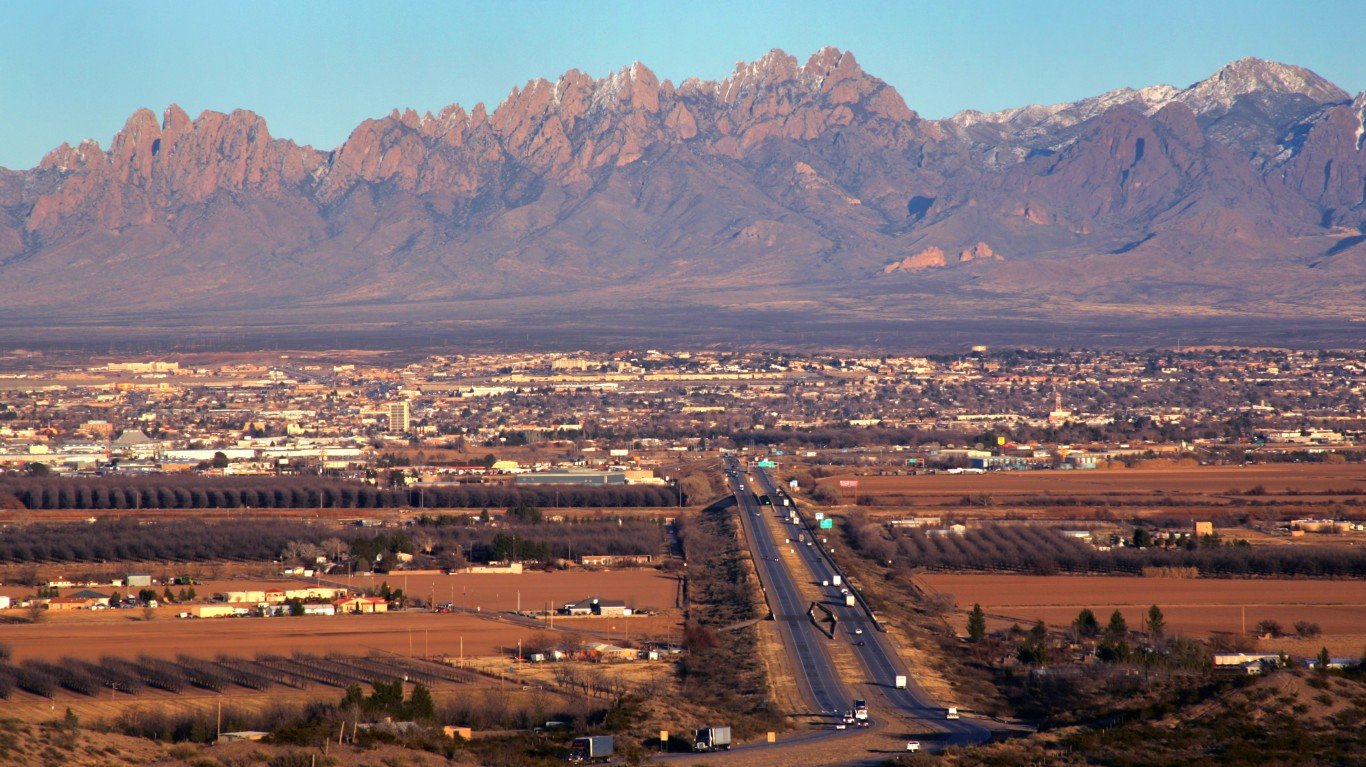
31. New Mexico: Las Cruces
> Concentrated poverty rate: 26.3% of poor pop. (15,312 residents)
> Overall poverty rate: 27.9% (state: 20.6%)
> Neighborhoods with concentrated poverty: 6 out of 40
> Unemployment: 13.4% (poor neighborhoods) 8.2% (all other)
See all stories featuring: New Mexico
[in-text-ad]
Source: DenisTangneyJr / Getty Images
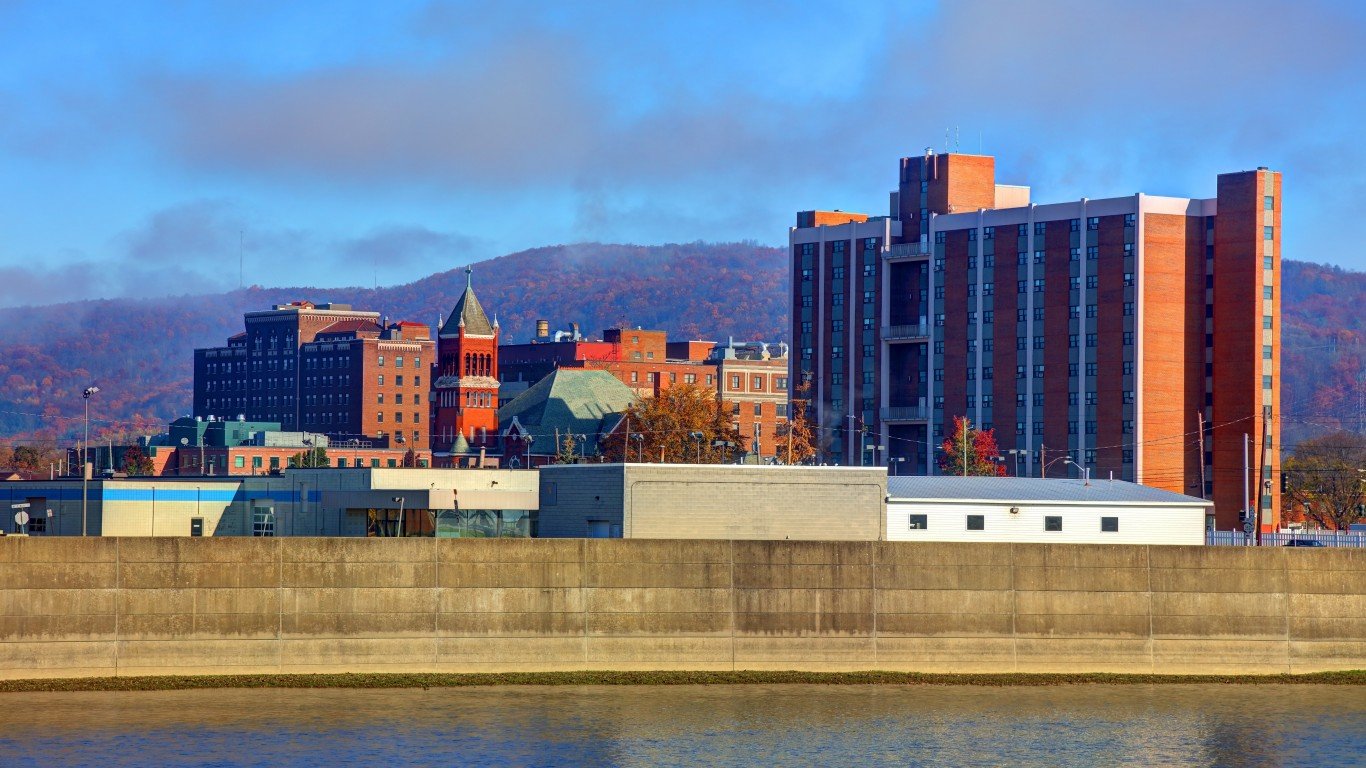
32. New York: Elmira
> Concentrated poverty rate: 30.0% of poor pop. (3,875 residents)
> Overall poverty rate: 15.8% (state: 15.1%)
> Neighborhoods with concentrated poverty: 4 out of 22
> Unemployment: 8.3% (poor neighborhoods) 5.0% (all other)
See all stories featuring: New York
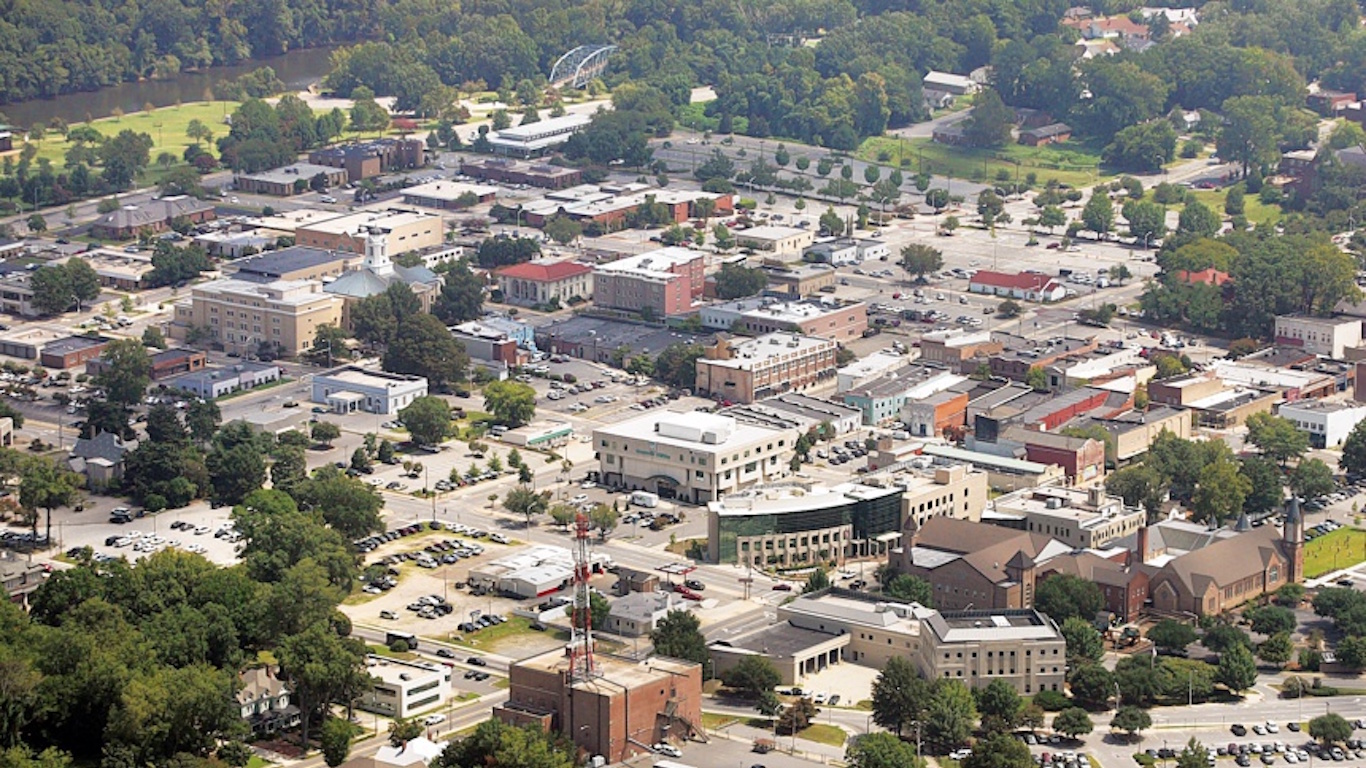
Source: Cypress Landing / Wikimedia Commons
33. North Carolina: Greenville
> Concentrated poverty rate: 17.9% of poor pop. (7,389 residents)
> Overall poverty rate: 24.3% (state: 16.1%)
> Neighborhoods with concentrated poverty: 3 out of 29
> Unemployment: 13.2% (poor neighborhoods) 9.4% (all other)
See all stories featuring: North Carolina
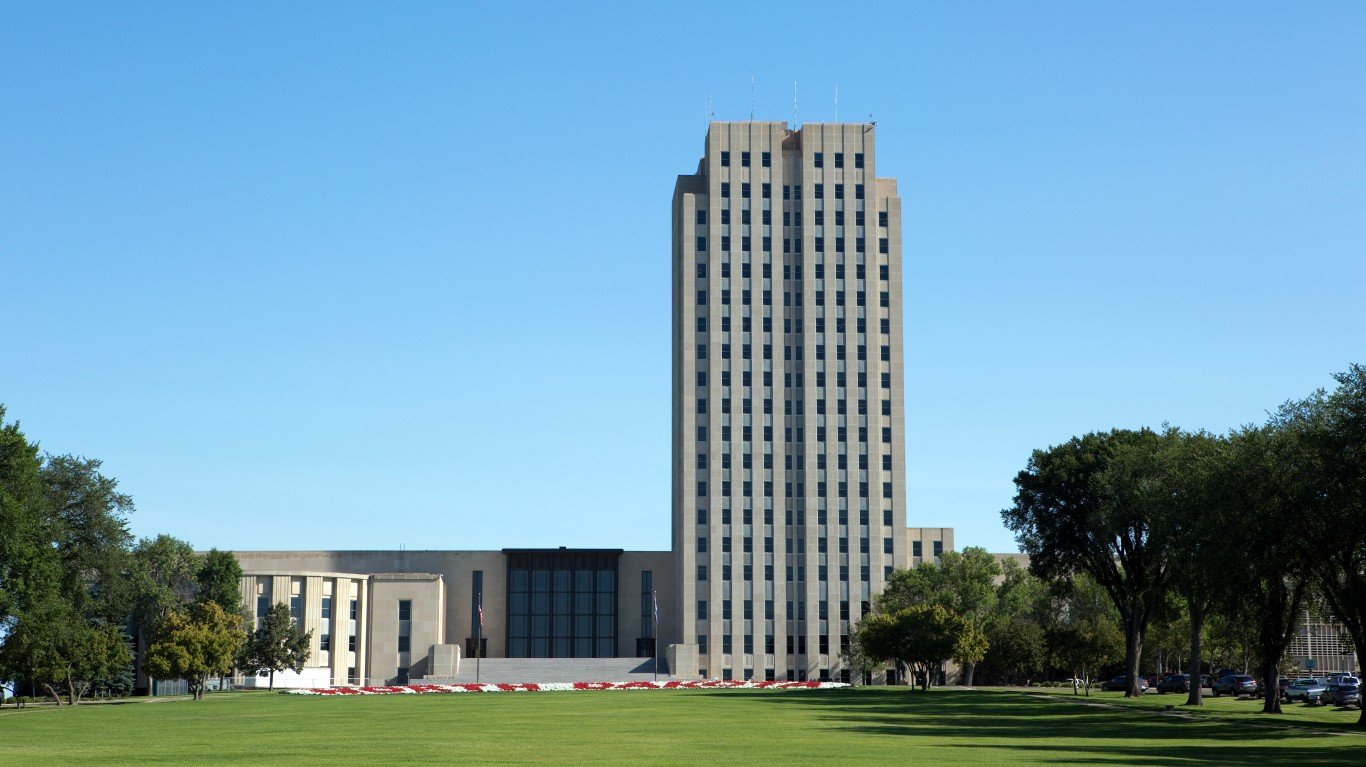
Source: sframephoto / Getty Images
34. North Dakota: Bismarck
> State poverty rate: 11.0%
See all stories featuring: North Dakota
[in-text-ad-2]
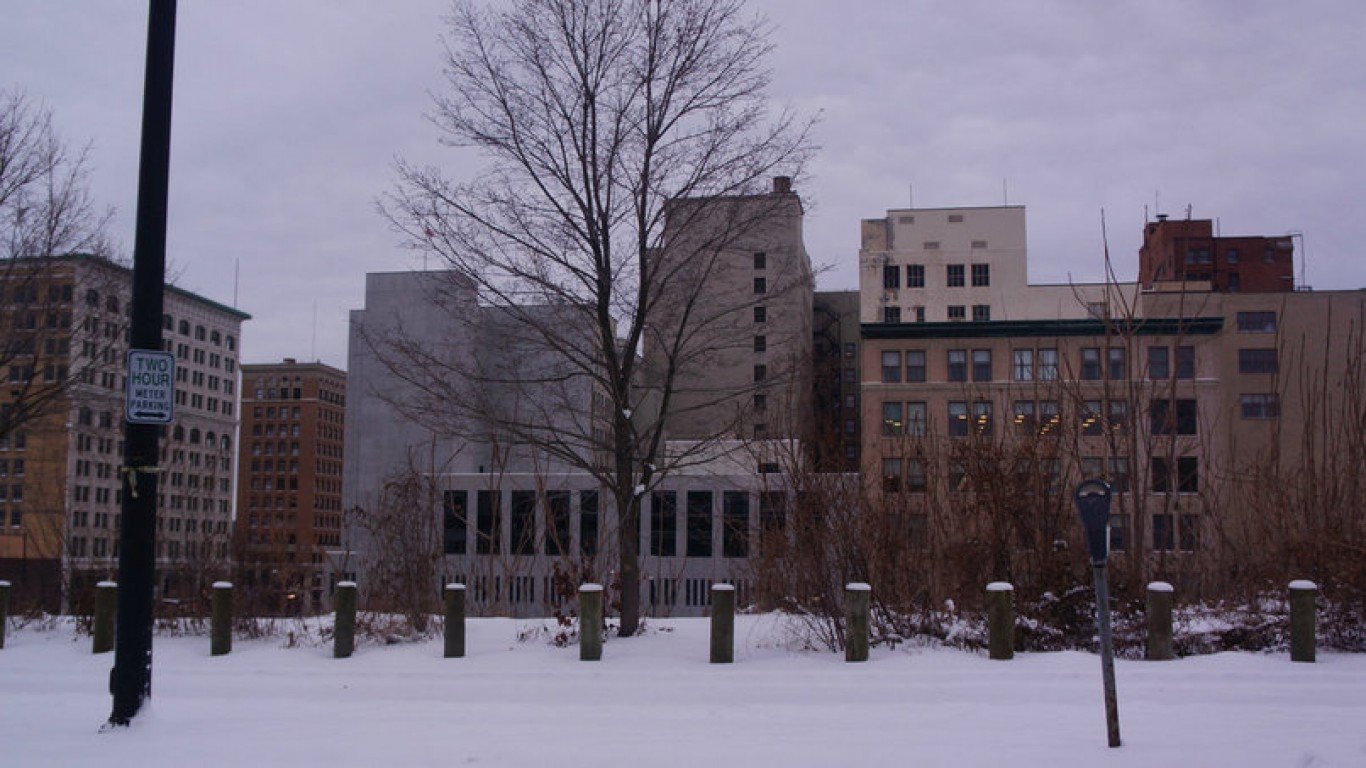
Source: Kasamias9 / Wikimedia Commons
35. Ohio: Youngstown-Warren-Boardman
> Concentrated poverty rate: 27.7% of poor pop. (24,453 residents)
> Overall poverty rate: 16.7% (state: 14.9%)
> Neighborhoods with concentrated poverty: 23 out of 155
> Unemployment: 18.5% (poor neighborhoods) 6.1% (all other)
See all stories featuring: Ohio

Source: DenisTangneyJr / Getty Images
36. Oklahoma: Lawton
> Concentrated poverty rate: 19.2% of poor pop. (3,803 residents)
> Overall poverty rate: 16.6% (state: 16.2%)
> Neighborhoods with concentrated poverty: 4 out of 33
> Unemployment: 12.5% (poor neighborhoods) 8.2% (all other)
See all stories featuring: Oklahoma
[in-text-ad]

Source: Grant Wylie / Getty Images
37. Oregon: Medford
> Concentrated poverty rate: 7.5% of poor pop. (2,629 residents)
> Overall poverty rate: 16.7% (state: 14.9%)
> Neighborhoods with concentrated poverty: 2 out of 41
> Unemployment: 14.6% (poor neighborhoods) 7.2% (all other)
See all stories featuring: Oregon
 24/7 Wall St.
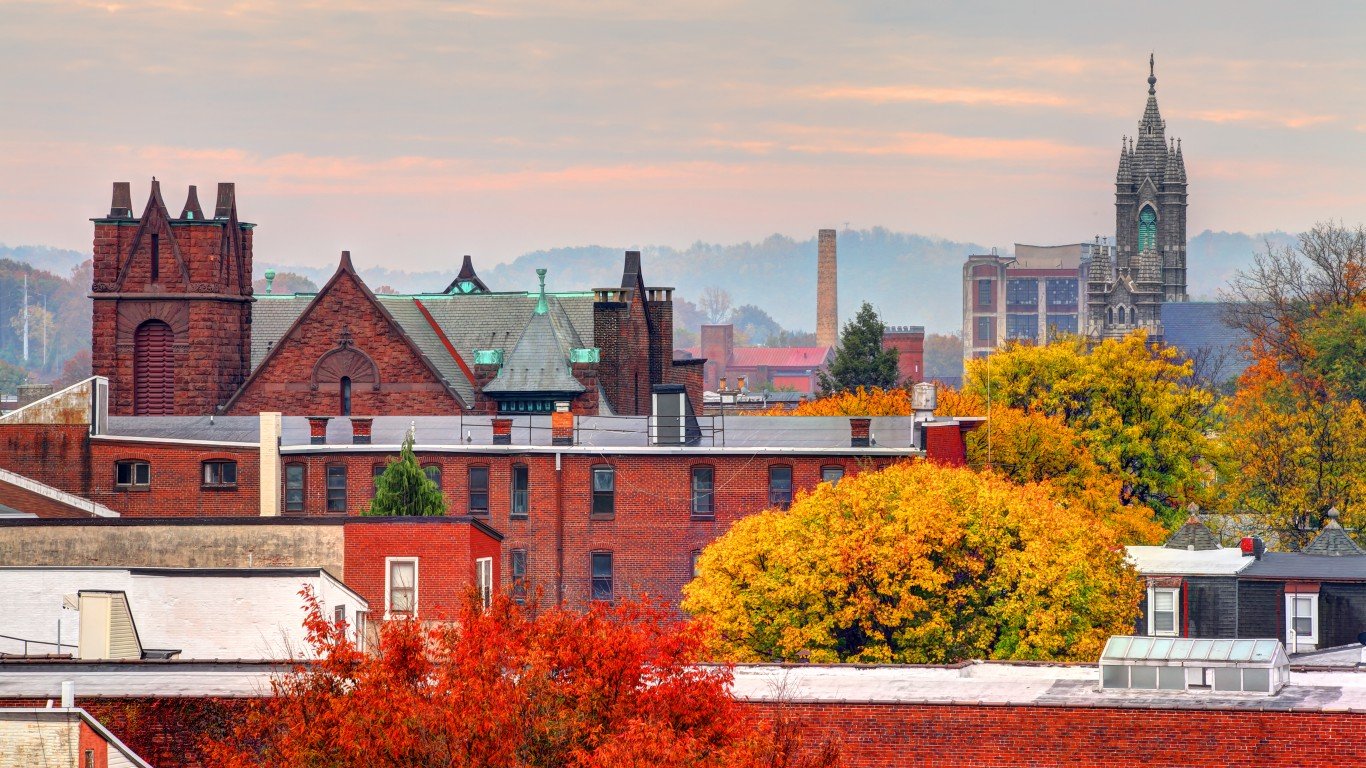
Source: DenisTangneyJr / Getty Images
38. Pennsylvania: Reading
> Concentrated poverty rate: 28.1% of poor pop. (15,374 residents)
> Overall poverty rate: 13.6% (state: 13.1%)
> Neighborhoods with concentrated poverty: 9 out of 89
> Unemployment: 22.7% (poor neighborhoods) 6.3% (all other)
See all stories featuring: Pennsylvania

Source: Sean Pavone / Getty Images
39. Rhode Island: Providence-Warwick
> Concentrated poverty rate: 4.9% of poor pop. (9,967 residents)
> Overall poverty rate: 13.0% (state: 13.4%)
> Neighborhoods with concentrated poverty: 9 out of 359
> Unemployment: 11.0% (poor neighborhoods) 6.9% (all other)
See all stories featuring: Rhode Island
[in-text-ad-2]

Source: pom-angers / Flickr
40. South Carolina: Charleston-North Charleston
> Concentrated poverty rate: 11.1% of poor pop. (11,208 residents)
> Overall poverty rate: 13.9% (state: 16.6%)
> Neighborhoods with concentrated poverty: 8 out of 151
> Unemployment: 9.6% (poor neighborhoods) 5.8% (all other)
See all stories featuring: South Carolina
Source: JMichl / Getty Images
41. South Dakota: no metro area with concentrated poverty
> State poverty rate: 13.9%
See all stories featuring: South Dakota
[in-text-ad]
Source: FangXiaNuo / Getty Images
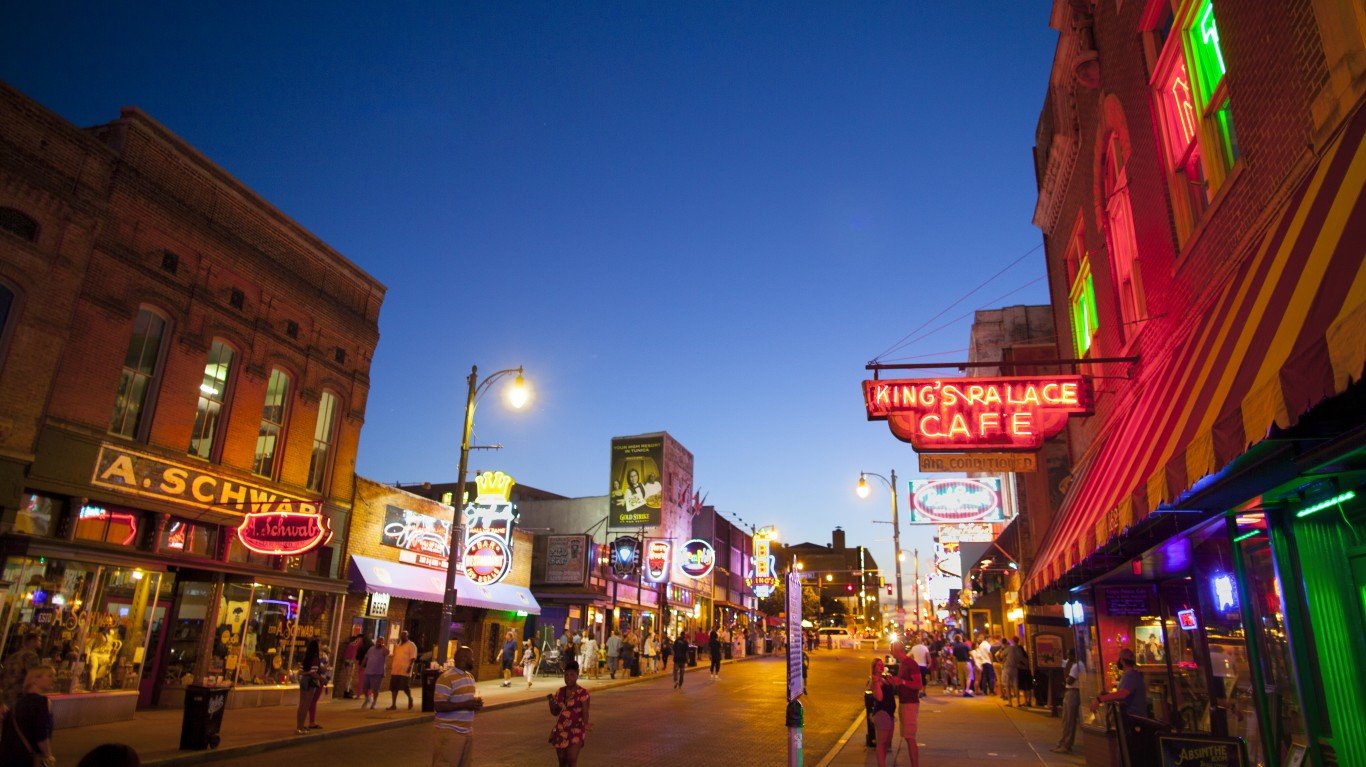
42. Tennessee: Memphis
> Concentrated poverty rate: 28.4% of poor pop. (70,965 residents)
> Overall poverty rate: 18.9% (state: 16.7%)
> Neighborhoods with concentrated poverty: 52 out of 309
> Unemployment: 16.3% (poor neighborhoods) 7.6% (all other)
See all stories featuring: Tennessee

Source: DenisTangneyJr / Getty Images
43. Texas: Laredo
> Concentrated poverty rate: 54.2% of poor pop. (45,403 residents)
> Overall poverty rate: 31.5% (state: 16.0%)
> Neighborhoods with concentrated poverty: 27 out of 60
> Unemployment: 7.2% (poor neighborhoods) 5.2% (all other)
See all stories featuring: Texas
Source: johnnya123 / Getty Images
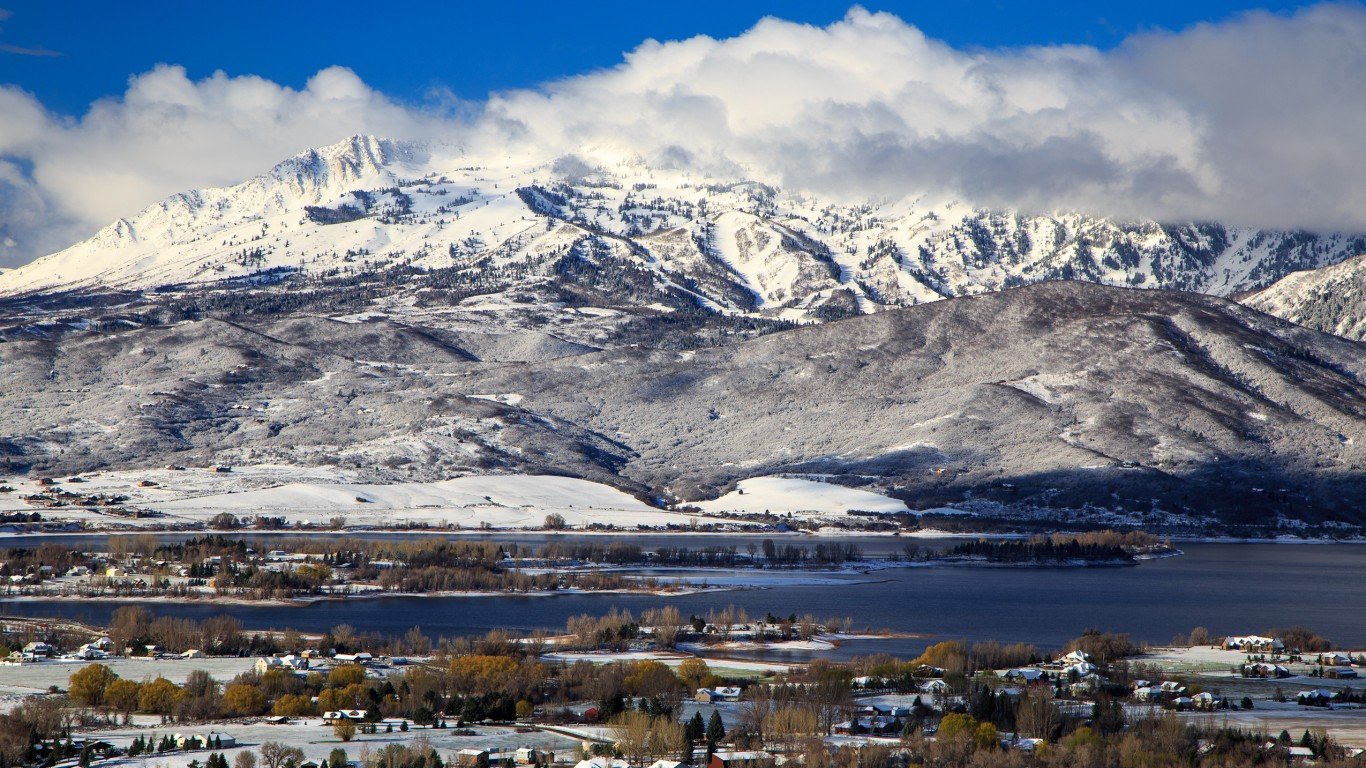
44. Utah: Ogden-Clearfield
> Concentrated poverty rate: 6.5% of poor pop. (3,623 residents)
> Overall poverty rate: 8.7% (state: 11.0%)
> Neighborhoods with concentrated poverty: 3 out of 116
> Unemployment: 14.9% (poor neighborhoods) 4.0% (all other)
See all stories featuring: Utah
[in-text-ad-2]
Source: DenisTangneyJr / Getty Images
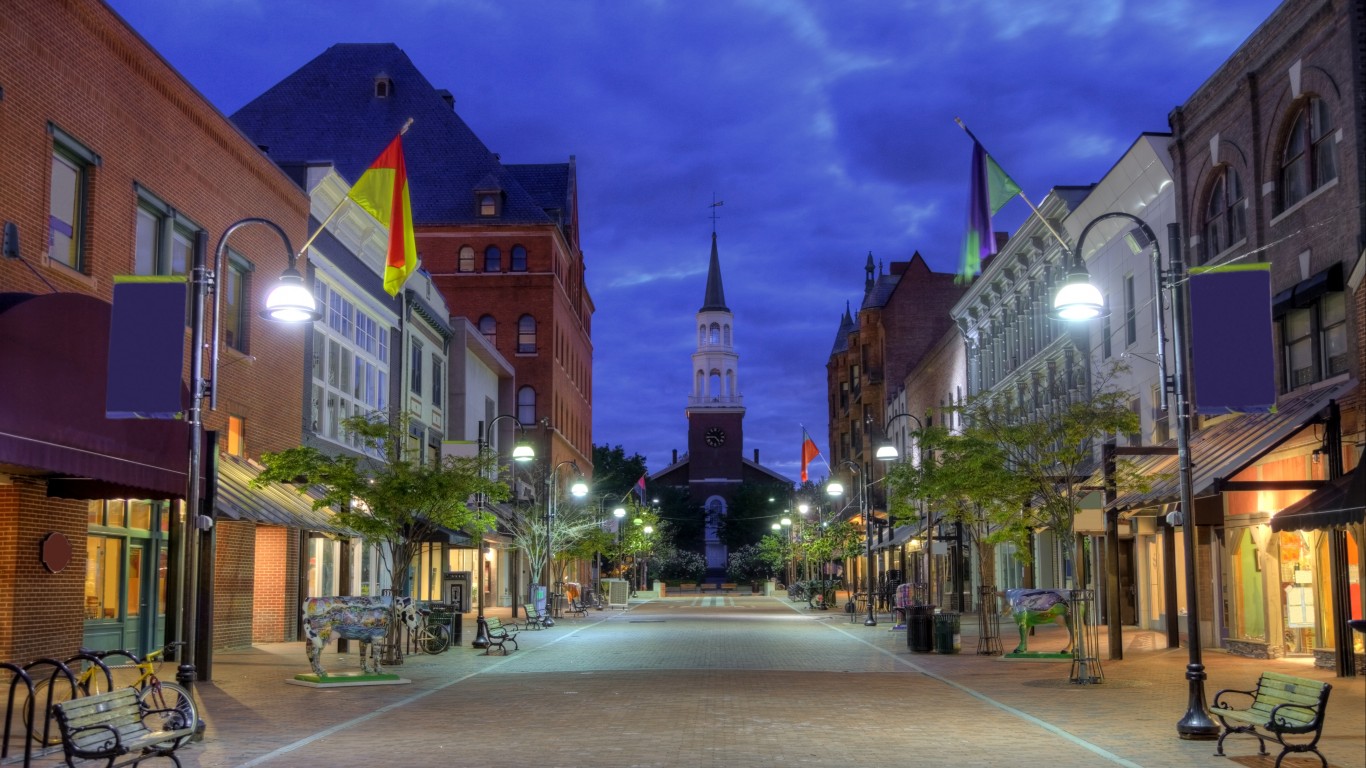
45. Vermont: Burlington-South Burlington
> Concentrated poverty rate: 10.9% of poor pop. (2,332 residents)
> Overall poverty rate: 10.4% (state: 11.4%)
> Neighborhoods with concentrated poverty: 1 out of 45
> Unemployment: 8.1% (poor neighborhoods) 4.0% (all other)
See all stories featuring: Vermont

Source: traveler1116 / Getty Images
46. Virginia: Richmond
> Concentrated poverty rate: 10.1% of poor pop. (15,334 residents)
> Overall poverty rate: 12.4% (state: 11.2%)
> Neighborhoods with concentrated poverty: 11 out of 290
> Unemployment: 14.5% (poor neighborhoods) 6.2% (all other)
See all stories featuring: Virginia
[in-text-ad]
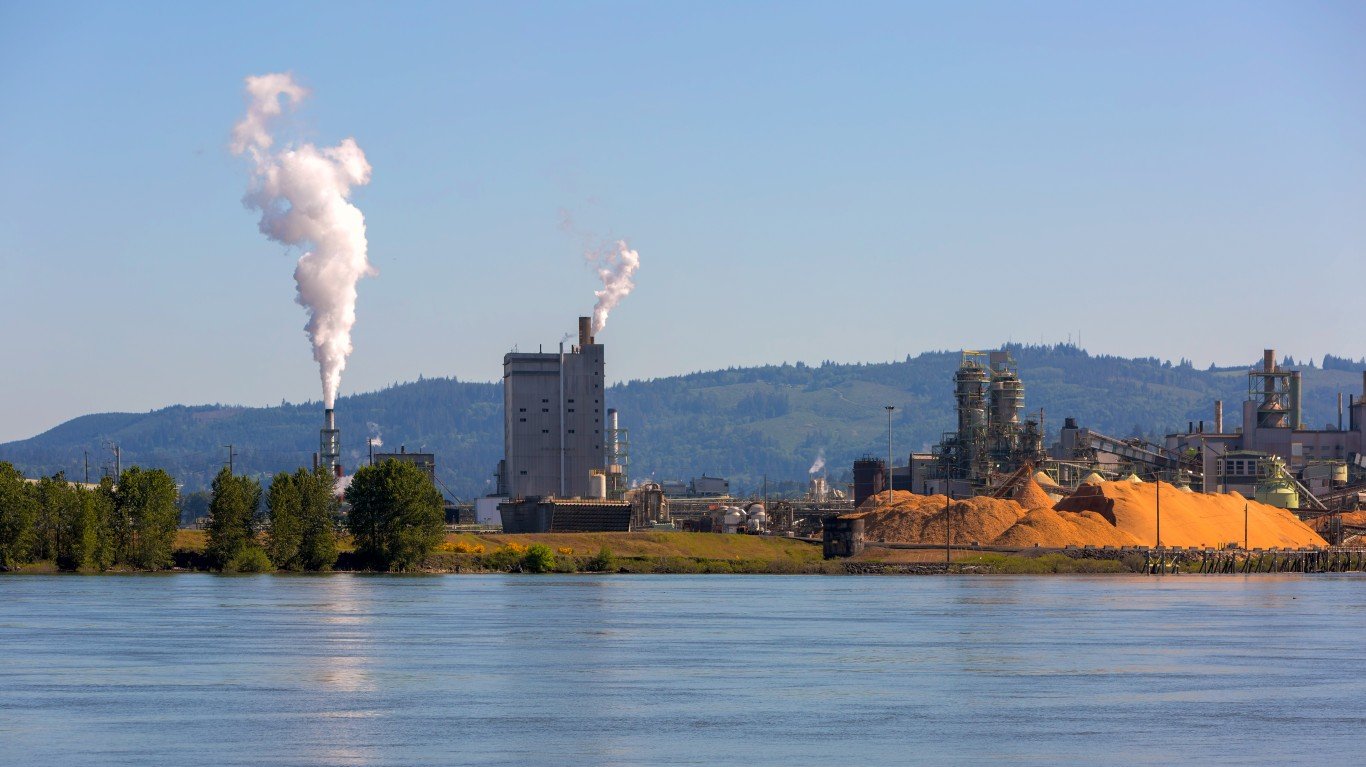
Source: thyegn / Getty Images
47. Washington: Longview
> Concentrated poverty rate: 23.8% of poor pop. (4,097 residents)
> Overall poverty rate: 16.9% (state: 12.2%)
> Neighborhoods with concentrated poverty: 4 out of 24
> Unemployment: 12.9% (poor neighborhoods) 8.0% (all other)
See all stories featuring: Washington

Source: traveler1116 / Getty Images
48. West Virginia: Huntington-Ashland
> Concentrated poverty rate: 14.2% of poor pop. (9,437 residents)
> Overall poverty rate: 18.8% (state: 17.8%)
> Neighborhoods with concentrated poverty: 8 out of 92
> Unemployment: 12.3% (poor neighborhoods) 6.5% (all other)
See all stories featuring: West Virginia
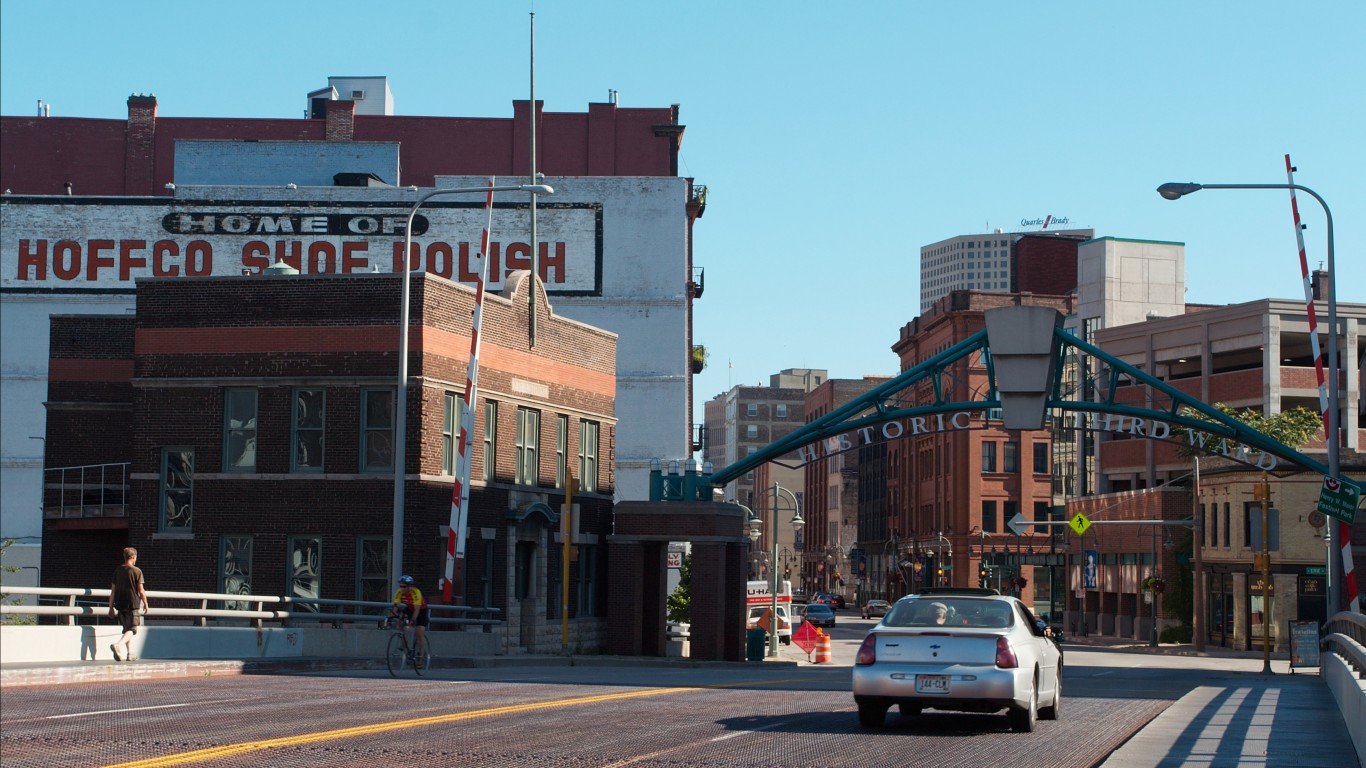
Source: Dori / Wikimedia Commons
49. Wisconsin: Milwaukee-Waukesha-West Allis
> Concentrated poverty rate: 23.5% of poor pop. (52,706 residents)
> Overall poverty rate: 14.5% (state: 12.3%)
> Neighborhoods with concentrated poverty: 49 out of 422
> Unemployment: 15.1% (poor neighborhoods) 5.1% (all other)
See all stories featuring: Wisconsin
[in-text-ad-2]

Source: aoldman / Getty Images
50. Wyoming: no metro area with concentrated poverty
> State poverty rate: 11.1%
See all stories featuring: Wyoming
Methodology
To identify the metropolitan areas hit hardest by extreme poverty, 24/7 Wall St. reviewed U.S. Census Bureau American Community Survey data on poverty rates at the tract level. We listed for each state the metro area where the largest percentage of poor residents live in concentrated poverty. The concentrated poverty rate is the share of a metropolitan area’s poor population that lives in a census tract that has a poverty rate of 40% or higher. We also reviewed other data from the ACS, including educational attainment rates and unemployment rates for both groups in concentrated poverty and those not in concentrated poverty.
Sponsored: Find a Qualified Financial Advisor
Finding a qualified financial advisor doesn’t have to be hard. SmartAsset’s free tool matches you with up to 3 fiduciary financial advisors in your area in 5 minutes. Each advisor has been vetted by SmartAsset and is held to a fiduciary standard to act in your best interests. If you’re ready to be matched with local advisors that can help you achieve your financial goals, get started now.
Thank you for reading! Have some feedback for us?
Contact the 24/7 Wall St. editorial team.
Editors' Picks

