
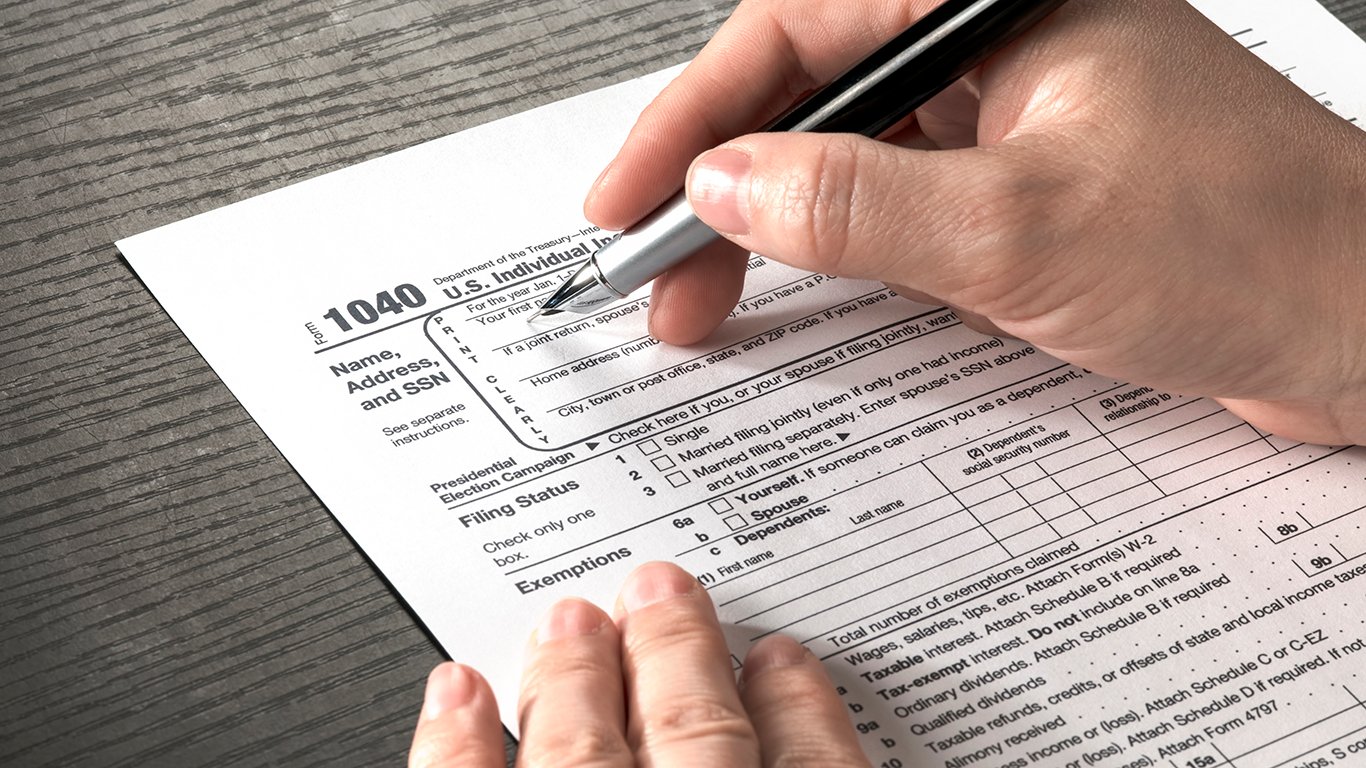
Every day, an estimated 10,000 Americans baby boomers retire — and unfortunately many of them will spend their golden years pinching pennies. According to a recent estimate released by the U.S. Government Accountability Office, nearly half of all Americans 55 and older have no retirement savings.
Still, despite having no retirement savings, many retirees are expected to be relatively financially secure over the course of their retirement. In addition to monthly Social Security payments, millions of older retired Americans — including former teachers, firefighters, police officers, and other state and local government employees — are also expected to receive pensions.
According to the U.S. Census Bureau’s 2017 Annual Survey of Public Pensions, state and local governments contributed $144.6 billion to employee pension programs in 2017. Not all states, however, spend equally on retirement programs.
24/7 Wall St. reviewed annual pension fund contributions at the state and local level to identify the states that are spending the most to fund their residents’ retirement. States are ranked based on total 2017 pension fund contributions per current state and local government employee.
The states spending the most per public sector worker do not necessarily have greater than average public sector employment. In fact, Alaska and Hawaii are the only two states in the top 10 on this list to also rank among the 10 states where the most people work for the government. Here is a full list of states where the most people work for the government.
While public pensions are a financial lifeline to millions of Americans heading into retirement, they are costly — and most state pension systems are woefully underfunded. In 20 states, less than two-thirds of pension obligations have adequate funding. Some of the states spending the most on retirement in 2017 also have the largest funding gaps to close. Here is every state’s pension crisis, ranked.
Click here to see the states spending the most to fund their residents retirement
Click here to read our methodology
Source: EunikaSopotnicka / Getty Images
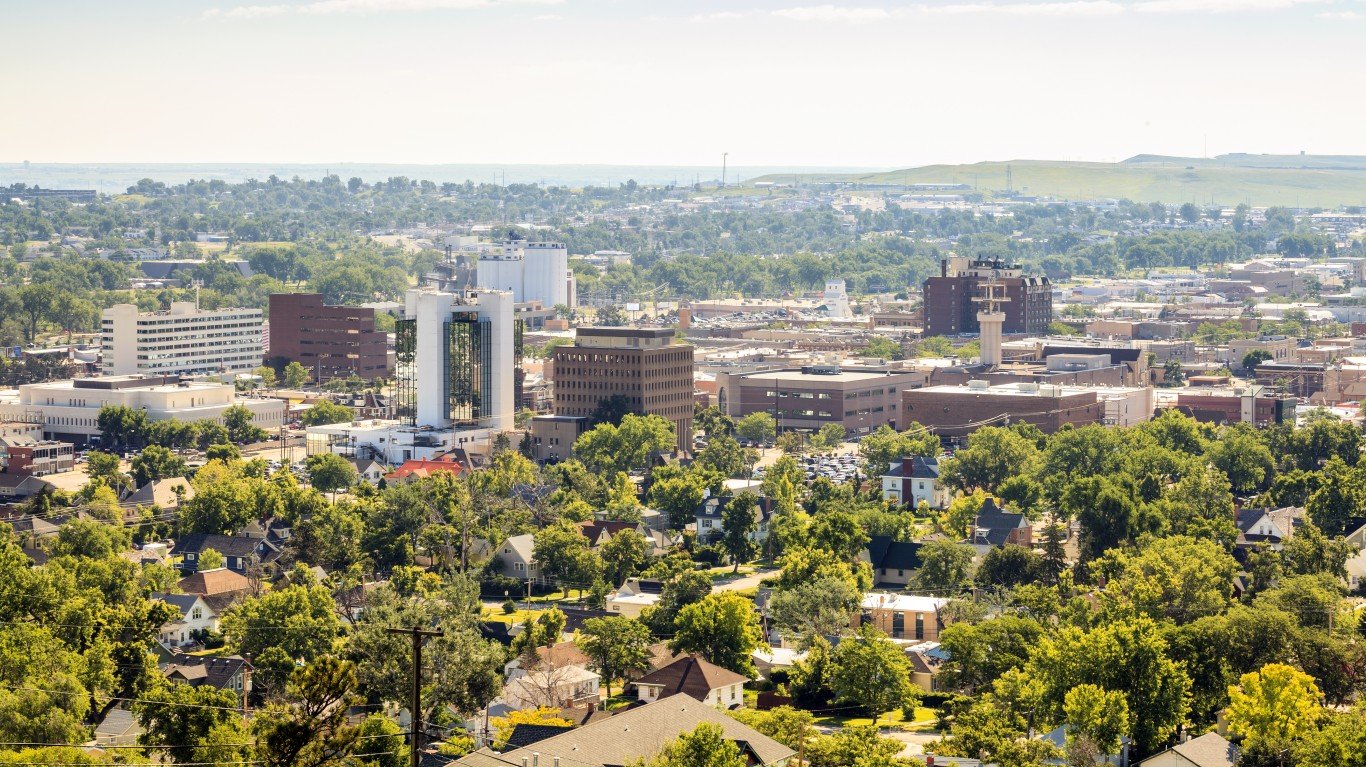
50. South Dakota
> 2017 state and local gov’t pension contributions: $2,107 per gov’t worker
> Pension obligations funded: 100.1% (2nd highest)
> Workers in state and local gov’t: 67,700 (15.6% of labor force)
> 65 and older population: 141,886 (16.3% of total)
See all stories featuring: South Dakota
[in-text-ad]
Source: undefined undefined / Getty Images
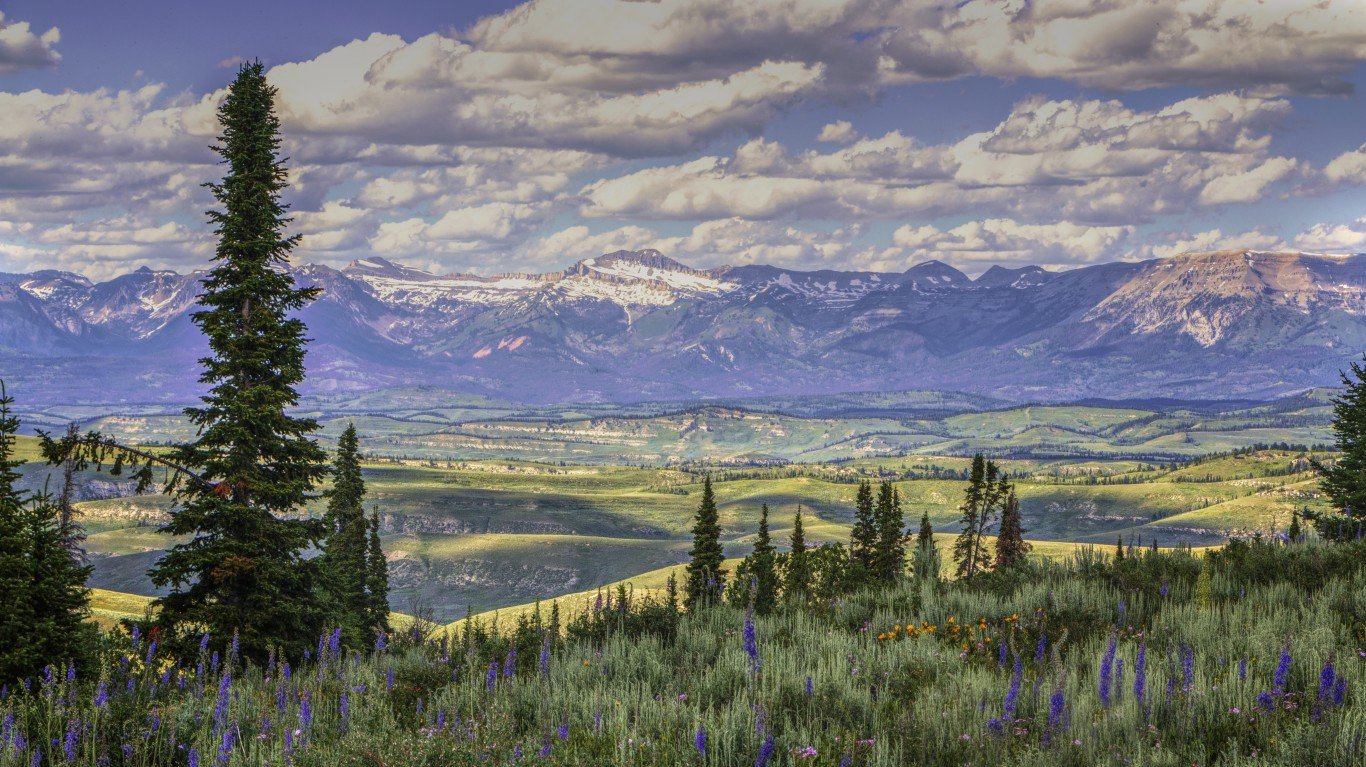
49. Wyoming
> 2017 state and local gov’t pension contributions: $2,822 per gov’t worker
> Pension obligations funded: 75.9% (23rd highest)
> Workers in state and local gov’t: 62,400 (22.0% of labor force)
> 65 and older population: 90,437 (15.6% of total)
See all stories featuring: Wyoming
 24/7 Wall St.
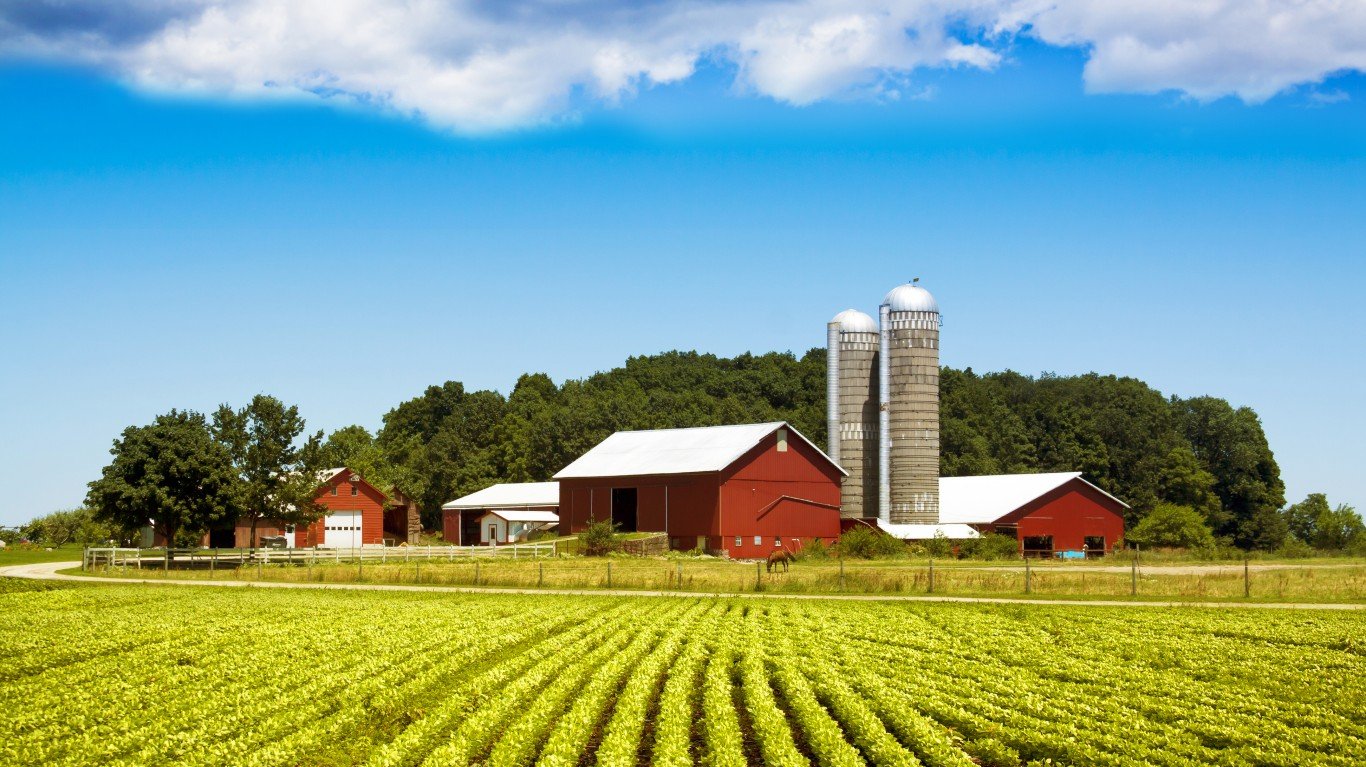
Source: Sean Pavone / Getty Images
48. Wisconsin
> 2017 state and local gov’t pension contributions: $2,883 per gov’t worker
> Pension obligations funded: 102.6% (the highest)
> Workers in state and local gov’t: 378,400 (12.8% of labor force)
> 65 and older population: 956,184 (16.5% of total)
See all stories featuring: Wisconsin

Source: Kruck20 / Getty Images
47. North Carolina
> 2017 state and local gov’t pension contributions: $2,992 per gov’t worker
> Pension obligations funded: 90.7% (6th highest)
> Workers in state and local gov’t: 657,600 (14.9% of labor force)
> 65 and older population: 1.6 million (15.9% of total)
See all stories featuring: North Carolina
[in-text-ad-2]
Source: Davel5957 / Getty Images
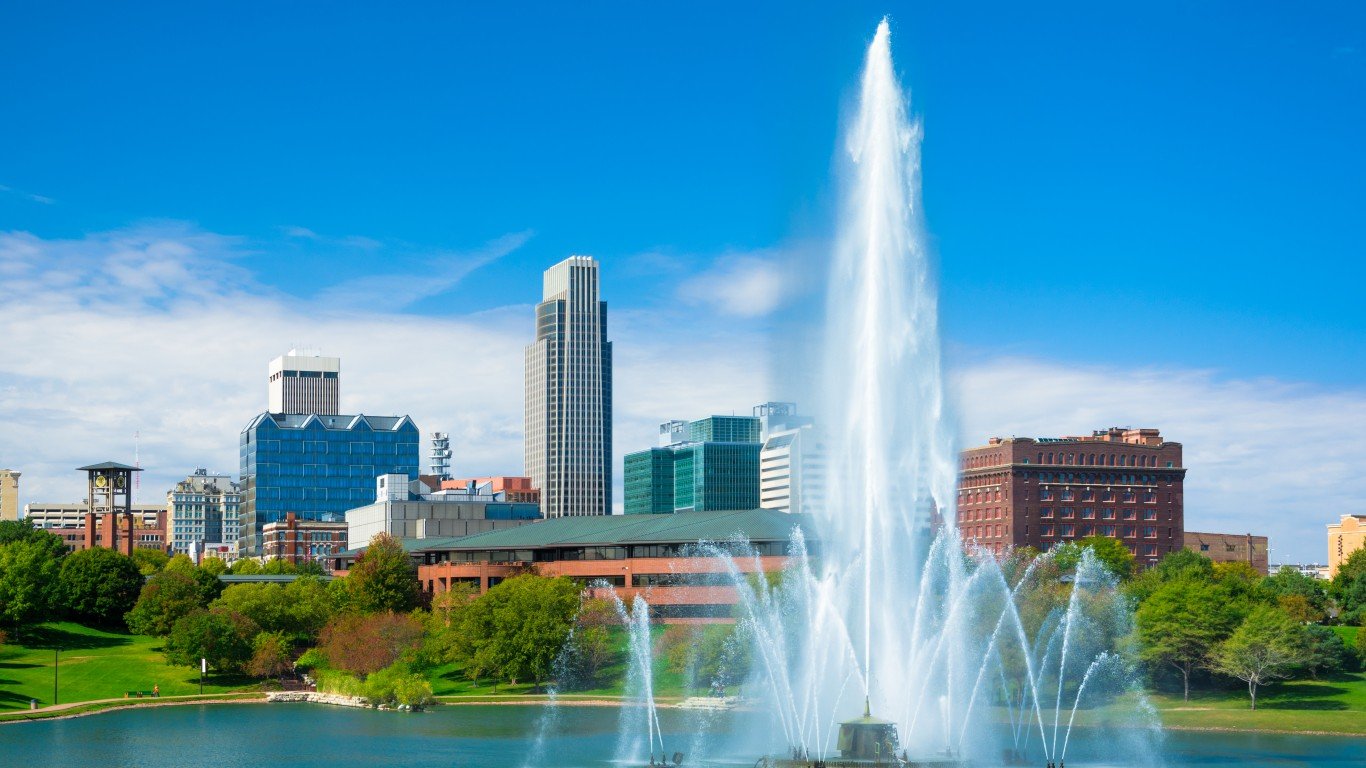
46. Nebraska
> 2017 state and local gov’t pension contributions: $3,009 per gov’t worker
> Pension obligations funded: 90.2% (8th highest)
> Workers in state and local gov’t: 156,300 (15.3% of labor force)
> 65 and older population: 294,905 (15.4% of total)
See all stories featuring: Nebraska

Source: DenisTangneyJr / Getty Images
45. North Dakota
> 2017 state and local gov’t pension contributions: $3,020 per gov’t worker
> Pension obligations funded: 63.8% (16th lowest)
> Workers in state and local gov’t: 73,300 (17.0% of labor force)
> 65 and older population: 112,669 (14.9% of total)
See all stories featuring: North Dakota
[in-text-ad]
Source: Davel5957 / Getty Images
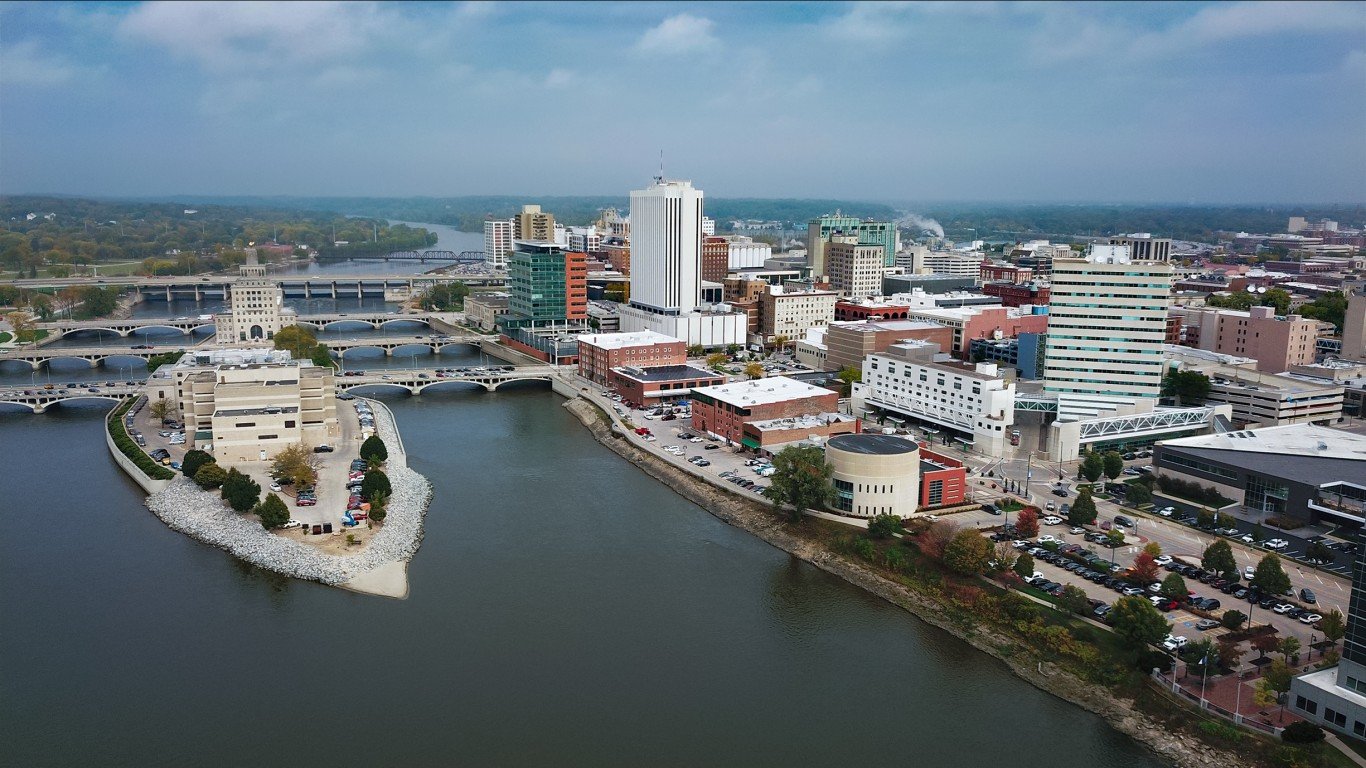
44. Iowa
> 2017 state and local gov’t pension contributions: $3,325 per gov’t worker
> Pension obligations funded: 82.3% (12th highest)
> Workers in state and local gov’t: 242,400 (15.4% of labor force)
> 65 and older population: 524,624 (16.7% of total)
See all stories featuring: Iowa
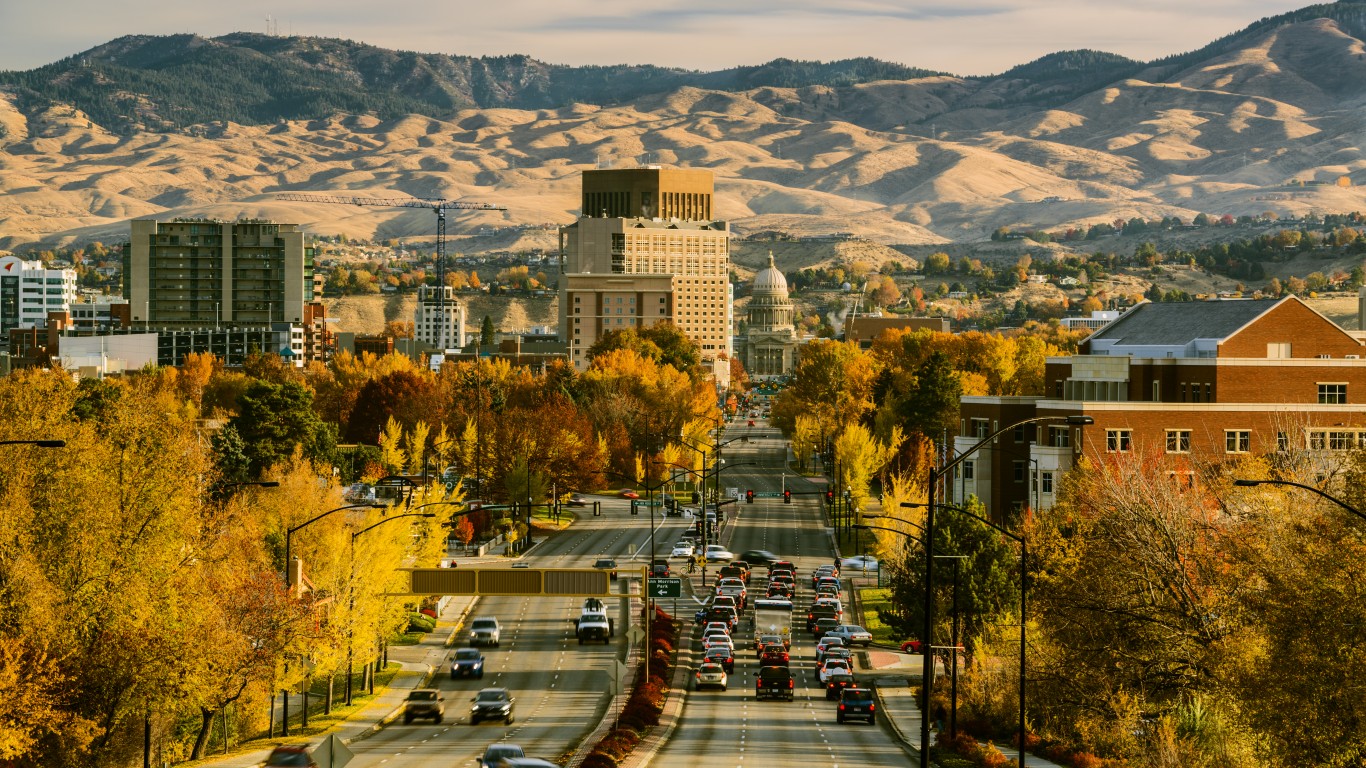
Source: vkbhat / Getty Images
43. Idaho
> 2017 state and local gov’t pension contributions: $3,346 per gov’t worker
> Pension obligations funded: 91.3% (5th highest)
> Workers in state and local gov’t: 110,200 (15.4% of labor force)
> 65 and older population: 262,594 (15.3% of total)
See all stories featuring: Idaho

Source: SeanPavonePhoto / Getty Images
42. Vermont
> 2017 state and local gov’t pension contributions: $3,482 per gov’t worker
> Pension obligations funded: 64.3% (17th lowest)
> Workers in state and local gov’t: 49,300 (15.7% of labor force)
> 65 and older population: 117,150 (18.8% of total)
See all stories featuring: Vermont
[in-text-ad-2]

Source: AndreyKrav / Getty Images
41. Minnesota
> 2017 state and local gov’t pension contributions: $3,510 per gov’t worker
> Pension obligations funded: 63.3% (15th lowest)
> Workers in state and local gov’t: 391,400 (13.3% of labor force)
> 65 and older population: 858,904 (15.4% of total)
See all stories featuring: Minnesota

Source: gnagel / Getty Images
40. Tennessee
> 2017 state and local gov’t pension contributions: $3,552 per gov’t worker
> Pension obligations funded: 96.5% (3rd highest)
> Workers in state and local gov’t: 381,300 (12.7% of labor force)
> 65 and older population: 1.1 million (15.9% of total)
See all stories featuring: Tennessee
[in-text-ad]

Source: peeterv / Getty Images
39. Montana
> 2017 state and local gov’t pension contributions: $3,561 per gov’t worker
> Pension obligations funded: 72.8% (25th highest)
> Workers in state and local gov’t: 77,800 (16.5% of labor force)
> 65 and older population: 190,216 (18.1% of total)
See all stories featuring: Montana

Source: SeanPavonePhoto / Getty Images
38. Alabama
> 2017 state and local gov’t pension contributions: $3,997 per gov’t worker
> Pension obligations funded: 70.9% (25th lowest)
> Workers in state and local gov’t: 331,500 (16.4% of labor force)
> 65 and older population: 803,216 (16.5% of total)
See all stories featuring: Alabama

Source: buburuzaproductions / Getty Images
37. Texas
> 2017 state and local gov’t pension contributions: $4,014 per gov’t worker
> Pension obligations funded: 76.1% (22nd highest)
> Workers in state and local gov’t: 1.7 million (14.2% of labor force)
> 65 and older population: 3.5 million (12.2% of total)
See all stories featuring: Texas
[in-text-ad-2]

Source: KeithBriley / Getty Images
36. South Carolina
> 2017 state and local gov’t pension contributions: $4,170 per gov’t worker
> Pension obligations funded: 54.3% (7th lowest)
> Workers in state and local gov’t: 332,400 (15.9% of labor force)
> 65 and older population: 865,817 (17.2% of total)
See all stories featuring: South Carolina

Source: Davel5957 / Getty Images
35. Oklahoma
> 2017 state and local gov’t pension contributions: $4,322 per gov’t worker
> Pension obligations funded: 77.9% (18th highest)
> Workers in state and local gov’t: 300,700 (18.1% of labor force)
> 65 and older population: 601,132 (15.3% of total)
See all stories featuring: Oklahoma
[in-text-ad]

Source: marchello74 / Getty Images
34. Florida
> 2017 state and local gov’t pension contributions: $4,330 per gov’t worker
> Pension obligations funded: 79.3% (15th highest)
> Workers in state and local gov’t: 966,700 (11.3% of labor force)
> 65 and older population: 4.2 million (20.1% of total)
See all stories featuring: Florida
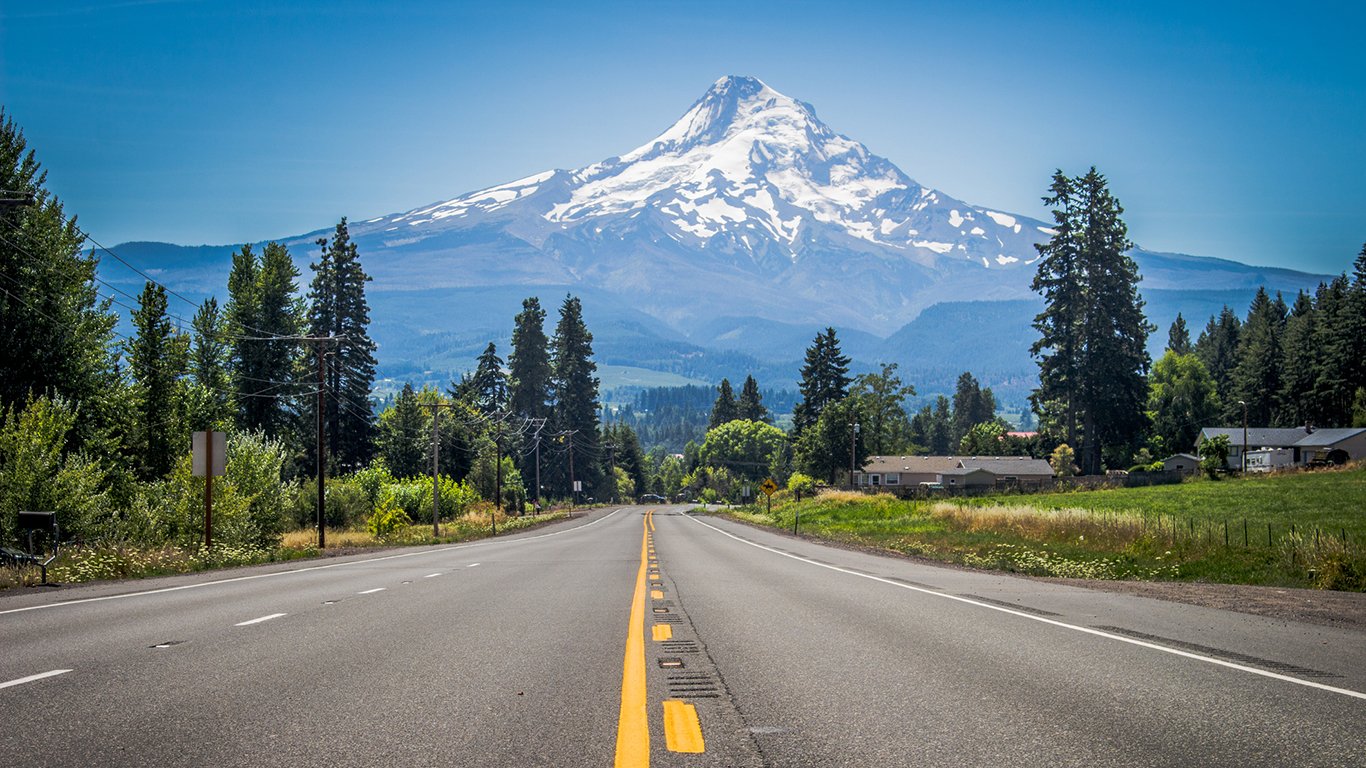
Source: BoucherPhotoStudio / iStock
33. Oregon
> 2017 state and local gov’t pension contributions: $4,344 per gov’t worker
> Pension obligations funded: 83.1% (10th highest)
> Workers in state and local gov’t: 281,700 (15.0% of labor force)
> 65 and older population: 708,868 (17.1% of total)
See all stories featuring: Oregon

Source: Creative-Family / Getty Images
32. Colorado
> 2017 state and local gov’t pension contributions: $4,429 per gov’t worker
> Pension obligations funded: 47.1% (5th lowest)
> Workers in state and local gov’t: 383,100 (14.4% of labor force)
> 65 and older population: 773,699 (13.8% of total)
See all stories featuring: Colorado
[in-text-ad-2]

Source: SeanPavonePhoto / Getty Images
31. Maine
> 2017 state and local gov’t pension contributions: $4,477 per gov’t worker
> Pension obligations funded: 81.9% (13th highest)
> Workers in state and local gov’t: 84,900 (13.6% of labor force)
> 65 and older population: 266,741 (20.0% of total)
See all stories featuring: Maine

Source: BlazenImages / Getty Images
30. Arkansas
> 2017 state and local gov’t pension contributions: $4,552 per gov’t worker
> Pension obligations funded: 76.9% (21st highest)
> Workers in state and local gov’t: 191,200 (15.3% of labor force)
> 65 and older population: 497,024 (16.5% of total)
See all stories featuring: Arkansas
[in-text-ad]

Source: Davel5957 / Getty Images
29. New Mexico
> 2017 state and local gov’t pension contributions: $4,654 per gov’t worker
> Pension obligations funded: 62.5% (13th lowest)
> Workers in state and local gov’t: 158,100 (19.0% of labor force)
> 65 and older population: 349,929 (16.8% of total)
See all stories featuring: New Mexico
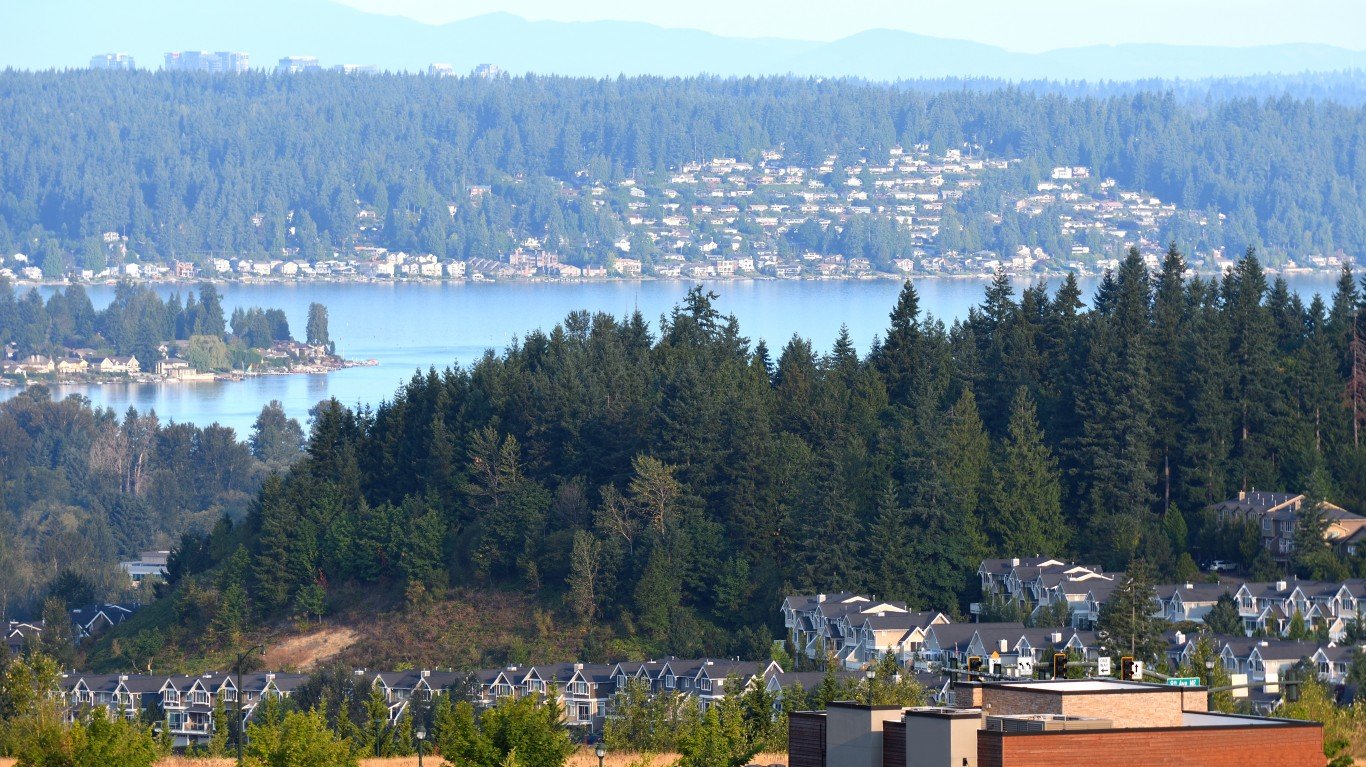
Source: 4nadia / Getty Images
28. Washington
> 2017 state and local gov’t pension contributions: $4,820 per gov’t worker
> Pension obligations funded: 89.6% (9th highest)
> Workers in state and local gov’t: 511,100 (15.4% of labor force)
> 65 and older population: 1.1 million (15.1% of total)
See all stories featuring: Washington

Source: dszc / Getty Images
27. Mississippi
> 2017 state and local gov’t pension contributions: $4,842 per gov’t worker
> Pension obligations funded: 61.6% (11th lowest)
> Workers in state and local gov’t: 217,300 (18.9% of labor force)
> 65 and older population: 465,719 (15.6% of total)
See all stories featuring: Mississippi
[in-text-ad-2]

Source: mdgmorris / Getty Images
26. Delaware
> 2017 state and local gov’t pension contributions: $4,952 per gov’t worker
> Pension obligations funded: 82.8% (11th highest)
> Workers in state and local gov’t: 60,300 (13.2% of labor force)
> 65 and older population: 173,217 (18.0% of total)
See all stories featuring: Delaware
Source: Maksymowicz / Getty Images
25. Indiana
> 2017 state and local gov’t pension contributions: $5,011 per gov’t worker
> Pension obligations funded: 65.0% (18th lowest)
> Workers in state and local gov’t: 390,200 (12.5% of labor force)
> 65 and older population: 1.0 million (15.4% of total)
See all stories featuring: Indiana
[in-text-ad]

Source: SeanPavonePhoto / Getty Images
24. Georgia
> 2017 state and local gov’t pension contributions: $5,140 per gov’t worker
> Pension obligations funded: 79.2% (16th highest)
> Workers in state and local gov’t: 586,400 (13.2% of labor force)
> 65 and older population: 1.4 million (13.4% of total)
See all stories featuring: Georgia
 24/7 Wall St.
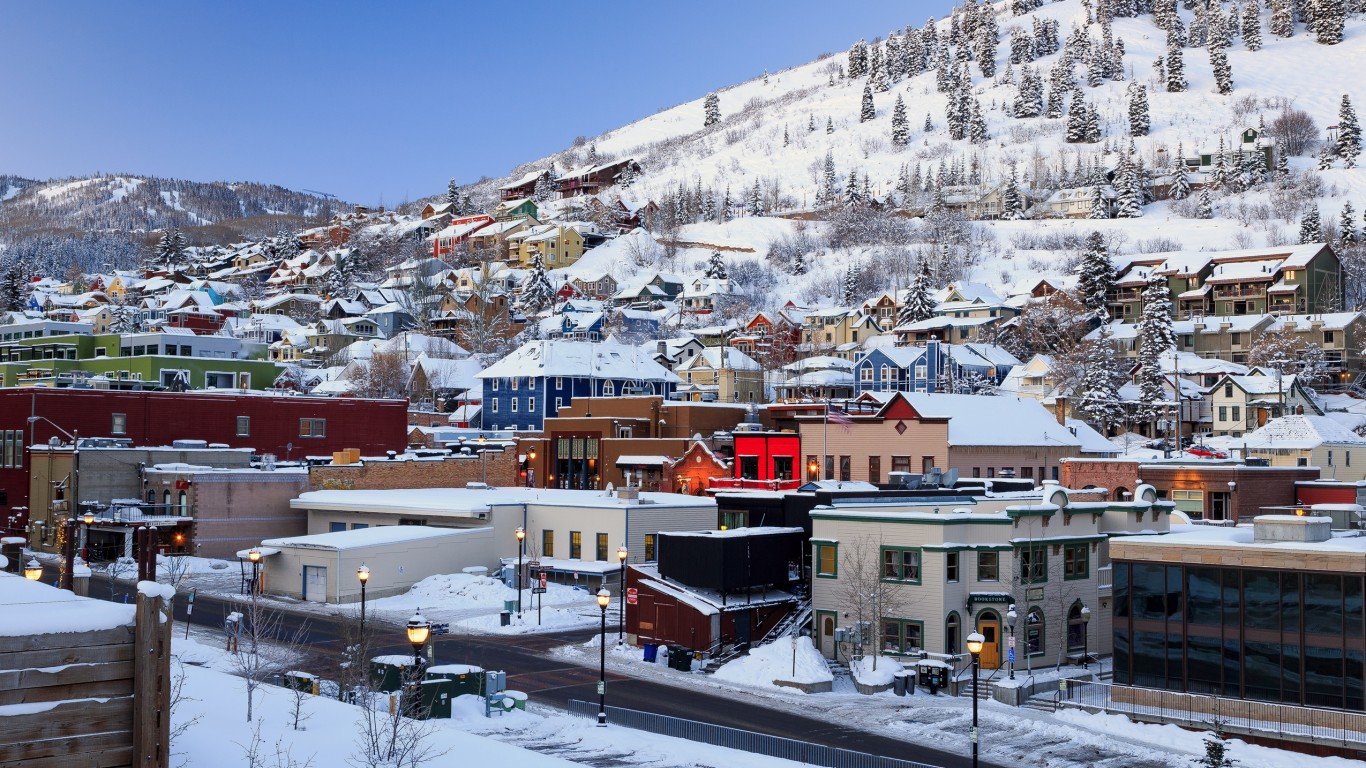
Source: johnnya123 / Getty Images
23. Utah
> 2017 state and local gov’t pension contributions: $5,304 per gov’t worker
> Pension obligations funded: 90.3% (7th highest)
> Workers in state and local gov’t: 208,300 (14.2% of labor force)
> 65 and older population: 335,195 (10.8% of total)
See all stories featuring: Utah

Source: Sean Pavone / Getty Images
22. New Hampshire
> 2017 state and local gov’t pension contributions: $5,341 per gov’t worker
> Pension obligations funded: 62.7% (14th lowest)
> Workers in state and local gov’t: 82,600 (12.2% of labor force)
> 65 and older population: 236,321 (17.6% of total)
See all stories featuring: New Hampshire
[in-text-ad-2]

Source: ablokhin / Getty Images
21. Virginia
> 2017 state and local gov’t pension contributions: $5,475 per gov’t worker
> Pension obligations funded: 77.2% (20th highest)
> Workers in state and local gov’t: 538,700 (13.6% of labor force)
> 65 and older population: 1.3 million (15.0% of total)
See all stories featuring: Virginia
Source: DenisTangneyJr / Getty Images
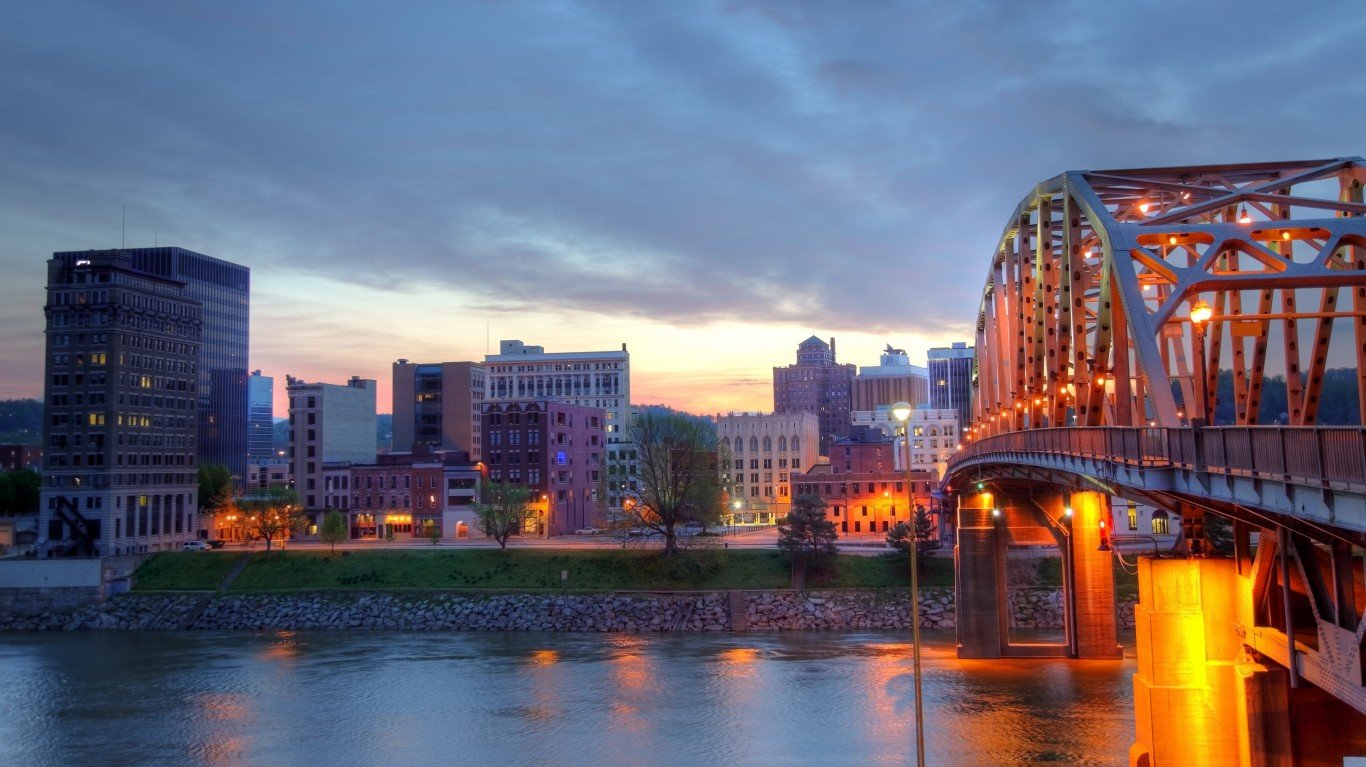
20. West Virginia
> 2017 state and local gov’t pension contributions: $5,486 per gov’t worker
> Pension obligations funded: 78.9% (17th highest)
> Workers in state and local gov’t: 129,900 (18.2% of labor force)
> 65 and older population: 350,572 (19.3% of total)
See all stories featuring: West Virginia
[in-text-ad]
Source: JTGrafix / Getty Images
19. Missouri
> 2017 state and local gov’t pension contributions: $5,632 per gov’t worker
> Pension obligations funded: 77.9% (18th highest)
> Workers in state and local gov’t: 379,800 (13.2% of labor force)
> 65 and older population: 1.0 million (16.5% of total)
See all stories featuring: Missouri
 24/7 Wall St.
Source: ricardoreitmeyer / Getty Images
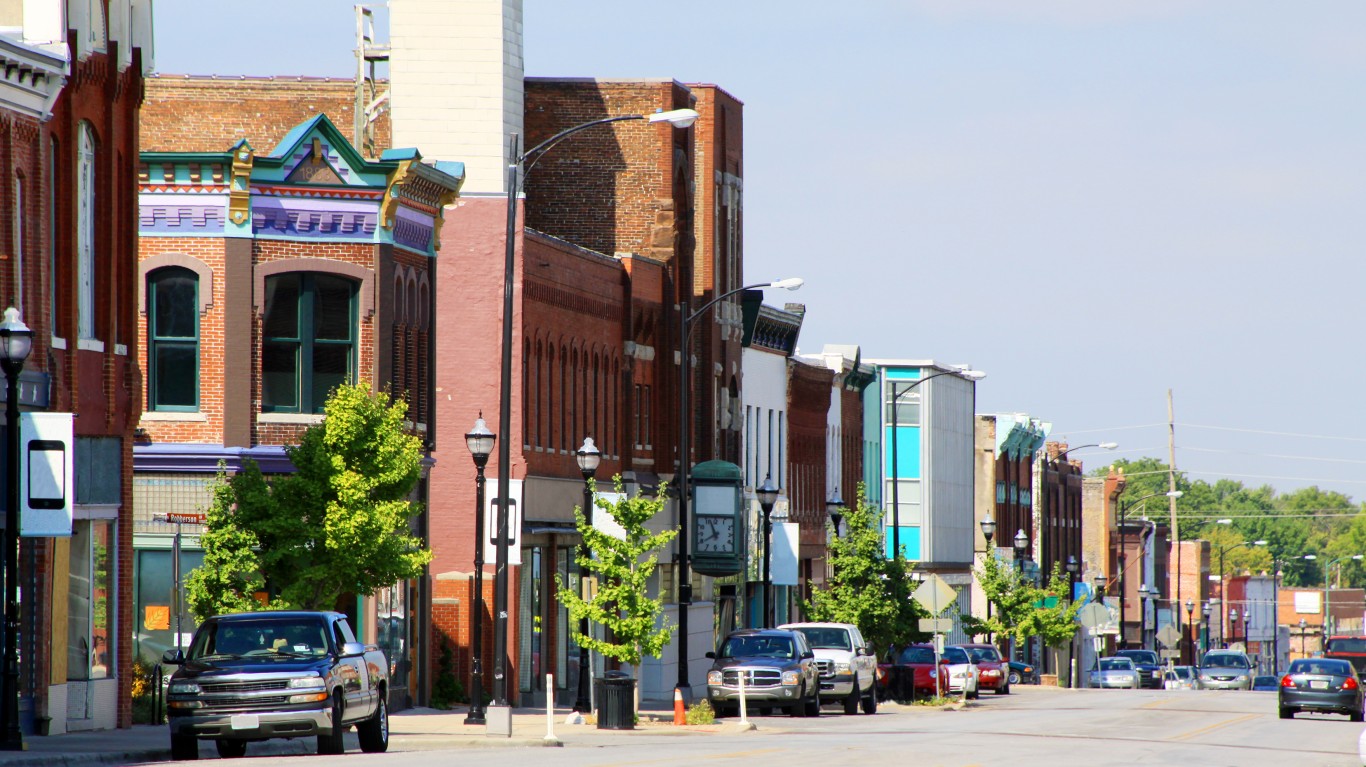
18. Kansas
> 2017 state and local gov’t pension contributions: $5,671 per gov’t worker
> Pension obligations funded: 67.1% (22nd lowest)
> Workers in state and local gov’t: 231,100 (16.5% of labor force)
> 65 and older population: 447,451 (15.4% of total)
See all stories featuring: Kansas
Source: Davel5957 / Getty Images
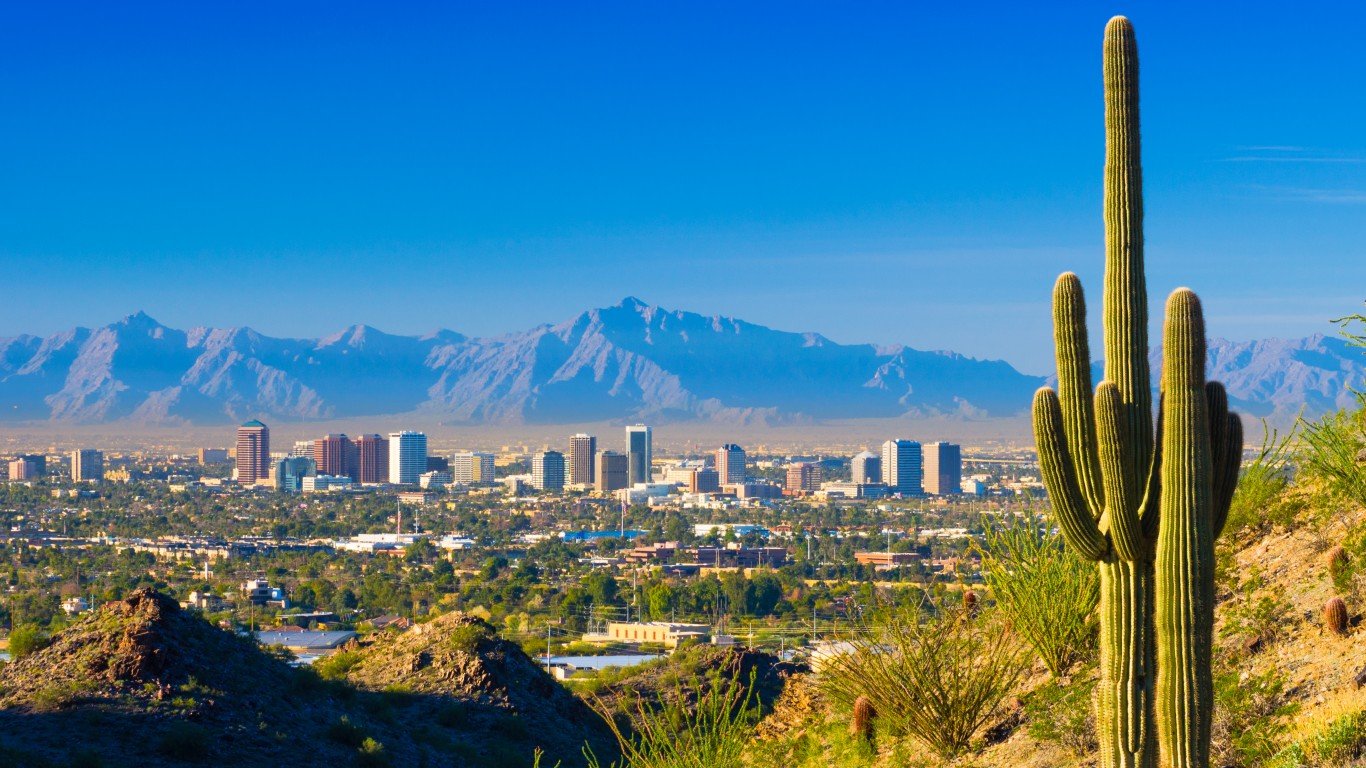
17. Arizona
> 2017 state and local gov’t pension contributions: $6,027 per gov’t worker
> Pension obligations funded: 62.2% (12th lowest)
> Workers in state and local gov’t: 357,700 (12.9% of labor force)
> 65 and older population: 1.2 million (17.1% of total)
See all stories featuring: Arizona
[in-text-ad-2]

Source: ddub3429 / Getty Images
16. Nevada
> 2017 state and local gov’t pension contributions: $6,410 per gov’t worker
> Pension obligations funded: 74.4% (24th highest)
> Workers in state and local gov’t: 141,600 (10.6% of labor force)
> 65 and older population: 458,679 (15.3% of total)
See all stories featuring: Nevada
Source: jbrazito / Flickr
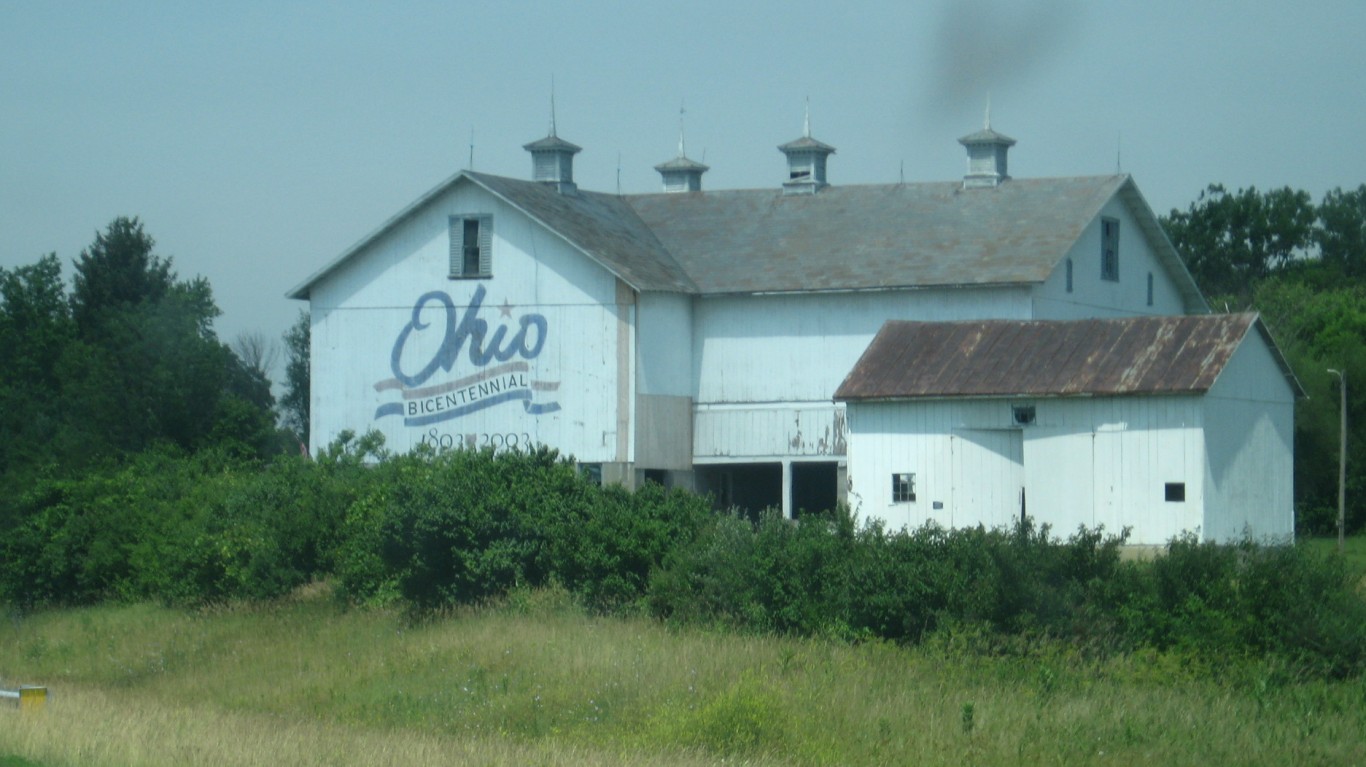
15. Ohio
> 2017 state and local gov’t pension contributions: $6,719 per gov’t worker
> Pension obligations funded: 80.1% (14th highest)
> Workers in state and local gov’t: 701,900 (12.7% of labor force)
> 65 and older population: 1.9 million (16.6% of total)
See all stories featuring: Ohio
[in-text-ad]

Source: Creative-Family / Getty Images
14. New Jersey
> 2017 state and local gov’t pension contributions: $6,740 per gov’t worker
> Pension obligations funded: 35.8% (2nd lowest)
> Workers in state and local gov’t: 552,300 (13.4% of labor force)
> 65 and older population: 1.4 million (15.7% of total)
See all stories featuring: New Jersey
 24/7 Wall St.
Source: RudyBalasko / Getty Images
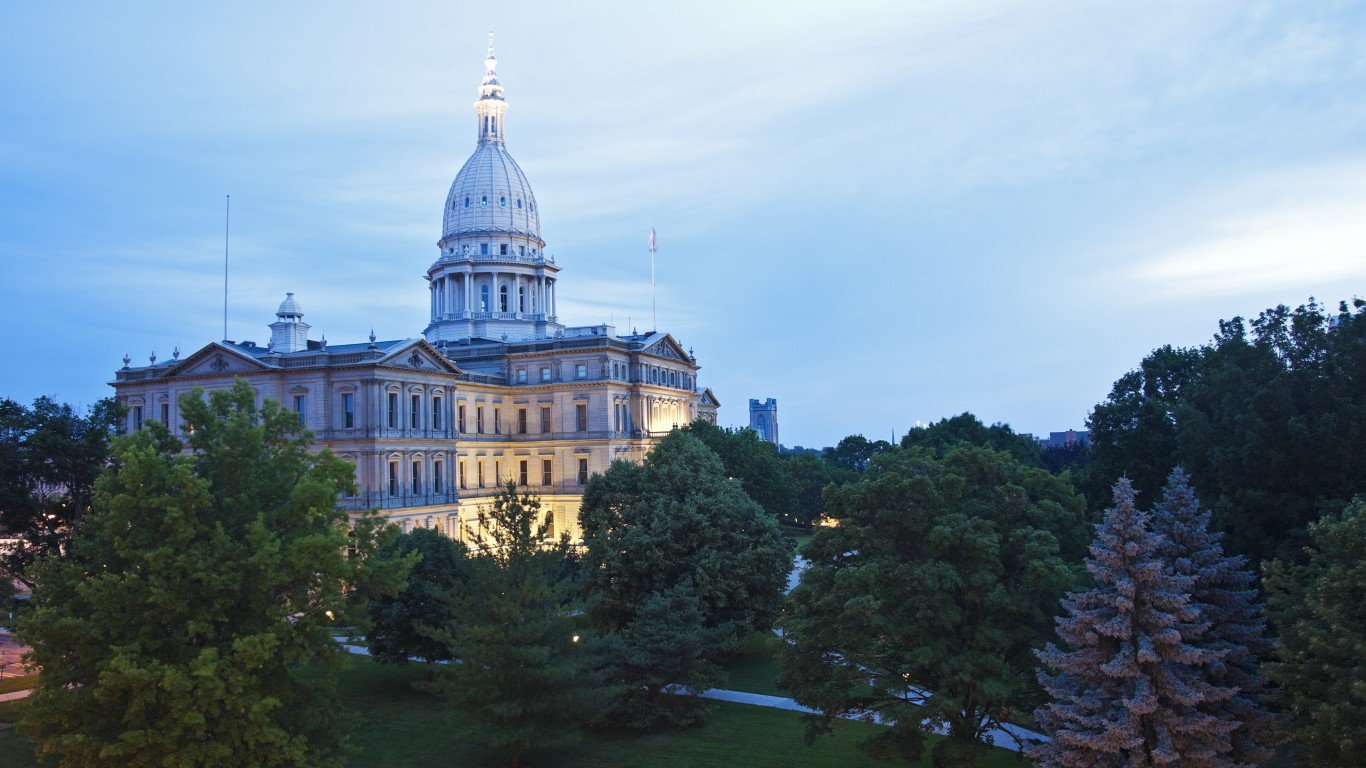
13. Michigan
> 2017 state and local gov’t pension contributions: $7,976 per gov’t worker
> Pension obligations funded: 65.1% (20th lowest)
> Workers in state and local gov’t: 551,100 (12.6% of labor force)
> 65 and older population: 1.7 million (16.7% of total)
See all stories featuring: Michigan

Source: stresstensor / Getty Images
12. Massachusetts
> 2017 state and local gov’t pension contributions: $7,977 per gov’t worker
> Pension obligations funded: 59.9% (10th lowest)
> Workers in state and local gov’t: 406,600 (11.3% of labor force)
> 65 and older population: 1.1 million (16.1% of total)
See all stories featuring: Massachusetts
[in-text-ad-2]

Source: ymn / Getty Images
11. Maryland
> 2017 state and local gov’t pension contributions: $8,043 per gov’t worker
> Pension obligations funded: 68.6% (23rd lowest)
> Workers in state and local gov’t: 357,300 (13.1% of labor force)
> 65 and older population: 902,586 (14.9% of total)
See all stories featuring: Maryland

Source: volvob12b / Flickr
10. Alaska
> 2017 state and local gov’t pension contributions: $8,115 per gov’t worker
> Pension obligations funded: 66.6% (21st lowest)
> Workers in state and local gov’t: 66,000 (20.0% of labor force)
> 65 and older population: 83,041 (11.2% of total)
See all stories featuring: Alaska
[in-text-ad]

Source: alexeys / Getty Images
9. Kentucky
> 2017 state and local gov’t pension contributions: $8,421 per gov’t worker
> Pension obligations funded: 33.9% (the lowest)
> Workers in state and local gov’t: 279,200 (14.5% of labor force)
> 65 and older population: 709,048 (15.9% of total)
See all stories featuring: Kentucky

Source: YinYang / Getty Images
8. Hawaii
> 2017 state and local gov’t pension contributions: $8,507 per gov’t worker
> Pension obligations funded: 54.8% (8th lowest)
> Workers in state and local gov’t: 92,200 (14.1% of labor force)
> 65 and older population: 253,750 (17.8% of total)
See all stories featuring: Hawaii

Source: Lisa-Blue / Getty Images
7. Louisiana
> 2017 state and local gov’t pension contributions: $8,937 per gov’t worker
> Pension obligations funded: 65.1% (20th lowest)
> Workers in state and local gov’t: 297,200 (15.1% of labor force)
> 65 and older population: 696,111 (14.9% of total)
See all stories featuring: Louisiana
[in-text-ad-2]
Source: pamwood707 / Flickr
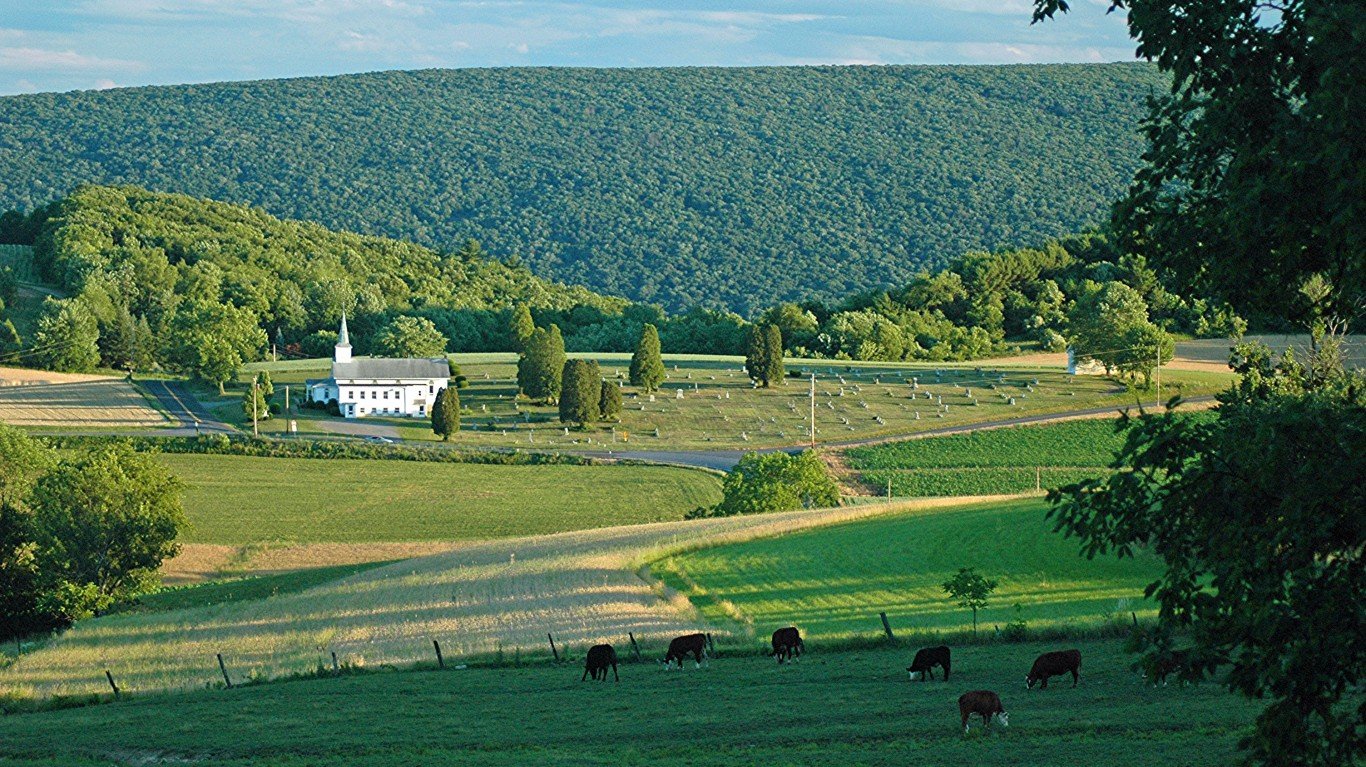
6. Pennsylvania
> 2017 state and local gov’t pension contributions: $12,068 per gov’t worker
> Pension obligations funded: 55.3% (9th lowest)
> Workers in state and local gov’t: 606,100 (10.2% of labor force)
> 65 and older population: 2.3 million (17.8% of total)
See all stories featuring: Pennsylvania

Source: Art Wager / Getty Images
5. California
> 2017 state and local gov’t pension contributions: $12,792 per gov’t worker
> Pension obligations funded: 68.9% (24th lowest)
> Workers in state and local gov’t: 2.3 million (13.8% of labor force)
> 65 and older population: 5.5 million (13.9% of total)
See all stories featuring: California
[in-text-ad]

Source: spyarm / Getty Images
4. New York
> 2017 state and local gov’t pension contributions: $12,880 per gov’t worker
> Pension obligations funded: 94.5% (4th highest)
> Workers in state and local gov’t: 1.7 million (14.3% of labor force)
> 65 and older population: 3.2 million (15.9% of total)
See all stories featuring: New York

Source: SeanPavonePhoto / Getty Images
3. Rhode Island
> 2017 state and local gov’t pension contributions: $13,777 per gov’t worker
> Pension obligations funded: 53.7% (6th lowest)
> Workers in state and local gov’t: 49,900 (10.1% of labor force)
> 65 and older population: 176,572 (16.7% of total)
See all stories featuring: Rhode Island

Source: DenisTangneyJr / Getty Images
2. Connecticut
> 2017 state and local gov’t pension contributions: $14,103 per gov’t worker
> Pension obligations funded: 45.7% (4th lowest)
> Workers in state and local gov’t: 220,500 (13.1% of labor force)
> 65 and older population: 601,094 (16.8% of total)
See all stories featuring: Connecticut
[in-text-ad-2]

Source: dszc / Getty Images
1. Illinois
> 2017 state and local gov’t pension contributions: $15,562 per gov’t worker
> Pension obligations funded: 38.4% (3rd lowest)
> Workers in state and local gov’t: 747,700 (12.3% of labor force)
> 65 and older population: 1.9 million (15.2% of total)
See all stories featuring: Illinois
Methodology
To identify the states spending the most to fund their residents’s retirement, 24/7 Wall St. reviewed total state and local government pension contributions in 2017. We adjusted that figure per state and local government worker using 2017 data. State and local government pension spending came from the U.S. Census Bureau’s 2017 Annual Survey of Public Pensions and public sector employment came from the Bureau of Labor Statistics. We also considered each state’s pension funding ratio, which is the share of pension obligations that have funding from Pew Charitable Trusts, a public policy advocacy group. The share of the population 65 and older came from the U.S. Census Bureau’s 2017 American Community Survey.
Sponsored: Find a Qualified Financial Advisor
Finding a qualified financial advisor doesn’t have to be hard. SmartAsset’s free tool matches you with up to 3 fiduciary financial advisors in your area in 5 minutes. Each advisor has been vetted by SmartAsset and is held to a fiduciary standard to act in your best interests. If you’re ready to be matched with local advisors that can help you achieve your financial goals, get started now.
Thank you for reading! Have some feedback for us?
Contact the 24/7 Wall St. editorial team.
Editors' Picks

