40 Places Young People Are Moving
August 7, 2019 by Sam StebbinsAmericans are far less likely to pick up and move now than they have been in decades. Just 32.4 million Americans moved to a new home in 2018, the fewest since at least 1999, when over 42 million Americans moved.
Young people, who are less likely to be tethered by a family or mortgage, are not an exception to this trend. Mobility among young adults between the ages of 25 and 35 recently hit its lowest level in 50 years. Still, the majority of Americans who have moved in 2017 are under the age of 30. And among this relatively mobile age demographic, some areas are far more popular than others.
Using data from the U.S. Census Bureau’s American Community Survey, 24/7 Wall St. reviewed county level migration of young adults to identify the 40 places where young people are moving. We ranked the counties and county equivalents based on the number of 18 to 34 year-olds who moved there in 2017 as a share of the total county population. Independent cities that do not fall under the jurisdiction of a county were included in our analysis.
One of the most common reasons Americans move is for their career or a new job — and many counties on this list offer access to stable employment opportunities. These include Pulaski County, Missouri, which is home to a U.S. Army base; Arlington County, Virginia, which is located just outside the nation’s capital; and several others, like Benton County, Oregon, that are home to major universities and research institutions
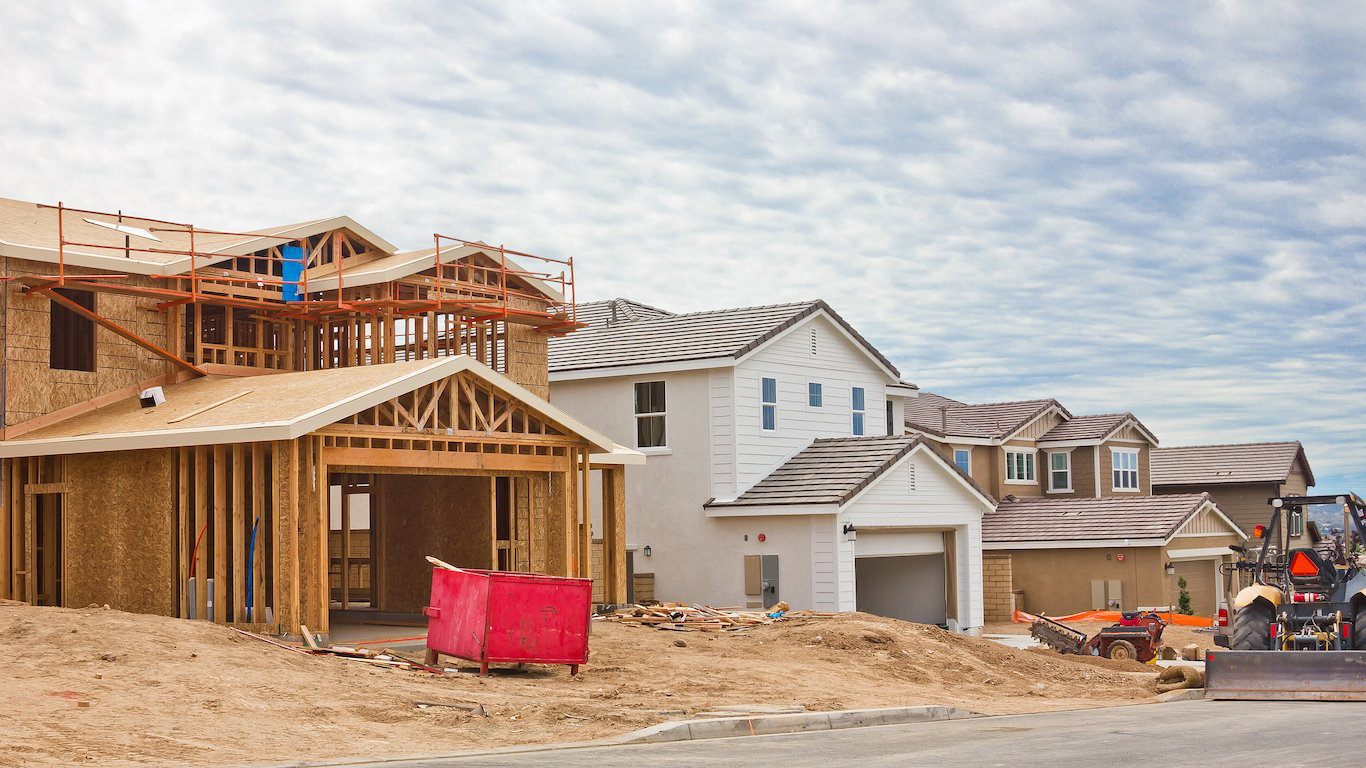
Two other common reasons Americans cite for moving are a desire for cheaper housing and a desire to own a home rather than rent. And low housing costs may partially explain why many of the counties on this list are drawing in so many new, young residents. In well over half of the 40 counties where young people are moving, the typical home costs less than $193,500, the median home value nationwide. Of course, housing affordability is a consideration Americans of any age should take into account when moving to a new area. These are America’s 25 most affordable housing markets.
The influx of young people has a substantial impact on the overall demographic makeup of the counties on this list. Based on median age, each of the 40 counties young people are moving to is younger than the nation as a whole. In fact, several counties on this list also rank as the youngest county in their respective state. Here is a full list of the youngest county in each state.
Click here to see the 40 places young people are moving
Click here to read our methodology
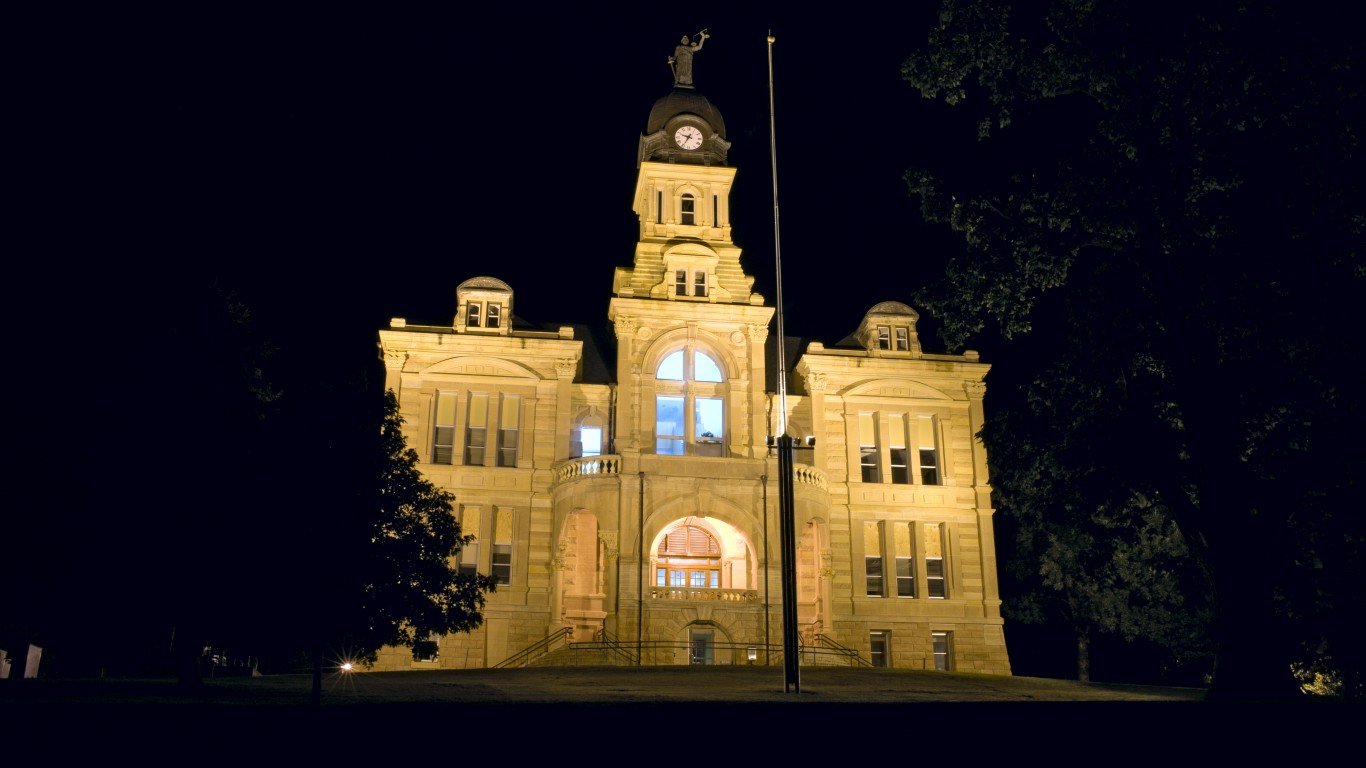
40. Blue Earth County, Minnesota
> Young adults who arrived in 2017: 8.1% of population
> Median age: 30.9 years (7.4 yrs less than U.S.)
> Median home value: $170,800
> Unemployment rate: 3.2%
[in-text-ad]

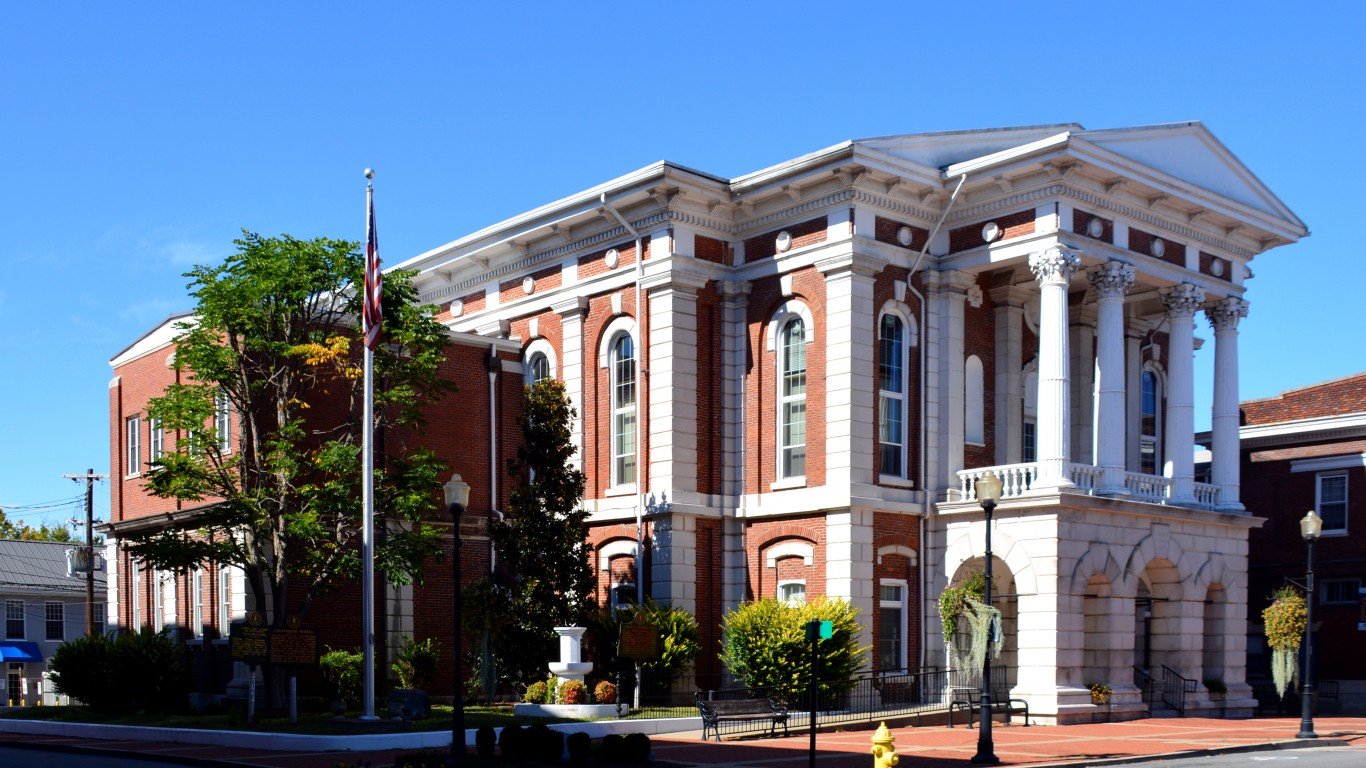
39. Jackson County, North Carolina
> Young adults who arrived in 2017: 8.2% of population
> Median age: 37.5 years (0.8 yrs less than U.S.)
> Median home value: $177,200
> Unemployment rate: 4.7%
38. Christian County, Kentucky
> Young adults who arrived in 2017: 8.2% of population
> Median age: 28.8 years (9.5 yrs less than U.S.)
> Median home value: $112,200
> Unemployment rate: 6.3%
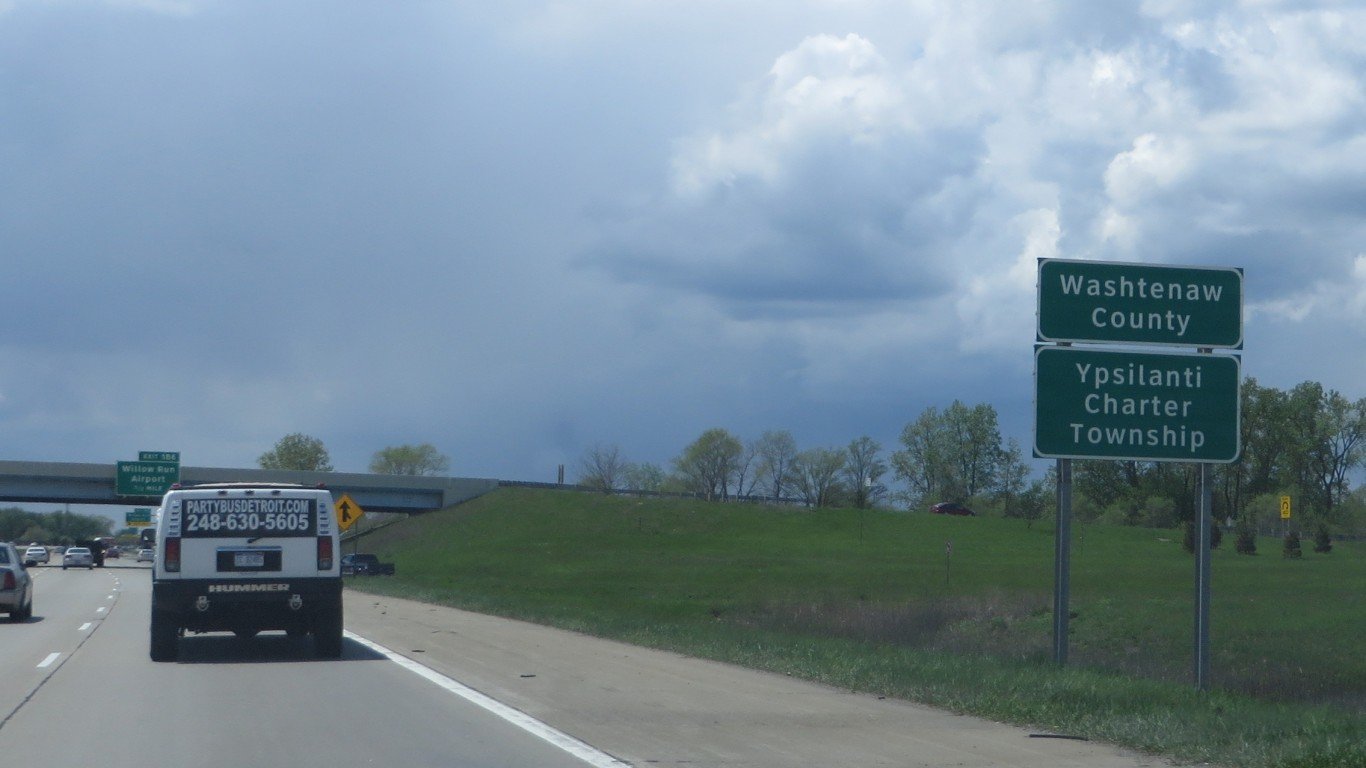
37. Washtenaw County, Michigan
> Young adults who arrived in 2017: 8.2% of population
> Median age: 33.8 years (4.5 yrs less than U.S.)
> Median home value: $231,500
> Unemployment rate: 3.5%
[in-text-ad-2]

36. Arlington County, Virginia
> Young adults who arrived in 2017: 8.2% of population
> Median age: 34.7 years (3.6 yrs less than U.S.)
> Median home value: $643,300
> Unemployment rate: 2.0%
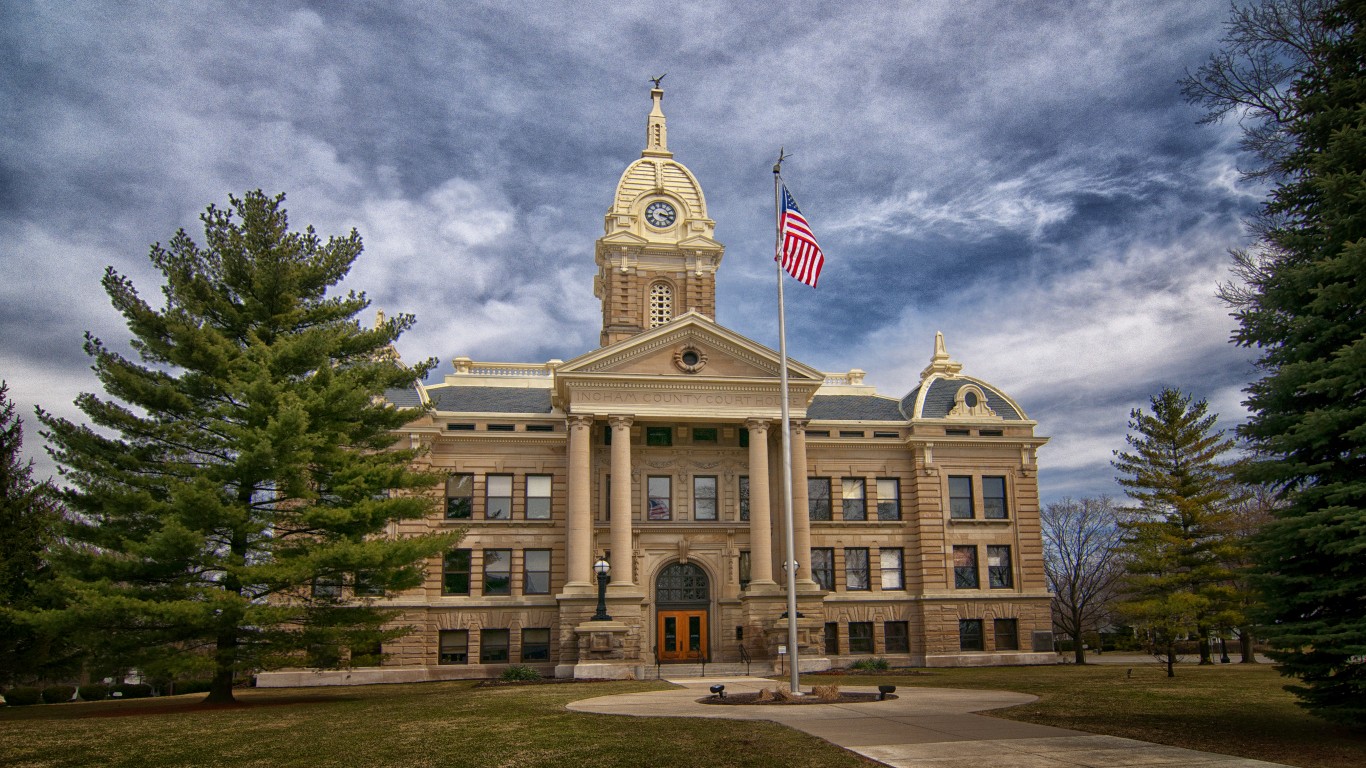
35. Ingham County, Michigan
> Young adults who arrived in 2017: 8.3% of population
> Median age: 32.1 years (6.2 yrs less than U.S.)
> Median home value: $123,700
> Unemployment rate: 4.1%
[in-text-ad]
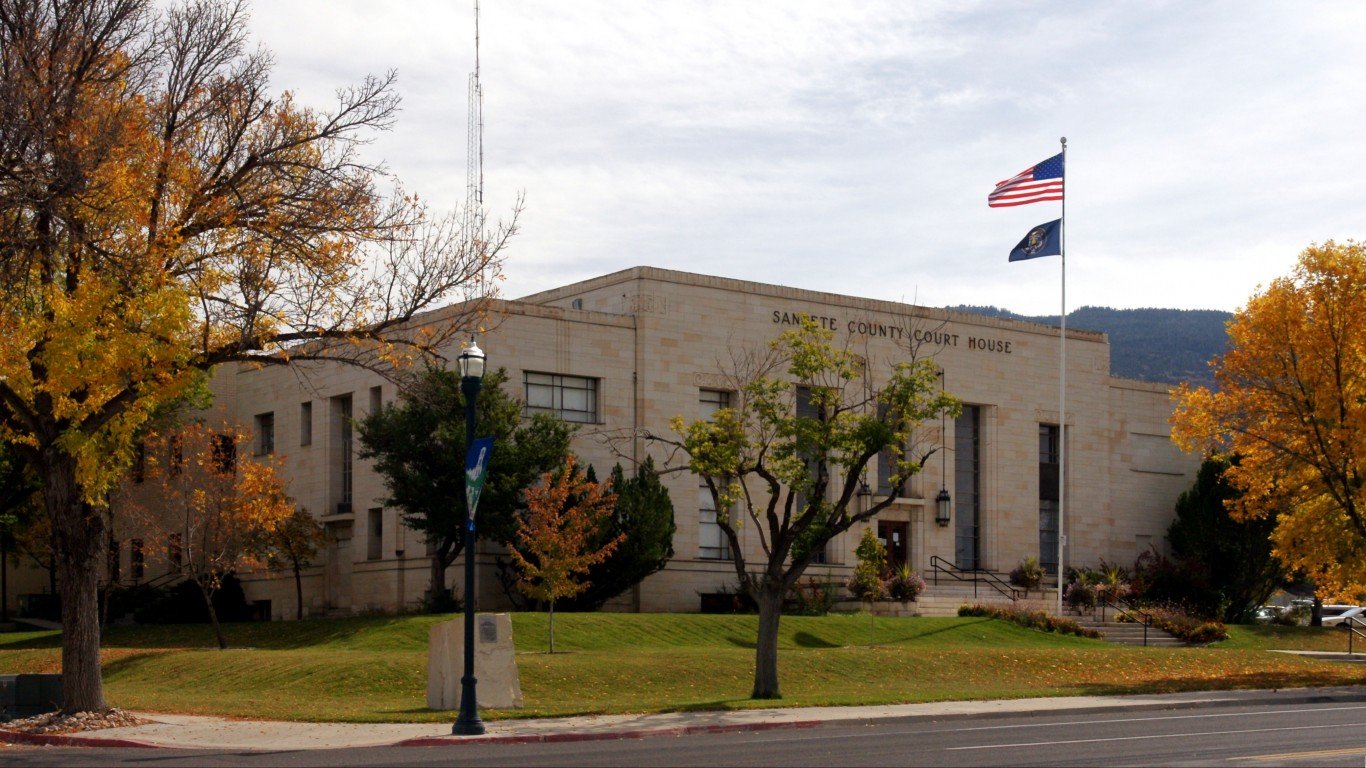
34. Sanpete County, Utah
> Young adults who arrived in 2017: 8.3% of population
> Median age: 32.0 years (6.3 yrs less than U.S.)
> Median home value: $169,400
> Unemployment rate: 4.1%

33. Richland County, South Carolina
> Young adults who arrived in 2017: 8.4% of population
> Median age: 33.4 years (4.9 yrs less than U.S.)
> Median home value: $154,100
> Unemployment rate: 3.6%
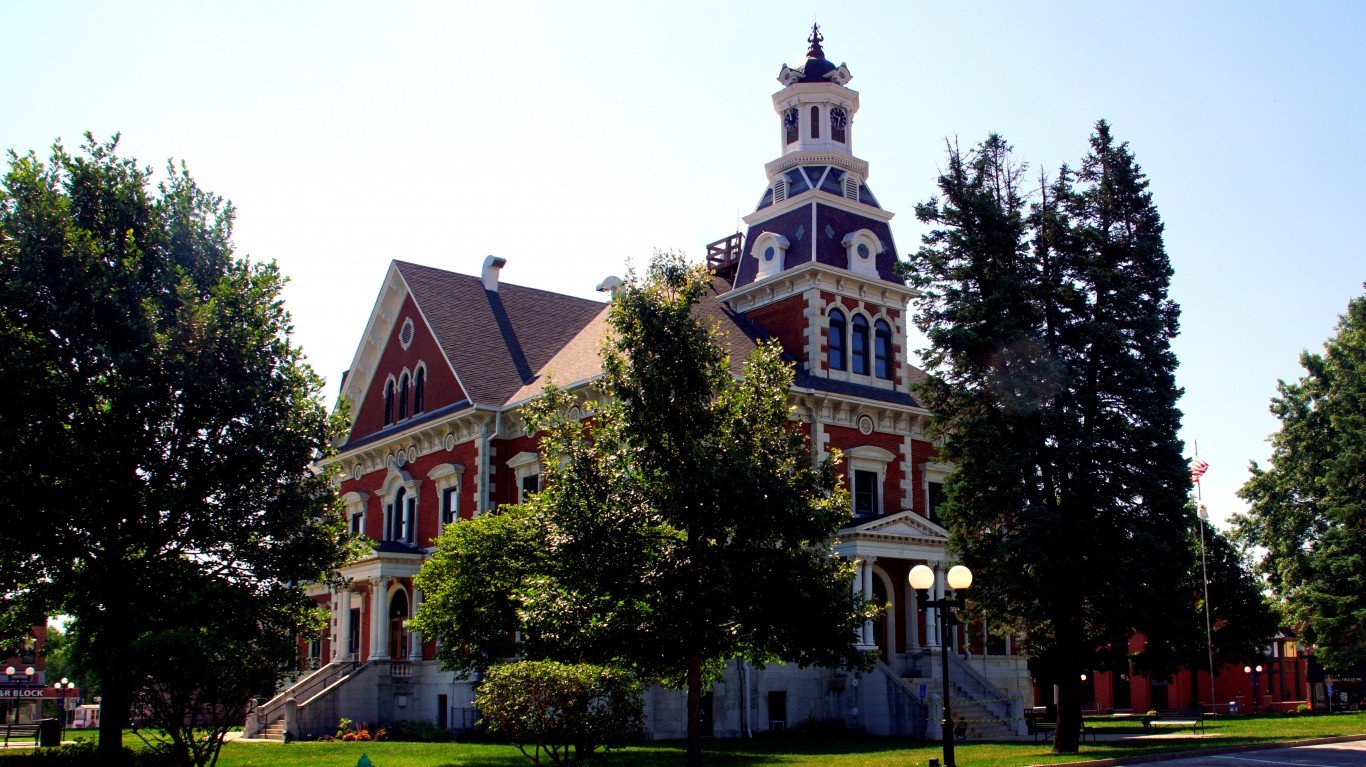
32. McDonough County, Illinois
> Young adults who arrived in 2017: 8.4% of population
> Median age: 31.6 years (6.7 yrs less than U.S.)
> Median home value: $94,600
> Unemployment rate: 5.2%
[in-text-ad-2]
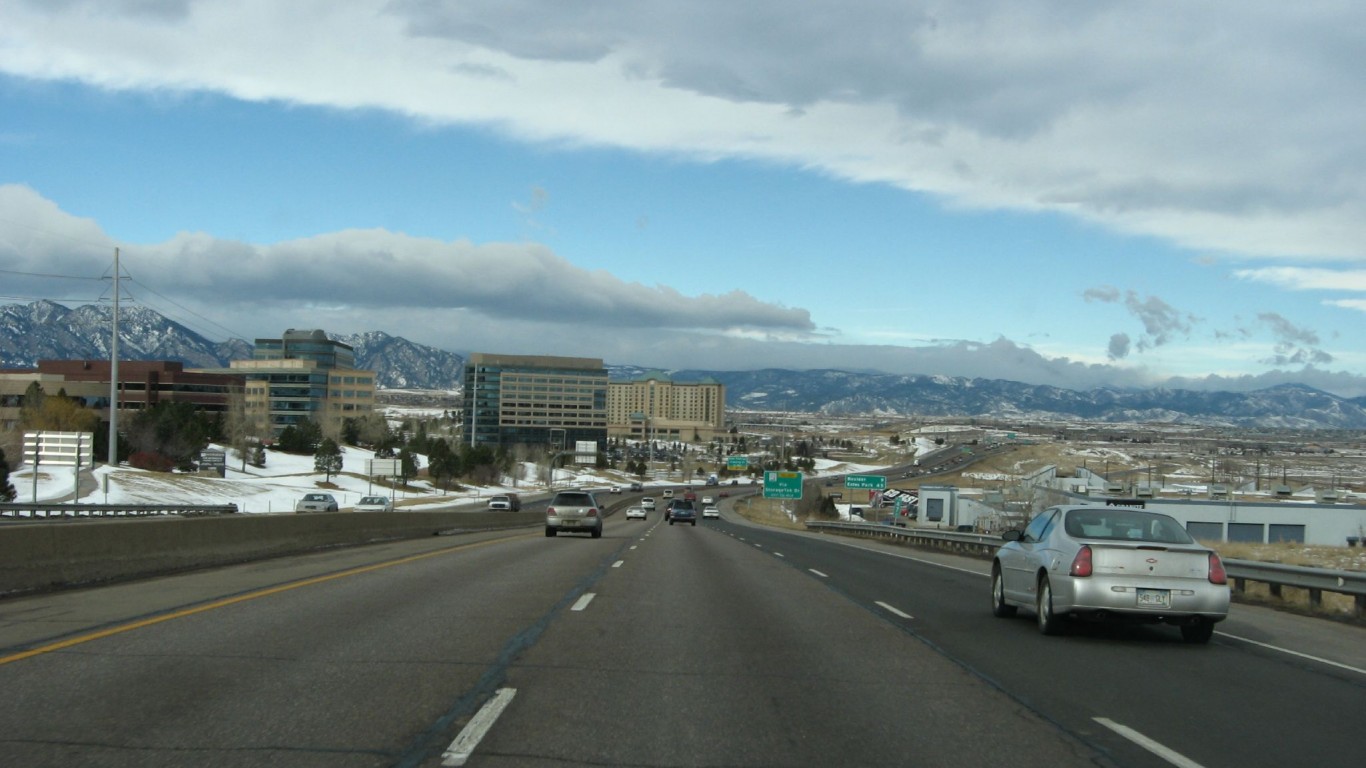
31. Broomfield County, Colorado
> Young adults who arrived in 2017: 8.5% of population
> Median age: 38.2 years (0.1 yrs less than U.S.)
> Median home value: $356,500
> Unemployment rate: 2.7%
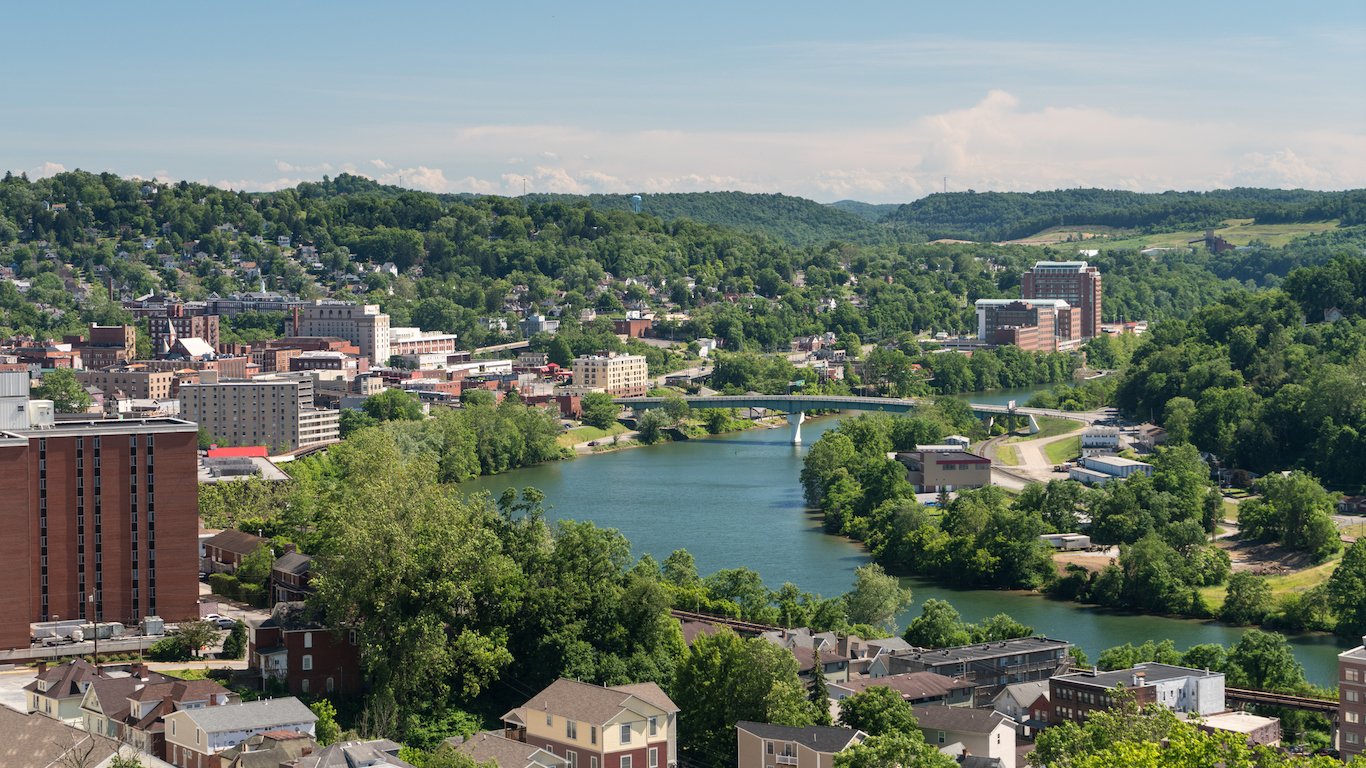
30. Monongalia County, West Virginia
> Young adults who arrived in 2017: 8.5% of population
> Median age: 31.2 years (7.1 yrs less than U.S.)
> Median home value: $178,200
> Unemployment rate: 4.2%
[in-text-ad]
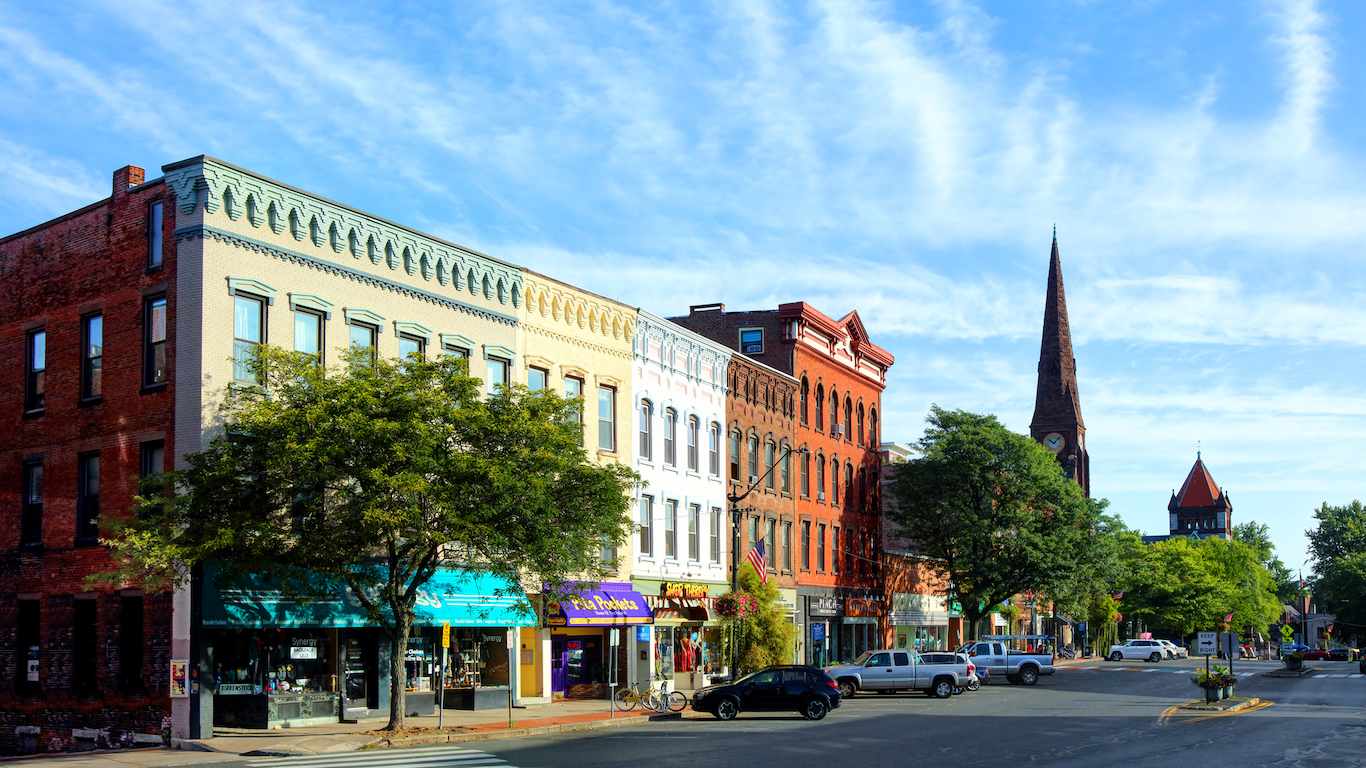
29. Hampshire County, Massachusetts
> Young adults who arrived in 2017: 8.5% of population
> Median age: 36.5 years (1.8 yrs less than U.S.)
> Median home value: $272,700
> Unemployment rate: 3.1%
 24/7 Wall St.
28. Comanche County, Oklahoma
> Young adults who arrived in 2017: 8.6% of population
> Median age: 33.1 years (5.2 yrs less than U.S.)
> Median home value: $125,600
> Unemployment rate: 3.8%

27. Orange County, North Carolina
> Young adults who arrived in 2017: 8.7% of population
> Median age: 34.6 years (3.7 yrs less than U.S.)
> Median home value: $283,000
> Unemployment rate: 4.0%
[in-text-ad-2]
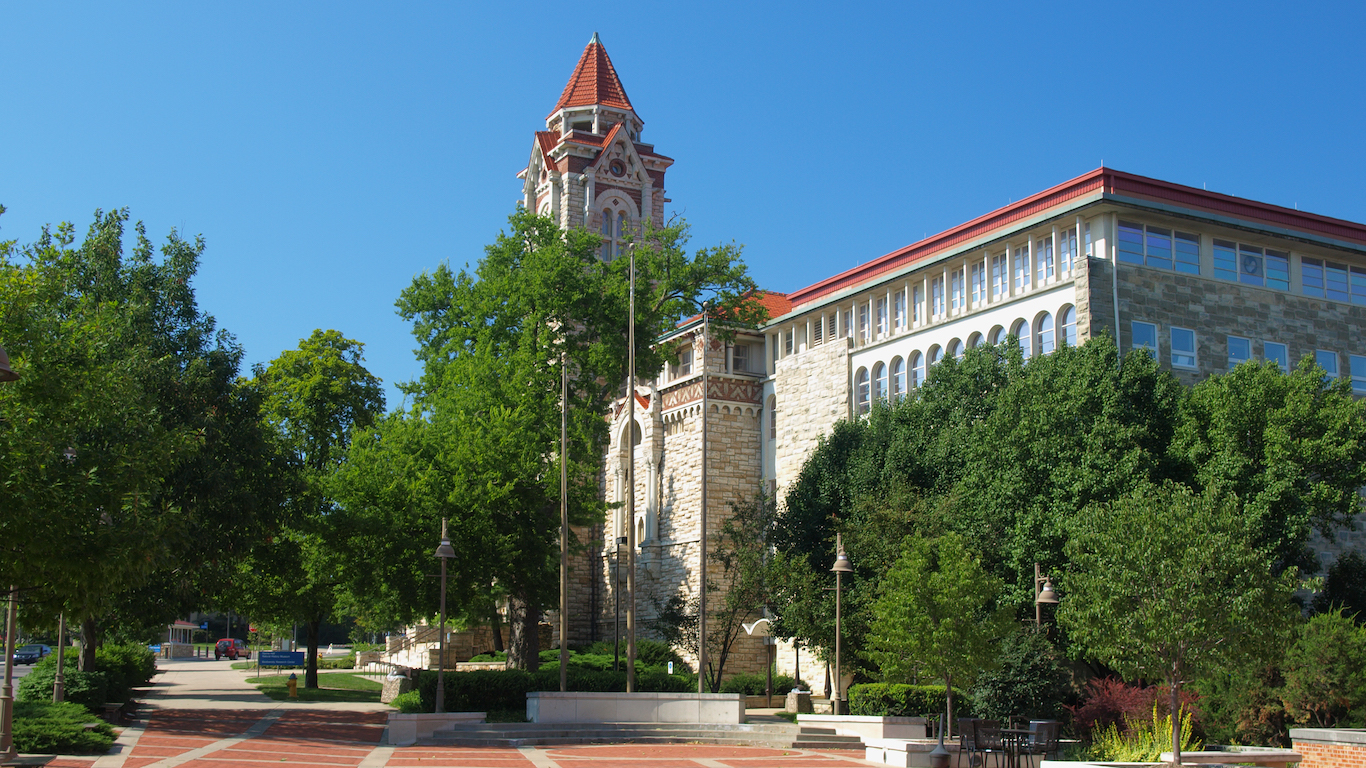
26. Douglas County, Kansas
> Young adults who arrived in 2017: 8.7% of population
> Median age: 29.5 years (8.8 yrs less than U.S.)
> Median home value: $188,100
> Unemployment rate: 3.1%
25. Tippecanoe County, Indiana
> Young adults who arrived in 2017: 8.8% of population
> Median age: 28.5 years (9.8 yrs less than U.S.)
> Median home value: $144,300
> Unemployment rate: 3.3%
[in-text-ad]

24. Grand Forks County, North Dakota
> Young adults who arrived in 2017: 9.0% of population
> Median age: 29.8 years (8.5 yrs less than U.S.)
> Median home value: $181,600
> Unemployment rate: 2.6%
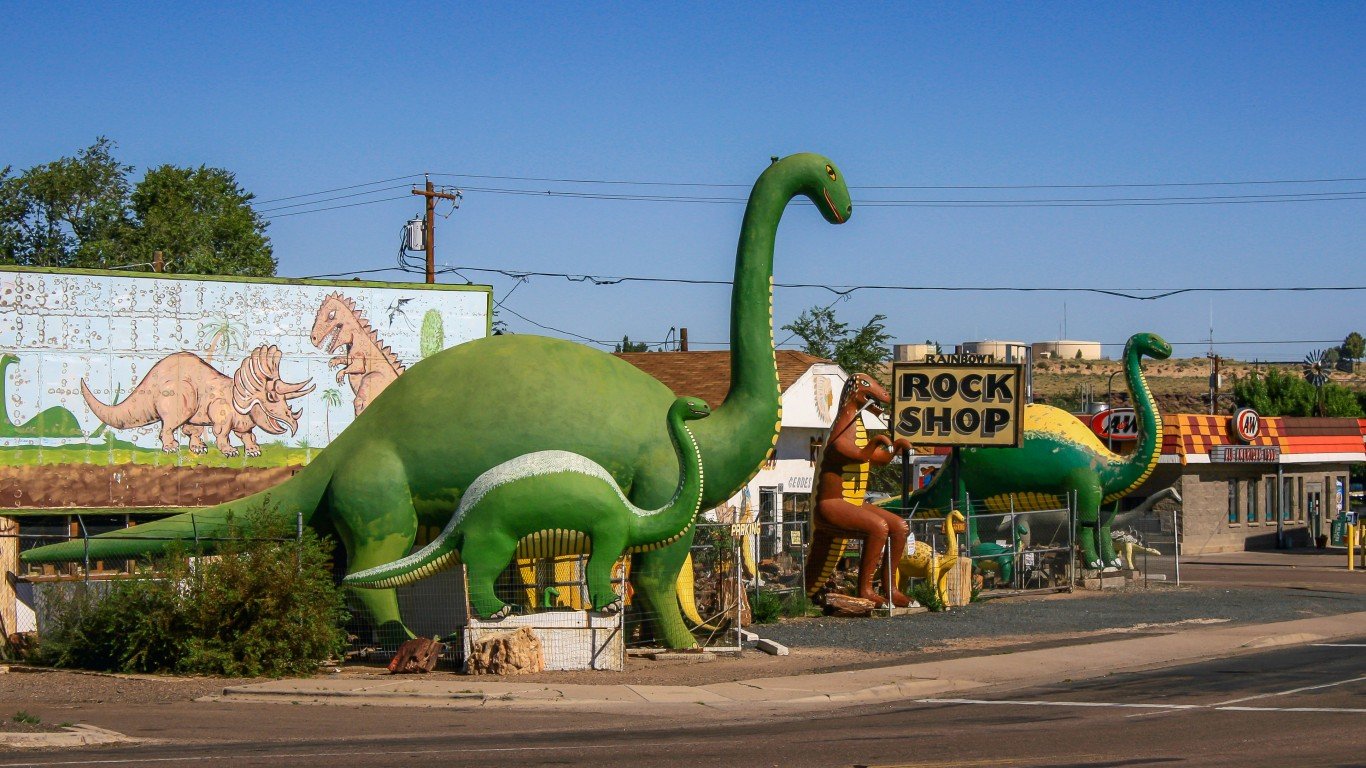
23. Coconino County, Arizona
> Young adults who arrived in 2017: 9.0% of population
> Median age: 30.9 years (7.4 yrs less than U.S.)
> Median home value: $241,400
> Unemployment rate: 6.1%
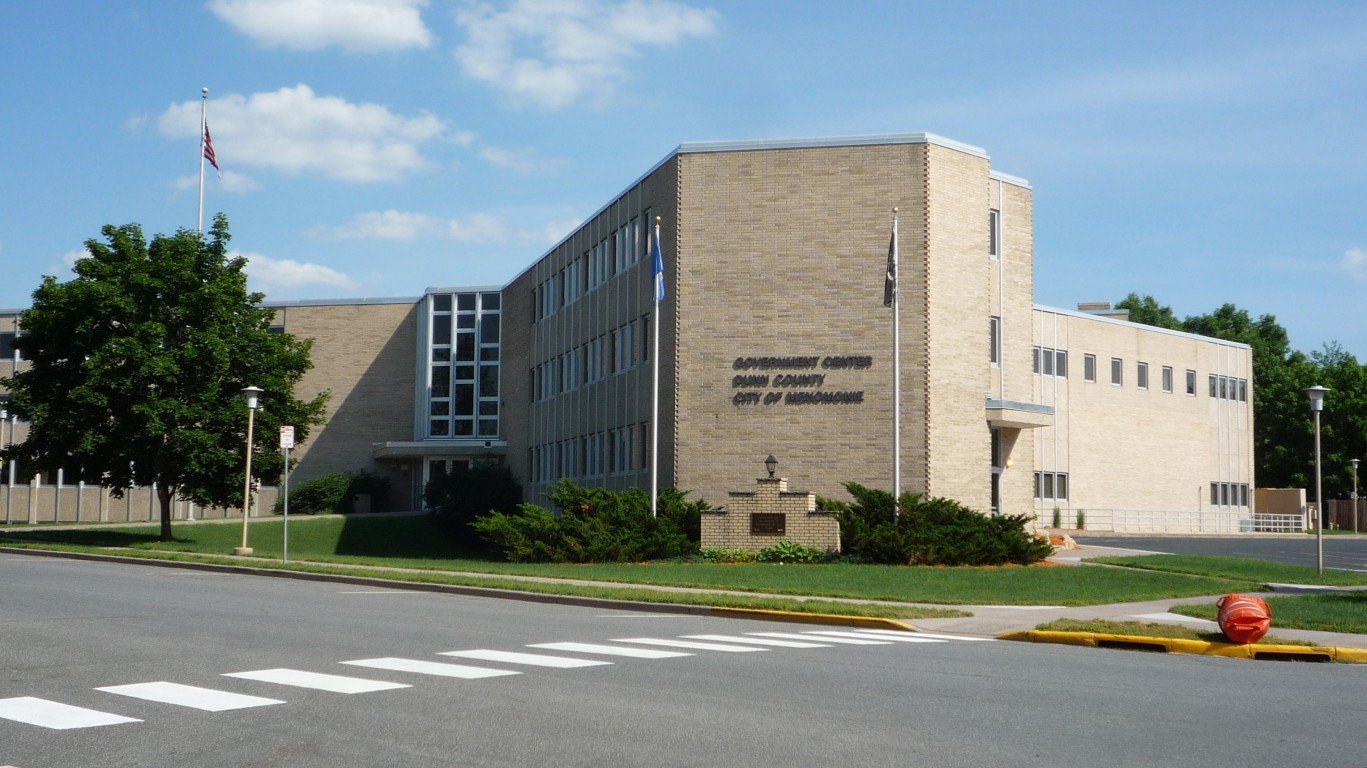
22. Dunn County, Wisconsin
> Young adults who arrived in 2017: 9.0% of population
> Median age: 34.8 years (3.5 yrs less than U.S.)
> Median home value: $156,700
> Unemployment rate: 3.7%
[in-text-ad-2]

21. Pierce County, Wisconsin
> Young adults who arrived in 2017: 9.0% of population
> Median age: 37.2 years (1.1 yrs less than U.S.)
> Median home value: $193,300
> Unemployment rate: 3.3%
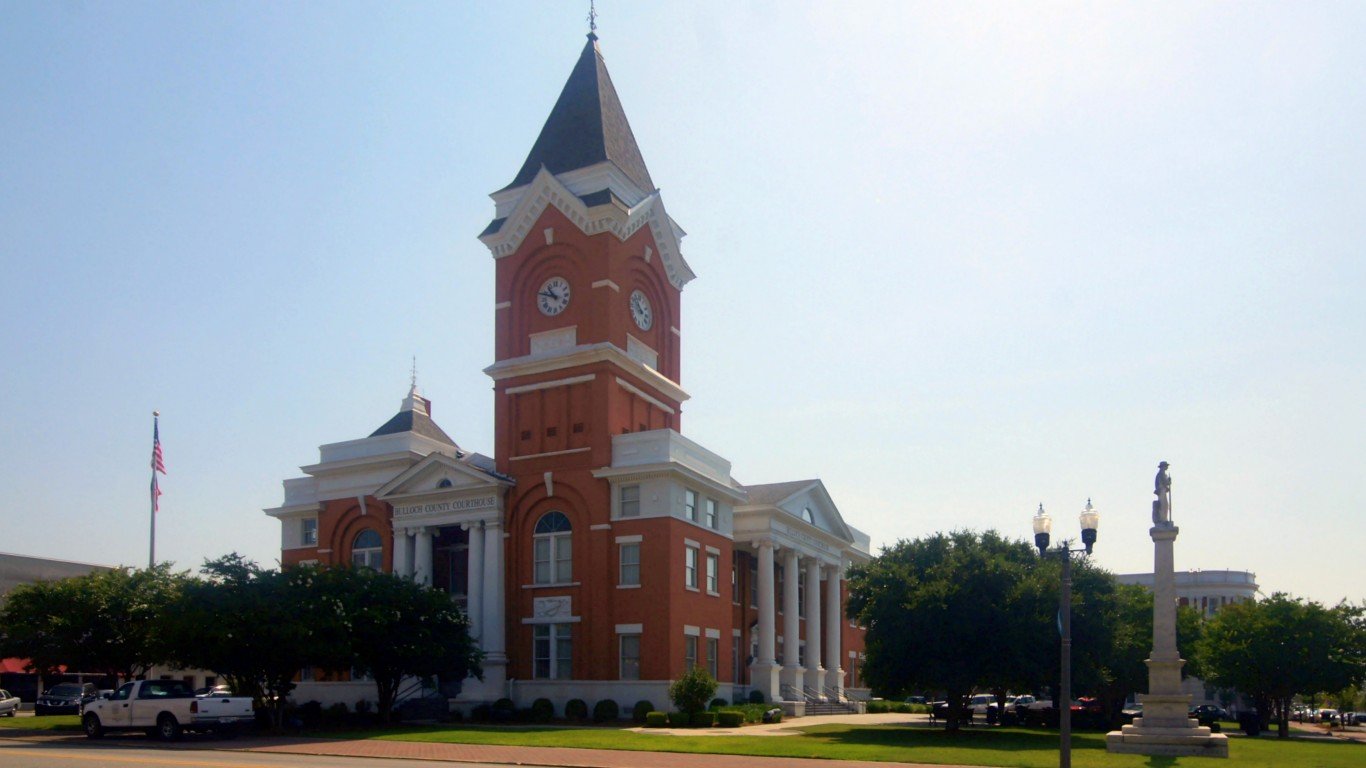
20. Bulloch County, Georgia
> Young adults who arrived in 2017: 9.0% of population
> Median age: 28.5 years (9.8 yrs less than U.S.)
> Median home value: $131,200
> Unemployment rate: 4.5%
[in-text-ad]
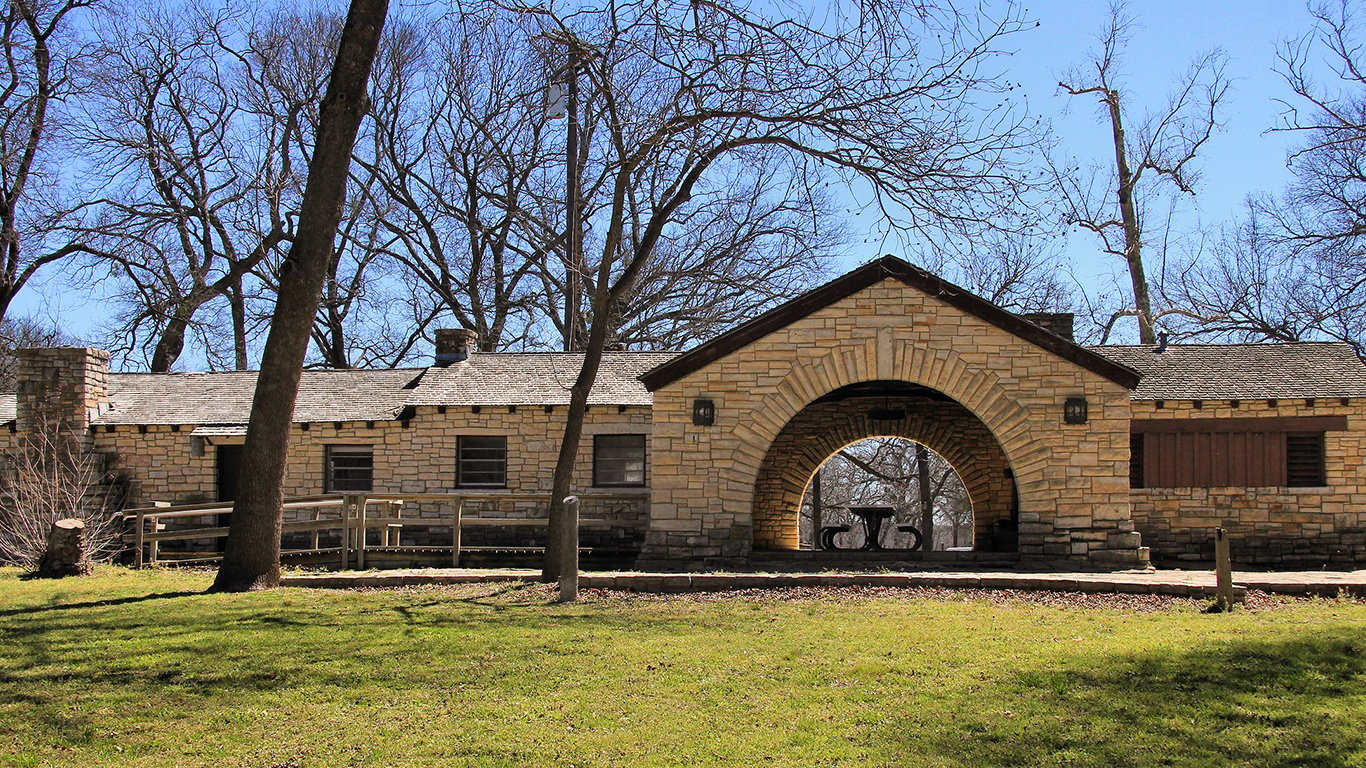
19. Coryell County, Texas
> Young adults who arrived in 2017: 9.2% of population
> Median age: 31.5 years (6.8 yrs less than U.S.)
> Median home value: $107,700
> Unemployment rate: 4.0%

18. Lynchburg, Virginia
> Young adults who arrived in 2017: 9.2% of population
> Median age: 28.8 years (9.5 yrs less than U.S.)
> Median home value: $153,800
> Unemployment rate: 4.3%
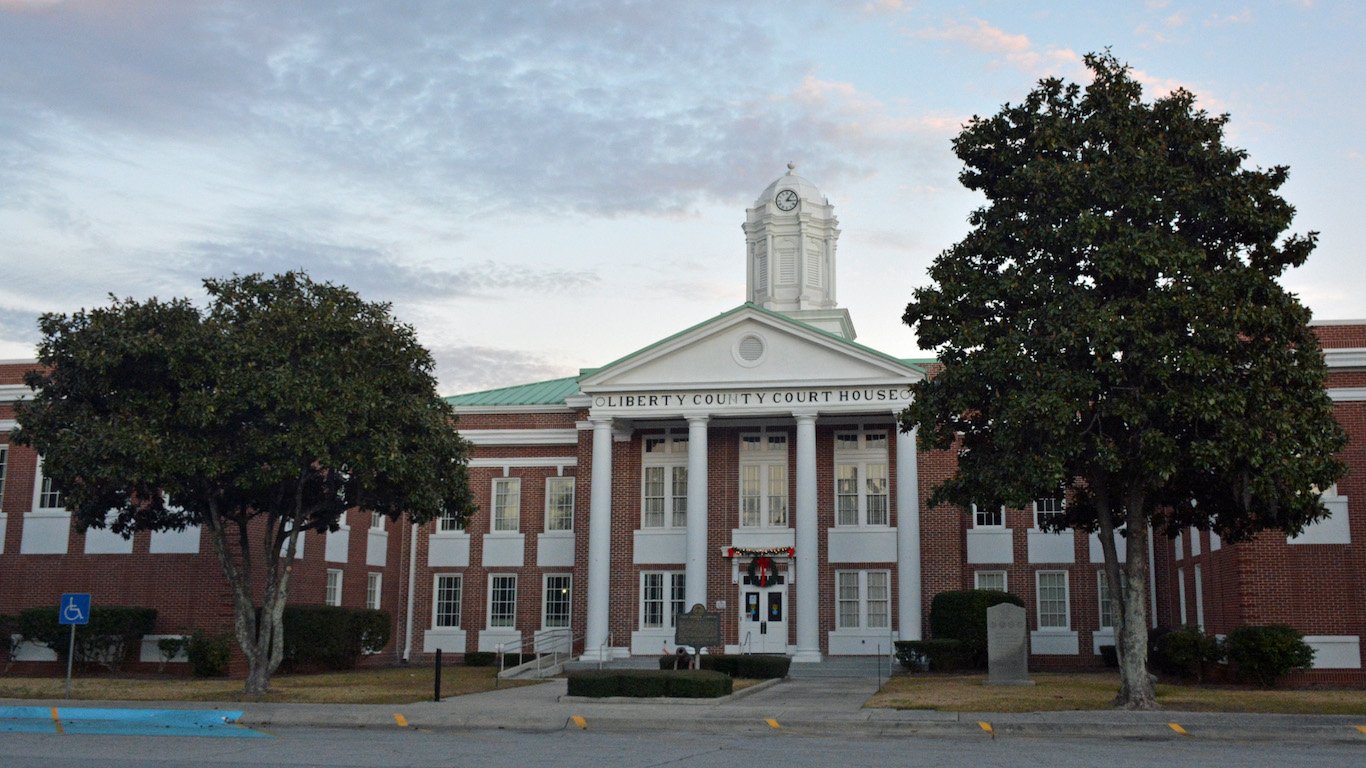
17. Liberty County, Georgia
> Young adults who arrived in 2017: 9.3% of population
> Median age: 28.4 years (9.9 yrs less than U.S.)
> Median home value: $120,500
> Unemployment rate: 4.4%
[in-text-ad-2]
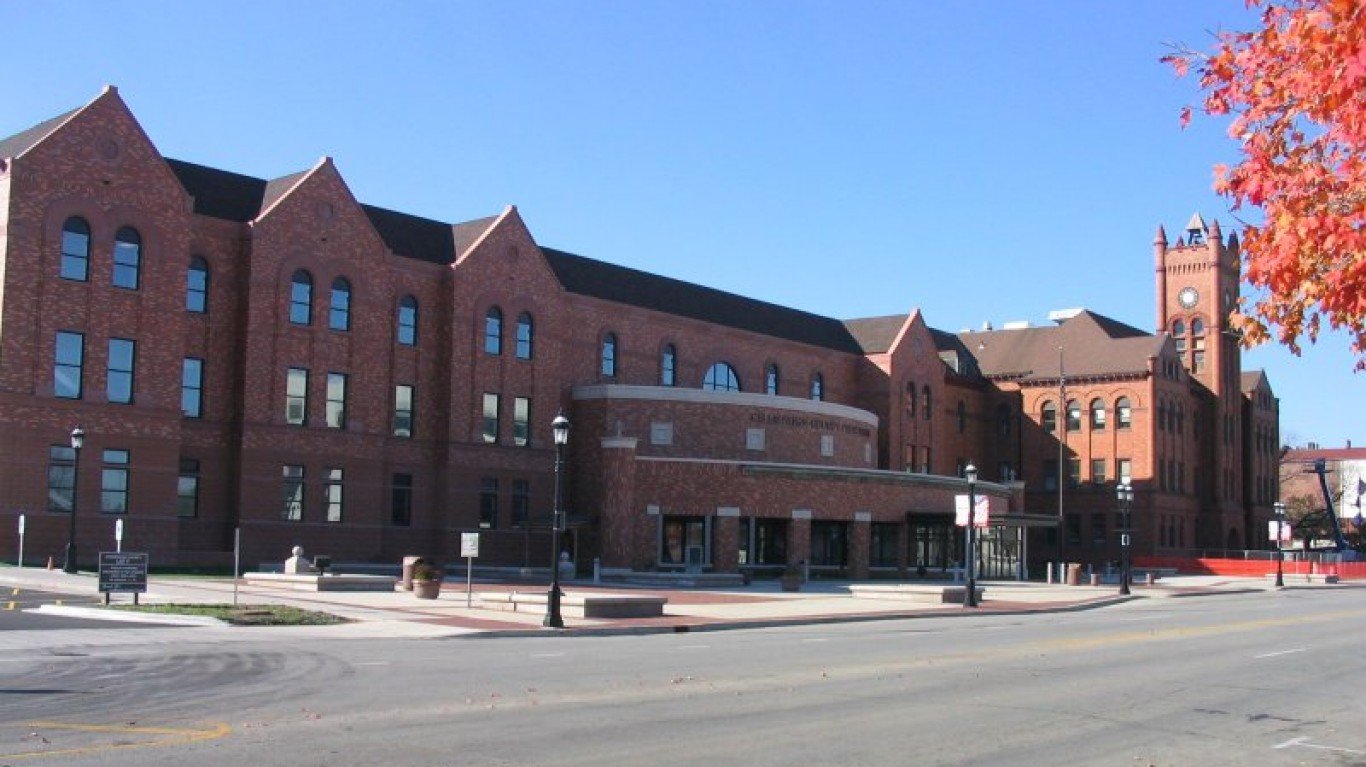
16. Champaign County, Illinois
> Young adults who arrived in 2017: 9.7% of population
> Median age: 30.1 years (8.2 yrs less than U.S.)
> Median home value: $154,800
> Unemployment rate: 3.8%

15. Norfolk, Virginia
> Young adults who arrived in 2017: 9.9% of population
> Median age: 30.8 years (7.5 yrs less than U.S.)
> Median home value: $194,800
> Unemployment rate: 3.6%
[in-text-ad]
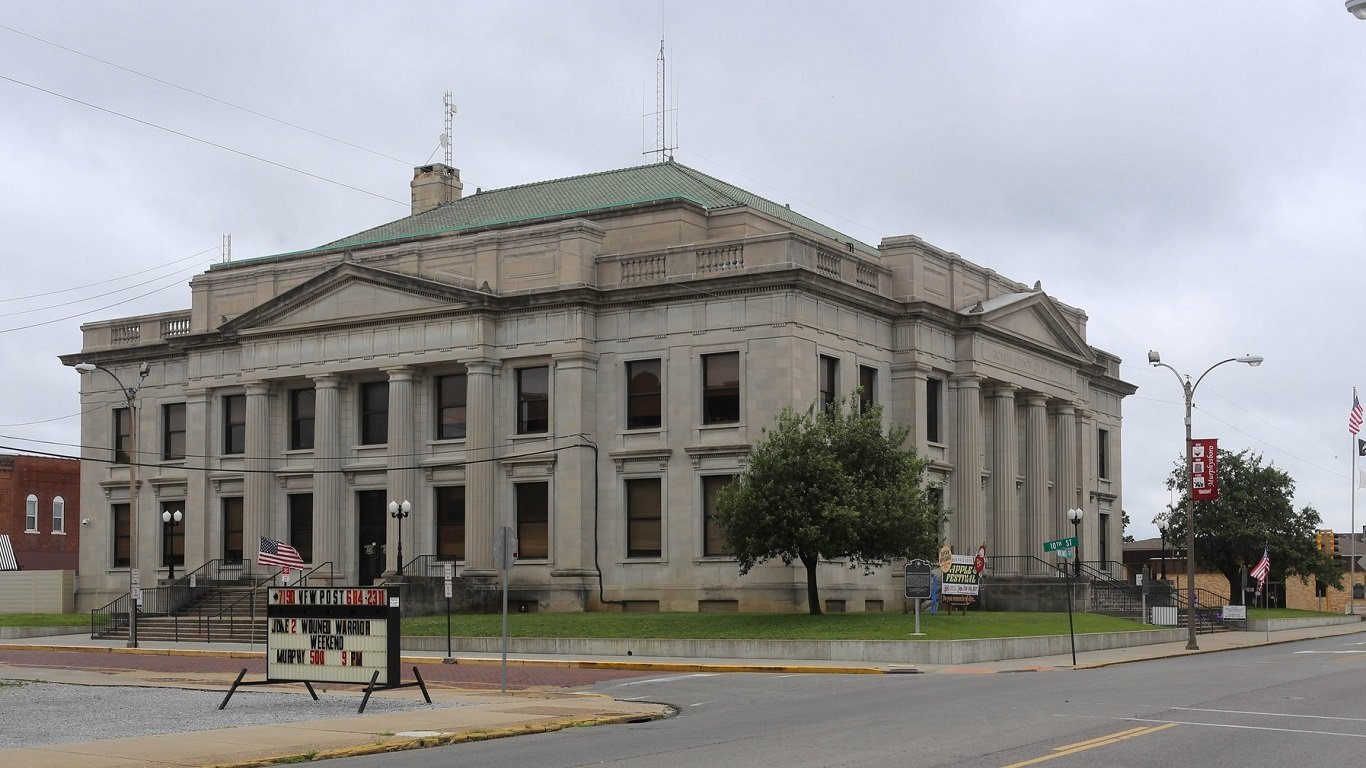
14. Jackson County, Illinois
> Young adults who arrived in 2017: 10.4% of population
> Median age: 31.4 years (6.9 yrs less than U.S.)
> Median home value: $108,600
> Unemployment rate: 3.8%
 24/7 Wall St.
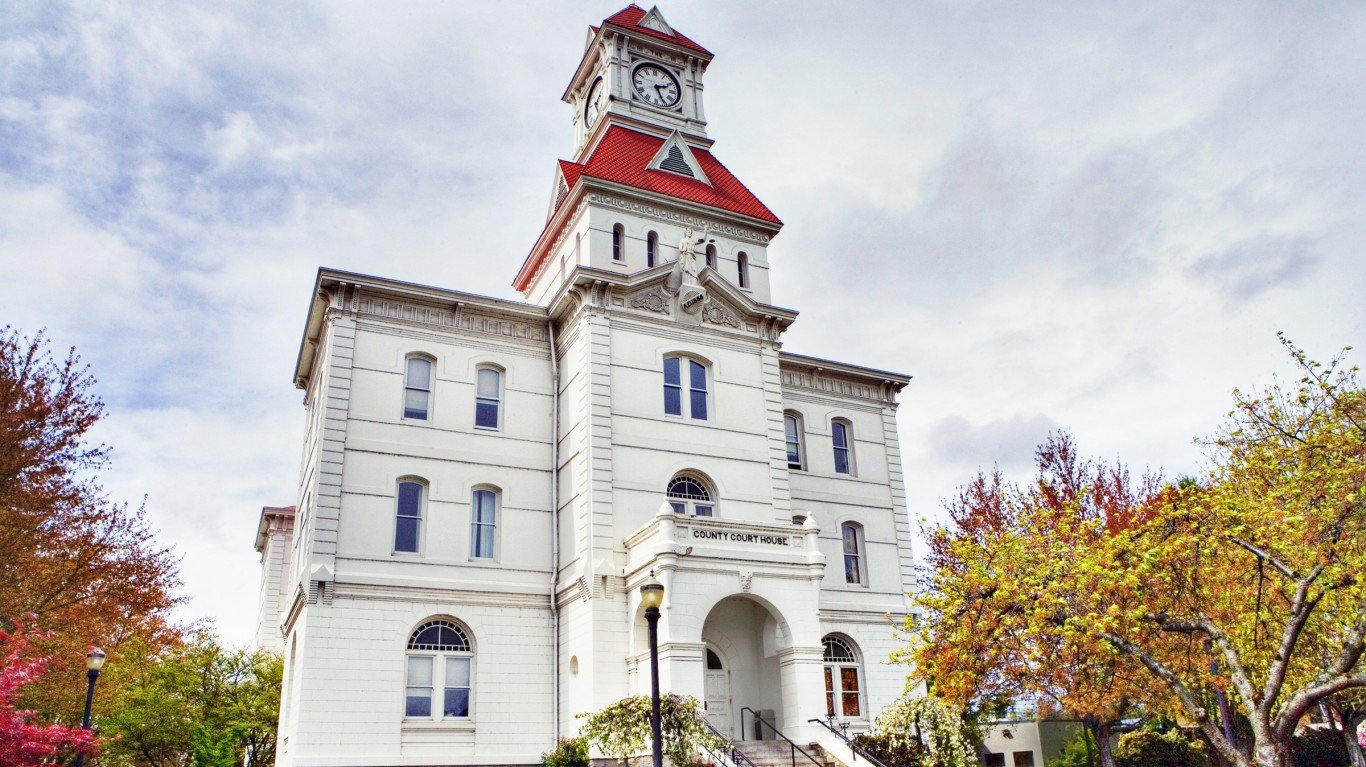
13. Benton County, Oregon
> Young adults who arrived in 2017: 10.4% of population
> Median age: 33.2 years (5.1 yrs less than U.S.)
> Median home value: $288,700
> Unemployment rate: 3.4%

12. Johnson County, Missouri
> Young adults who arrived in 2017: 10.5% of population
> Median age: 30.4 years (7.9 yrs less than U.S.)
> Median home value: $147,000
> Unemployment rate: 4.0%
[in-text-ad-2]
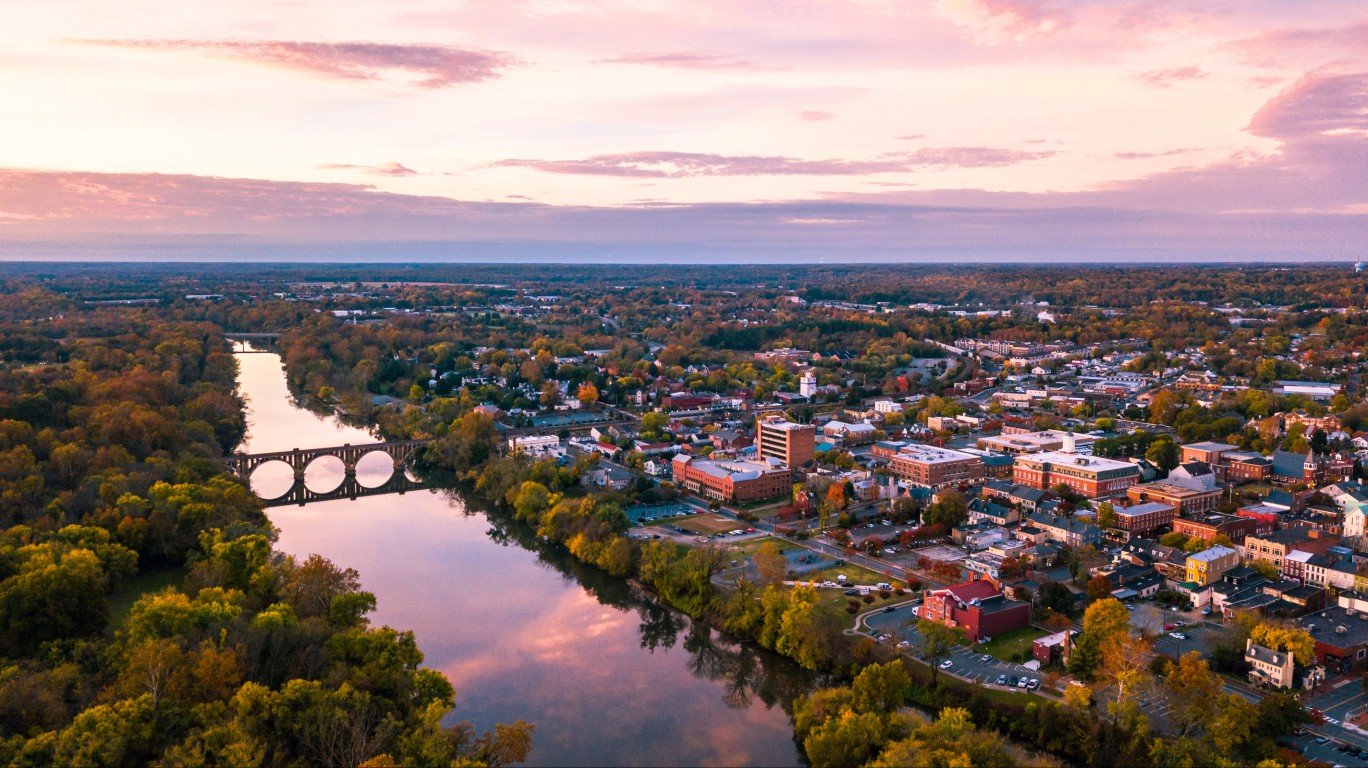
11. Fredericksburg, Virginia
> Young adults who arrived in 2017: 10.9% of population
> Median age: 30.7 years (7.6 yrs less than U.S.)
> Median home value: $341,200
> Unemployment rate: 3.6%
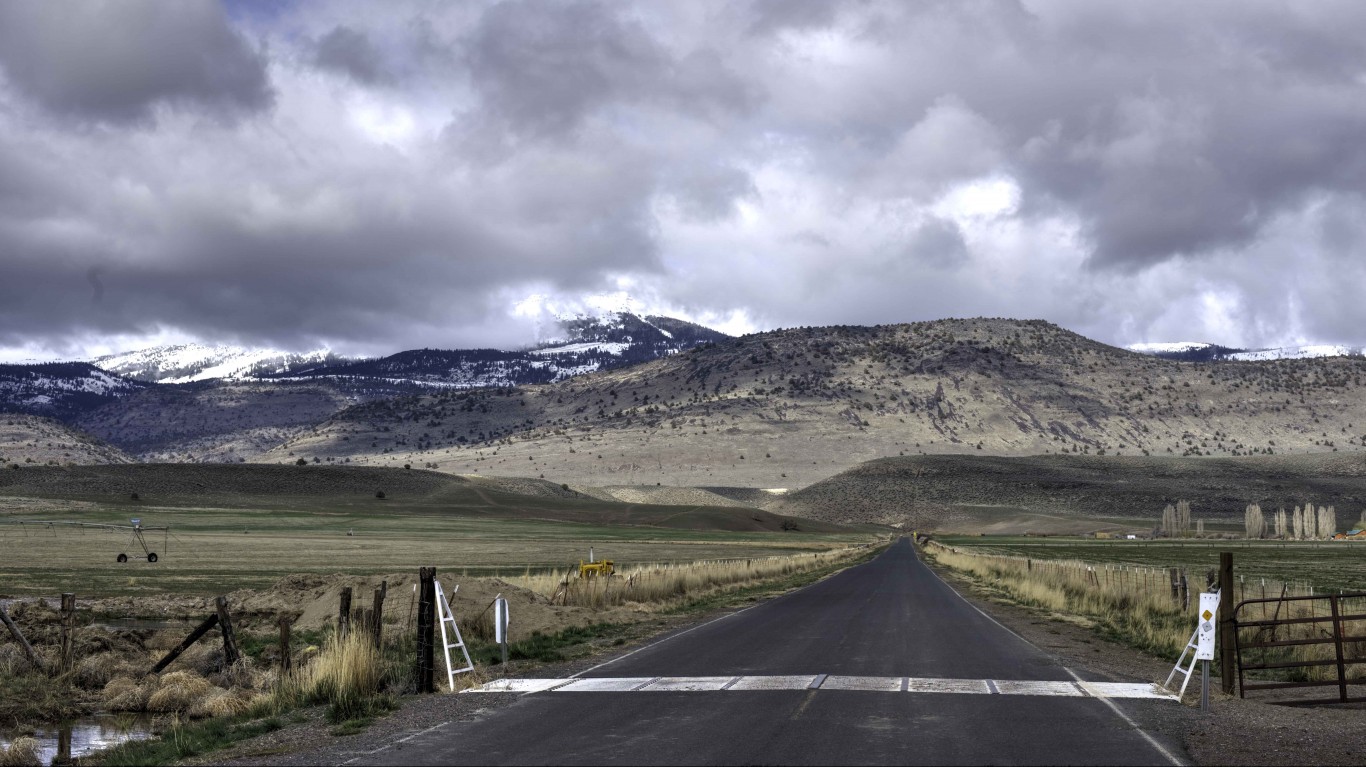
10. Lassen County, California
> Young adults who arrived in 2017: 10.9% of population
> Median age: 36.6 years (1.7 yrs less than U.S.)
> Median home value: $177,500
> Unemployment rate: 4.6%
[in-text-ad]

9. Geary County, Kansas
> Young adults who arrived in 2017: 11.3% of population
> Median age: 26.9 years (11.4 yrs less than U.S.)
> Median home value: $141,900
> Unemployment rate: 5.1%

8. Kittitas County, Washington
> Young adults who arrived in 2017: 11.4% of population
> Median age: 34.0 years (4.3 yrs less than U.S.)
> Median home value: $256,700
> Unemployment rate: 5.7%
7. Onslow County, North Carolina
> Young adults who arrived in 2017: 11.4% of population
> Median age: 26.4 years (11.9 yrs less than U.S.)
> Median home value: $154,400
> Unemployment rate: 5.3%
[in-text-ad-2]
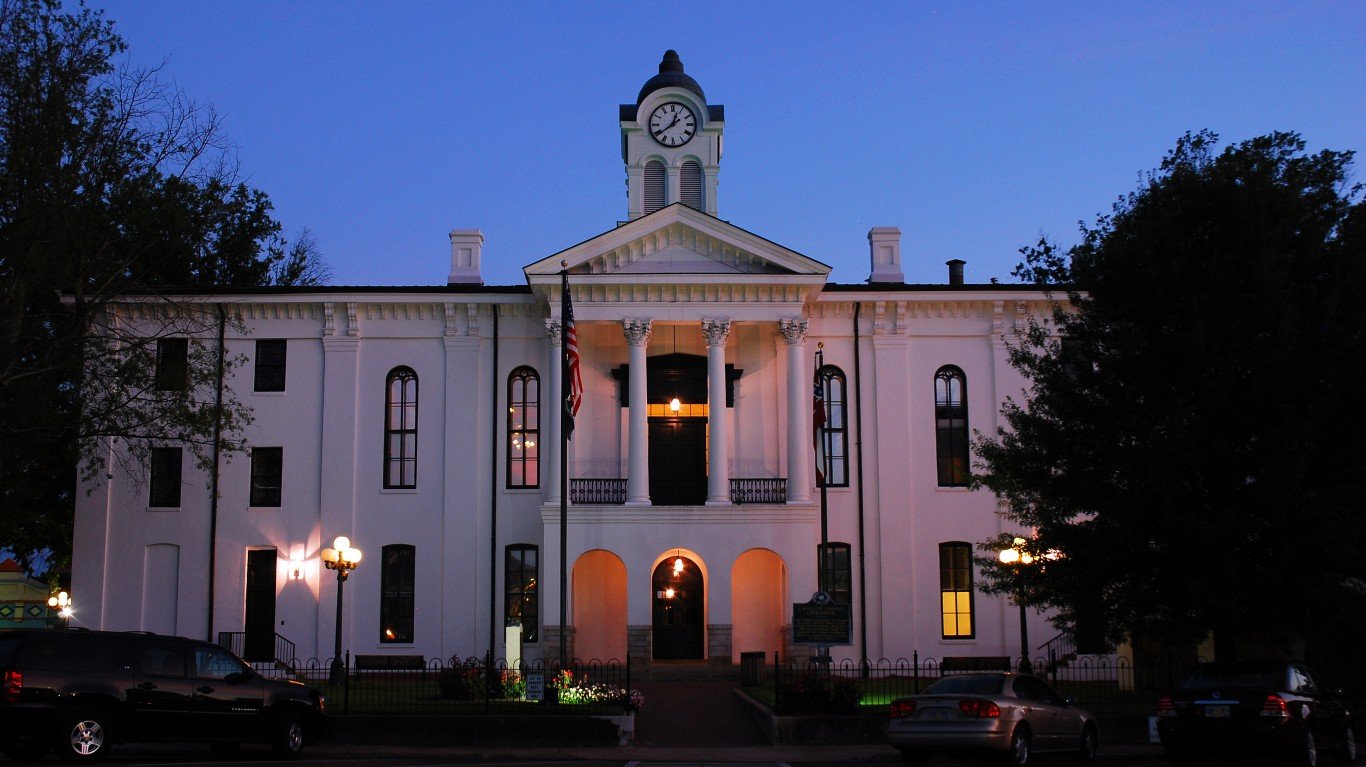
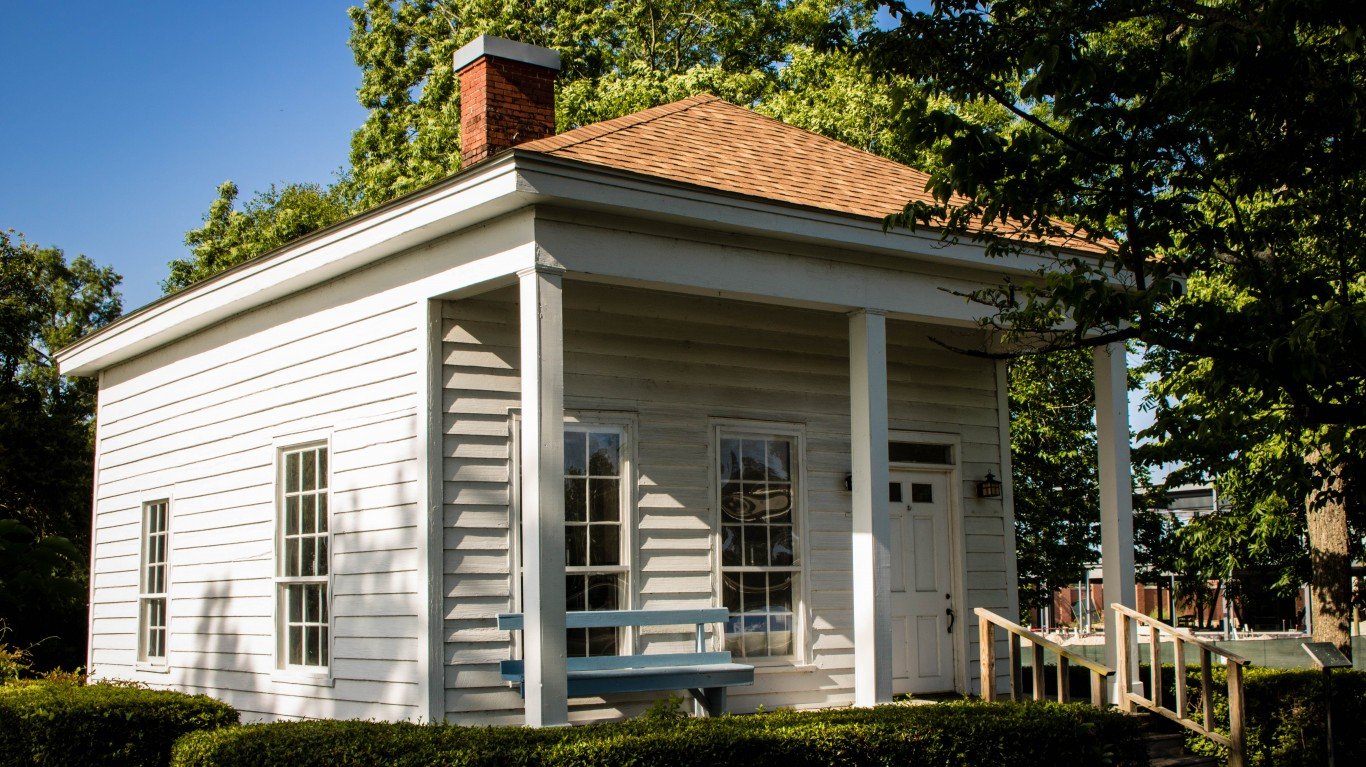
6. Lafayette County, Mississippi
> Young adults who arrived in 2017: 11.5% of population
> Median age: 29.7 years (8.6 yrs less than U.S.)
> Median home value: $177,300
> Unemployment rate: 5.8%
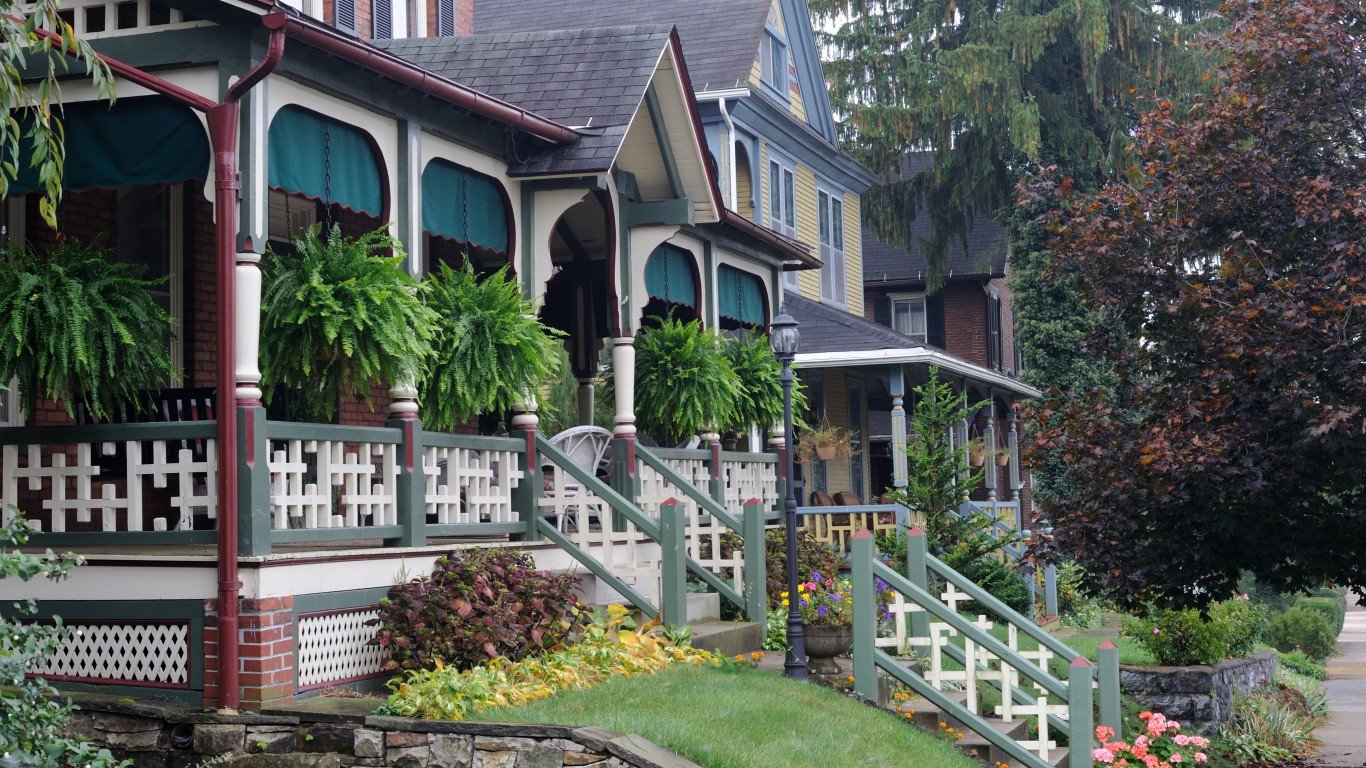
5. Centre County, Pennsylvania
> Young adults who arrived in 2017: 11.6% of population
> Median age: 31.7 years (6.6 yrs less than U.S.)
> Median home value: $212,300
> Unemployment rate: 3.2%
[in-text-ad]

4. Latah County, Idaho
> Young adults who arrived in 2017: 11.9% of population
> Median age: 28.5 years (9.8 yrs less than U.S.)
> Median home value: $207,200
> Unemployment rate: 2.6%
 24/7 Wall St.
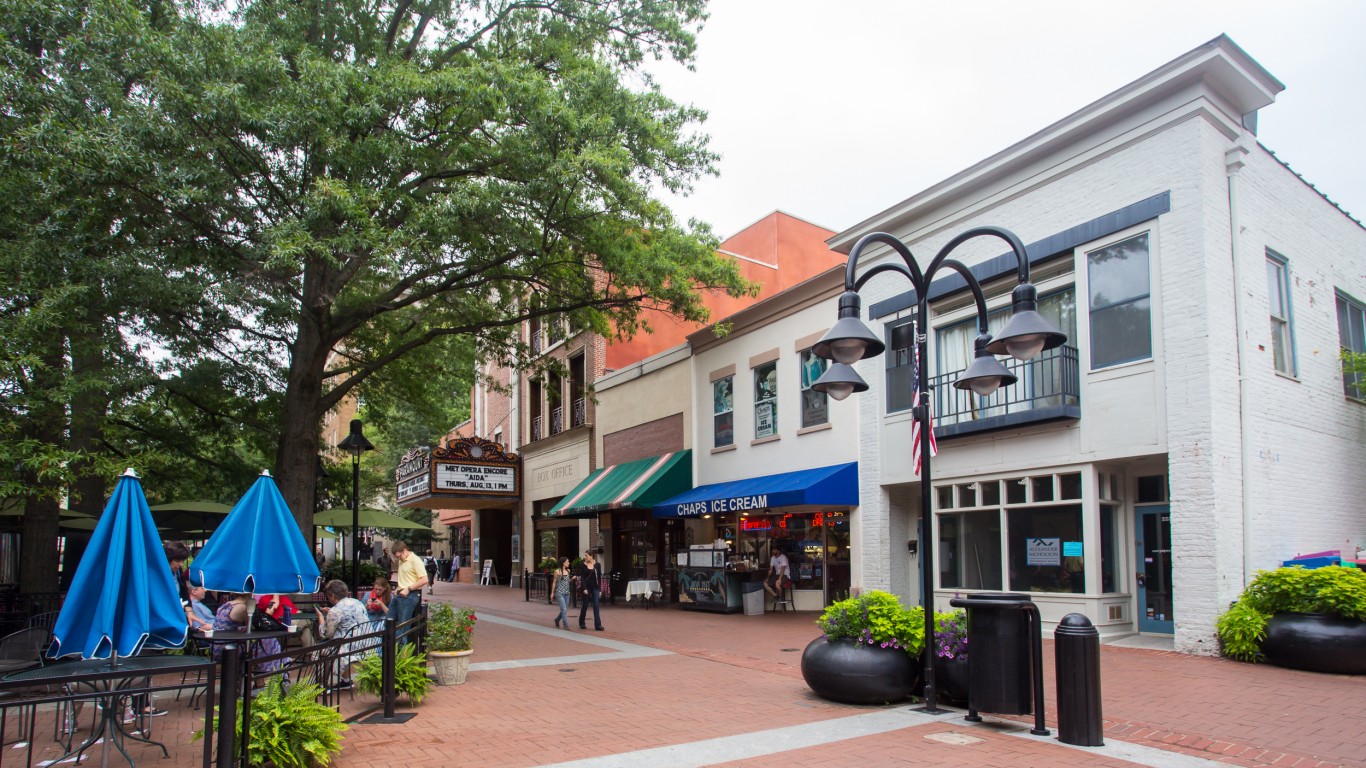
3. Charlottesville, Virginia
> Young adults who arrived in 2017: 12.3% of population
> Median age: 31.2 years (7.1 yrs less than U.S.)
> Median home value: $277,800
> Unemployment rate: 2.8%
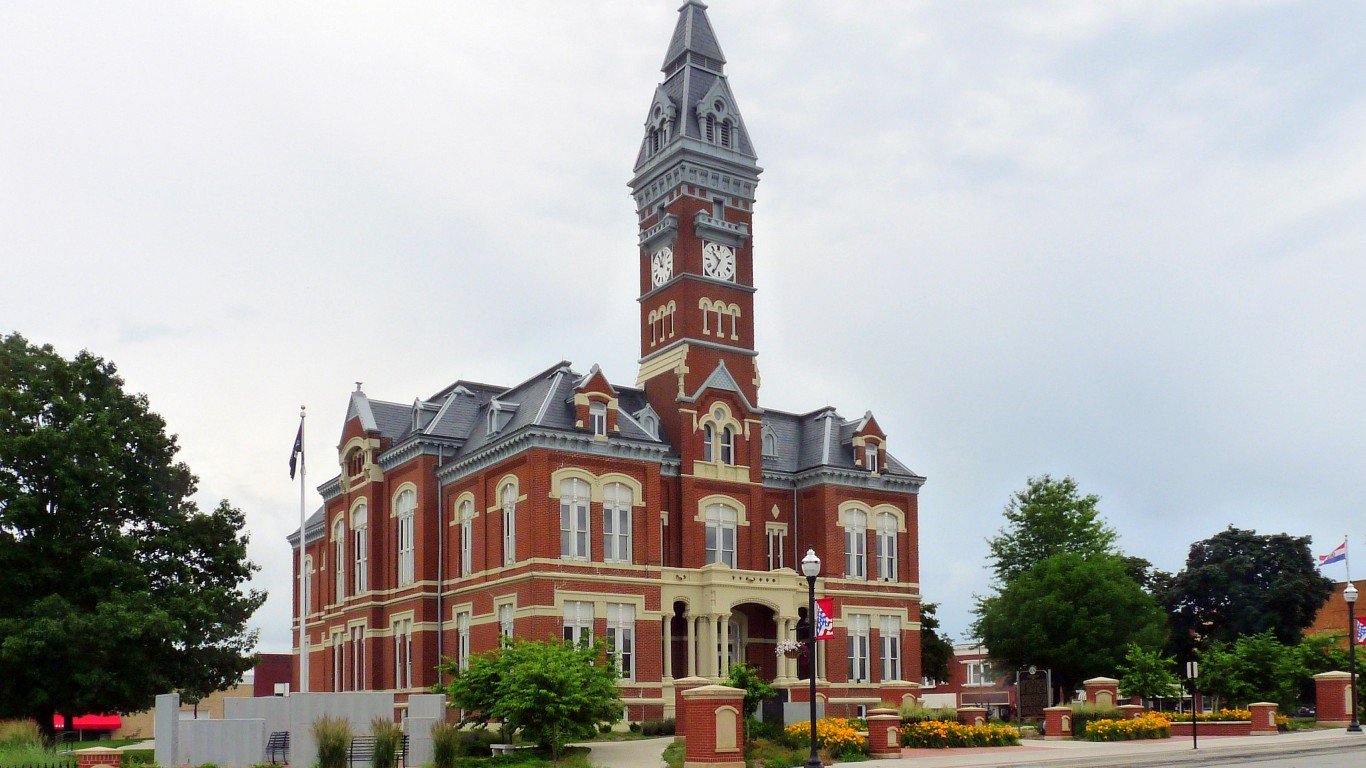
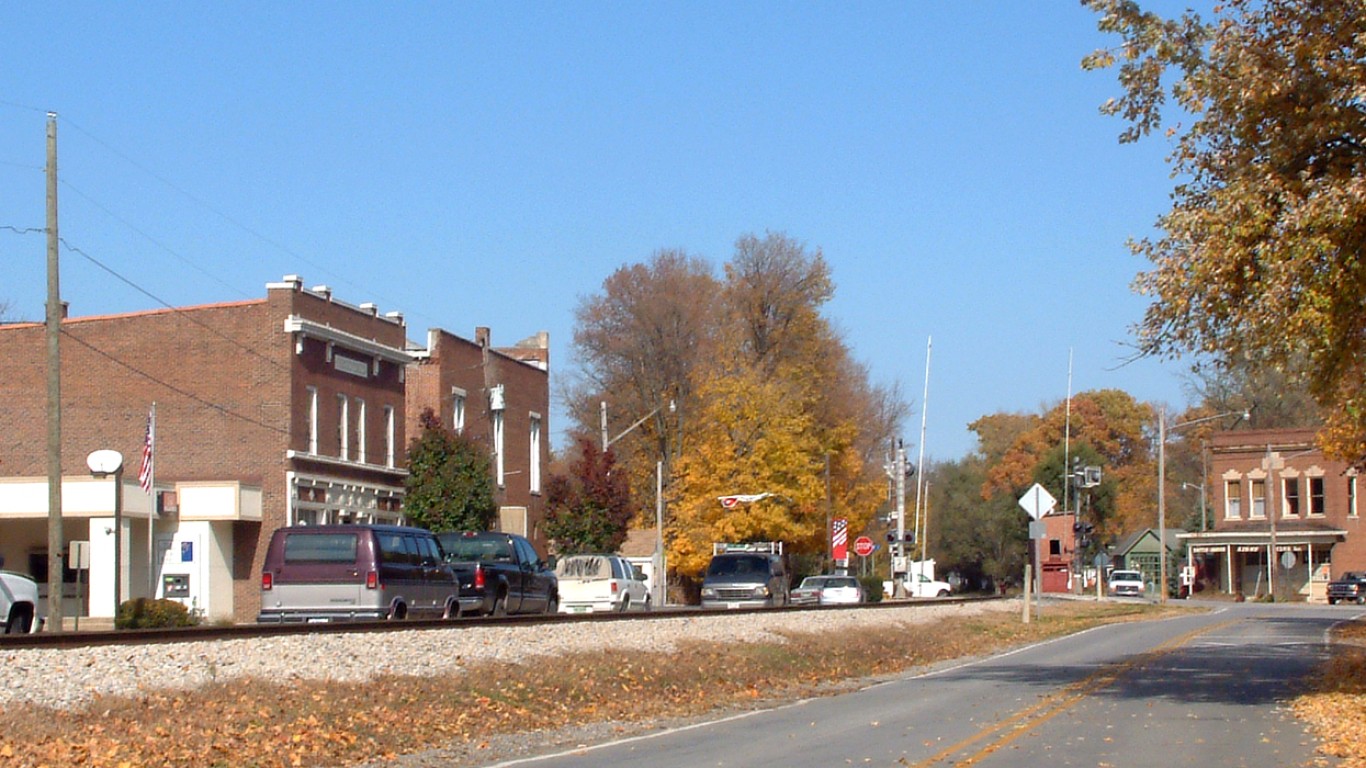
2. Nodaway County, Missouri
> Young adults who arrived in 2017: 13.3% of population
> Median age: 29.4 years (8.9 yrs less than U.S.)
> Median home value: $117,800
> Unemployment rate: 3.9%
[in-text-ad-2]
1. Pulaski County, Missouri
> Young adults who arrived in 2017: 22.9% of population
> Median age: 28.0 years (10.3 yrs less than U.S.)
> Median home value: $141,700
> Unemployment rate: 3.9%
Methodology
To determine the 40 places where young people are moving, 24/7 Wall St. ranked all U.S. counties, county equivalents, and independent cities based on the number of 18 to 34 year-olds who moved to the area from a different county or country in 2017 as a share of the total county population using data from the U.S. Census Bureau’s American Community Survey. Only counties with populations of at least 20,000 were considered. To create a more diverse list of counties, we also excluded areas where 25% or more of the population is enrolled in college or graduate school. Data on median age and home value also came from the ACS. All ACS data are five-year estimates. June 2019 unemployment rates are from the Bureau of Labor Statistics and are not seasonally adjusted.
Take This Retirement Quiz To Get Matched With An Advisor Now (Sponsored)
Are you ready for retirement? Planning for retirement can be overwhelming, that’s why it could be a good idea to speak to a fiduciary financial advisor about your goals today.
Start by taking this retirement quiz right here from SmartAsset that will match you with up to 3 financial advisors that serve your area and beyond in 5 minutes. Smart Asset is now matching over 50,000 people a month.
Click here now to get started.