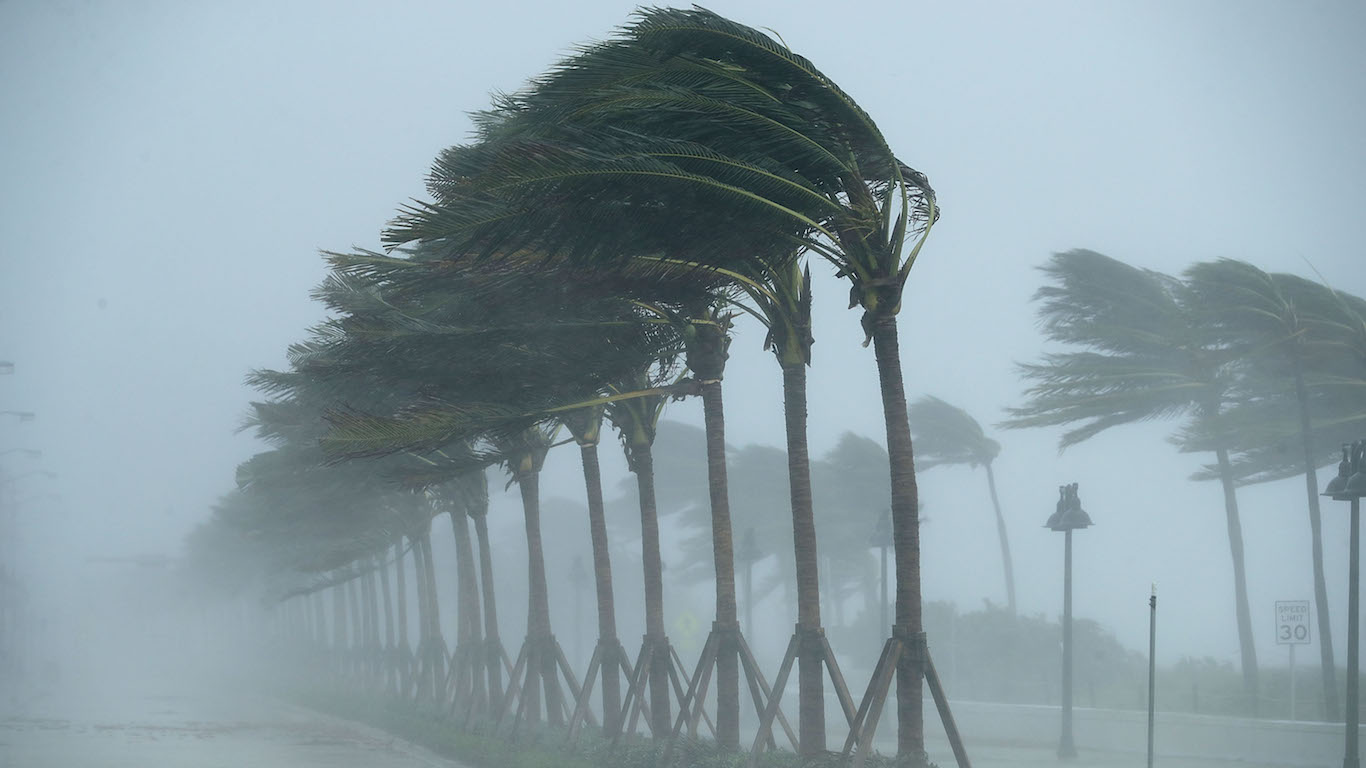
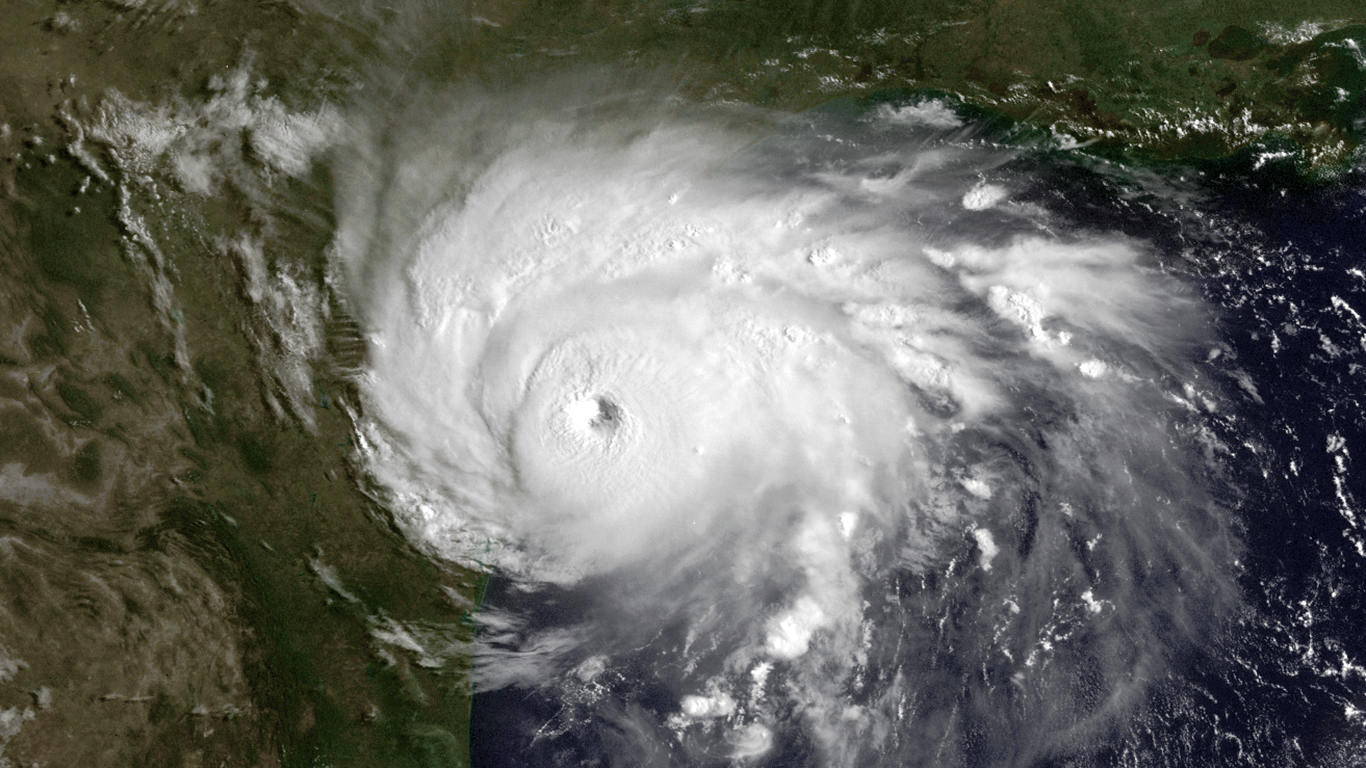
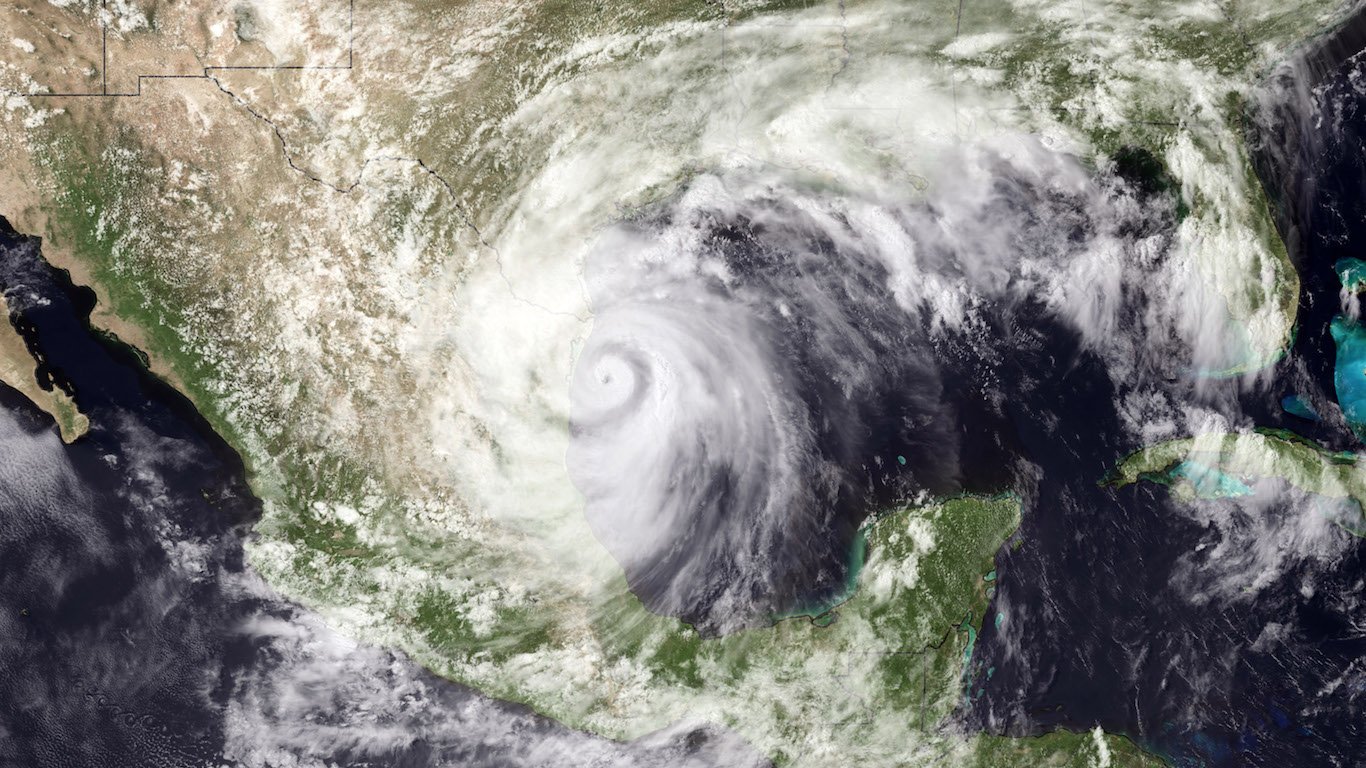
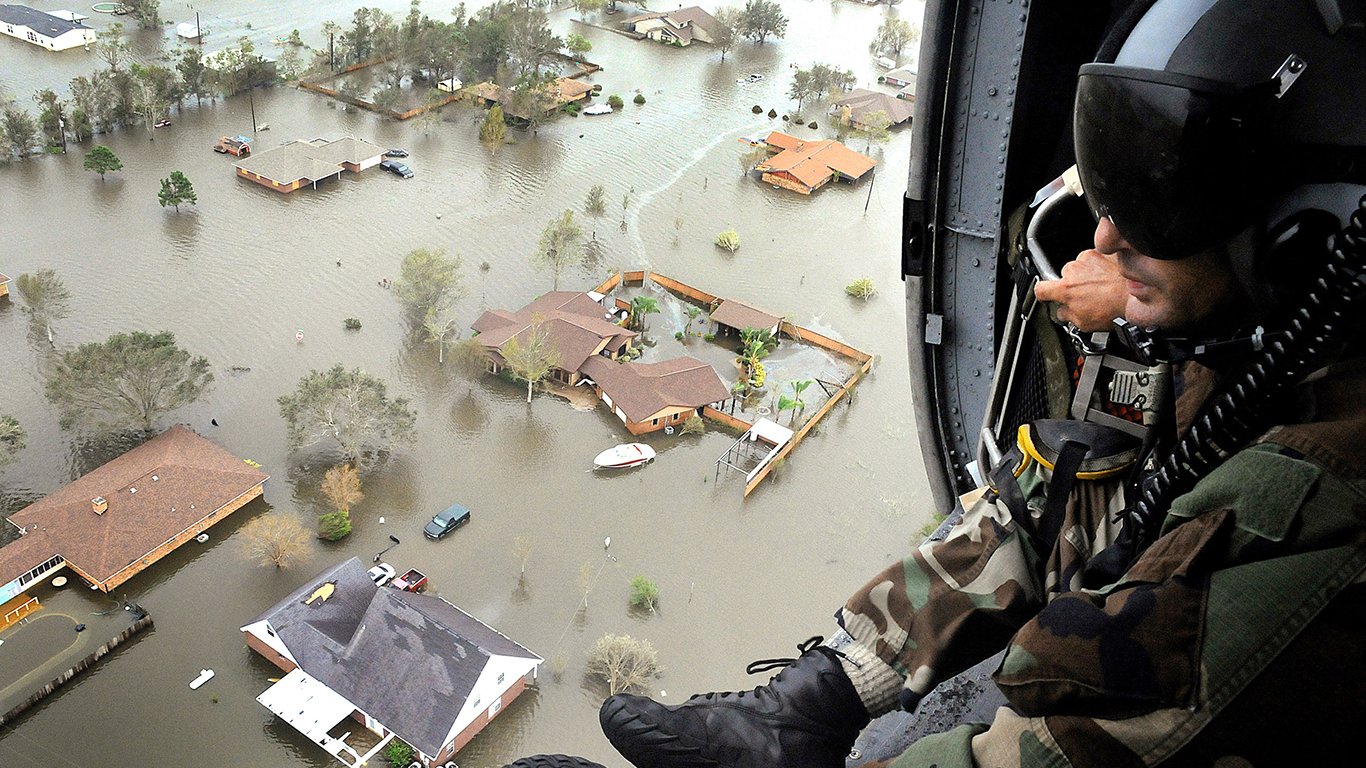
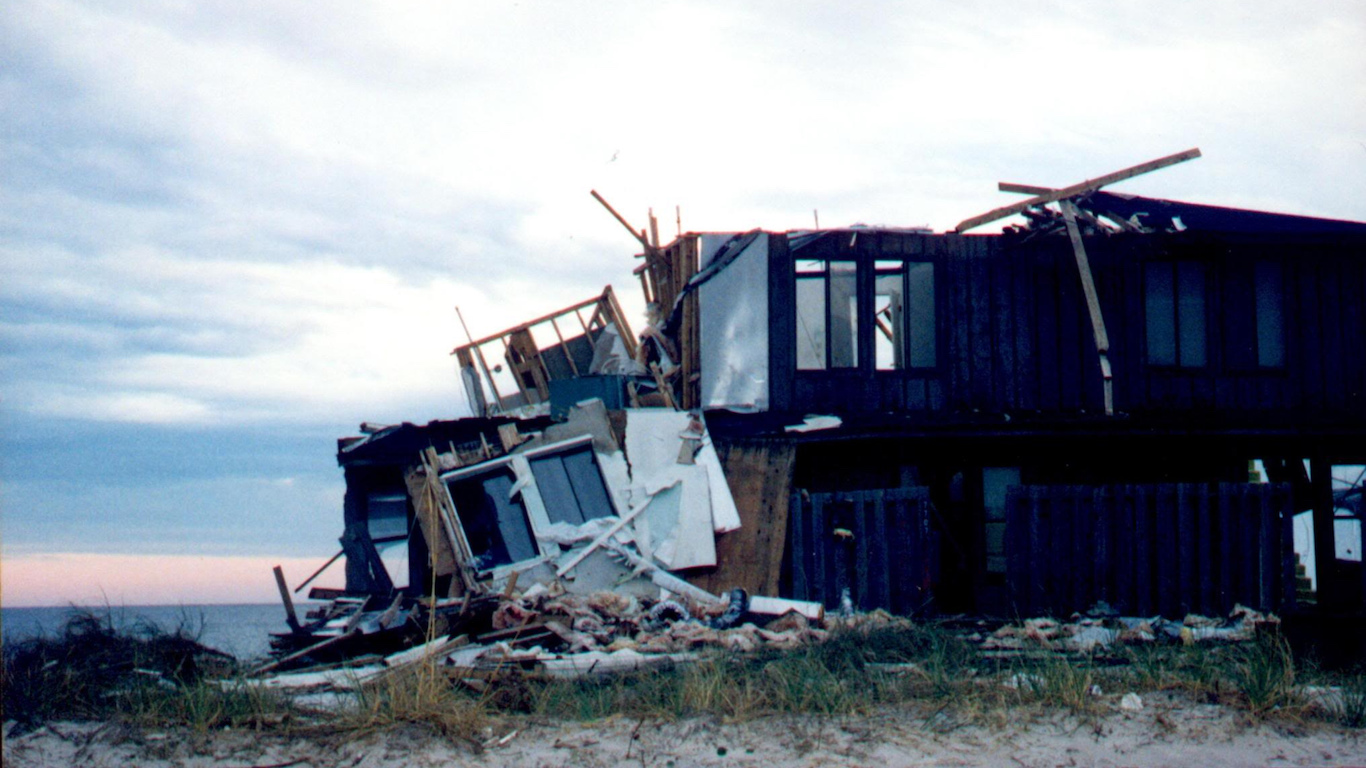
Florida is in a state of emergency as Hurricane Dorian, a Category 4 storm, bears down on the eastern coast of the state. On its current path, Dorian could make landfall near West Palm Beach some time Tuesday morning. If it does so at its current strength, with sustained winds at 140 mph, the storm could go down as one of the most destructive in history.
Some of the most powerful storms in recent years — Hurricane Andrew in 1992, for example — hit during one of the slower hurricane seasons of the past several decades. The strength of a hurricane is difficult to accurately predict, and the most intense storms on record vary heavily by decade, deadliness, and destructiveness.
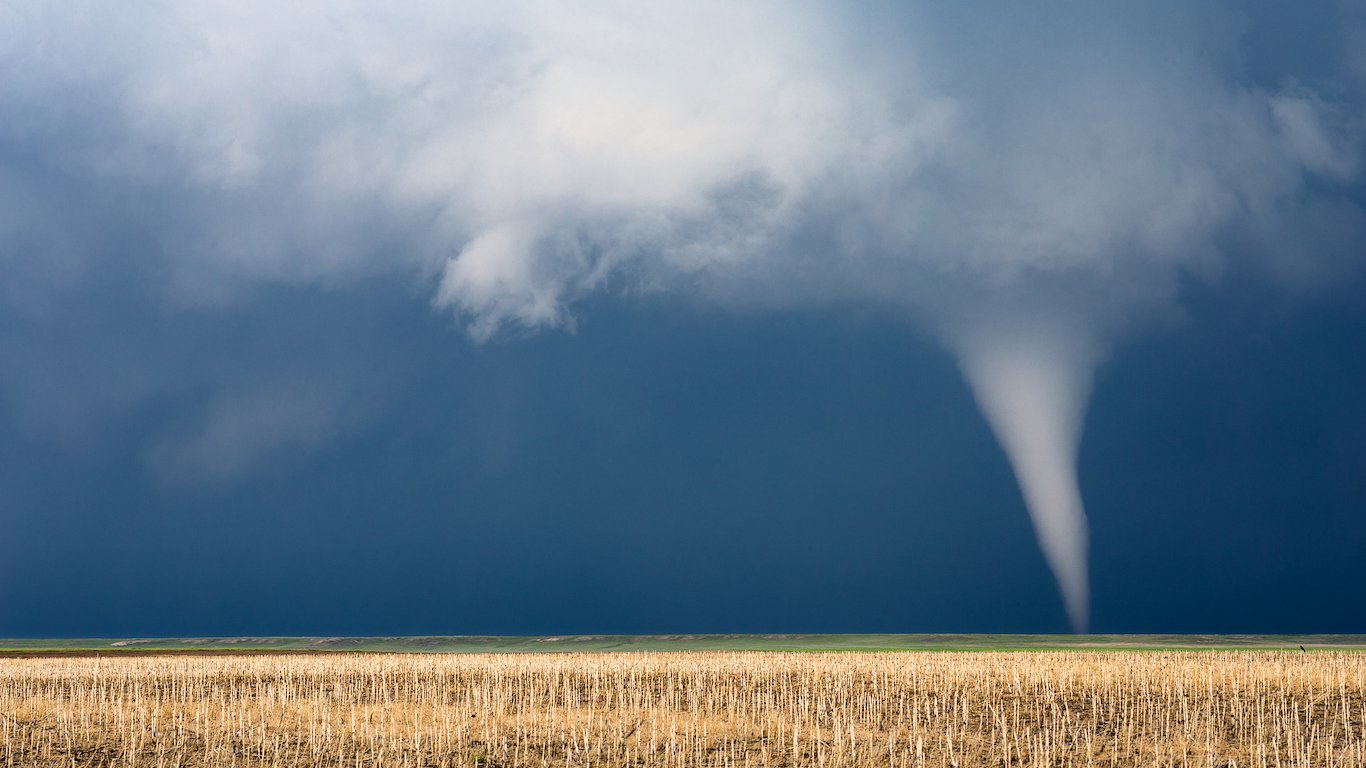
In addition to high winds, other major risks associated with hurricanes include heavy rainfall, storm surges, and inland flooding. Many of the storms on this list have been the catalyst for some of the worst floods in American history.
Despite the fewer storms predicted this year, hurricanes may be increasing in frequency and intensity because of climate change. According to the Geophysical Fluid Dynamics Laboratory, a department of the National Oceanic and Atmospheric Administration, human-caused greenhouse emissions are likely to contribute to increased storm surges, rainfall rates, intensity, and an increase in the global occurrence of tropical cyclones.
To determine the most powerful hurricanes of all time, 24/7 Wall St. ranked tropical cyclones based on estimated central pressure at time of landfall for all hurricanes between 1851 and 2017, using data from the NOAA.
Click here to see the most powerful hurricanes of all time
Click here to see our detailed findings and methodology
Source: NOAA / Wikimedia Commons
70. Hurricane Bret (August, 1999)
> Minimum pressure millibars: 951
> Max. wind speed at landfall: 100 mph
> Max. wind speed measured: 125 mph
> Affected area: Texas, Mexico
[in-text-ad]
Source: Courtesy of United States Marine Corps
69. Hurricane Gracie (September, 1959)
> Minimum pressure millibars: 951
> Max. wind speed at landfall: 115 mph
> Max. wind speed measured: 115 mph
> Affected area: Bahamas, Carolinas, Virginia
Source: Mark Wilson / Getty Images
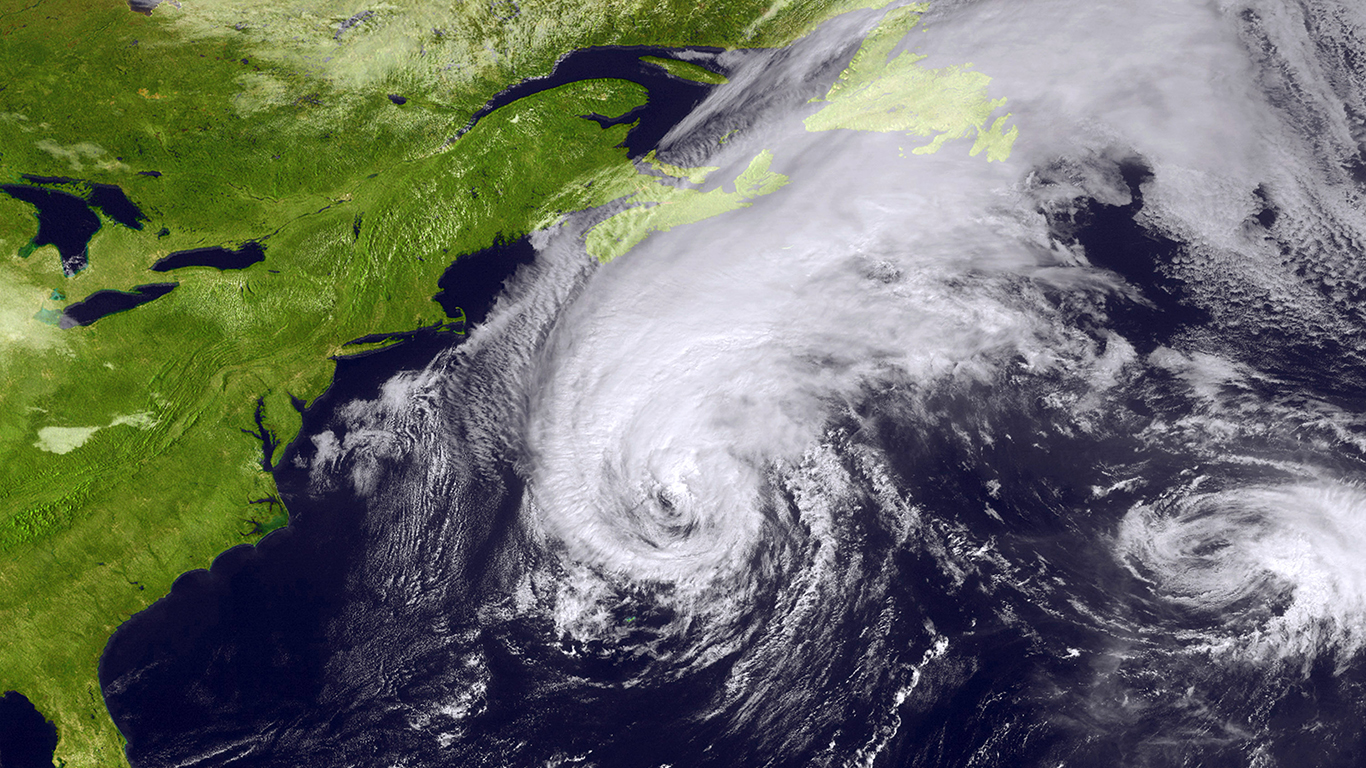
68. Hurricane Irene (August, 2011)
> Minimum pressure millibars: 950
> Max. wind speed at landfall: 90 mph
> Max. wind speed measured: 105 mph
> Affected area: Bahamas, Mid-Atlantic states, New England
Source: NOAA / Getty Images
67. Hurricane Igor (September, 2010)
> Minimum pressure millibars: 950
> Max. wind speed at landfall: 75 mph
> Max. wind speed measured: 135 mph
> Affected area: Caribbean, Bermuda, U.S. East Coast, eastern Canada
Source: Joe Raedle / Getty Images
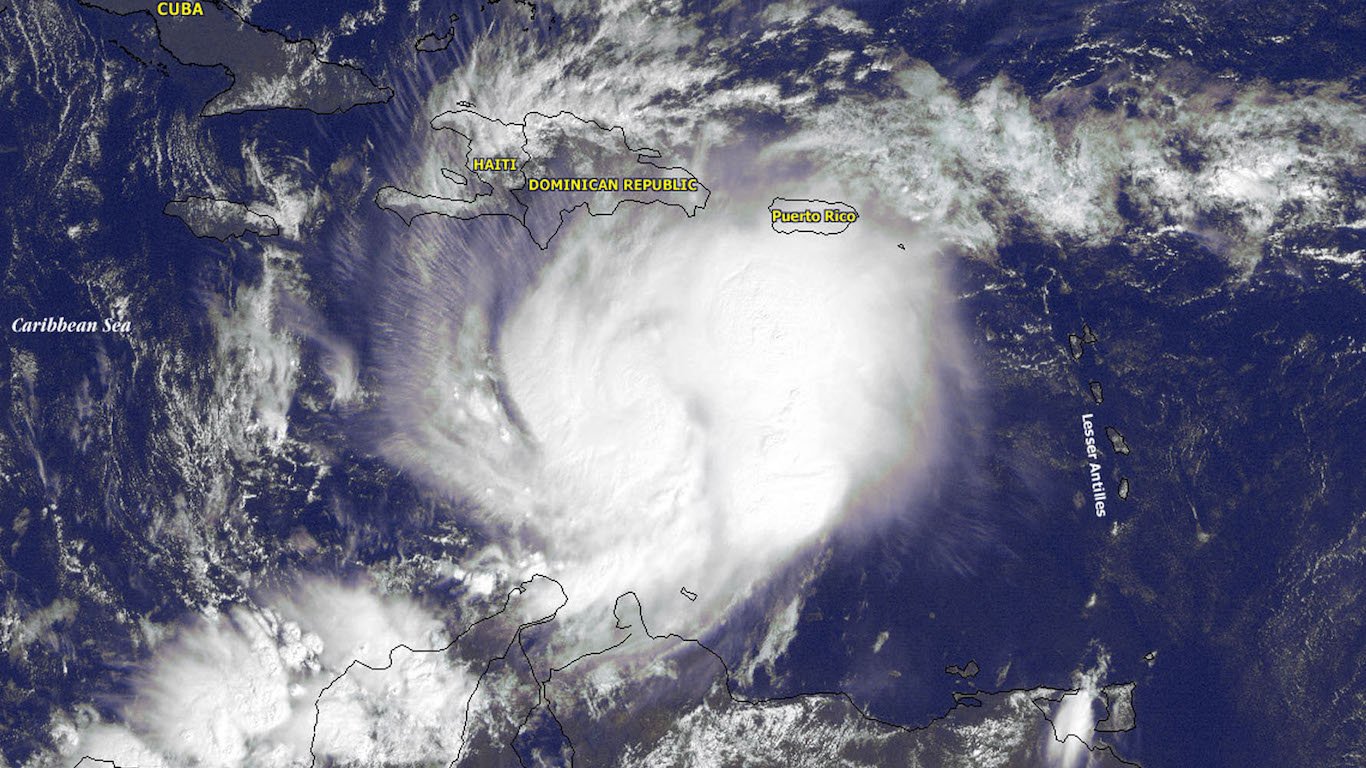
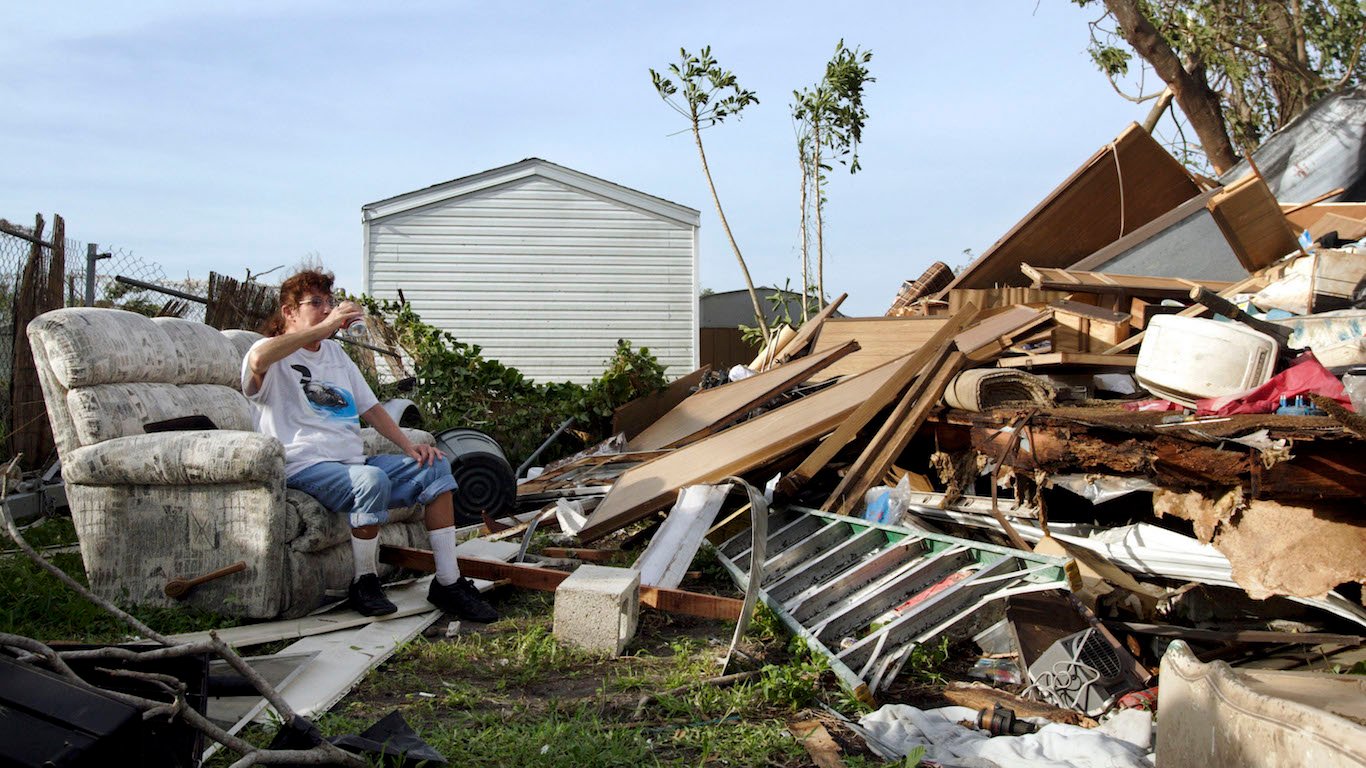
66. Hurricane Jeanne (September, 2004)
> Minimum pressure millibars: 950
> Max. wind speed at landfall: 105 mph
> Max. wind speed measured: 105 mph
> Affected area: Hispaniola, Puerto Rico, Bahamas, southeastern U.S.

Source: Courtesy of the Vineyard Gazette, vineyardgazette.com
65. Hurricane Edna (September, 1954)
> Minimum pressure millibars: 950
> Max. wind speed at landfall: 95 mph
> Max. wind speed measured: 110 mph
> Affected area: North Carolina, Massachusetts, Maine
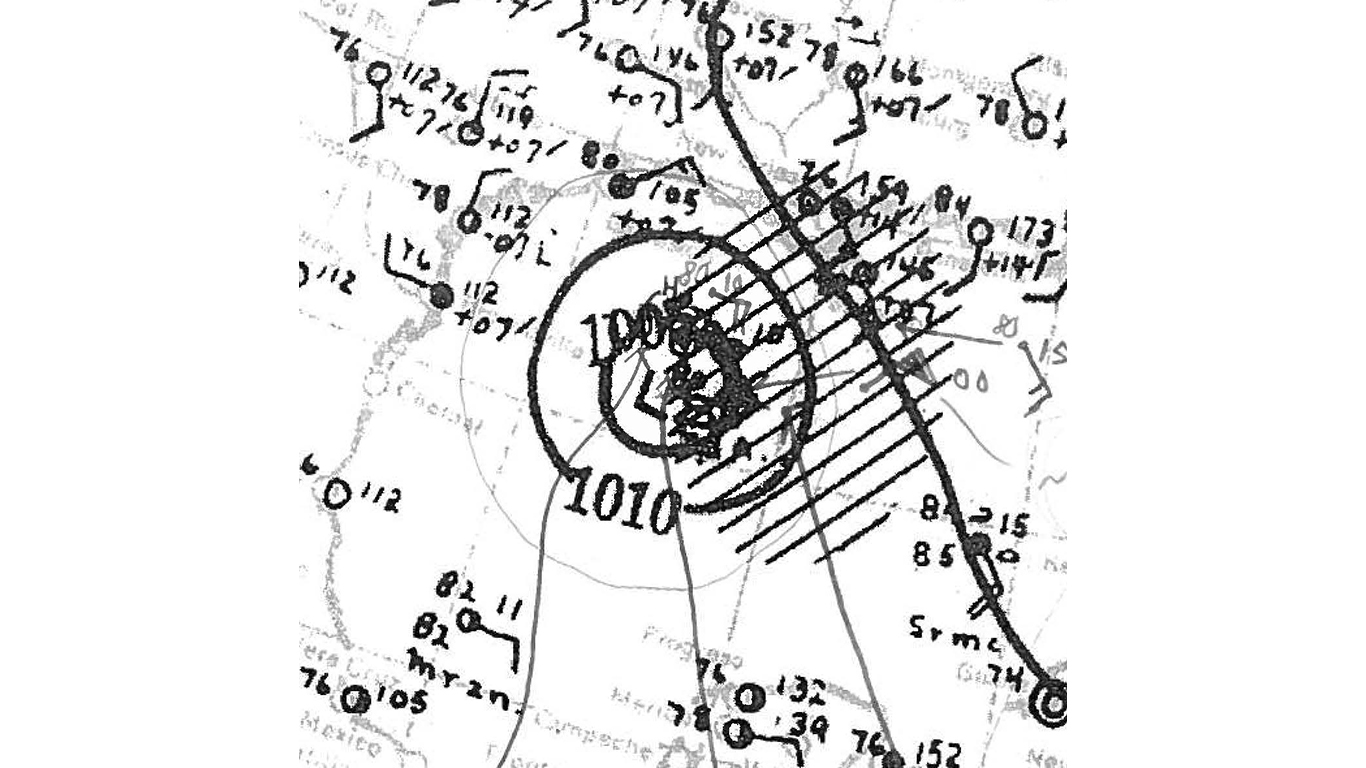
Source: NOAA Central Library / Wikimedia Commons
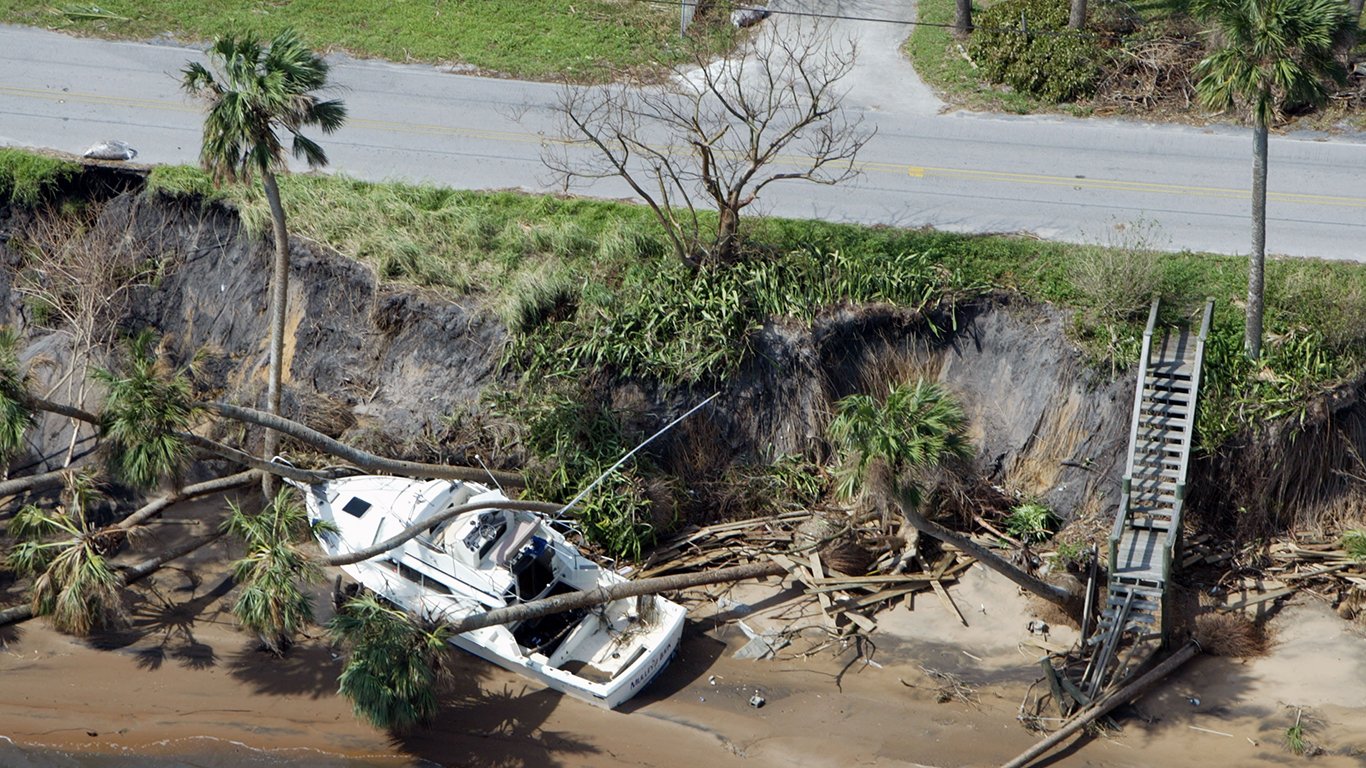
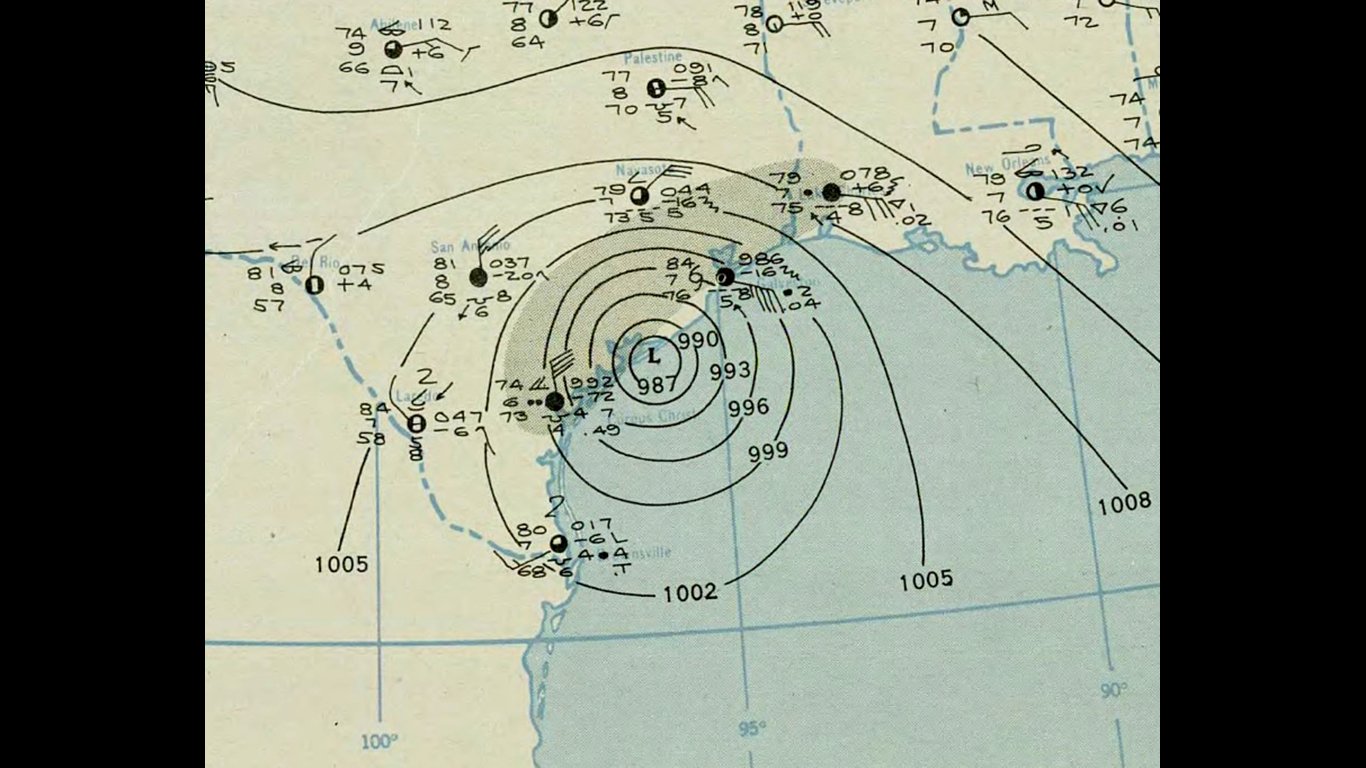
64. 1942 Matagorda Hurricane (August, 1942)
> Minimum pressure millibars: 950
> Max. wind speed at landfall: 100 mph
> Max. wind speed measured: 100 mph
> Affected area: Eastern Mexico, southeastern Texas
[in-text-ad-2]

Source: Public Domain / Wikimedia Commons
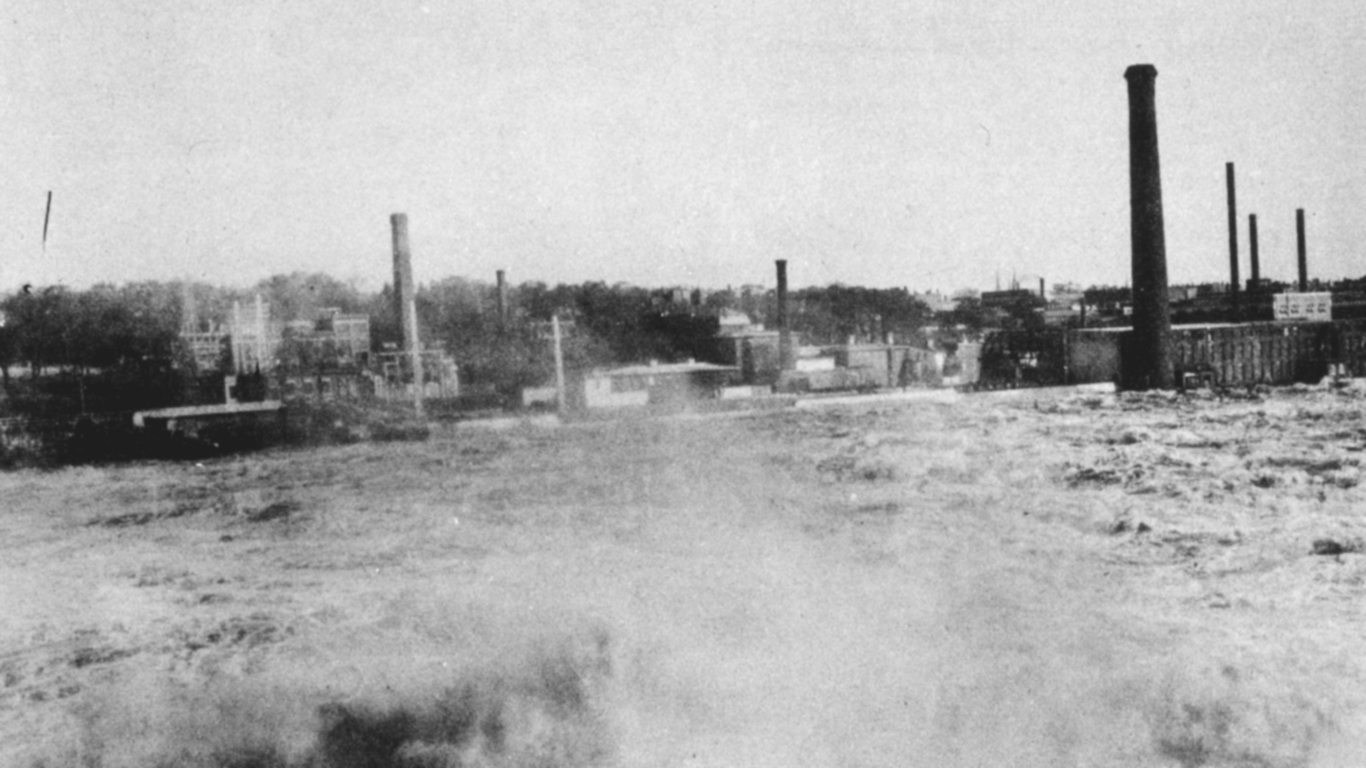
63. 1916 Gulf Coast Hurricane (July, 1916)
> Minimum pressure millibars: 950
> Max. wind speed at landfall: 105 mph
> Max. wind speed measured: 105 mph
> Affected area: Southeastern U.S.
Source: Supportstorm / Wikimedia Commons
62. 1854 Savannah Hurricane (September, 1854)
> Minimum pressure millibars: 950
> Max. wind speed at landfall: 100 mph
> Max. wind speed measured: 110 mph
> Affected area: Carolinas, Georgia, Virginia
Source: Jorge Rey / Getty Images
61. Hurricane Michelle (November, 2001)
> Minimum pressure millibars: 949
> Max. wind speed at landfall: 120 mph
> Max. wind speed measured: 120 mph
> Affected area: Cuba, Caribbean islands, Florida Keys
Source: Courtesy of NOAA
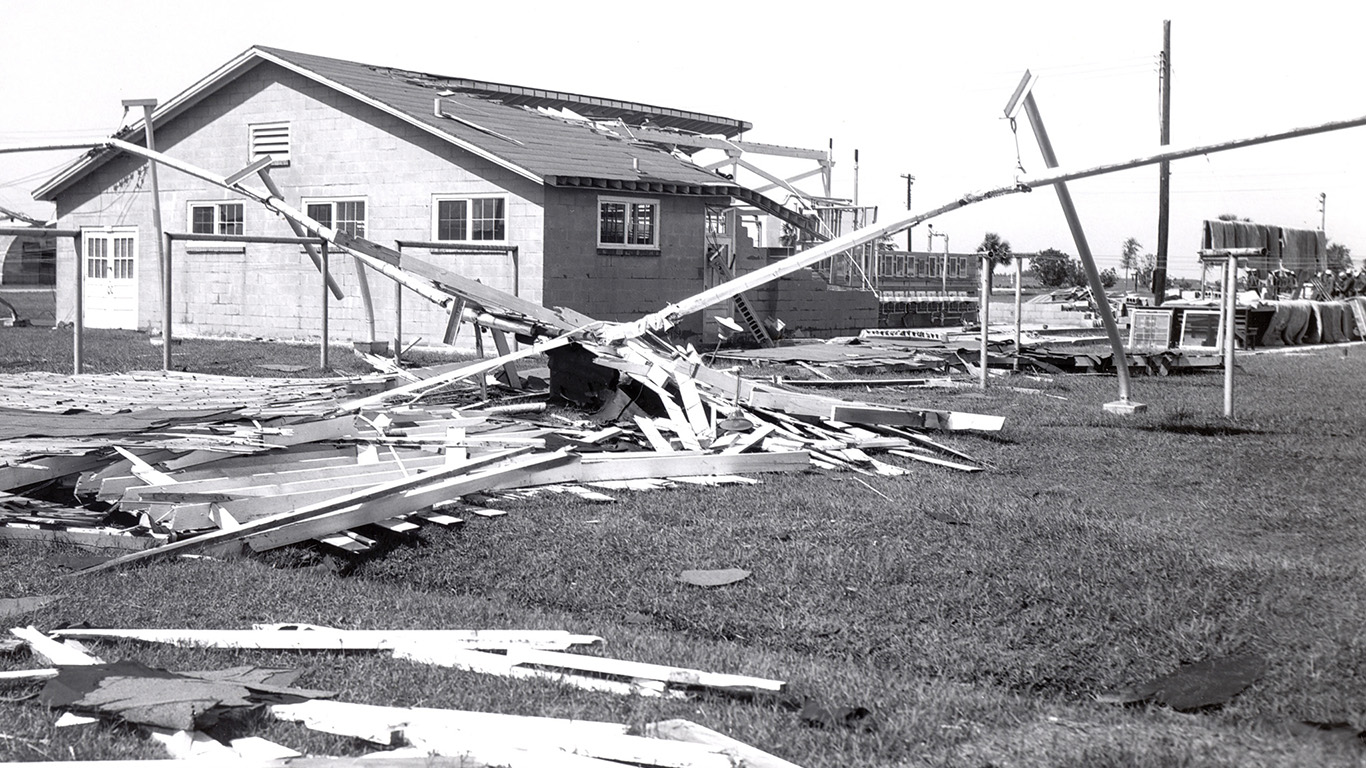
60. 1945 Homestead Hurricane (September, 1945)
> Minimum pressure millibars: 949
> Max. wind speed at landfall: 115 mph
> Max. wind speed measured: 115 mph
> Affected area: Caribbean islands, Florida, Georgia, Carolinas
[in-text-ad]
Source: Florida Keys--Public Libraries / Wikimedia Commons
59. 1944 Cuba-Florida Hurricane (October, 1944)
> Minimum pressure millibars: 949
> Max. wind speed at landfall: 105 mph
> Max. wind speed measured: 125 mph
> Affected area: North Carolina, Long Island, New England, eastern Canada
Source: Public Domain / Wikimedia Commons
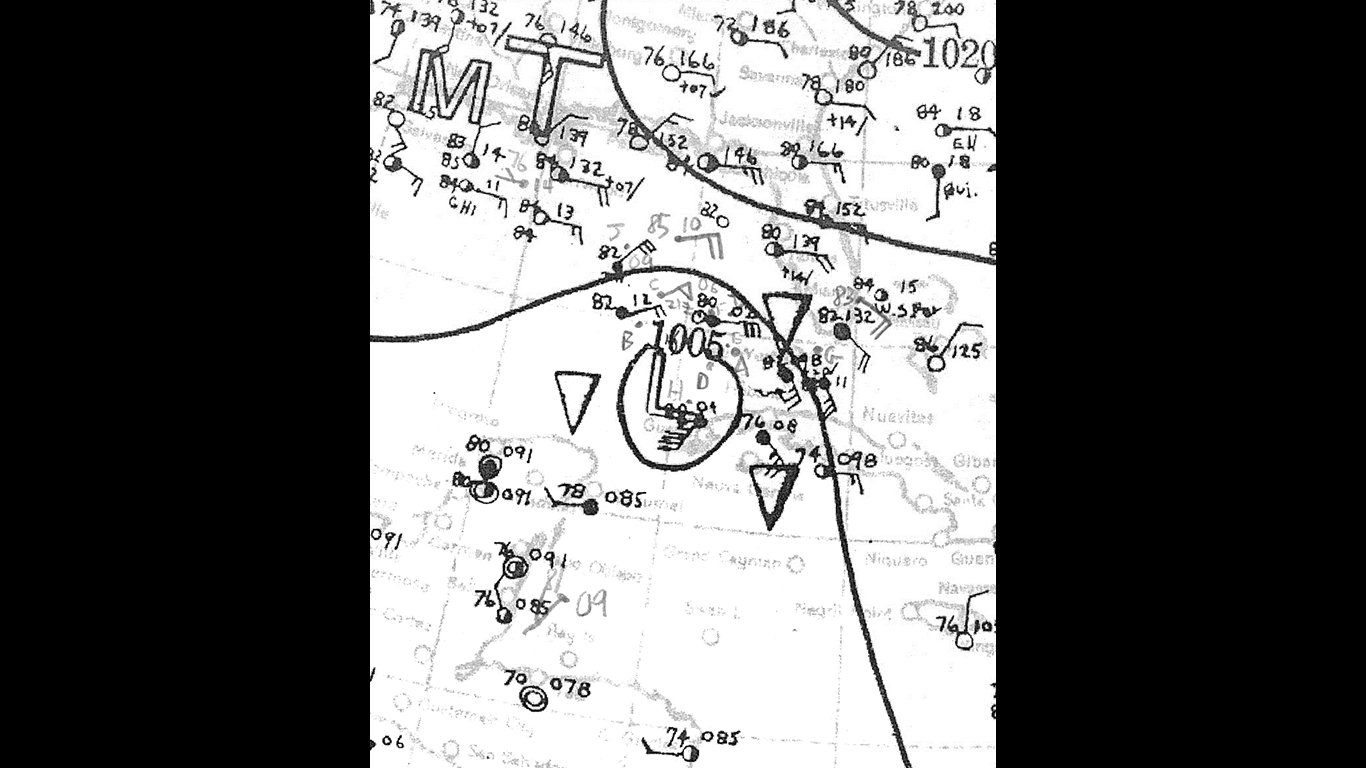
58. 1917 Nueva Gerona Hurricane (September, 1917)
> Minimum pressure millibars: 949
> Max. wind speed at landfall: 100 mph
> Max. wind speed measured: 130 mph
> Affected area: Cuba, Florida Panhandle
Source: Public Domain / Wikimedia Commons
57. The Pensacola Hurricane of 1882 (September, 1882)
> Minimum pressure millibars: 949
> Max. wind speed at landfall: 110 mph
> Max. wind speed measured: 110 mph
> Affected area: Cuba, Florida, Louisiana

Source: Joshua Rodas / Getty Images
56. Hurricane Frances (September, 2004)
> Minimum pressure millibars: 948
> Max. wind speed at landfall: 110 mph
> Max. wind speed measured: 125 mph
> Affected area: Leeward Islands, Turks and Caicos Islands, Bahamas, Florida, North Carolina
Source: Public Domain / Wikimedia Commons
55. Hurricane Iris (October, 2001)
> Minimum pressure millibars: 948
> Max. wind speed at landfall: 125 mph
> Max. wind speed measured: 125 mph
> Affected area: Lesser Antilles, Jamaica, Belize, Guatemala, Dominican Republic
Source: Hurricane Research Division / Wikimedia Commons
54. 1933 Treasure Coast Hurricane (September, 1933)
> Minimum pressure millibars: 948
> Max. wind speed at landfall: 110 mph
> Max. wind speed measured: 120 mph
> Affected area: Caribbean, Florida, Georgia, Carolinas
[in-text-ad-2]
Source: Topical Press Agency / Getty Images
53. 1929 Bahamas Hurricane (September, 1929)
> Minimum pressure millibars: 948
> Max. wind speed at landfall: 100 mph
> Max. wind speed measured: 135 mph
> Affected area: Bahamas, Georgia, Florida
Source: Public Domain / Wikimedia Commons
52. 1893 Cheniere Caminada Hurricane (October, 1893)
> Minimum pressure millibars: 948
> Max. wind speed at landfall: 115 mph
> Max. wind speed measured: 115 mph
> Affected area: Louisiana, Mississippi, eastern Mexico
Source: NOAA via Getty Images
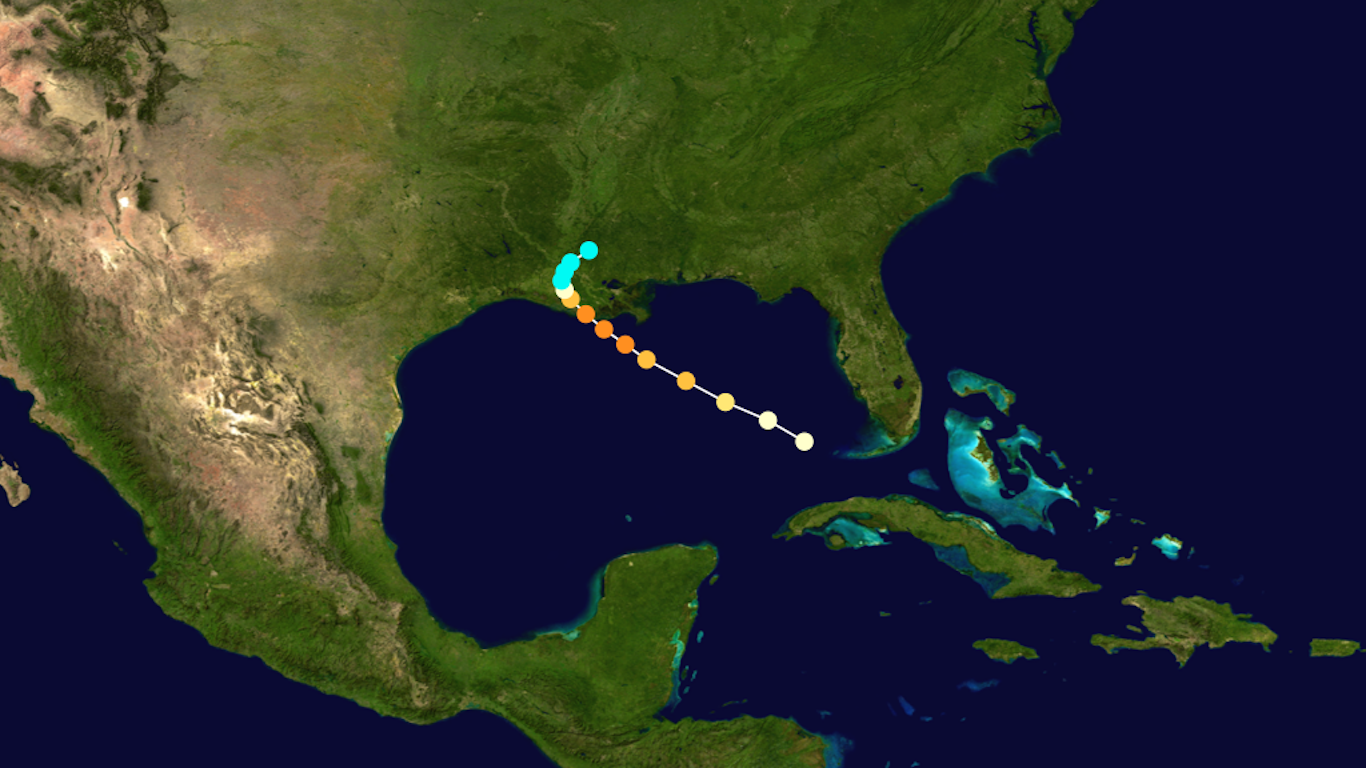
51. Hurricane Alex (July, 2010)
> Minimum pressure millibars: 946
> Max. wind speed at landfall: 95 mph
> Max. wind speed measured: 95 mph
> Affected area: Central America, Mexico
Source: Spencer Platt / Getty Images
50. Hurricane Ivan (September, 2004)
> Minimum pressure millibars: 946
> Max. wind speed at landfall: 105 mph
> Max. wind speed measured: 145 mph
> Affected area: Caribbean islands, Alabama, Louisiana
[in-text-ad]
Source: NOAA / Wikimedia Commons
49. Hurricane Audrey (June, 1957)
> Minimum pressure millibars: 946
> Max. wind speed at landfall: 110 mph
> Max. wind speed measured: 110 mph
> Affected area: Gulf Coast states
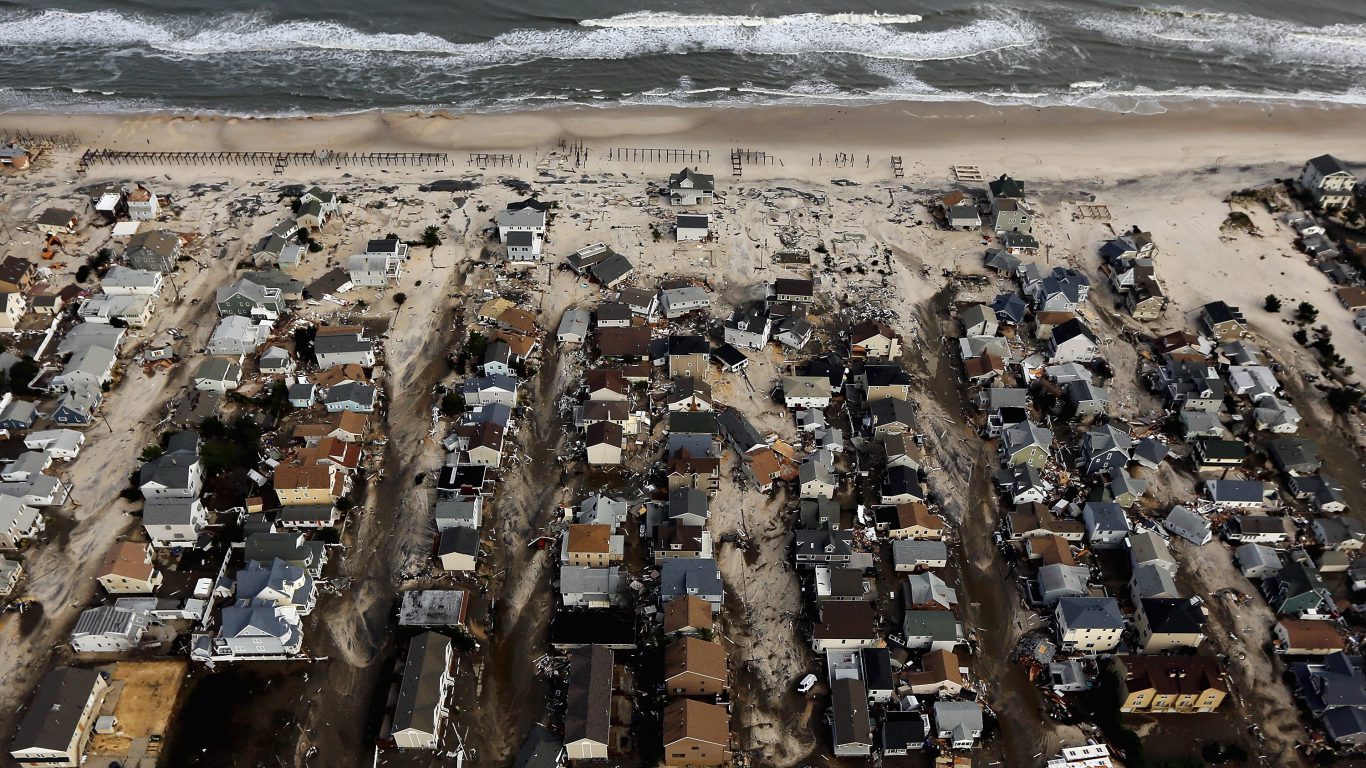
Source: Mario Tama / Getty Images
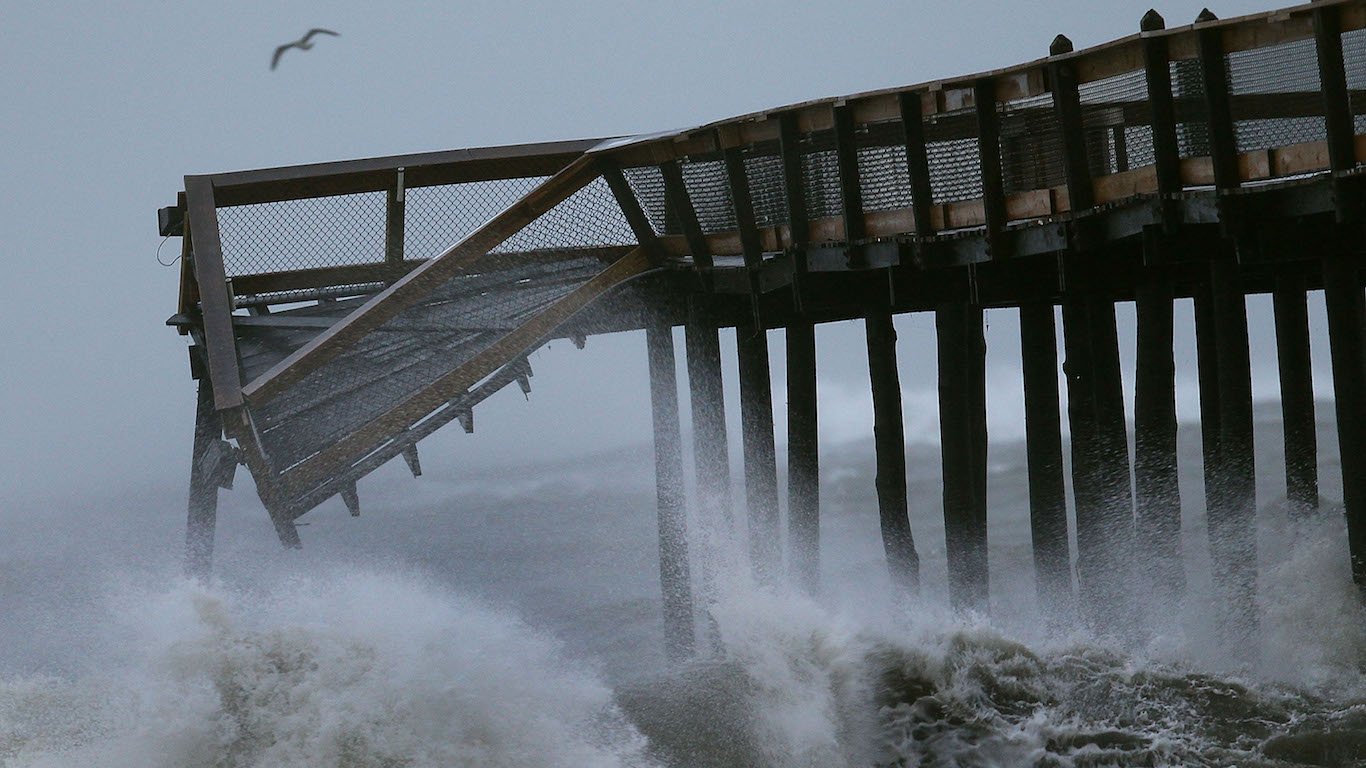
48. Hurricane Sandy (October, 2012)
> Minimum pressure millibars: 945
> Max. wind speed at landfall: 70 mph
> Max. wind speed measured: 100 mph
> Affected area: Caribbean islands, U.S. East Coast
Source: Paul Flipse / US Air Force via Getty Images
47. Hurricane Ike (September, 2008)
> Minimum pressure millibars: 945
> Max. wind speed at landfall: 115 mph
> Max. wind speed measured: 125 mph
> Affected area: Caribbean islands, Louisiana, southeastern Texas
Source: NOAA / Satellite and Information Service / Wikimedia Commons
46. Hurricane Luis (September, 1995)
> Minimum pressure millibars: 945
> Max. wind speed at landfall: 115 mph
> Max. wind speed measured: 120 mph
> Affected area: Leeward Islands, Bermuda
Source: Public Domain / Wikimedia Commons
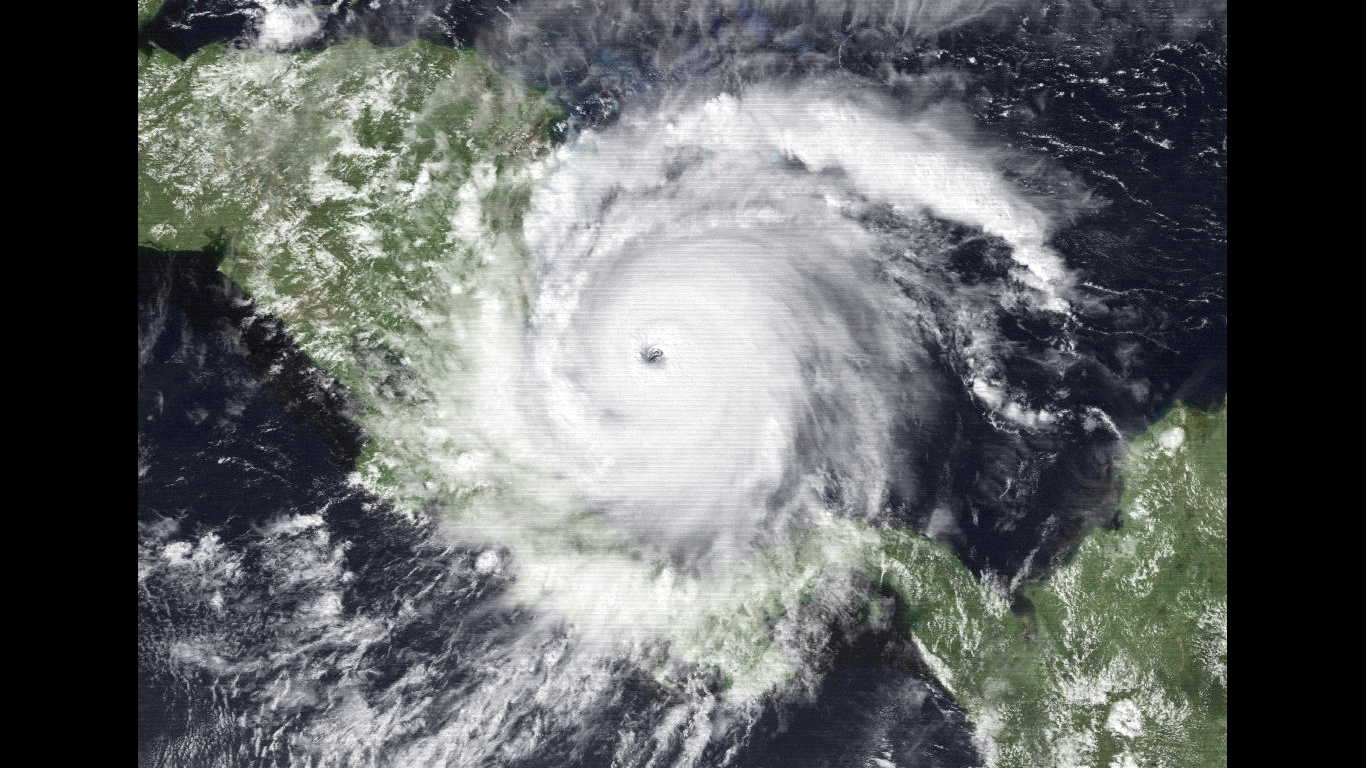
45. Hurricane Emily (July, 2005)
> Minimum pressure millibars: 944
> Max. wind speed at landfall: 110 mph
> Max. wind speed measured: 140 mph
> Affected area: Grenada, eastern Mexico

Source: Public Domain / Wikimedia Commons
44. 1915 New Orleans Hurricane (September, 1915)
> Minimum pressure millibars: 944
> Max. wind speed at landfall: 110 mph
> Max. wind speed measured: 125 mph
> Affected area: Caribbean islands, eastern Mexico, Central and South America, southern U.S.
[in-text-ad-2]
Source: Courtesy of NOAA
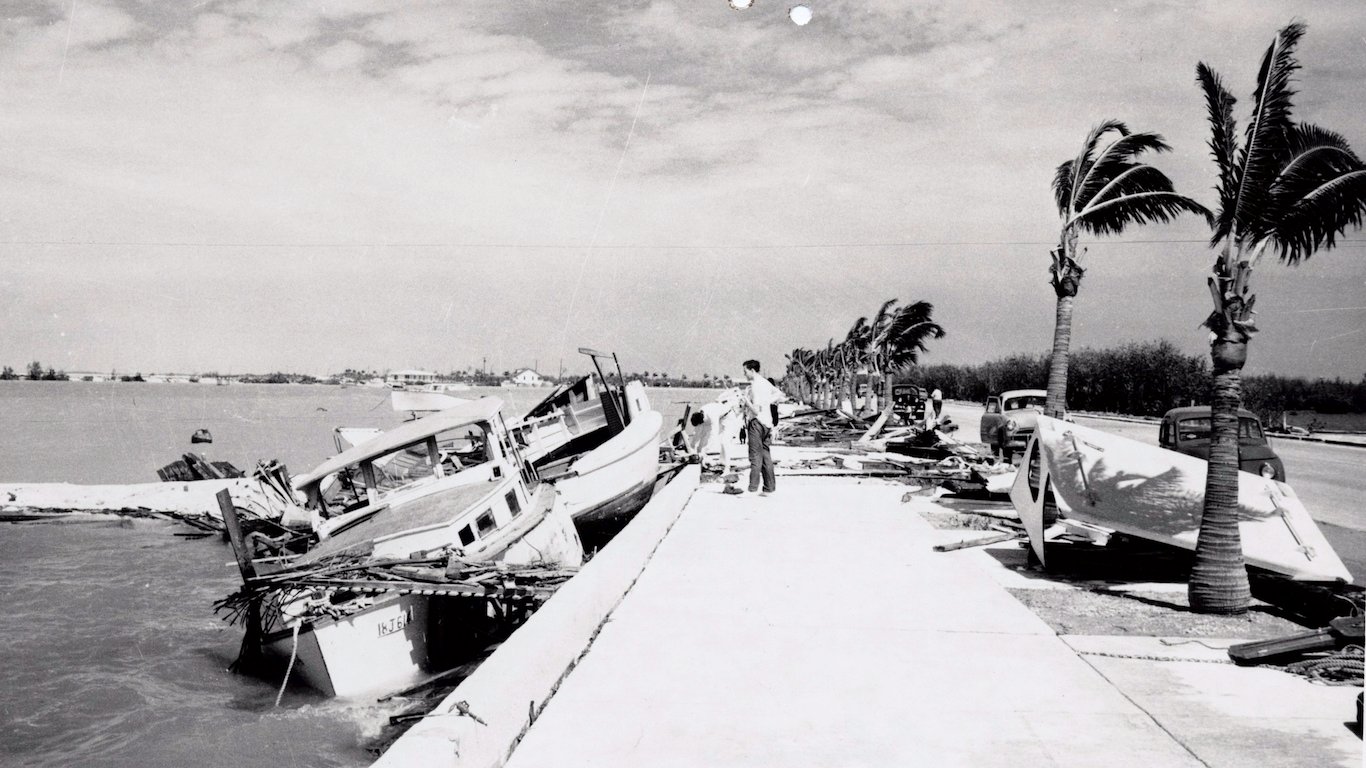
43. 1947 Fort Lauderdale Hurricane (September, 1947)
> Minimum pressure millibars: 943
> Max. wind speed at landfall: 115 mph
> Max. wind speed measured: 125 mph
> Affected area: Bahamas, southern U.S. states
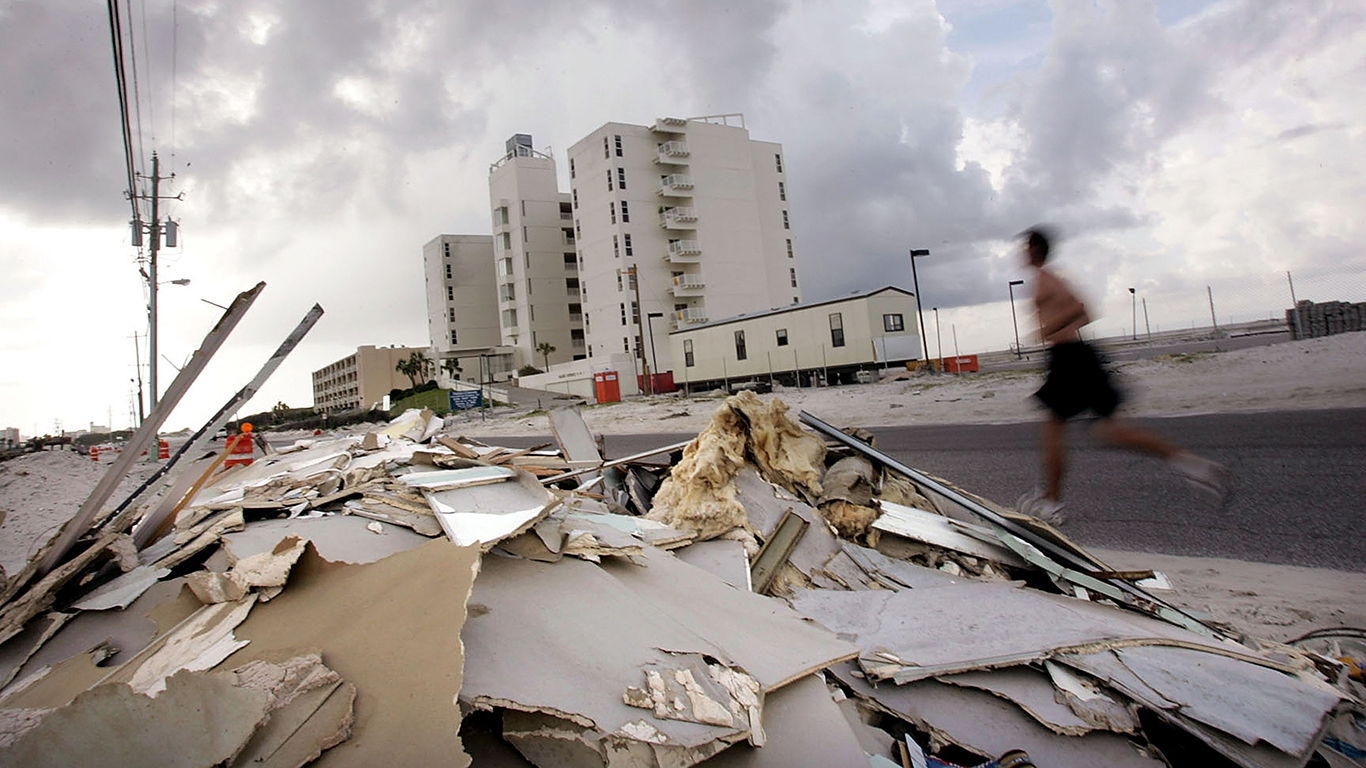
Source: Karsun Designs / Flickr
42. Hurricane Opal (October, 1995)
> Minimum pressure millibars: 942
> Max. wind speed at landfall: 100 mph
> Max. wind speed measured: 130 mph
> Affected area: Eastern Mexico, Alabama, Florida

Source: Ken Mayer / Flickr
41. Hurricane Gloria (September, 1985)
> Minimum pressure millibars: 942
> Max. wind speed at landfall: 90 mph
> Max. wind speed measured: 125 mph
> Affected area: Bahamas, U.S. East Coast, New England
Source: Mario Tama / Getty Images
40. Hurricane Gustav (August, 2008)
> Minimum pressure millibars: 941
> Max. wind speed at landfall: 135 mph
> Max. wind speed measured: 135 mph
> Affected area: Haiti, Cuba, and Louisiana
[in-text-ad]
Source: Win McNamee / Getty Images
39. Hurricane Dennis (July, 2005)
> Minimum pressure millibars: 941
> Max. wind speed at landfall: 120 mph
> Max. wind speed measured: 130 mph
> Affected area: Windward Islands, Jamaica, Cuba, western Florida
Source: Tim Boyles / Getty Images
38. Hurricane Charley (August, 2004)
> Minimum pressure millibars: 941
> Max. wind speed at landfall: 130 mph
> Max. wind speed measured: 130 mph
> Affected area: Jamaica, Grand Cayman Island, Cuba, Florida, Carolinas, Virginia
Source: NOAA Photo Library / Flickr
37. Great New England Hurricane (September, 1938)
> Minimum pressure millibars: 941
> Max. wind speed at landfall: 105 mph
> Max. wind speed measured: 140 mph
> Affected area: Long Island, New England
 24/7 Wall St.
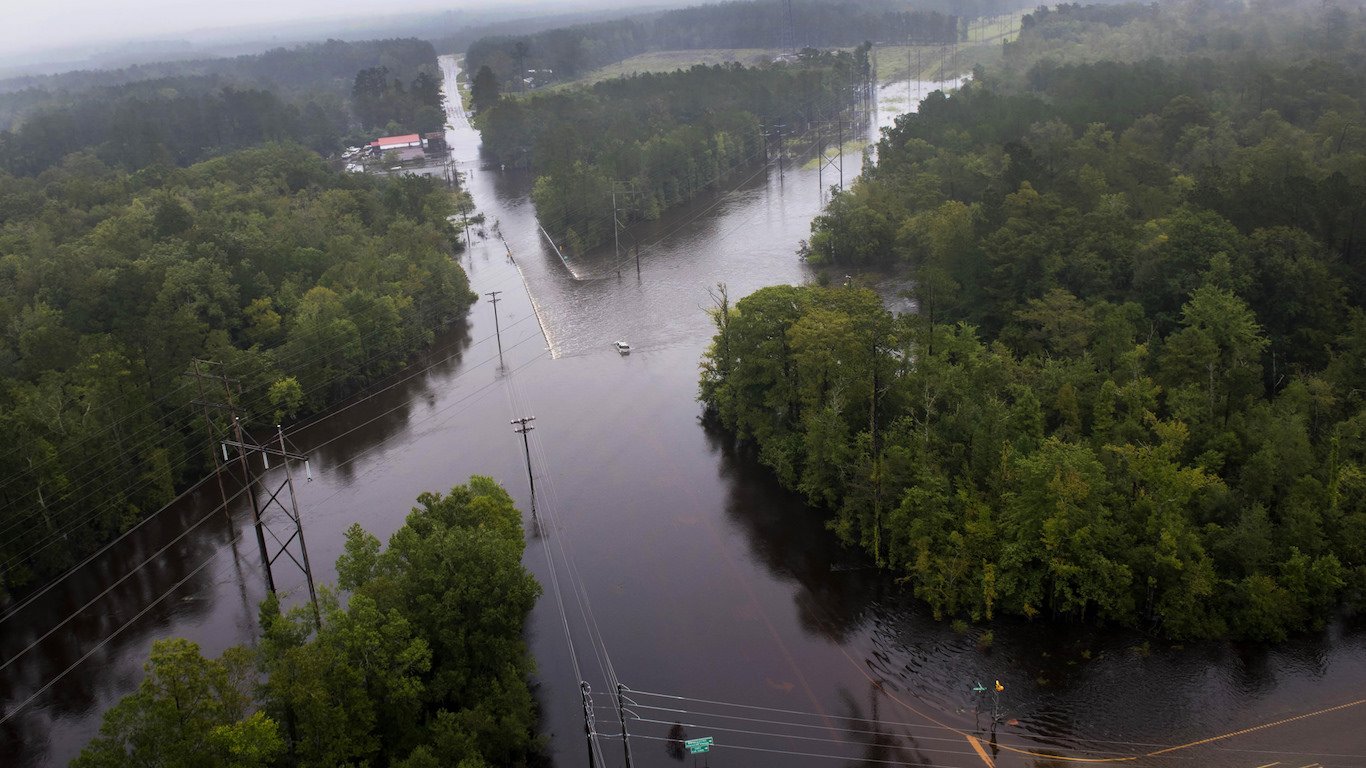
Source: U.S. Department of Agriculture / Flickr
36. Hurricane Joaquin (October, 2015)
> Minimum pressure millibars: 940
> Max. wind speed at landfall: 110 mph
> Max. wind speed measured: 135 mph
> Affected area: Cuba, Bermuda, Turks and Caicos Islands
Source: Florida Keys--Public Libraries / Flickr
35. 1948 Miami Hurricane (September, 1948)
> Minimum pressure millibars: 940
> Max. wind speed at landfall: 115 mph
> Max. wind speed measured: 115 mph
> Affected area: Cuba, Florida, Bahamas, Bermuda
Source: Hurricane Research Division / Wikimedia Commons
34. 1933 Cuba-Brownsville Hurricane (September, 1933)
> Minimum pressure millibars: 940
> Max. wind speed at landfall: 110 mph
> Max. wind speed measured: 140 mph
> Affected area: Bahamas, Cuba, southeastern Texas
[in-text-ad-2]
Source: Courtesy of the Library of Congress
33. 1915 Galveston Hurricane (August, 1915)
> Minimum pressure millibars: 940
> Max. wind speed at landfall: 115 mph
> Max. wind speed measured: 125 mph
> Affected area: Greater Antilles, southeastern Texas
Source: Courtesy of Toronto Public Library
32. Hurricane Hazel (October, 1954)
> Minimum pressure millibars: 938
> Max. wind speed at landfall: 115 mph
> Max. wind speed measured: 115 mph
> Affected area: Windward Islands, Haiti, Bahamas, U.S. East Coast, Canada,

Source: Georgia Emergency Management Agency / Wikimedia Commons
31. Hurricane Unnamed (October, 1898)
> Minimum pressure millibars: 938
> Max. wind speed at landfall: 115 mph
> Max. wind speed measured: 115 mph
> Affected area: Georgia, Florida
Source: Joe Raedle / Getty Images
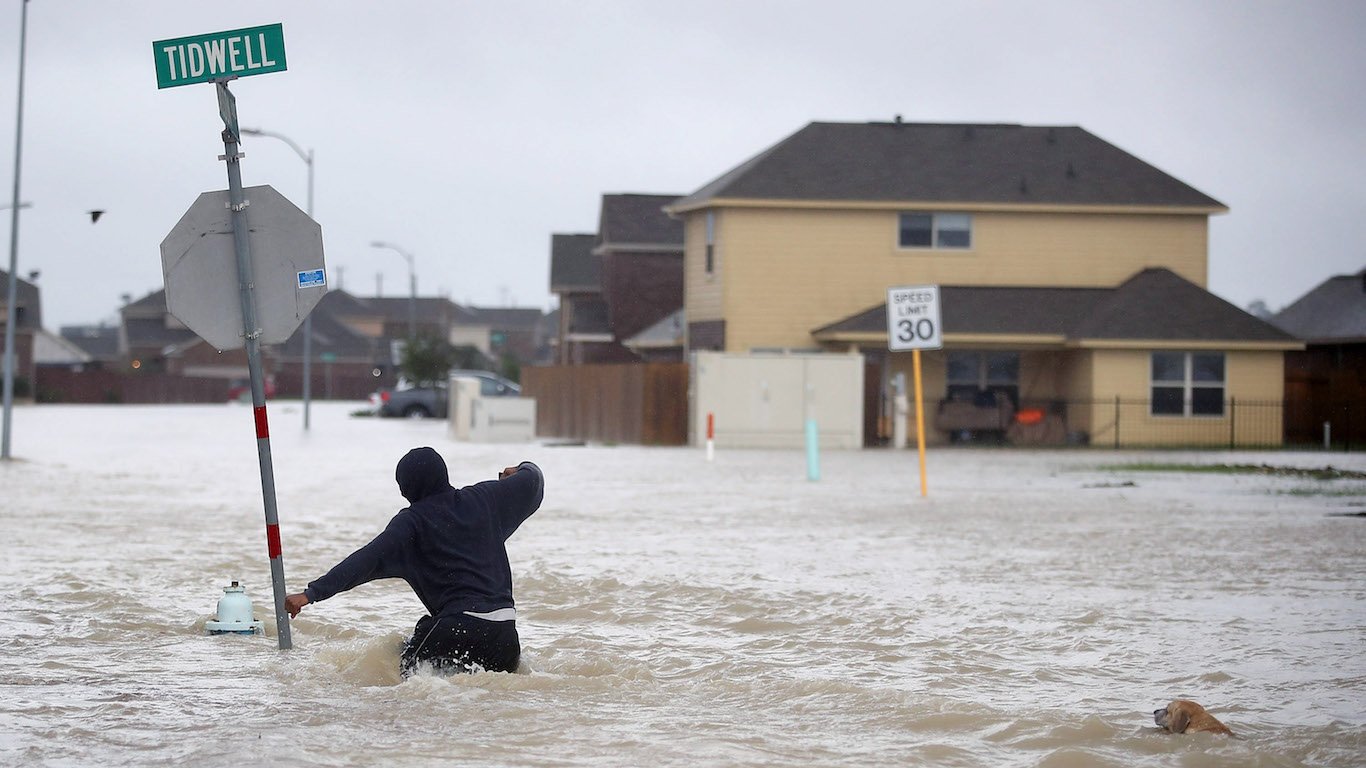
30. Hurricane Harvey (August, 2017)
> Minimum pressure millibars: 937
> Max. wind speed at landfall: 115 mph
> Max. wind speed measured: 115 mph
> Affected area: Southeastern Texas
[in-text-ad]
Source: Scott Olson / Getty Images
29. Hurricane Rita (September, 2005)
> Minimum pressure millibars: 937
> Max. wind speed at landfall: 100 mph
> Max. wind speed measured: 155 mph
> Affected area: Southeastern Texas, southwestern Louisiana, Florida Keys

Source: Susana Gonzalez / Getty Images
28. Hurricane Isidore (September, 2002)
> Minimum pressure millibars: 936
> Max. wind speed at landfall: 110 mph
> Max. wind speed measured: 110 mph
> Affected area: Cuba, eastern Mexico, Louisiana

Source: National Oceanic and Atmospheric Administration / Department of Commerce
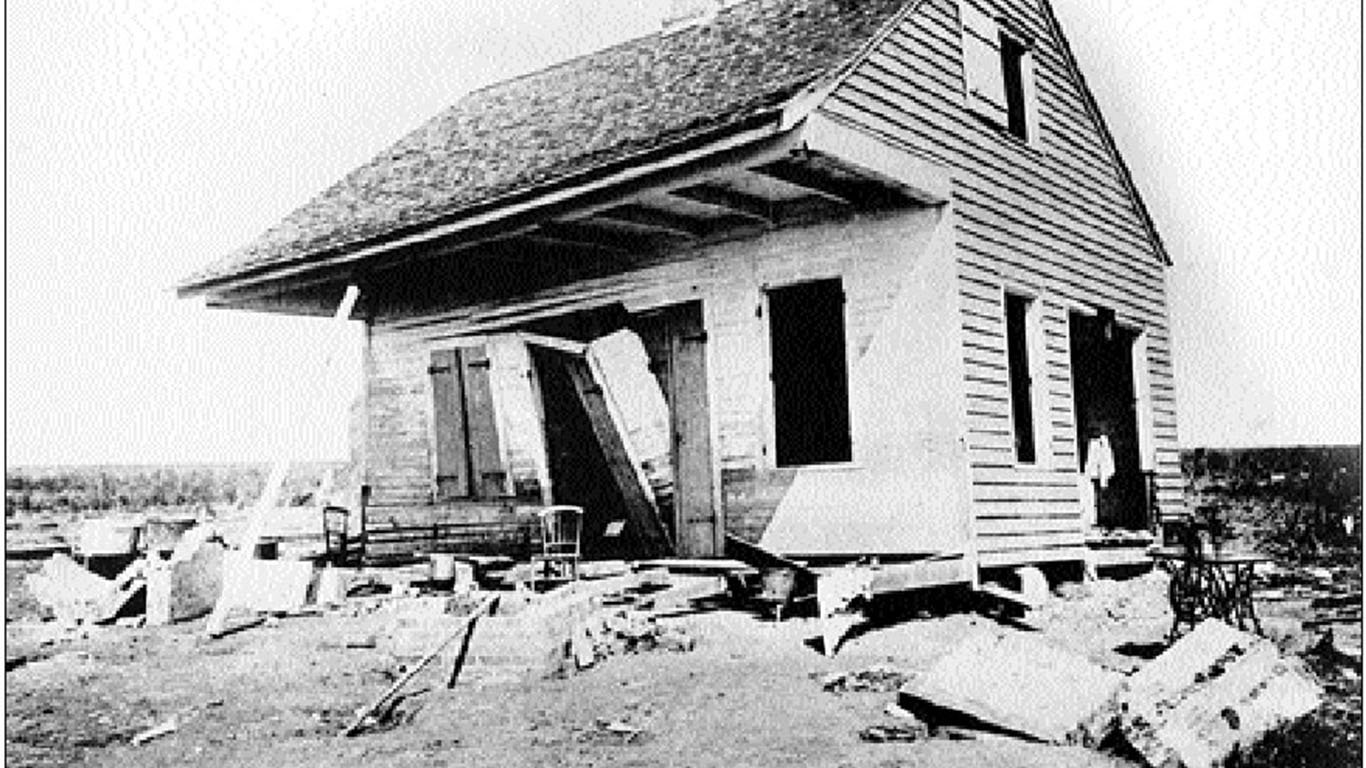
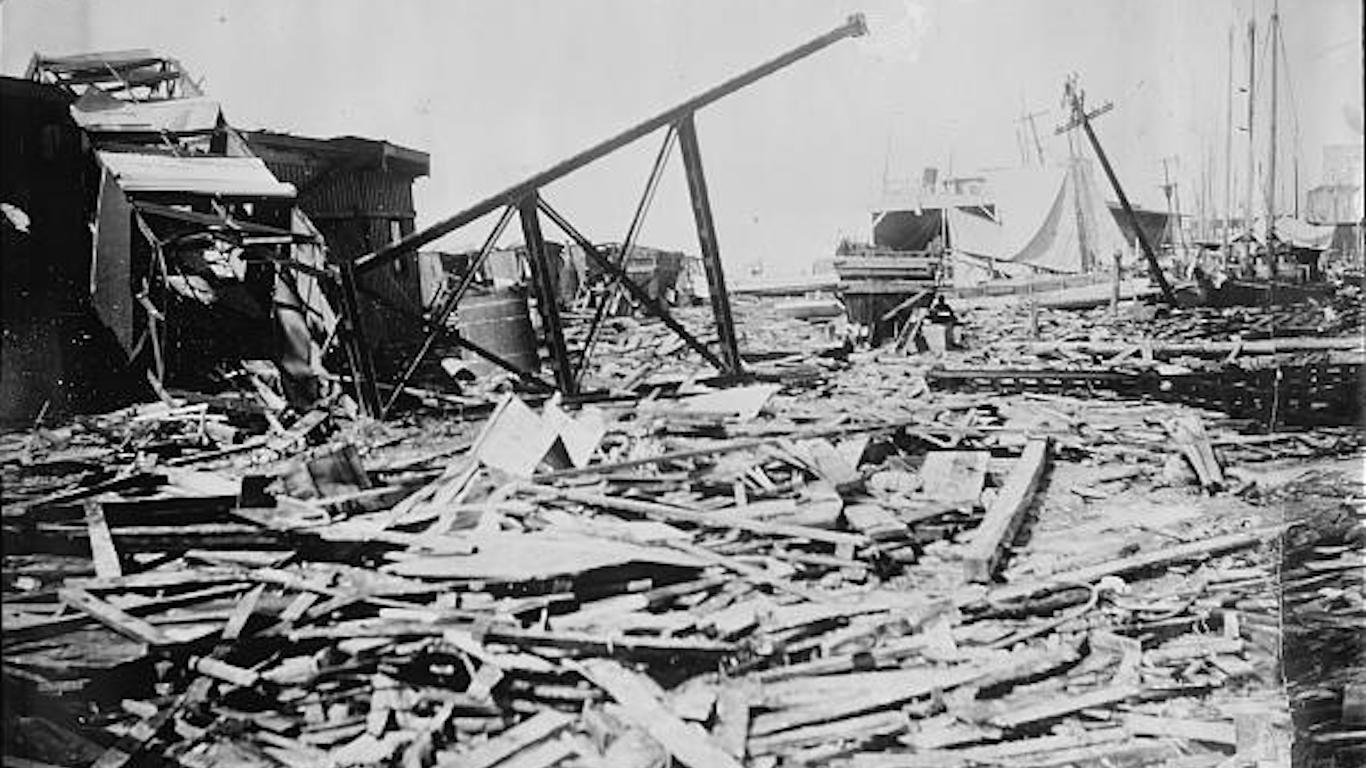
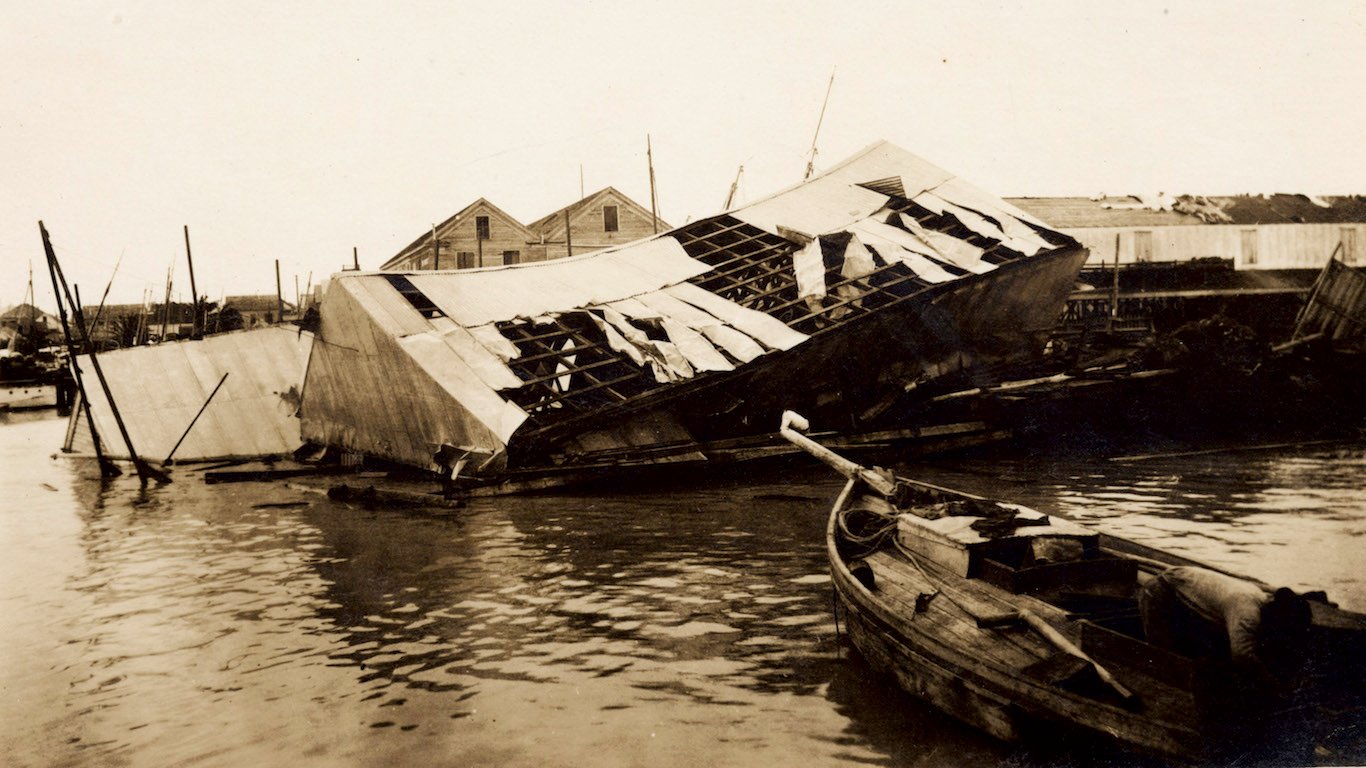
27. The Galveston Hurricane of 1900 (September, 1900)
> Minimum pressure millibars: 936
> Max. wind speed at landfall: 120 mph
> Max. wind speed measured: 125 mph
> Affected area: Cuba, southeastern Texas
 24/7 Wall St.
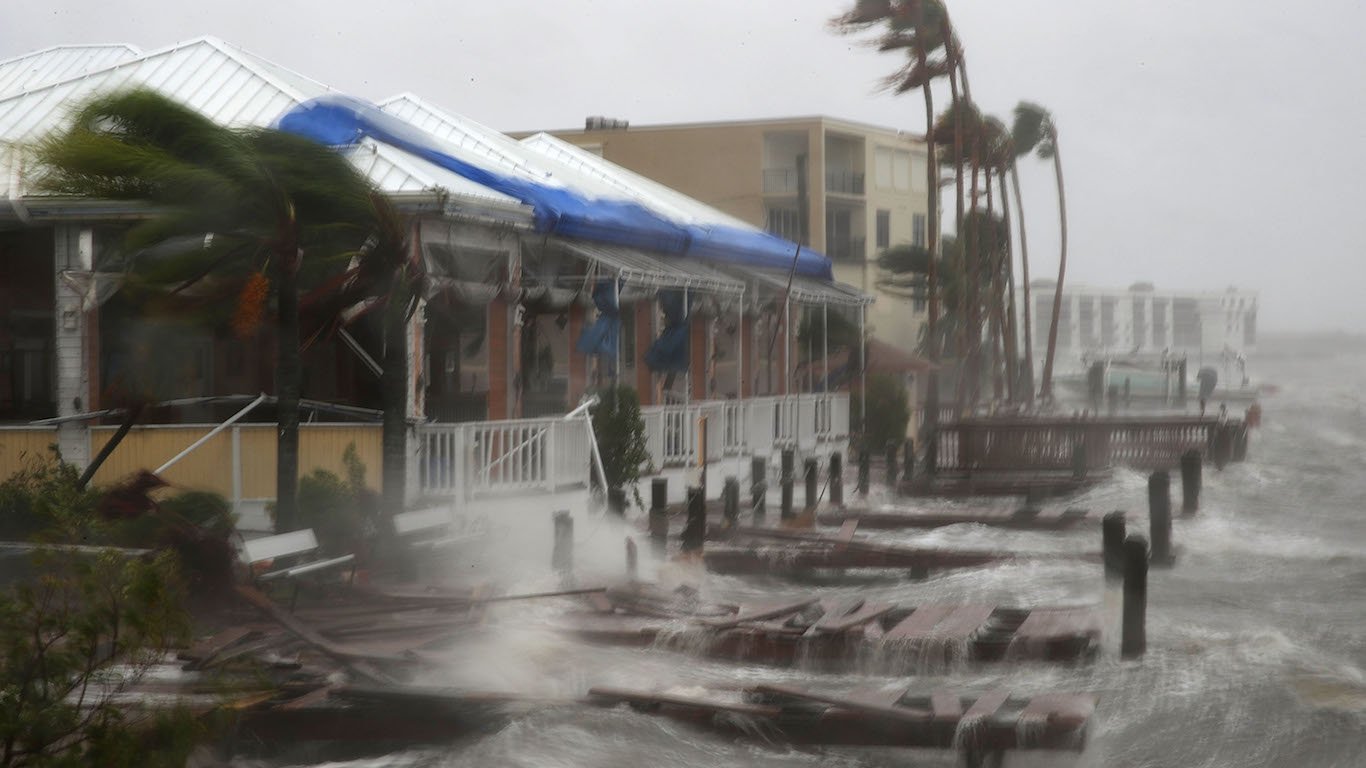
Source: Mark Wilson / Getty Images
26. Hurricane Matthew (October, 2016)
> Minimum pressure millibars: 935
> Max. wind speed at landfall: 130 mph
> Max. wind speed measured: 145 mph
> Affected area: Haiti, Cuba, Bahamas, South Carolina
Source: NOAA / Wikimedia Commons
25. 1932 Freeport Hurricane (August, 1932)
> Minimum pressure millibars: 935
> Max. wind speed at landfall: 130 mph
> Max. wind speed measured: 130 mph
> Affected area: Southeastern Texas
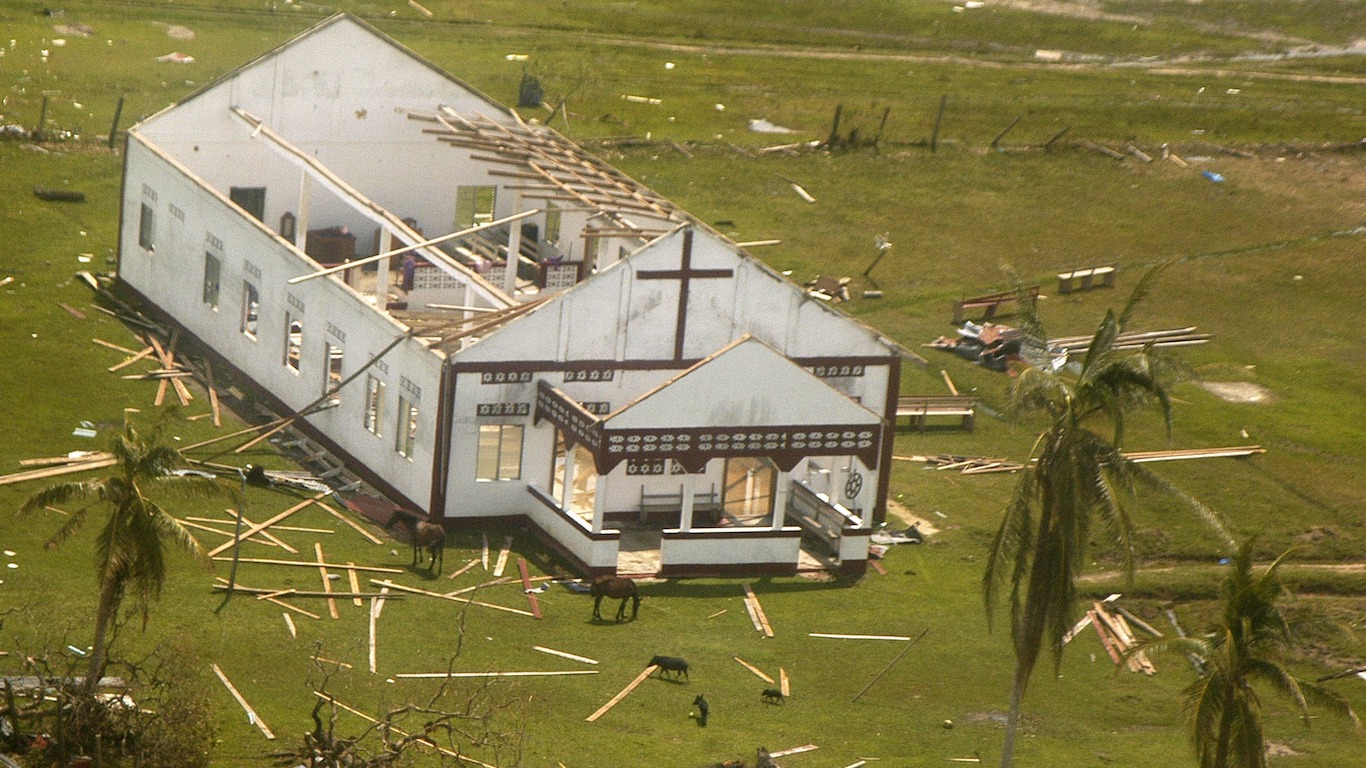
Source: Mass Communication Specialist 2nd Class Zachary Borden / U.S. Navy via Getty Images
24. Hurricane Felix (September, 2007)
> Minimum pressure millibars: 934
> Max. wind speed at landfall: 140 mph
> Max. wind speed measured: 150 mph
> Affected area: Nicaragua
[in-text-ad-2]

Source: Gary Williams / Getty Images
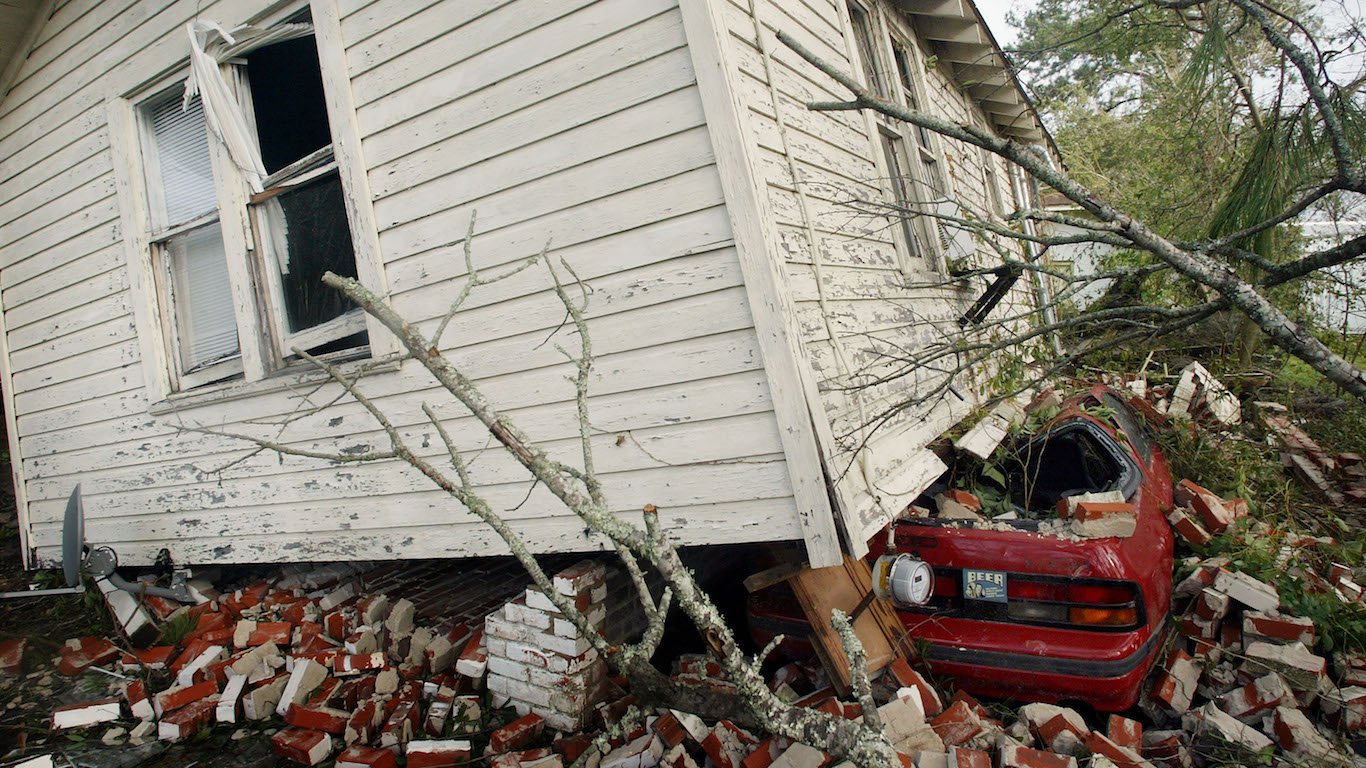
23. Hurricane Hugo (September, 1989)
> Minimum pressure millibars: 934
> Max. wind speed at landfall: 120 mph
> Max. wind speed measured: 140 mph
> Affected area: Leeward Islands, U.S. Virgin Islands, Puerto Rico, Carolinas
Source: NOAA Central Library / Wikimedia Commons
22. Hurricane Fox (October, 1952)
> Minimum pressure millibars: 934
> Max. wind speed at landfall: 125 mph
> Max. wind speed measured: 125 mph
> Affected area: Cuba, Florida, Bahamas
Source: Public Domain / Wikimedia Commons
21. 1856 Last Island Hurricane (August, 1856)
> Minimum pressure millibars: 934
> Max. wind speed at landfall: 130 mph
> Max. wind speed measured: 130 mph
> Affected area: Coastal Louisiana
Source: Courtesy of NOAA / Getty Images
20. Hurricane Lenny (November, 1999)
> Minimum pressure millibars: 933
> Max. wind speed at landfall: 135 mph
> Max. wind speed measured: 135 mph
> Affected area: Eastern Caribbean islands, Leeward and Windward islands
[in-text-ad]
Source: Courtesy of NOAA
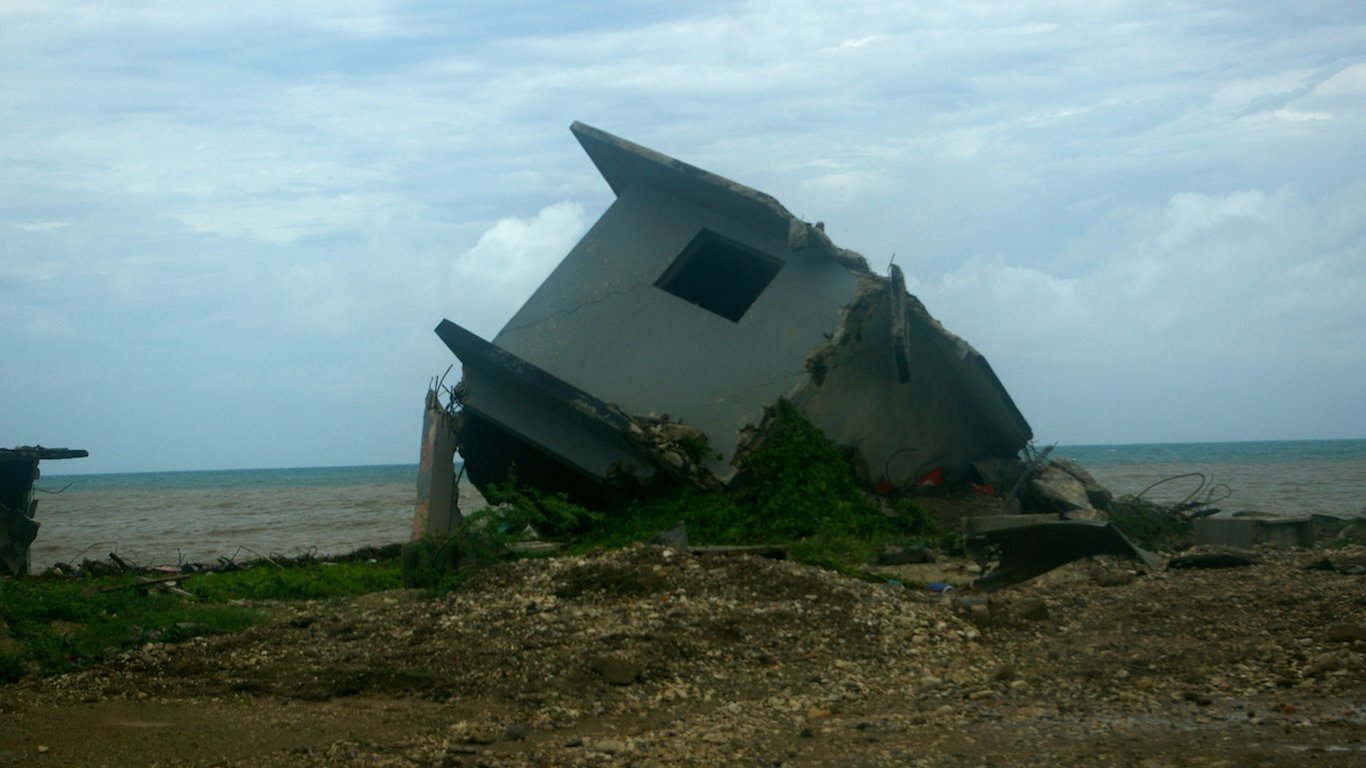
19. Hurricane Joan (October, 1988)
> Minimum pressure millibars: 932
> Max. wind speed at landfall: 125 mph
> Max. wind speed measured: 125 mph
> Affected area: North coast of South America, Central America, Curacao, Guajira Peninsula of Colombia

Source: Public Domain / Wikimedia Commons
18. 1916 Texas Hurricane (August, 1916)
> Minimum pressure millibars: 932
> Max. wind speed at landfall: 115 mph
> Max. wind speed measured: 115 mph
> Affected area: Caribbean islands, southeastern Texas
Source: Public Domain / Wikimedia Commons
17. 2nd Hurricane of 1880 Season (August, 1880)
> Minimum pressure millibars: 931
> Max. wind speed at landfall: 130 mph
> Max. wind speed measured: 130 mph
> Affected area: Southeastern Texas
 24/7 Wall St.
Source: DAVE GATLEY / FEMA News Photo / Liaison Agency / Getty Images
16. Hurricane Floyd (September, 1999)
> Minimum pressure millibars: 930
> Max. wind speed at landfall: 105 mph
> Max. wind speed measured: 135 mph
> Affected area: Bahamas, North Carolina, mid-Atlantic states, New England
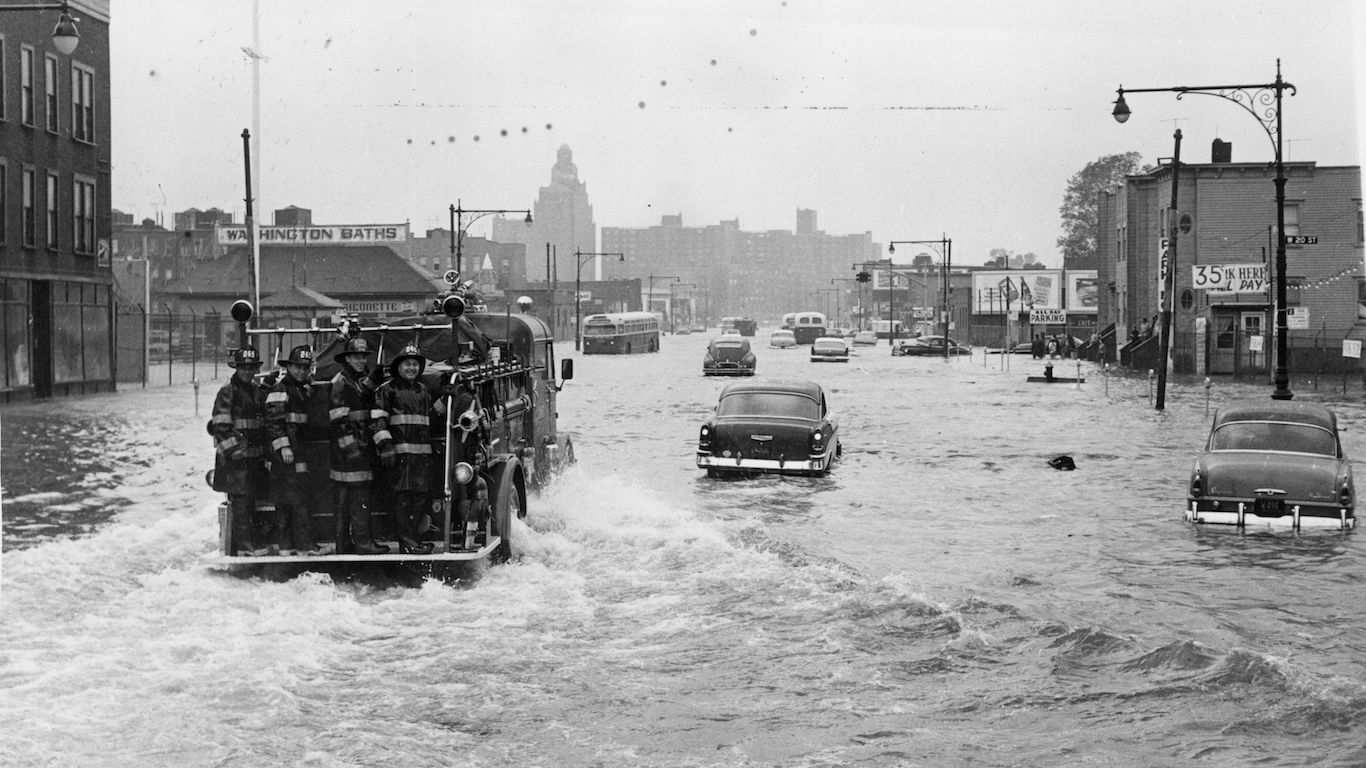
Source: Keystone / Getty Images
15. Hurricane Donna (September, 1960)
> Minimum pressure millibars: 930
> Max. wind speed at landfall: 125 mph
> Max. wind speed measured: 125 mph
> Affected area: Puerto Rico, Bahamas, Leeward Islands, mid-Atlantic states, New England, Florida

Source: Vintage Images / Getty Images
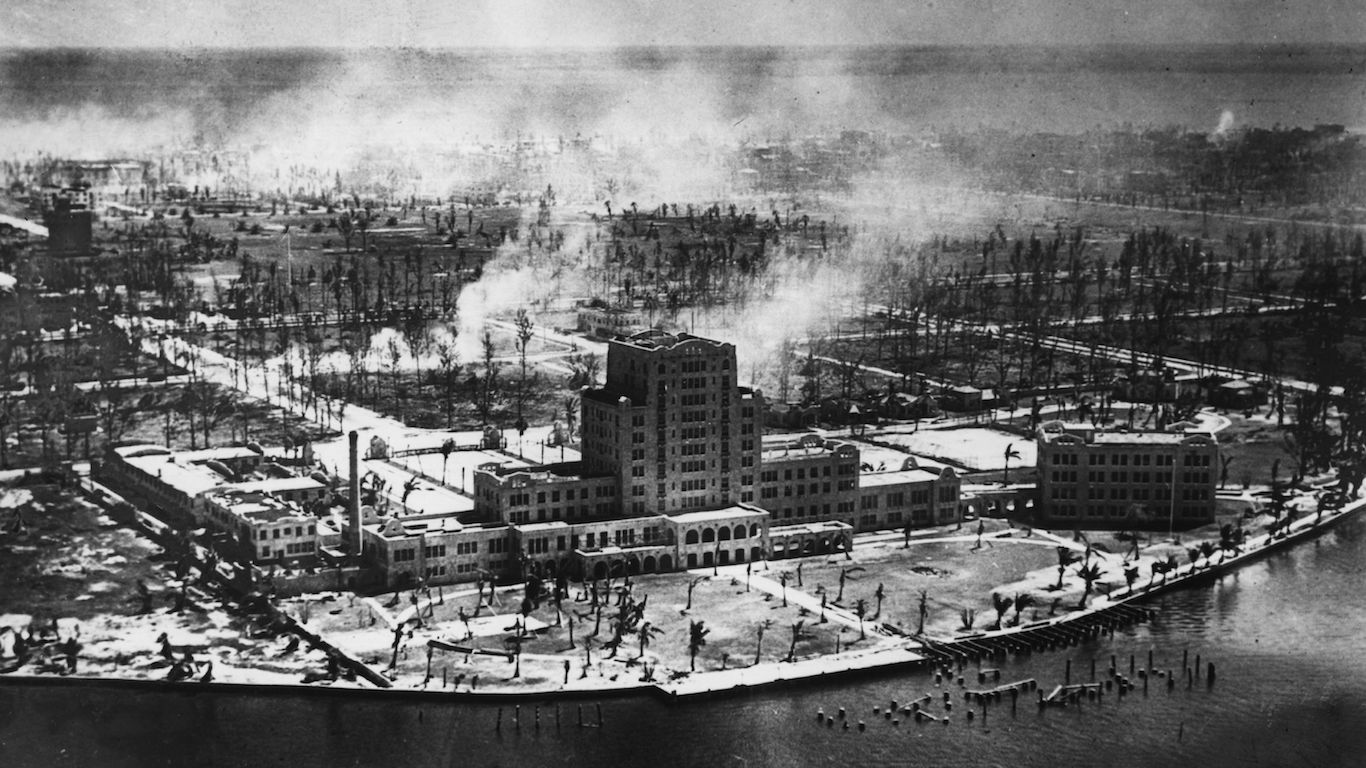
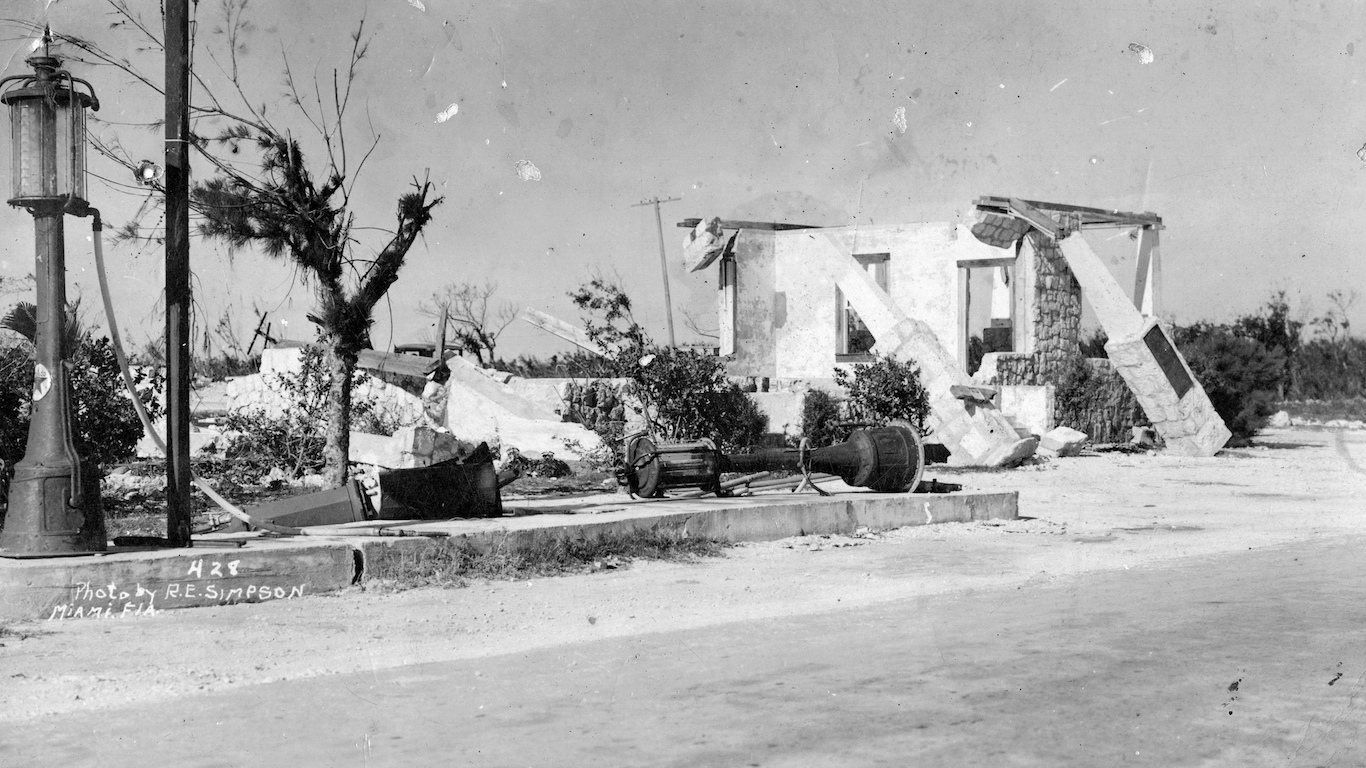
14. “The Great Miami Hurricane” (September, 1926)
> Minimum pressure millibars: 930
> Max. wind speed at landfall: 125 mph
> Max. wind speed measured: 130 mph
> Affected area: Turks Island, Bahamas, Florida, Louisiana
[in-text-ad-2]

Source: Public Domain / Wikimedia Commons
13. “The Great Okeechobee Hurricane” (September, 1928)
> Minimum pressure millibars: 929
> Max. wind speed at landfall: 125 mph
> Max. wind speed measured: 140 mph
> Affected area: Leeward Islands, Bahamas, Puerto Rico, Florida
Source: Richard Patterson / Getty Images
12. Hurricane Wilma (October, 2005)
> Minimum pressure millibars: 927
> Max. wind speed at landfall: 130 mph
> Max. wind speed measured: 160 mph
> Affected area: Jamaica, Grand Cayman Island, eastern Mexico, Florida
Source: Florida Keys—Public Libraries / Wikimedia Commons
11. “The Florida Keys Hurricane” (September, 1919)
> Minimum pressure millibars: 927
> Max. wind speed at landfall: 130 mph
> Max. wind speed measured: 130 mph
> Affected area: Dominican Republic, Bahamas, Florida Keys, southeastern Texas
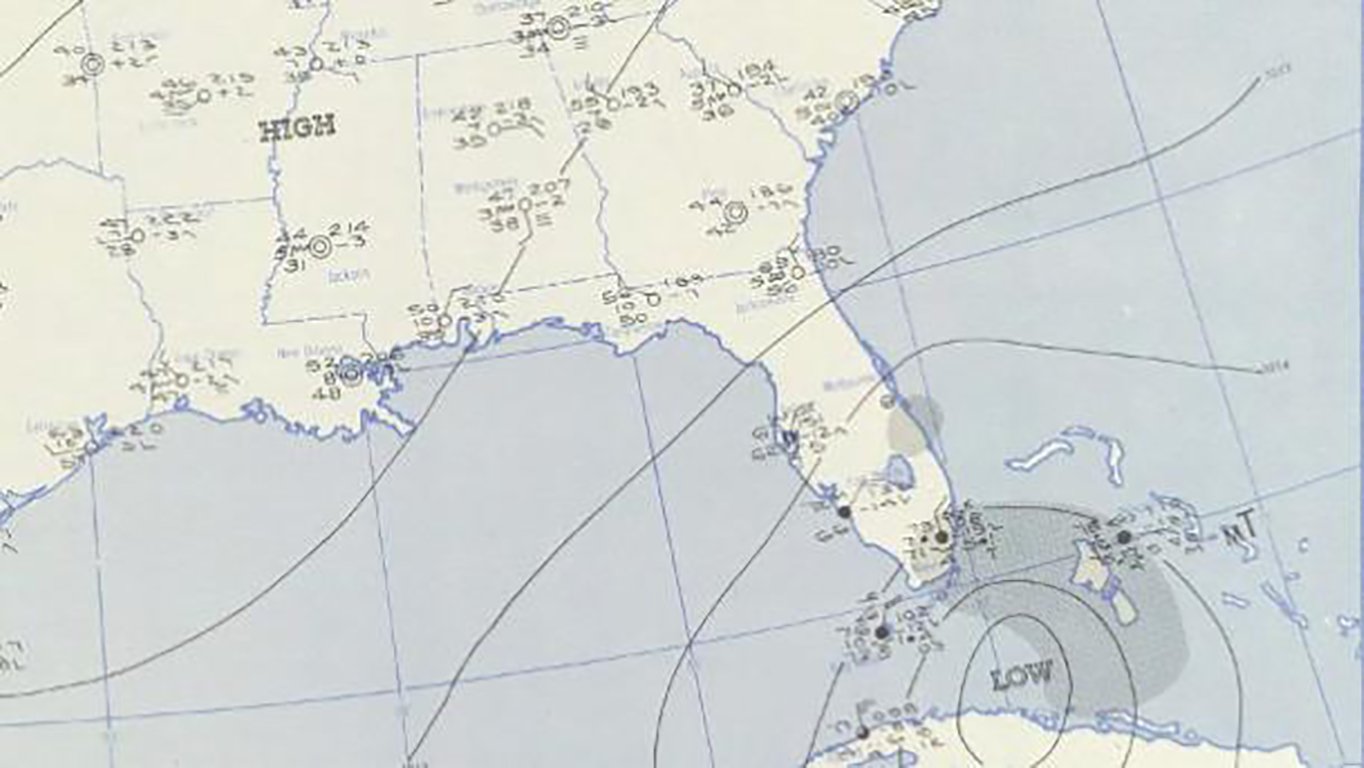
Source: Courtesy of NOAA
10. “The Great Indianola Hurricane” (August, 1886)
> Minimum pressure millibars: 925
> Max. wind speed at landfall: 130 mph
> Max. wind speed measured: 130 mph
> Affected area: Southeastern Texas
[in-text-ad]

Source: NOAA Photo Library / Flickr
9. Hurricane Andrew (August, 1992)
> Minimum pressure millibars: 922
> Max. wind speed at landfall: 145 mph
> Max. wind speed measured: 150 mph
> Affected area: Bermuda, Puerto Rico, Florida, Louisiana
Source: Mario Tama / Getty Images
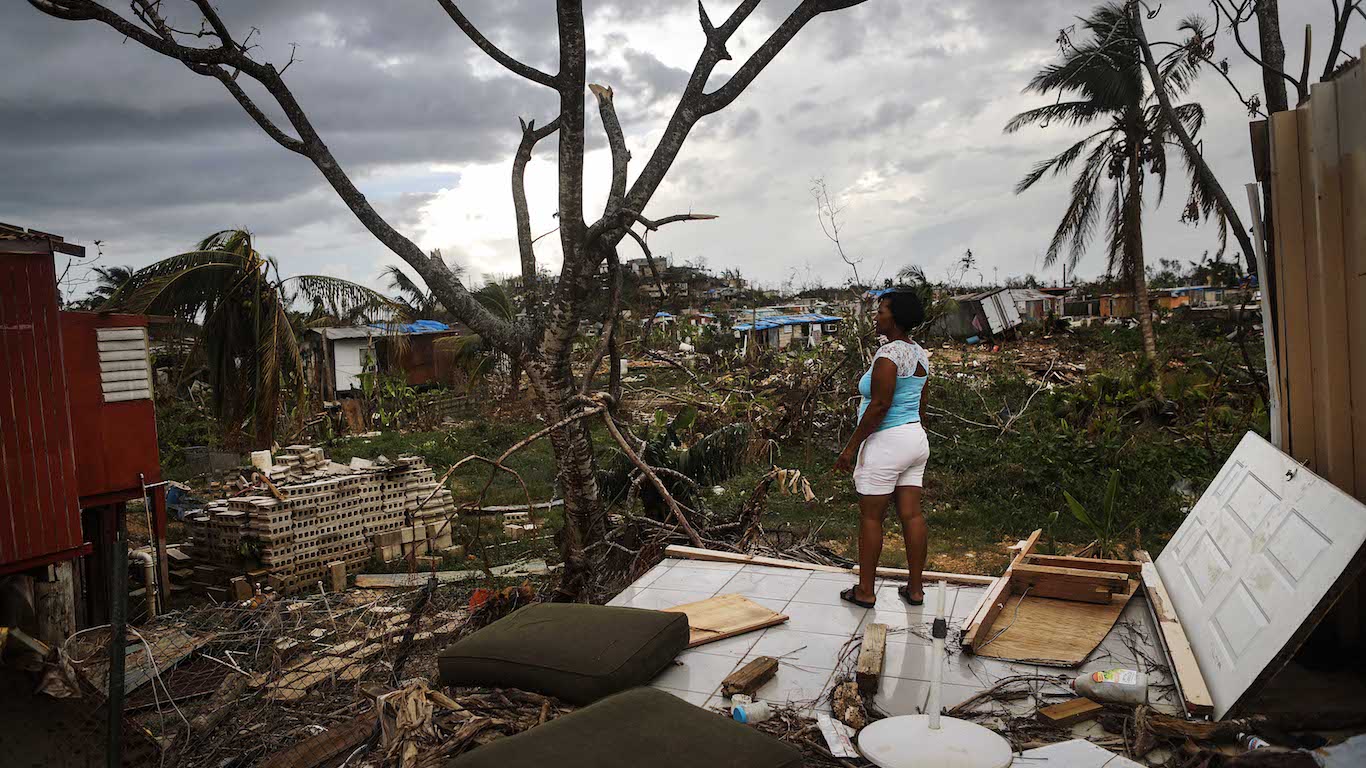
8. Hurricane Maria (September, 2017)
> Minimum pressure millibars: 920
> Max. wind speed at landfall: 135 mph
> Max. wind speed measured: 150 mph
> Affected area: Puerto Rico, northeastern Caribbean islands
Source: Mark Wilson / Getty Images
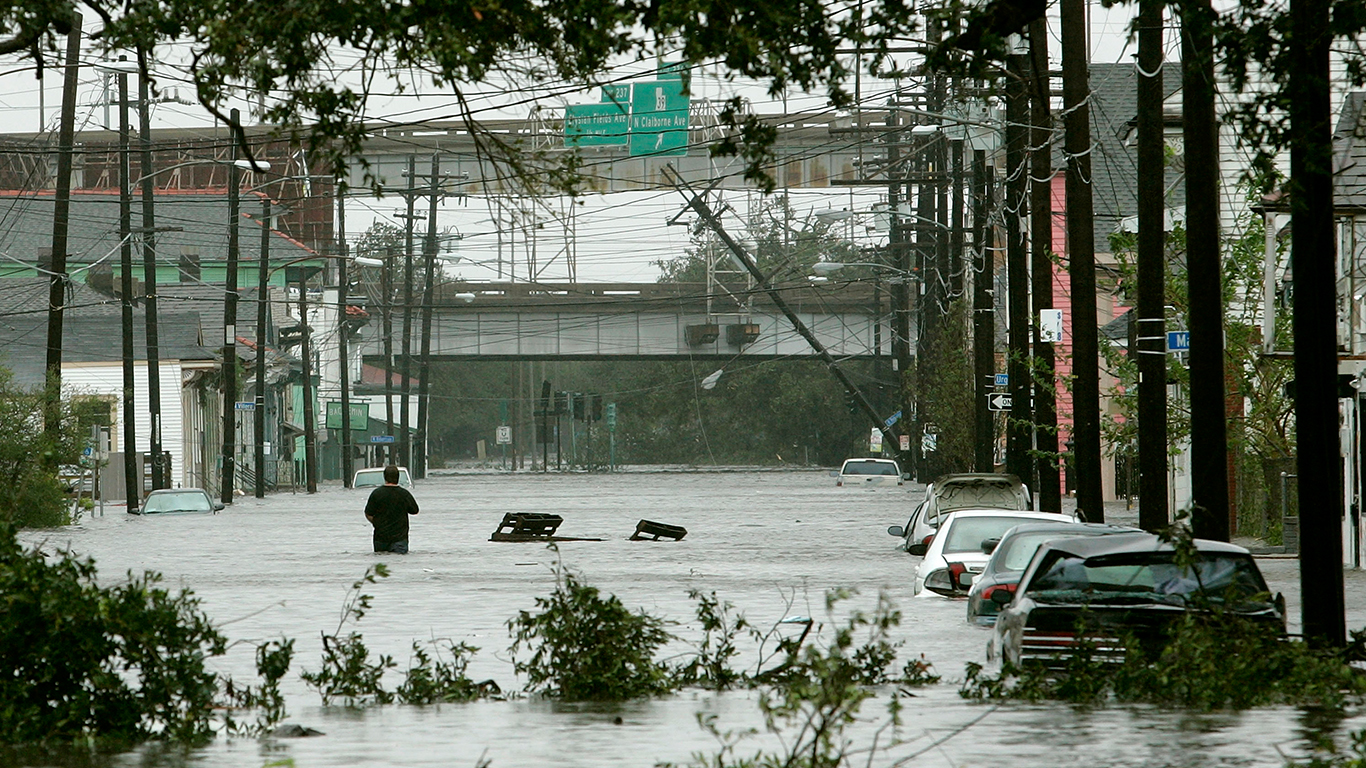
7. Hurricane Katrina (August, 2005)
> Minimum pressure millibars: 920
> Max. wind speed at landfall: 110 mph
> Max. wind speed measured: 150 mph
> Affected area: Louisiana, Mississippi, Alabama
Source: Chip Somodevilla / Getty Images
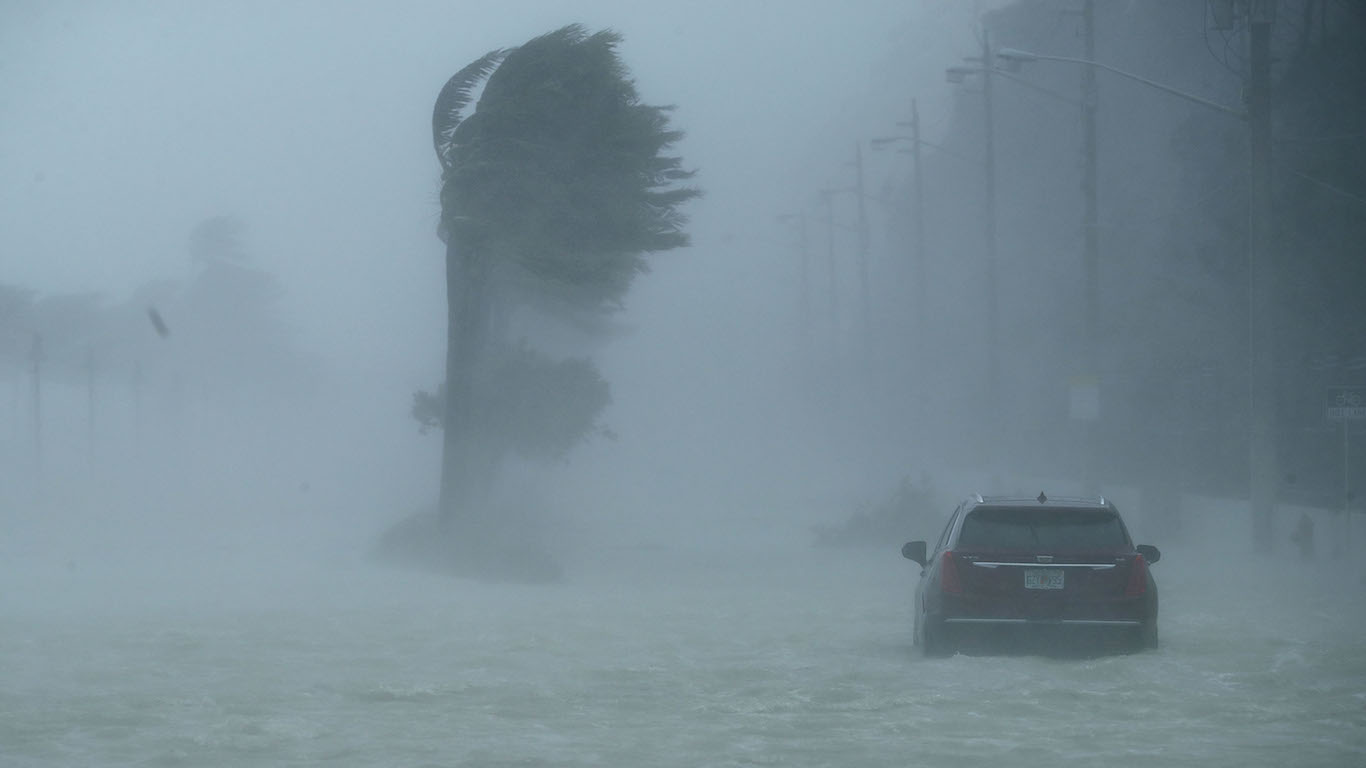
6. Hurricane Irma (September, 2017)
> Minimum pressure millibars: 914
> Max. wind speed at landfall: 155 mph
> Max. wind speed measured: 155 mph
> Affected area: Caribbean islands, Florida

Source: SDASM Archives / Flickr
5. Hurricane Janet (September, 1955)
> Minimum pressure millibars: 914
> Max. wind speed at landfall: 150 mph
> Max. wind speed measured: 150 mph
> Affected area: Caribbean islands, Mexico
Source: Christina Xu / Flickr
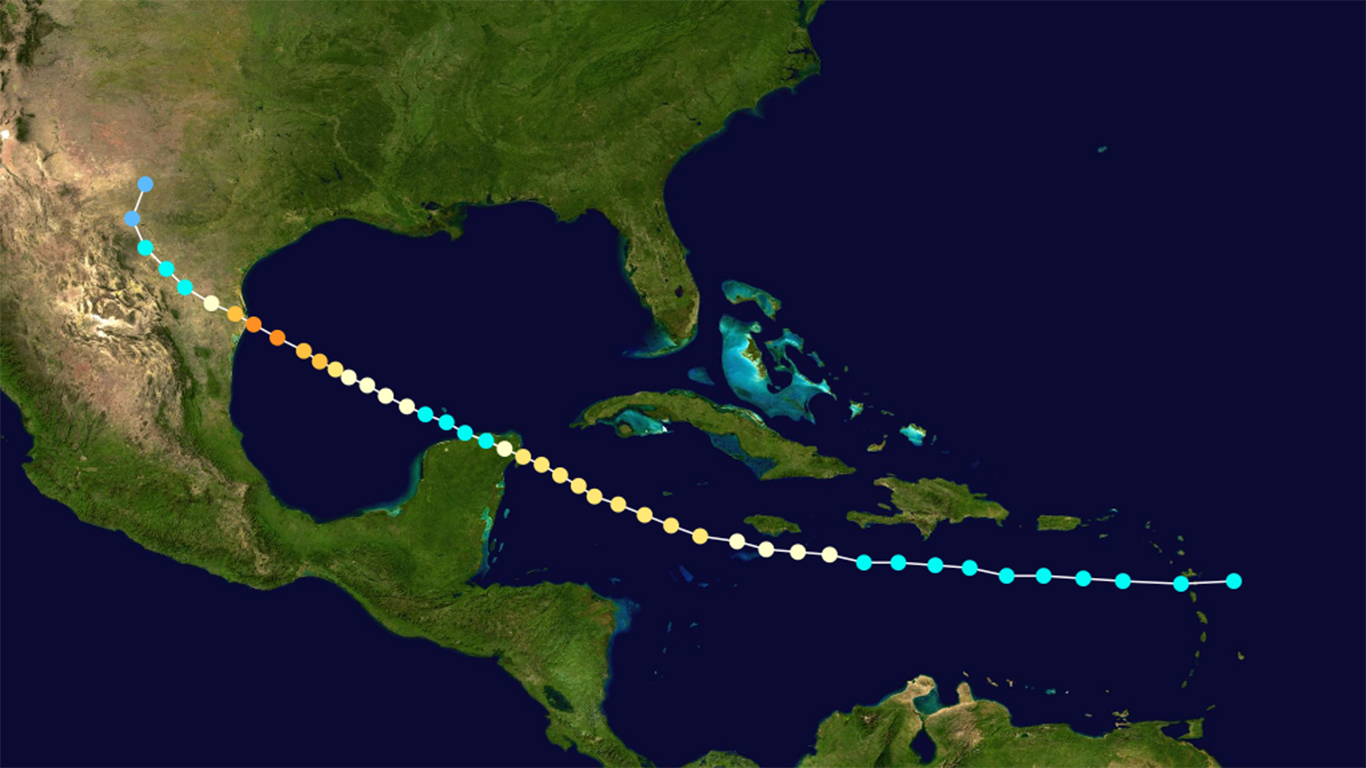
4. Hurricane Dean (August, 2007)
> Minimum pressure millibars: 905
> Max. wind speed at landfall: 150 mph
> Max. wind speed measured: 150 mph
> Affected area: Jamaica, eastern Mexico,
[in-text-ad-2]
Source: Courtesy of NOAA
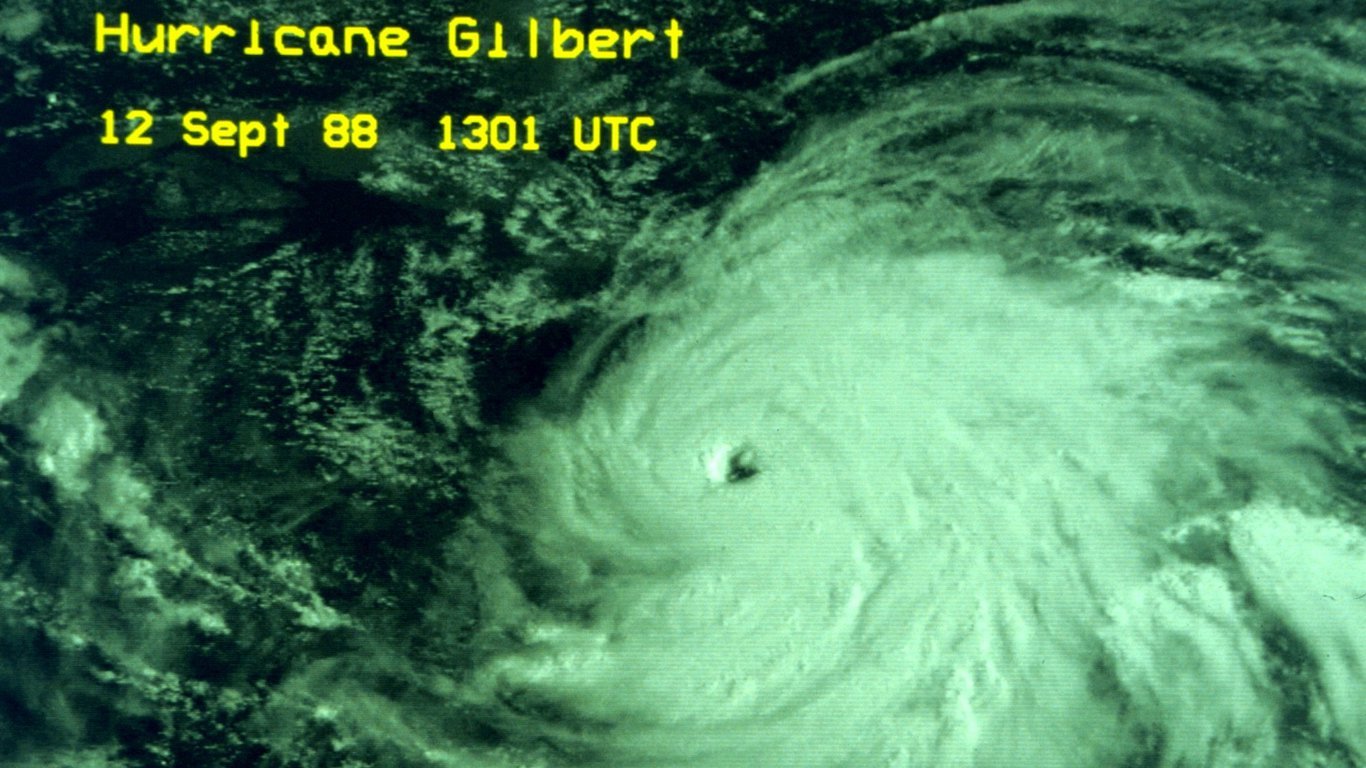
3. Hurricane Gilbert (September, 1988)
> Minimum pressure millibars: 900
> Max. wind speed at landfall: 140 mph
> Max. wind speed measured: 160 mph
> Affected area: Caribbean islands, Central America, parts of U.S.
Source: The Library of Virginia / Wikimedia Commons
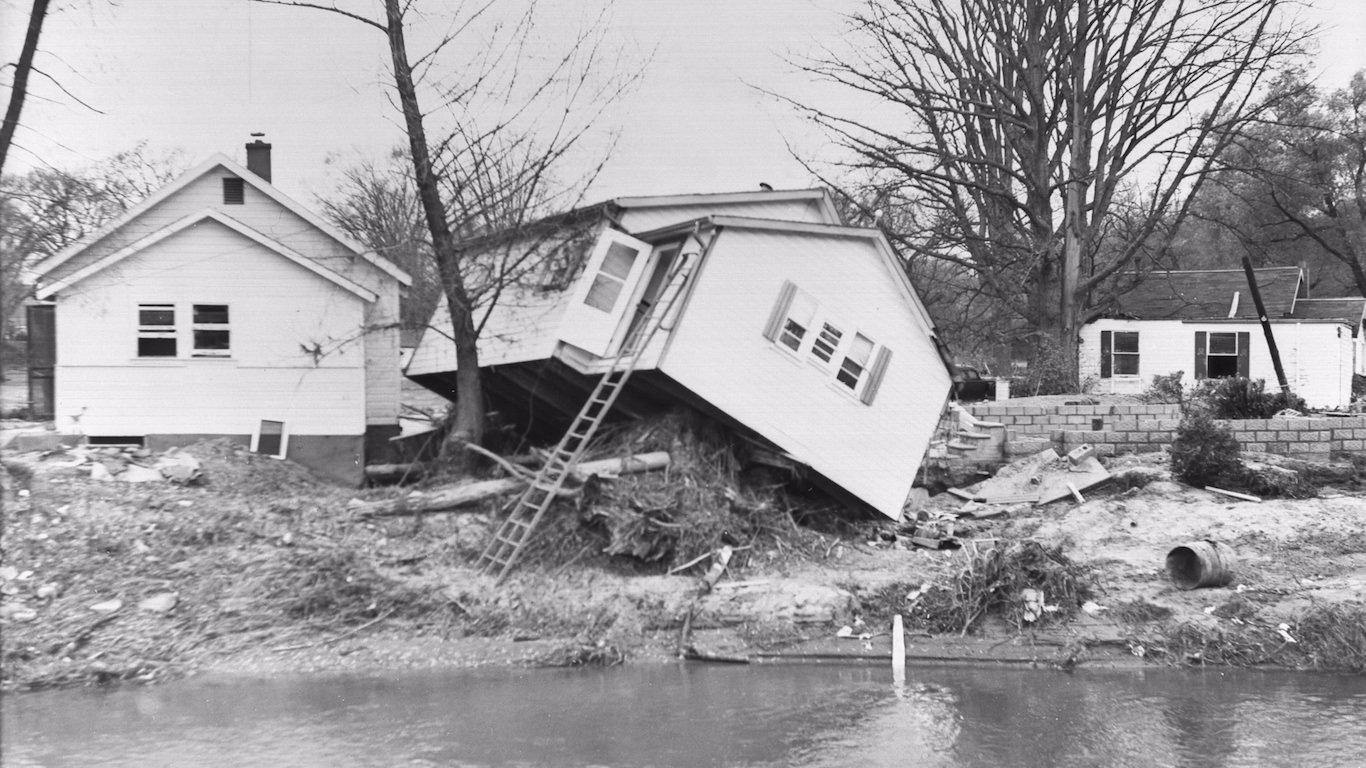
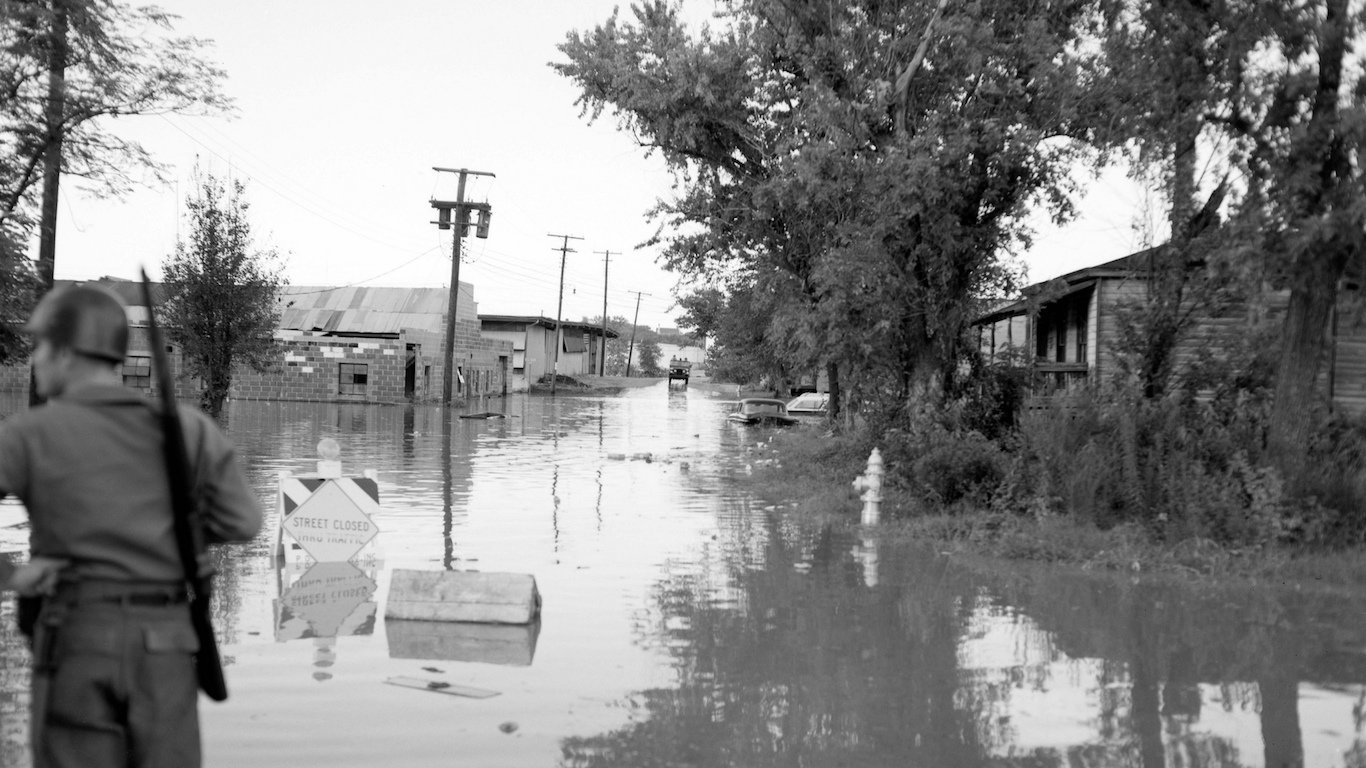
2. Hurricane Camille (August, 1969)
> Minimum pressure millibars: 900
> Max. wind speed at landfall: 150 mph
> Max. wind speed measured: 150 mph
> Affected area: Cuba, southern U.S.
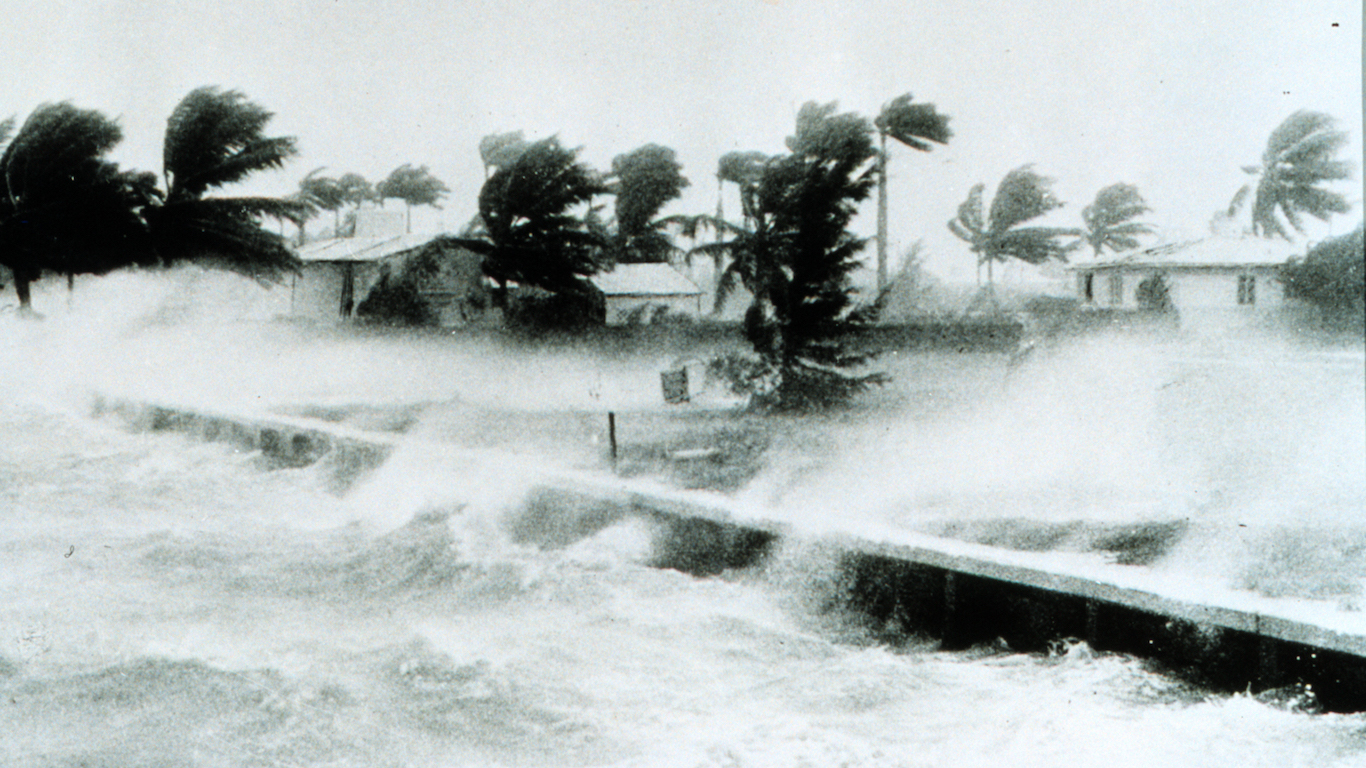
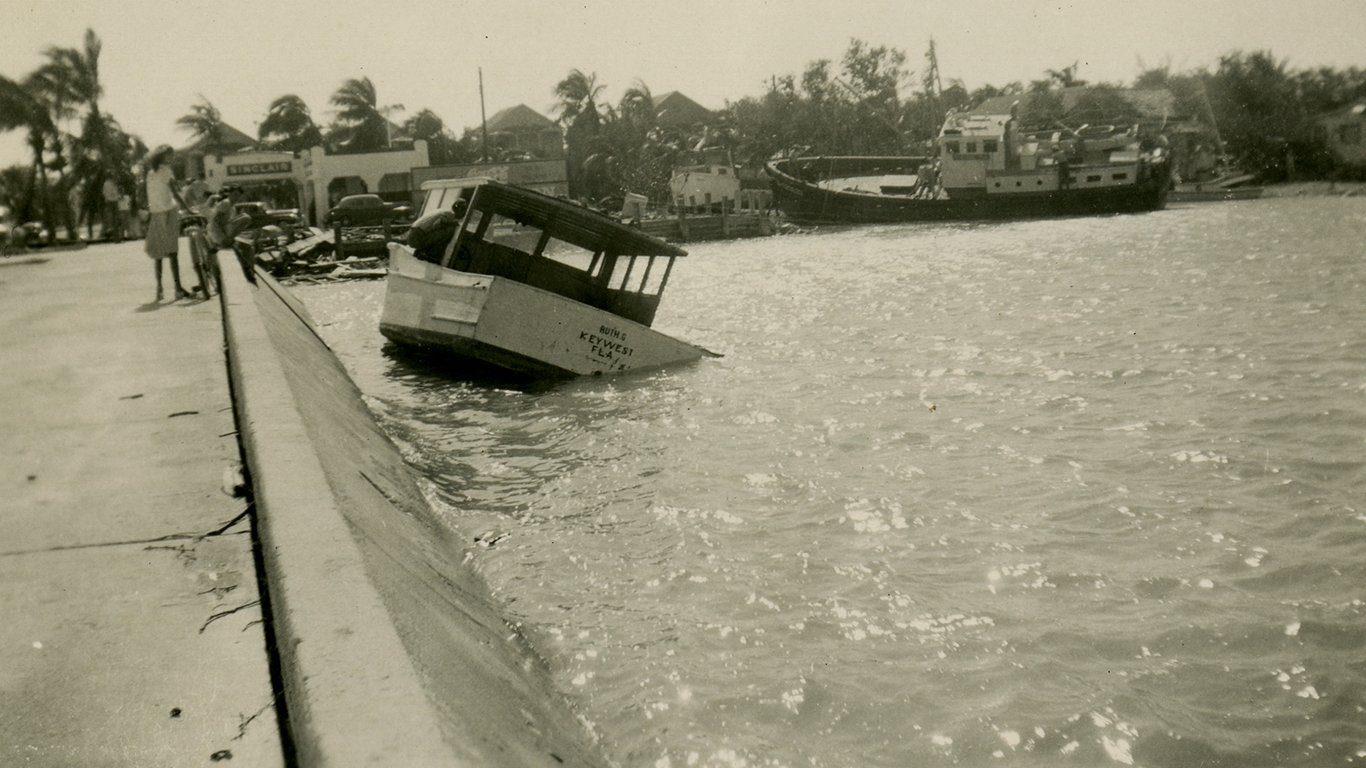
Source: Florida Keys--Public Libraries / Flickr
1. “The Labor Day Storm” (September, 1935)
> Minimum pressure millibars: 892
> Max. wind speed at landfall: 160 mph
> Max. wind speed measured: 160 mph
> Affected area: Andros Island, Florida Keys
Detailed Findings
The most intense hurricanes as measured by minimum central pressure are not necessarily the deadliest or costliest storms. In most cases, the amount of damage caused by a hurricane does not only depend on its intensity but also on the amount and value of property at risk in the storm’s path. Much of the damage caused by the costliest hurricanes was caused by inland flooding triggered by torrential rain. Many of the deadliest and most expensive hurricanes made landfall in states along the Gulf Coast, where the infrastructure and economies of major cities are based on proximity to oceans and rivers.
Many of the largest hurricane death tolls resulted from storm surges that caused the ocean level to rise 10 feet or higher. In the Great Galveston Hurricane in 1900, the deadliest tropical cyclone in U.S. history, a storm surge covered all of Galveston Island off the Texas Gulf Coast in 8 to 12 feet of water, destroying nearly all buildings in the vicinity and leading to the deaths of possibly 8,000 people by drowning or being crushed by debris.
While hurricanes may be growing more intense and frequent, disaster preparedness also is becoming more effective. Hurricane forecasting has advanced considerably over the last century and advanced warning has helped minimize the deadliness of many of the most powerful storms of the last several decades. Excluding 2005 — the year Hurricane Katrina directly killed about 1,200 people — the 10 years with the highest hurricane-caused death counts are all before 1960. Excluding Katrina, NOAA has reported 1,300 deaths caused by hurricanes since 1960, compared with 14,645 deaths reported between 1900 and 1960.
While hurricanes are becoming less deadly as damage mitigation strategies and disaster preparedness improve, they are also becoming more destructive. The 10 costliest hurricanes have all occurred since 1992. This may be partially because of the increased amount of property at risk today in comparison with previous decades. Adjusted for inflation, the costliest hurricanes in U.S. history were Hurricane Katrina in 2005, Hurricanes Harvey and Irma in 2017, Hurricane Andrew in 1992, and Hurricane Ike in 2008.
Tropical cyclone activity in the Atlantic Ocean often peaks in the late summer, when the temperature differences between the wind and sea surface are the greatest. Of the 70 most intense hurricanes since 1851, 63 occurred in August, September, or October.
Methodology
To identify the most powerful hurricanes, 24/7 Wall St. reviewed the National Oceanic and Atmospheric Administration’s hurricane database (HURDAT 2), which tracks the date, time, location, minimum pressure (in millibars) and wind data for hurricane episodes from 1851 to 2017. Hurricanes were ranked according to their minimum pressure in millibars, where one millibar is the equivalent of 100 pascals in pressure. The lower a storm’s minimum pressure, the stronger the storm is. For context, air pressure is 1,013 millibars at sea level.
Take This Retirement Quiz To Get Matched With A Financial Advisor (Sponsored)
Take the quiz below to get matched with a financial advisor today.
Each advisor has been vetted by SmartAsset and is held to a fiduciary standard to act in your best interests.
Here’s how it works:
1. Answer SmartAsset advisor match quiz
2. Review your pre-screened matches at your leisure. Check out the
advisors’ profiles.
3. Speak with advisors at no cost to you. Have an introductory call on the phone or introduction in person and choose whom to work with in the future
Take the retirement quiz right here.
Thank you for reading! Have some feedback for us?
Contact the 24/7 Wall St. editorial team.
Editors' Picks