According to a recent Gallup poll, some 63% of American adults drink alcohol — and the favored beverage among them is beer. Some 42% of American drinkers prefer beer, compared to 34% who choose wine, and just 19% who enjoy liquor the most.
Americans consumed an estimated 6.3 billion gallons of beer in 2018, or about 26.2 gallons per drinking-age adult. For reference, 1 gallon is equal to about 8 pints. Beer consumption patterns are not uniform across the U.S., however, and in some states, residents are more likely to reach for a beer than in others.
Using data provided by industry advocacy group Beer Marketer’s Insights, 24/7 Tempo reviewed annual per-capita beer consumption by state. Per capita consumption ranges from as little as 18.6 gallons to 40.8 gallons, depending on the state.
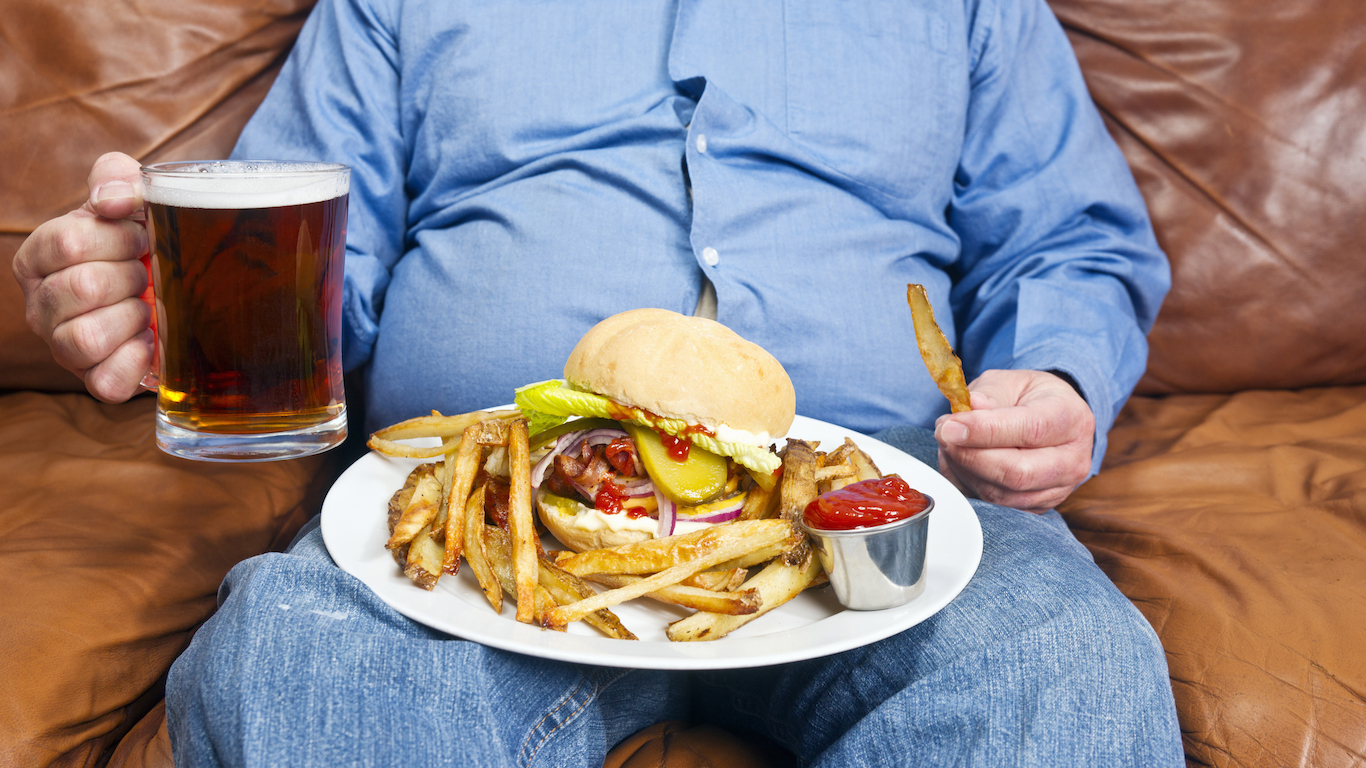
According to the Centers for Disease Control and Prevention, excessive drinking among adults falls into one of two primary categories. The first is binge drinking, defined as four or more drinks on a single occasion for women and five or more for men. The second is heavy drinking, which is defined as eight or more drinks per week for women and 15 or more for men. Any alcohol consumption for those who are pregnant is also considered excessive.
Higher than average per capita beer consumption does not necessarily mean unhealthy or dangerous drinking habits. However, the states where the population drinks the most beer on a per capita basis also tend to have higher rates of unhealthy drinking habits than the national rates.
In nine of the 10 states with the highest per-capita beer consumption, the share of adults who either binge drink or drink heavily exceeds the 18.0% national excessive drinking rate. Here is a full list of the states with the highest (and lowest) excessive drinking rates.
Injuries, including those that result from motor vehicle crashes, are among the many short-term risks associated with binge drinking. In nine of the 10 states with the highest per-capita beer consumption, the share of roadway fatalities involving alcohol exceeds the 29.0% national rate. Alcohol impaired driving claimed nearly 11,000 lives on American roadways in 2017 and considerably reduced safety for everyone on the road. These are the states with the most dangerous roads.
Click here to see how much the average person drinks in every state
Click here to read our methodology
Source: Sean Pavone / Getty Images
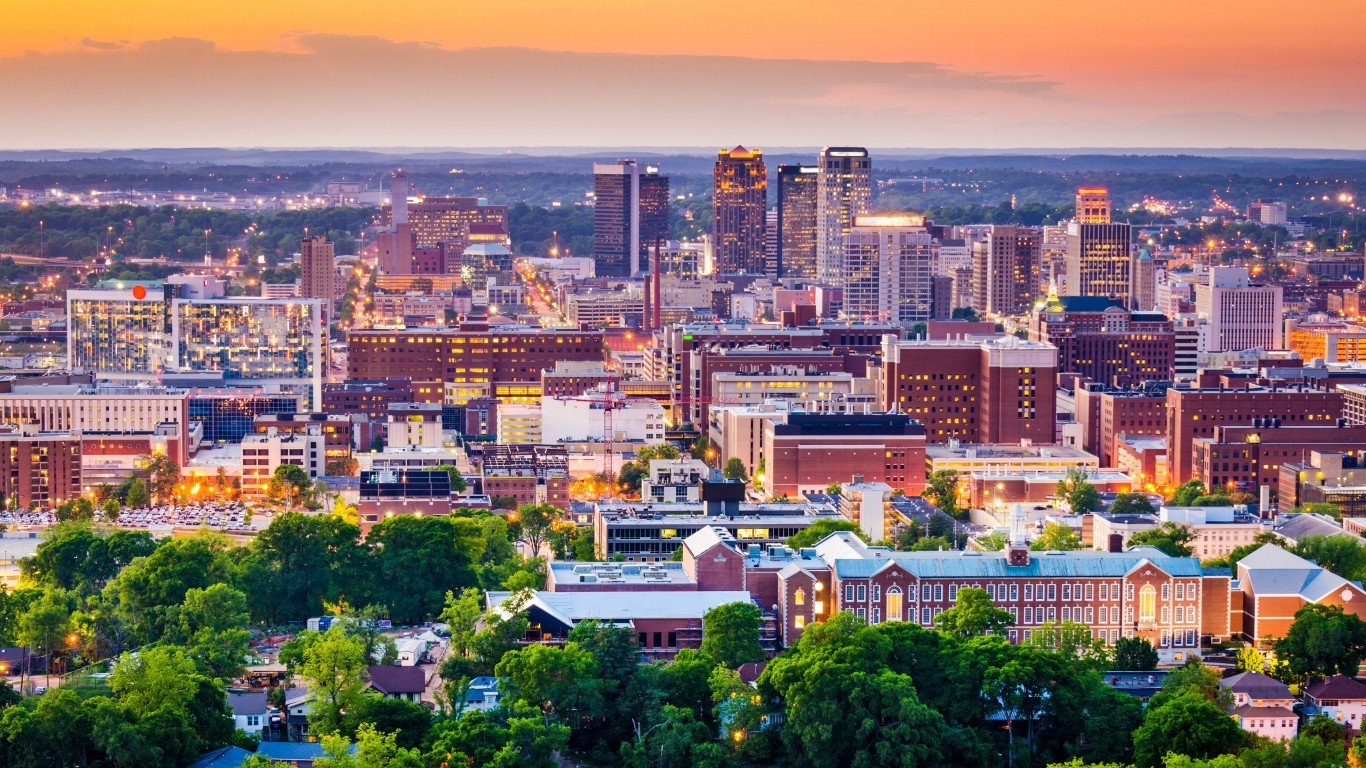
1. Alabama
> 2018 per capita beer consumption: 28.7 gallons (19th most)
> 10 yr. consumption change: -10.6% (14th highest)
> Excessive drinking rate: 14.2% (5th lowest)
> Driving deaths involving alcohol: 28.6% (17th lowest)
See all stories featuring: Alabama
[in-text-ad]
Source: Chilkoot / Getty Images
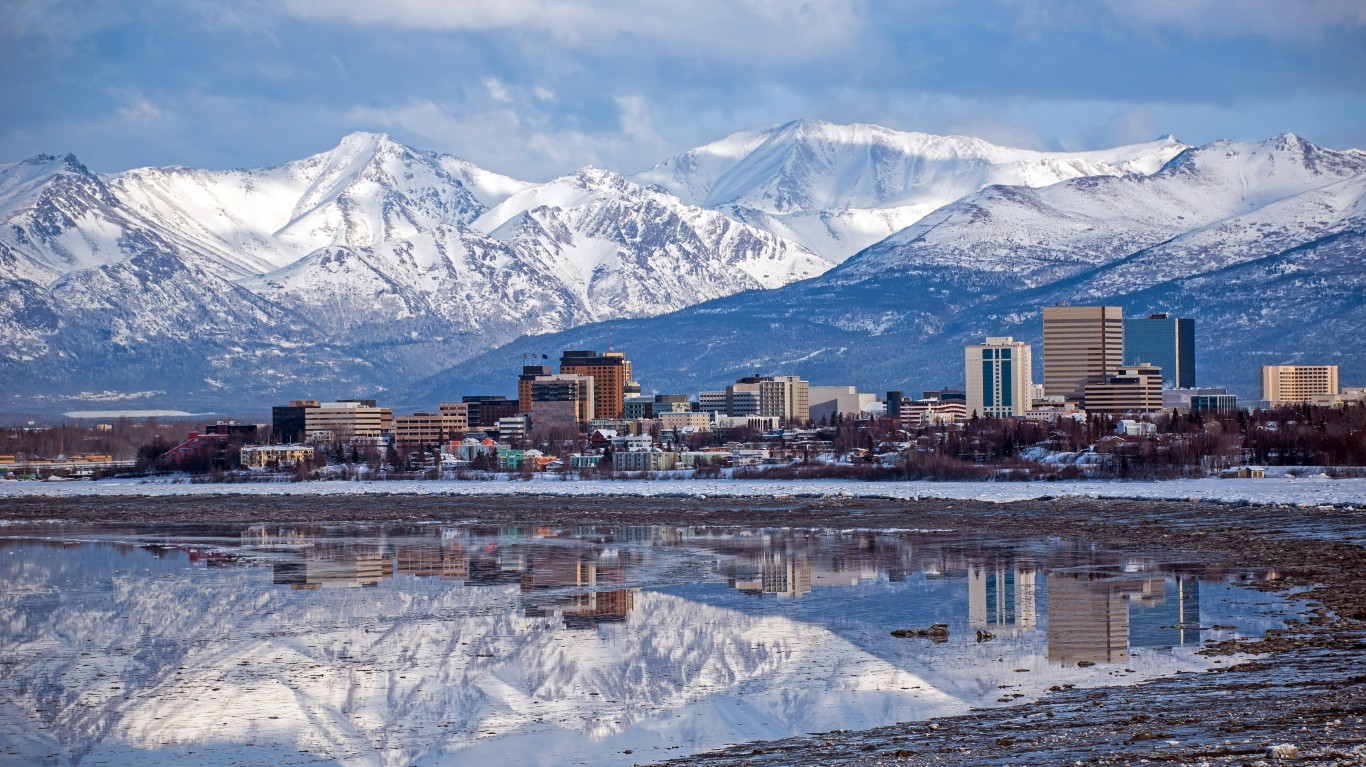
2. Alaska
> 2018 per capita beer consumption: 26.9 gallons (tied – 25th least)
> 10 yr. consumption change: -11.5% (16th highest)
> Excessive drinking rate: 19.1% (20th highest)
> Driving deaths involving alcohol: 36.6% (4th highest)
See all stories featuring: Alaska

Source: Sean Pavone / Getty Images
3. Arizona
> 2018 per capita beer consumption: 26.8 gallons (23rd least)
> 10 yr. consumption change: -16.5% (15th lowest)
> Excessive drinking rate: 17.3% (14th lowest)
> Driving deaths involving alcohol: 26.6% (11th lowest)
See all stories featuring: Arizona

Source: Sean Pavone / Getty Images
4. Arkansas
> 2018 per capita beer consumption: 23.4 gallons (10th least)
> 10 yr. consumption change: -17.0% (12th lowest)
> Excessive drinking rate: 15.9% (9th lowest)
> Driving deaths involving alcohol: 26.3% (10th lowest)
See all stories featuring: Arkansas
[in-text-ad-2]

Source: choness / Getty Images
5. California
> 2018 per capita beer consumption: 25.1 gallons (17th least)
> 10 yr. consumption change: -11.6% (17th highest)
> Excessive drinking rate: 17.8% (21st lowest)
> Driving deaths involving alcohol: 29.8% (23rd lowest)
See all stories featuring: California

Source: Ron and Patty Thomas / Getty Images
6. Colorado
> 2018 per capita beer consumption: 28.8 gallons (tied – 17th most)
> 10 yr. consumption change: -9.7% (13th highest)
> Excessive drinking rate: 20.6% (9th highest)
> Driving deaths involving alcohol: 34.4% (14th highest)
See all stories featuring: Colorado
[in-text-ad]

Source: SeanPavonePhoto / Getty Images
7. Connecticut
> 2018 per capita beer consumption: 20 gallons (3rd least)
> 10 yr. consumption change: -15.6% (19th lowest)
> Excessive drinking rate: 18.4% (23rd lowest)
> Driving deaths involving alcohol: 33.0% (18th highest)
See all stories featuring: Connecticut
 24/7 Wall St.
Source: DenisTangneyJr / Getty Images
8. Delaware
> 2018 per capita beer consumption: 28.4 gallons (21st most)
> 10 yr. consumption change: -20.4% (6th lowest)
> Excessive drinking rate: 18.4% (24th lowest)
> Driving deaths involving alcohol: 33.8% (15th highest)
See all stories featuring: Delaware
Source: Meinzahn / iStock
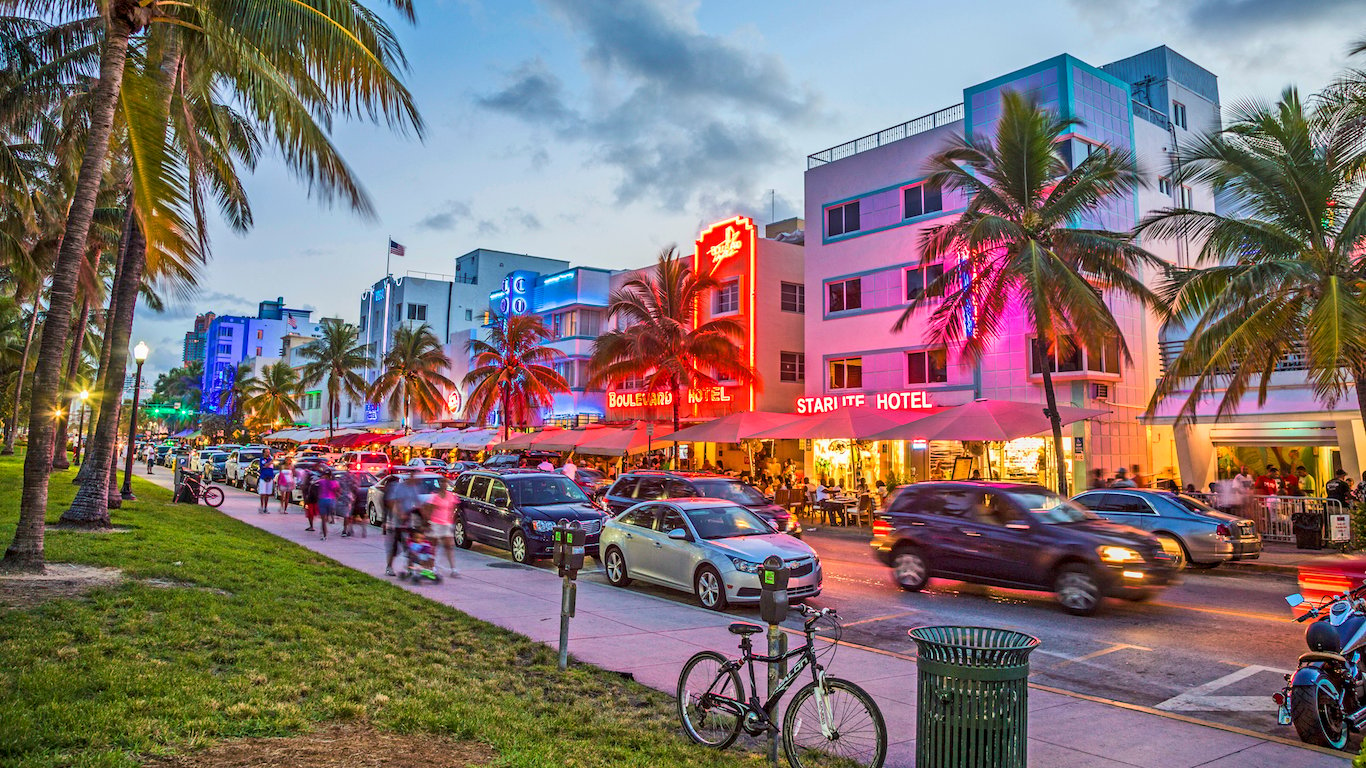
9. Florida
> 2018 per capita beer consumption: 26.4 gallons (tied – 22nd least)
> 10 yr. consumption change: -15.9% (18th lowest)
> Excessive drinking rate: 17.5% (19th lowest)
> Driving deaths involving alcohol: 24.7% (8th lowest)
See all stories featuring: Florida
[in-text-ad-2]

Source: Sean Pavone / Getty Images
10. Georgia
> 2018 per capita beer consumption: 23.8 gallons (11th least)
> 10 yr. consumption change: -15.6% (20th lowest)
> Excessive drinking rate: 15.1% (7th lowest)
> Driving deaths involving alcohol: 22.4% (6th lowest)
See all stories featuring: Georgia

Source: maximkabb / iStock
11. Hawaii
> 2018 per capita beer consumption: 30.6 gallons (tied – 12th most)
> 10 yr. consumption change: -6.7% (7th highest)
> Excessive drinking rate: 20.3% (13th highest)
> Driving deaths involving alcohol: 34.4% (12th highest)
See all stories featuring: Hawaii
[in-text-ad]

Source: CodyHaskell / Getty Images
12. Idaho
> 2018 per capita beer consumption: 26.4 gallons (tied – 22nd least)
> 10 yr. consumption change: -14.6% (25th lowest)
> Excessive drinking rate: 17.4% (16th lowest)
> Driving deaths involving alcohol: 31.4% (21st highest)
See all stories featuring: Idaho

Source: marchello74 / Getty Images
13. Illinois
> 2018 per capita beer consumption: 27.7 gallons (23rd most)
> 10 yr. consumption change: -9.2% (11th highest)
> Excessive drinking rate: 21.1% (6th highest)
> Driving deaths involving alcohol: 32.6% (19th highest)
See all stories featuring: Illinois

Source: Sean Pavone / Getty Images
14. Indiana
> 2018 per capita beer consumption: 23.1 gallons (8th least)
> 10 yr. consumption change: -18.9% (7th lowest)
> Excessive drinking rate: 18.6% (23rd highest)
> Driving deaths involving alcohol: 20.8% (2nd lowest)
See all stories featuring: Indiana
[in-text-ad-2]

Source: KudicM / Getty Images
15. Iowa
> 2018 per capita beer consumption: 31.2 gallons (10th most)
> 10 yr. consumption change: -12.8% (20th highest)
> Excessive drinking rate: 22.1% (4th highest)
> Driving deaths involving alcohol: 28.0% (15th lowest)
See all stories featuring: Iowa
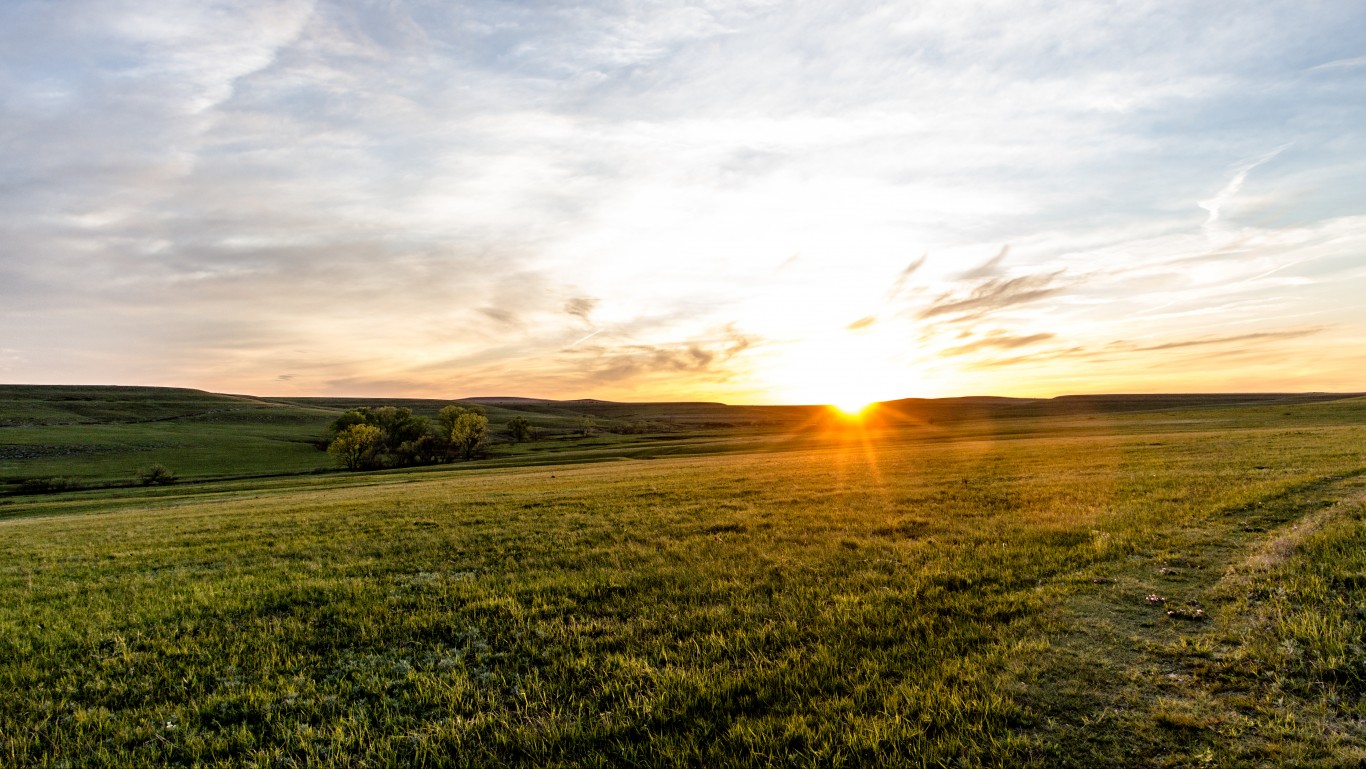
Source: Paul Knightly / Getty Images
16. Kansas
> 2018 per capita beer consumption: 25.8 gallons (tied – 19th least)
> 10 yr. consumption change: -13.4% (23rd highest)
> Excessive drinking rate: 17.4% (17th lowest)
> Driving deaths involving alcohol: 23.6% (7th lowest)
See all stories featuring: Kansas
[in-text-ad]

Source: Sean Pavone / Getty Images
17. Kentucky
> 2018 per capita beer consumption: 22.9 gallons (tied – 7th least)
> 10 yr. consumption change: -12.9% (21st highest)
> Excessive drinking rate: 15.8% (8th lowest)
> Driving deaths involving alcohol: 27.3% (13th lowest)
See all stories featuring: Kentucky

Source: f11photo / Getty Images
18. Louisiana
> 2018 per capita beer consumption: 28 gallons (22nd most)
> 10 yr. consumption change: -27.3% (the lowest)
> Excessive drinking rate: 18.5% (25th lowest)
> Driving deaths involving alcohol: 34.4% (13th highest)
See all stories featuring: Louisiana

Source: SeanPavonePhoto / Getty Images
19. Maine
> 2018 per capita beer consumption: 33.8 gallons (5th most)
> 10 yr. consumption change: +3.7% (2nd highest)
> Excessive drinking rate: 20.5% (12th highest)
> Driving deaths involving alcohol: 37.4% (3rd highest)
See all stories featuring: Maine
[in-text-ad-2]
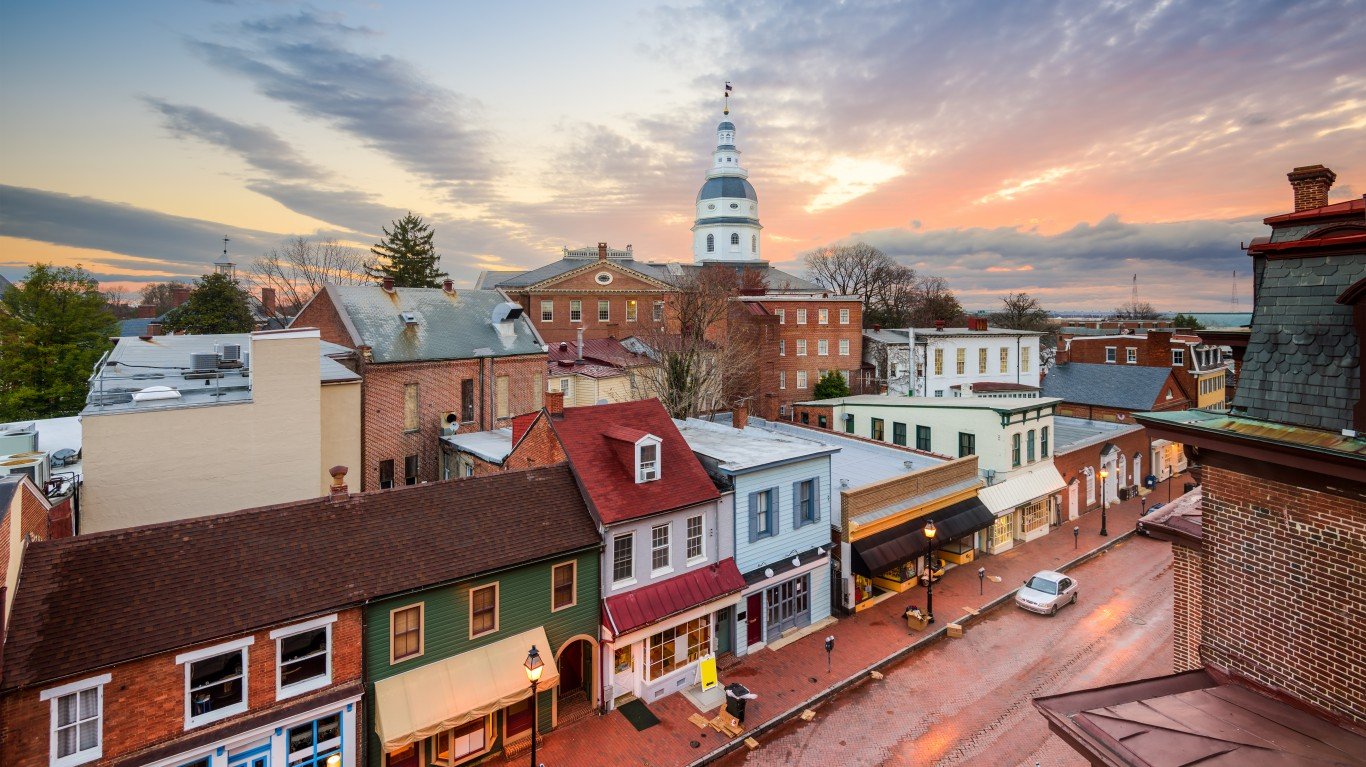
Source: SeanPavonePhoto / Getty Images
20. Maryland
> 2018 per capita beer consumption: 19.6 gallons (2nd least)
> 10 yr. consumption change: -23.1% (2nd lowest)
> Excessive drinking rate: 16.5% (10th lowest)
> Driving deaths involving alcohol: 29.9% (24th lowest)
See all stories featuring: Maryland

Source: SeanPavonePhoto / Getty Images
21. Massachusetts
> 2018 per capita beer consumption: 22.9 gallons (tied – 7th least)
> 10 yr. consumption change: -16.1% (17th lowest)
> Excessive drinking rate: 20.1% (15th highest)
> Driving deaths involving alcohol: 29.2% (20th lowest)
See all stories featuring: Massachusetts
[in-text-ad]
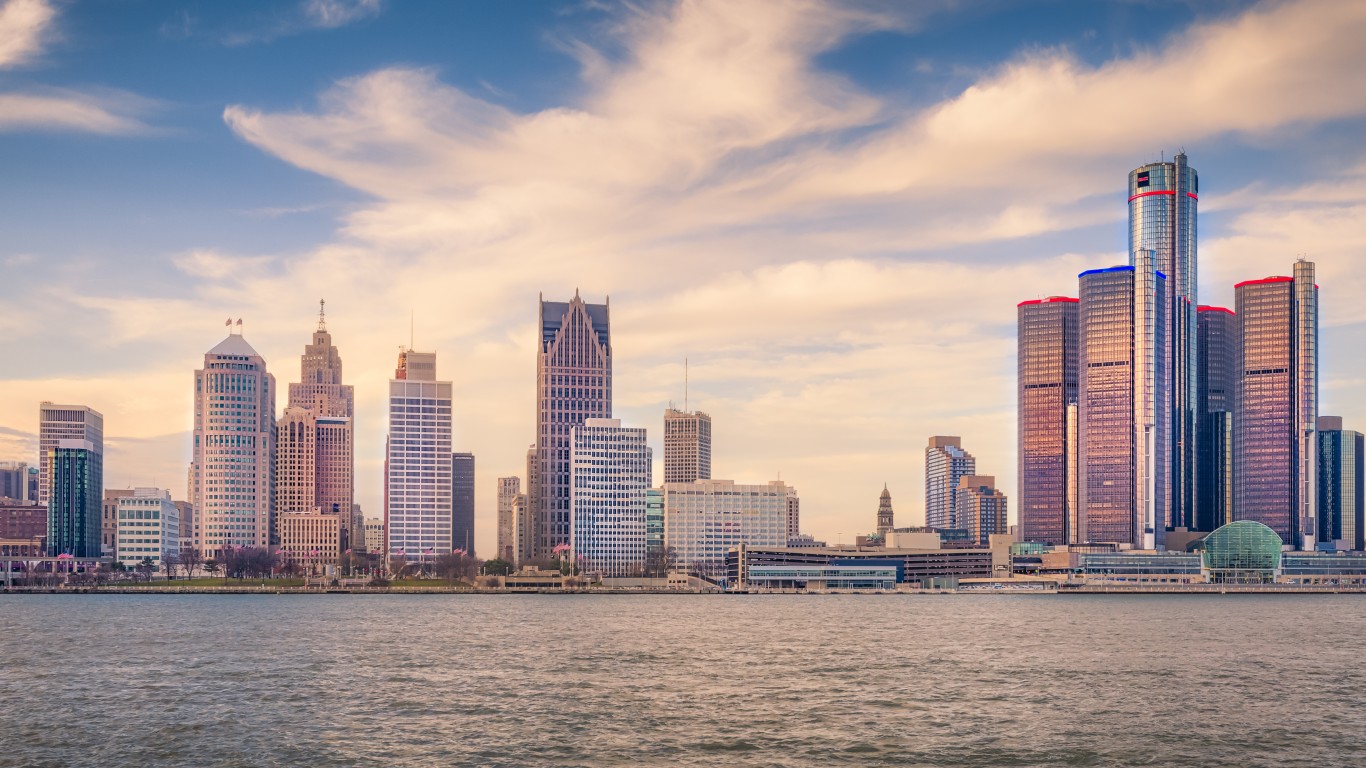
Source: SolomonCrowe / Getty Images
22. Michigan
> 2018 per capita beer consumption: 24.7 gallons (16th least)
> 10 yr. consumption change: -13.0% (22nd highest)
> Excessive drinking rate: 20.5% (11th highest)
> Driving deaths involving alcohol: 29.1% (18th lowest)
See all stories featuring: Michigan

Source: culbertson / Getty Images
23. Minnesota
> 2018 per capita beer consumption: 28.5 gallons (20th most)
> 10 yr. consumption change: -3.4% (4th highest)
> Excessive drinking rate: 22.9% (3rd highest)
> Driving deaths involving alcohol: 29.3% (21st lowest)
See all stories featuring: Minnesota

Source: Tiago_Fernandez / Getty Images
24. Mississippi
> 2018 per capita beer consumption: 30.4 gallons (14th most)
> 10 yr. consumption change: -17.4% (10th lowest)
> Excessive drinking rate: 13.7% (4th lowest)
> Driving deaths involving alcohol: 21.2% (4th lowest)
See all stories featuring: Mississippi
[in-text-ad-2]
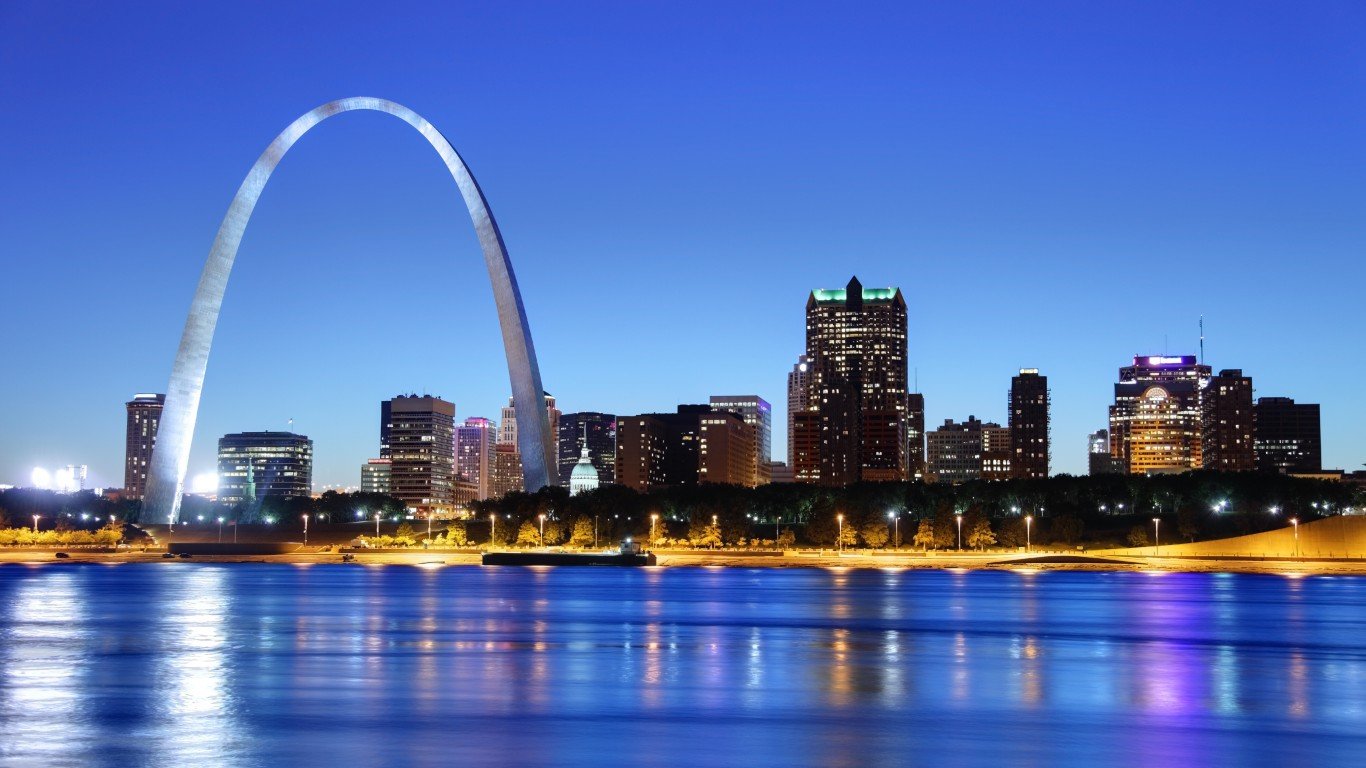
Source: DenisTangneyJr / Getty Images
25. Missouri
> 2018 per capita beer consumption: 27.2 gallons (25th most)
> 10 yr. consumption change: -17.6% (9th lowest)
> Excessive drinking rate: 19.5% (18th highest)
> Driving deaths involving alcohol: 29.1% (19th lowest)
See all stories featuring: Missouri
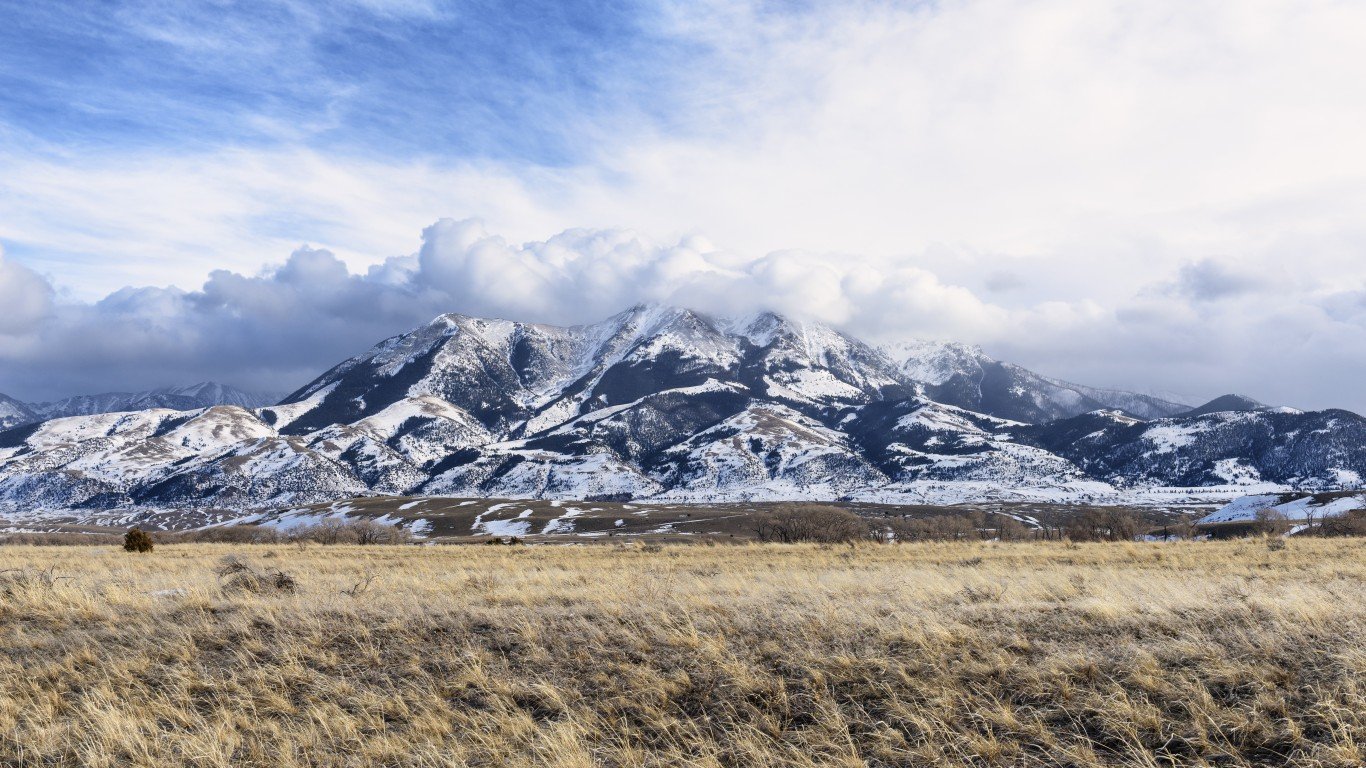
Source: EJ-J / Getty Images
26. Montana
> 2018 per capita beer consumption: 40.8 gallons (the most)
> 10 yr. consumption change: -6.2% (6th highest)
> Excessive drinking rate: 20.7% (7th highest)
> Driving deaths involving alcohol: 44.7% (2nd highest)
See all stories featuring: Montana
[in-text-ad]

Source: DenisTangneyJr / Getty Images
27. Nebraska
> 2018 per capita beer consumption: 32.5 gallons (9th most)
> 10 yr. consumption change: -12.6% (19th highest)
> Excessive drinking rate: 21.1% (5th highest)
> Driving deaths involving alcohol: 34.8% (11th highest)
See all stories featuring: Nebraska

Source: f11photo / Getty Images
28. Nevada
> 2018 per capita beer consumption: 33.2 gallons (8th most)
> 10 yr. consumption change: -20.8% (5th lowest)
> Excessive drinking rate: 17.6% (20th lowest)
> Driving deaths involving alcohol: 30.6% (25th lowest)
See all stories featuring: Nevada
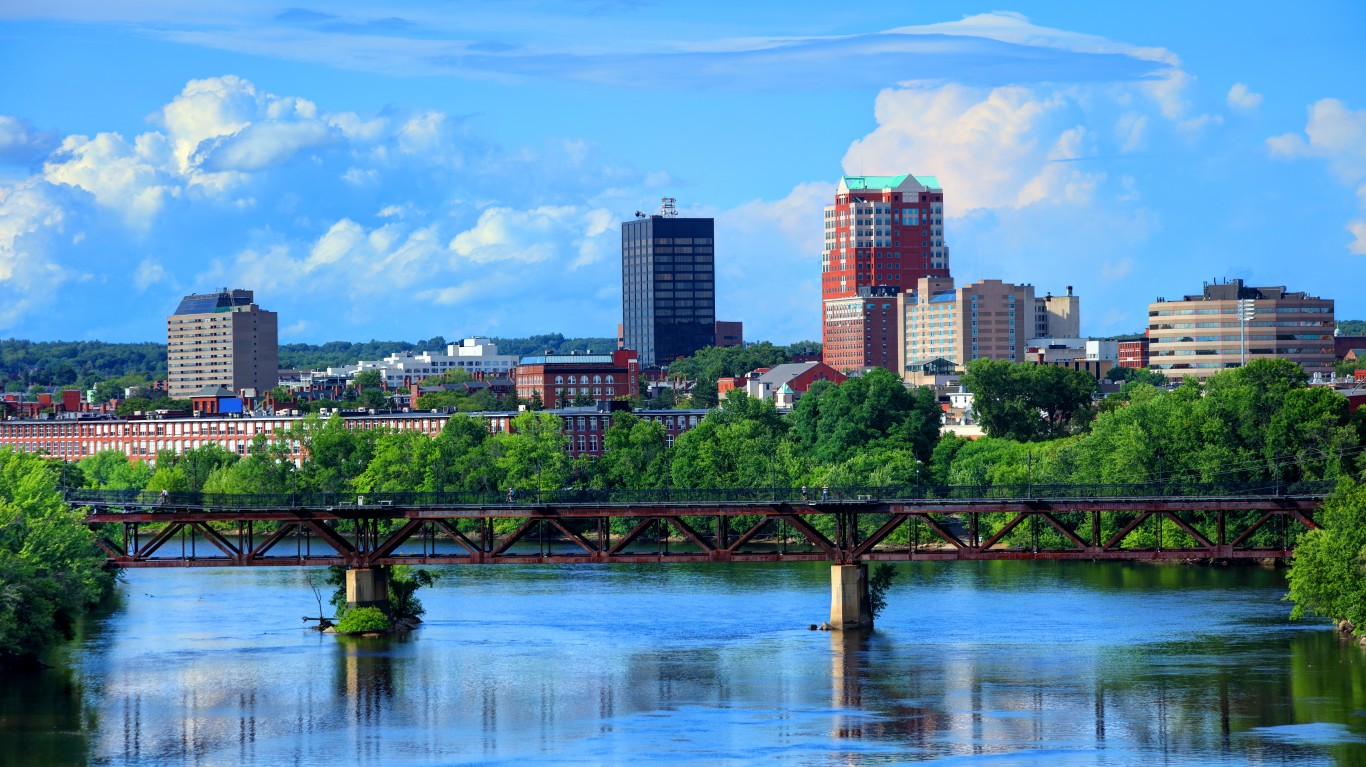
Source: DenisTangneyJr / Getty Images
29. New Hampshire
> 2018 per capita beer consumption: 39.8 gallons (2nd most)
> 10 yr. consumption change: -7.2% (8th highest)
> Excessive drinking rate: 20.1% (16th highest)
> Driving deaths involving alcohol: 31.3% (22nd highest)
See all stories featuring: New Hampshire
[in-text-ad-2]

Source: Creative-Family / Getty Images
30. New Jersey
> 2018 per capita beer consumption: 20.1 gallons (4th least)
> 10 yr. consumption change: -14.5% (25th highest)
> Excessive drinking rate: 17.1% (13th lowest)
> Driving deaths involving alcohol: 22.3% (5th lowest)
See all stories featuring: New Jersey

Source: ferrantraite / Getty Images
31. New Mexico
> 2018 per capita beer consumption: 28.8 gallons (tied – 17th most)
> 10 yr. consumption change: -22.2% (4th lowest)
> Excessive drinking rate: 16.6% (11th lowest)
> Driving deaths involving alcohol: 31.3% (23rd highest)
See all stories featuring: New Mexico
[in-text-ad]

Source: spyarm / Getty Images
32. New York
> 2018 per capita beer consumption: 21.5 gallons (5th least)
> 10 yr. consumption change: -8.5% (9th highest)
> Excessive drinking rate: 18.8% (22nd highest)
> Driving deaths involving alcohol: 21.0% (3rd lowest)
See all stories featuring: New York
 24/7 Wall St.
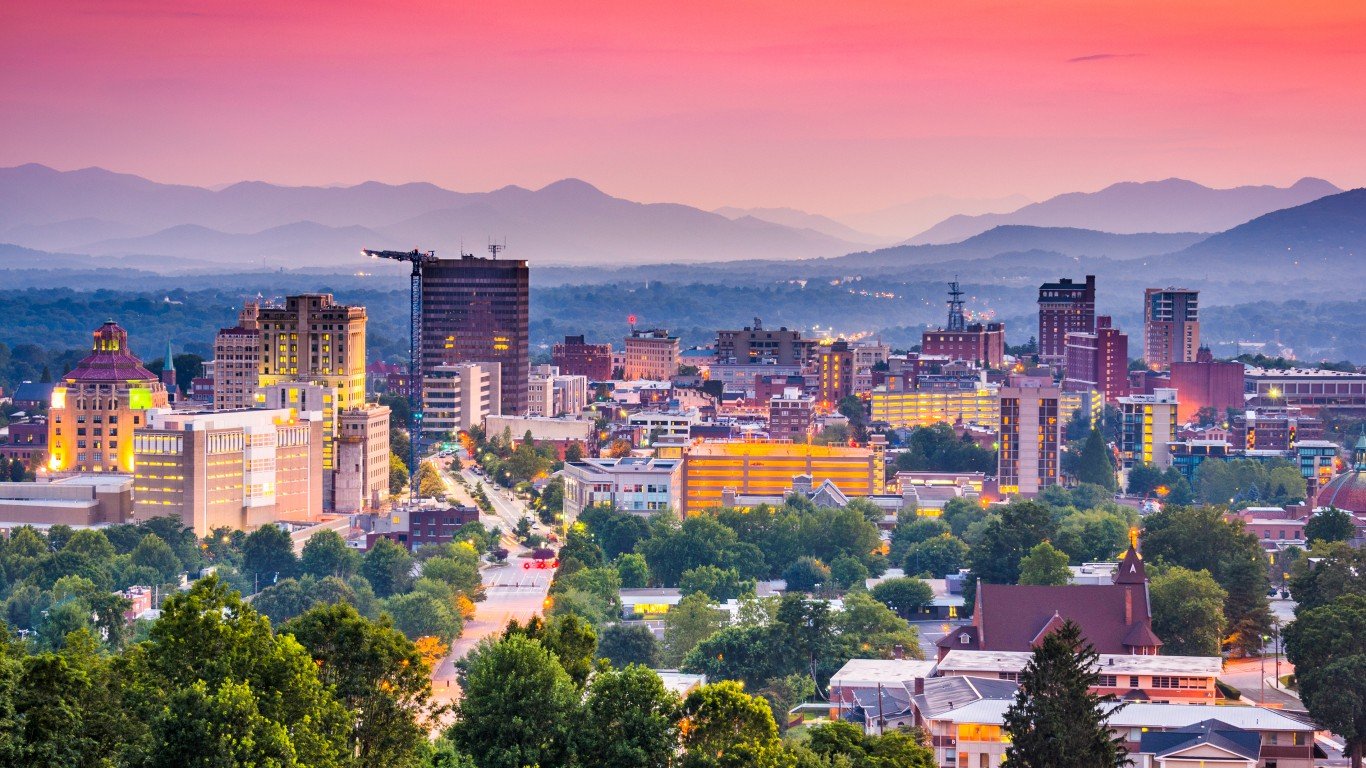
Source: Sean Pavone / Getty Images
33. North Carolina
> 2018 per capita beer consumption: 25.8 gallons (tied – 19th least)
> 10 yr. consumption change: -11.3% (15th highest)
> Excessive drinking rate: 16.7% (12th lowest)
> Driving deaths involving alcohol: 29.7% (22nd lowest)
See all stories featuring: North Carolina
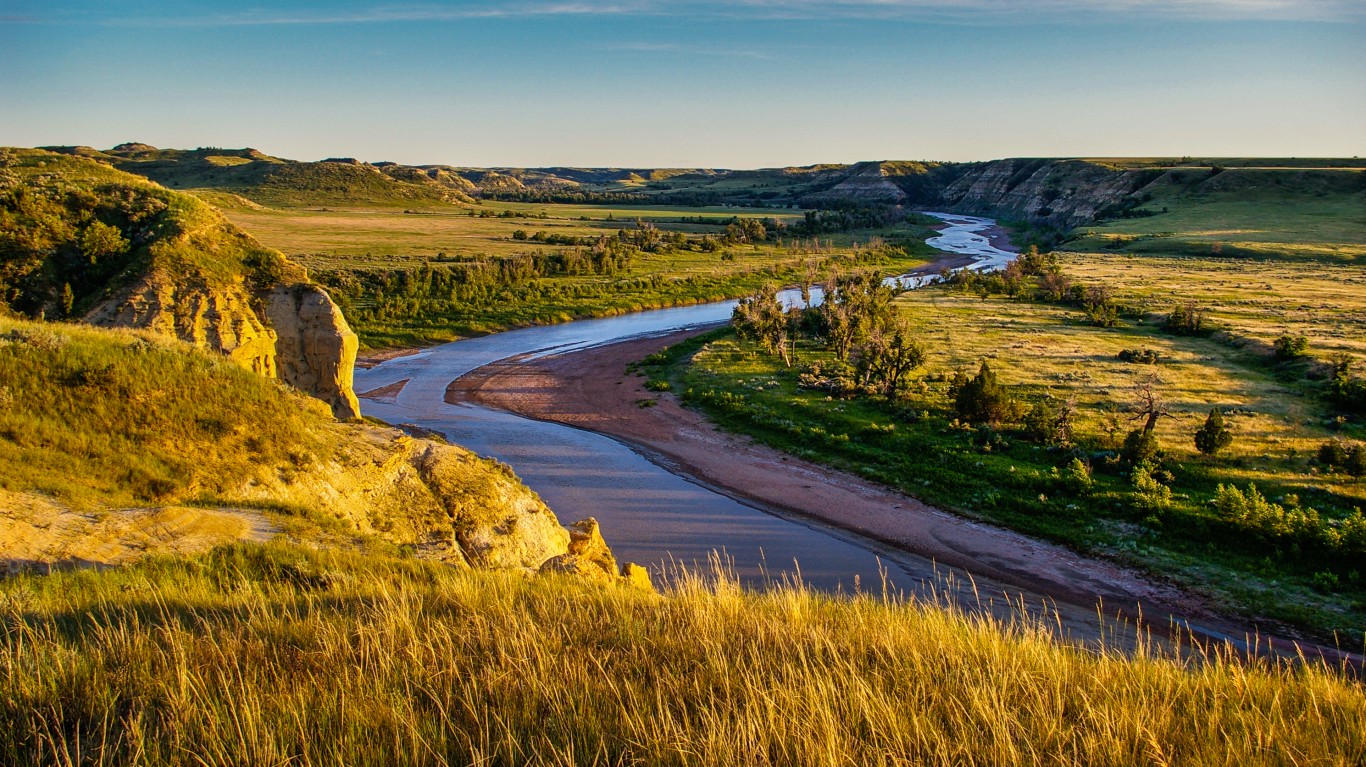
Source: rruntsch / Getty Images
34. North Dakota
> 2018 per capita beer consumption: 38.2 gallons (tied – 3rd most)
> 10 yr. consumption change: -9.0% (10th highest)
> Excessive drinking rate: 25.9% (2nd highest)
> Driving deaths involving alcohol: 46.3% (the highest)
See all stories featuring: North Dakota
[in-text-ad-2]

Source: AndreyKrav / Getty Images
35. Ohio
> 2018 per capita beer consumption: 26.9 gallons (tied – 25th least)
> 10 yr. consumption change: -17.2% (11th lowest)
> Excessive drinking rate: 19.1% (21st highest)
> Driving deaths involving alcohol: 33.1% (17th highest)
See all stories featuring: Ohio

Source: DenisTangneyJr / Getty Images
36. Oklahoma
> 2018 per capita beer consumption: 24.6 gallons (15th least)
> 10 yr. consumption change: -17.7% (8th lowest)
> Excessive drinking rate: 12.8% (2nd lowest)
> Driving deaths involving alcohol: 27.1% (12th lowest)
See all stories featuring: Oklahoma
[in-text-ad]

Source: 4nadia / Getty Images
37. Oregon
> 2018 per capita beer consumption: 29.8 gallons (16th most)
> 10 yr. consumption change: -5.4% (5th highest)
> Excessive drinking rate: 18.5% (24th highest)
> Driving deaths involving alcohol: 31.4% (20th highest)
See all stories featuring: Oregon
 24/7 Wall St.
Source: S. Greg Panosian / Getty Images
38. Pennsylvania
> 2018 per capita beer consumption: 25.9 gallons (20th least)
> 10 yr. consumption change: -14.8% (23rd lowest)
> Excessive drinking rate: 20.5% (10th highest)
> Driving deaths involving alcohol: 28.3% (16th lowest)
See all stories featuring: Pennsylvania

Source: SeanPavonePhoto / Getty Images
39. Rhode Island
> 2018 per capita beer consumption: 23.2 gallons (9th least)
> 10 yr. consumption change: -16.5% (14th lowest)
> Excessive drinking rate: 17.4% (18th lowest)
> Driving deaths involving alcohol: 35.6% (8th highest)
See all stories featuring: Rhode Island
[in-text-ad-2]
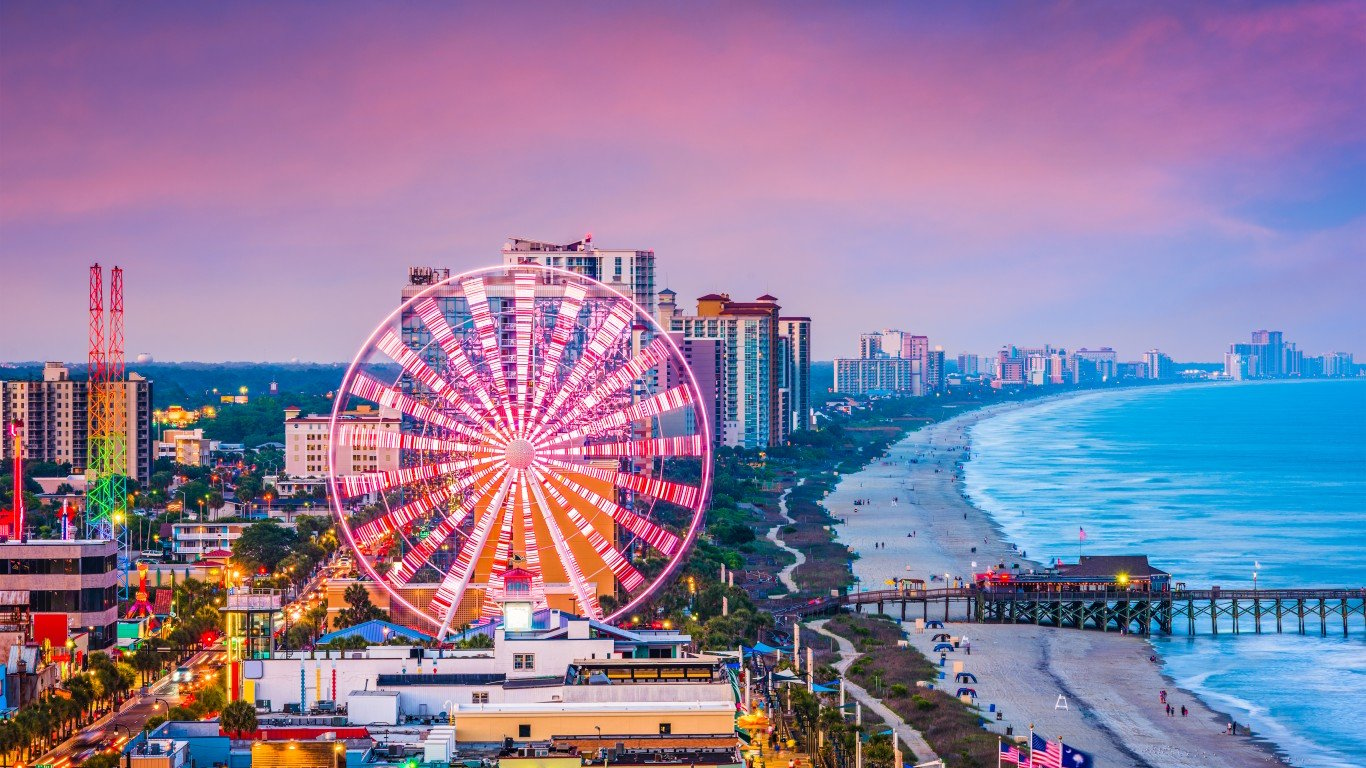
Source: Sean Pavone / Getty Images
40. South Carolina
> 2018 per capita beer consumption: 30.6 gallons (tied – 12th most)
> 10 yr. consumption change: -14.8% (24th lowest)
> Excessive drinking rate: 18.5% (25th highest)
> Driving deaths involving alcohol: 35.5% (9th highest)
See all stories featuring: South Carolina
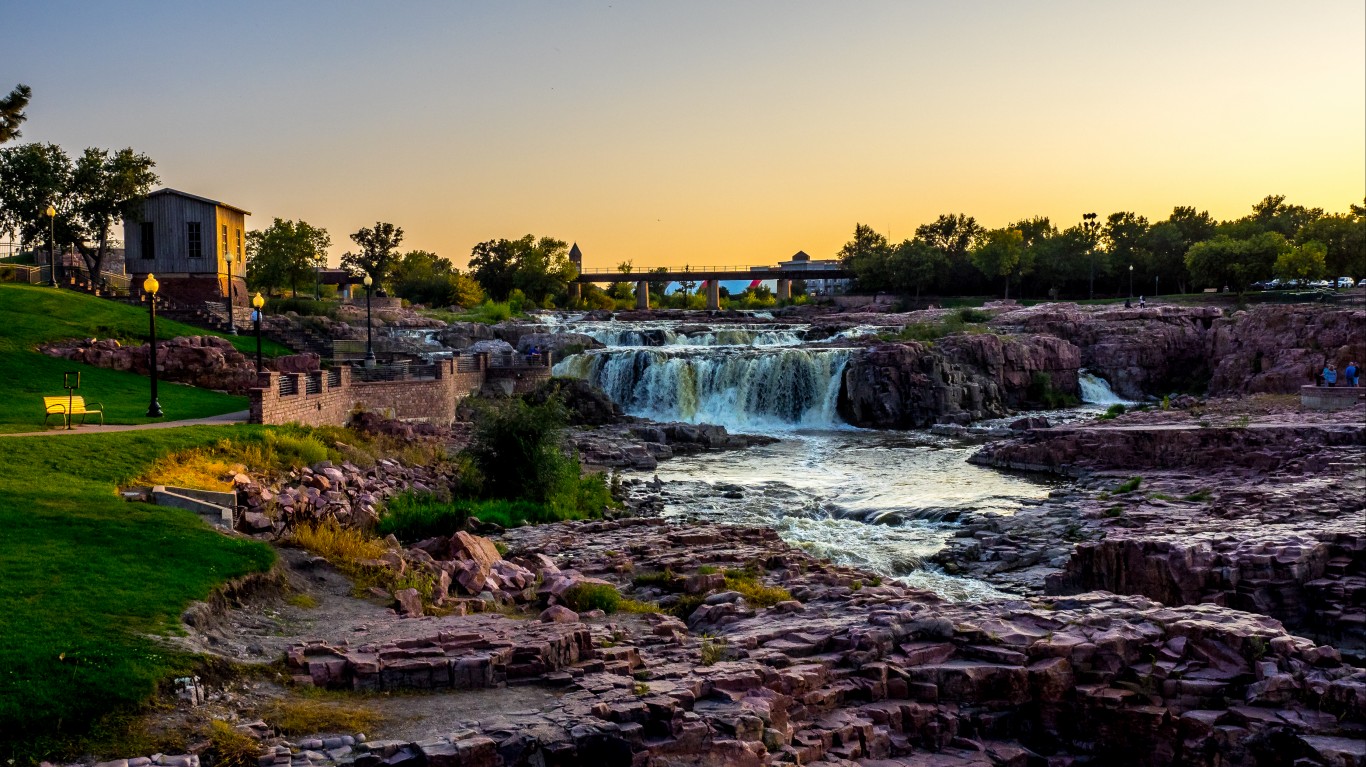
Source: Geoff Eccles / Getty Images
41. South Dakota
> 2018 per capita beer consumption: 38.2 gallons (tied – 3rd most)
> 10 yr. consumption change: -1.0% (3rd highest)
> Excessive drinking rate: 20.2% (14th highest)
> Driving deaths involving alcohol: 35.8% (5th highest)
See all stories featuring: South Dakota
[in-text-ad]
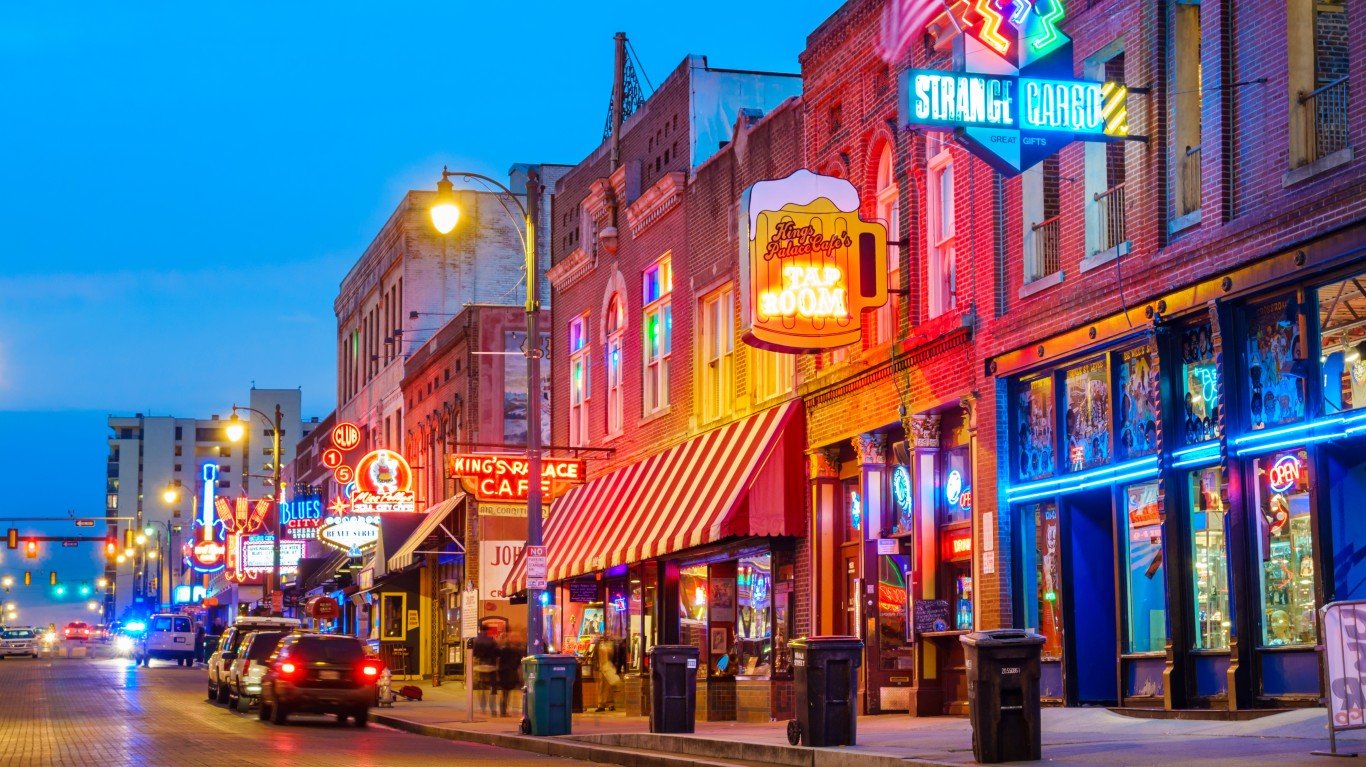
Source: benedek / Getty Images
42. Tennessee
> 2018 per capita beer consumption: 24.5 gallons (tied – 14th least)
> 10 yr. consumption change: -13.4% (24th highest)
> Excessive drinking rate: 14.4% (6th lowest)
> Driving deaths involving alcohol: 26.2% (9th lowest)
See all stories featuring: Tennessee
 24/7 Wall St.
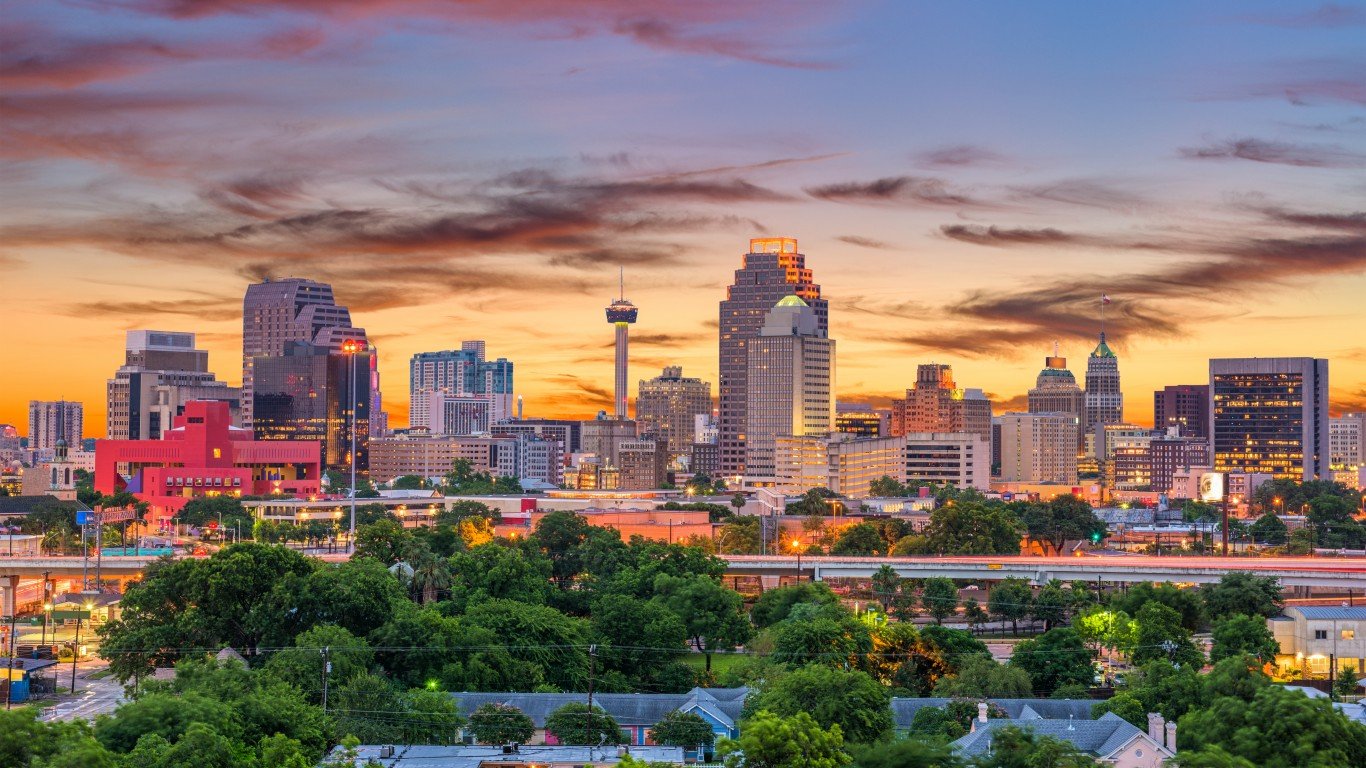
Source: Sean Pavone / Getty Images
43. Texas
> 2018 per capita beer consumption: 30.9 gallons (11th most)
> 10 yr. consumption change: -16.9% (13th lowest)
> Excessive drinking rate: 19.4% (19th highest)
> Driving deaths involving alcohol: 27.7% (14th lowest)
See all stories featuring: Texas
Source: Adventure_Photo / Getty Images
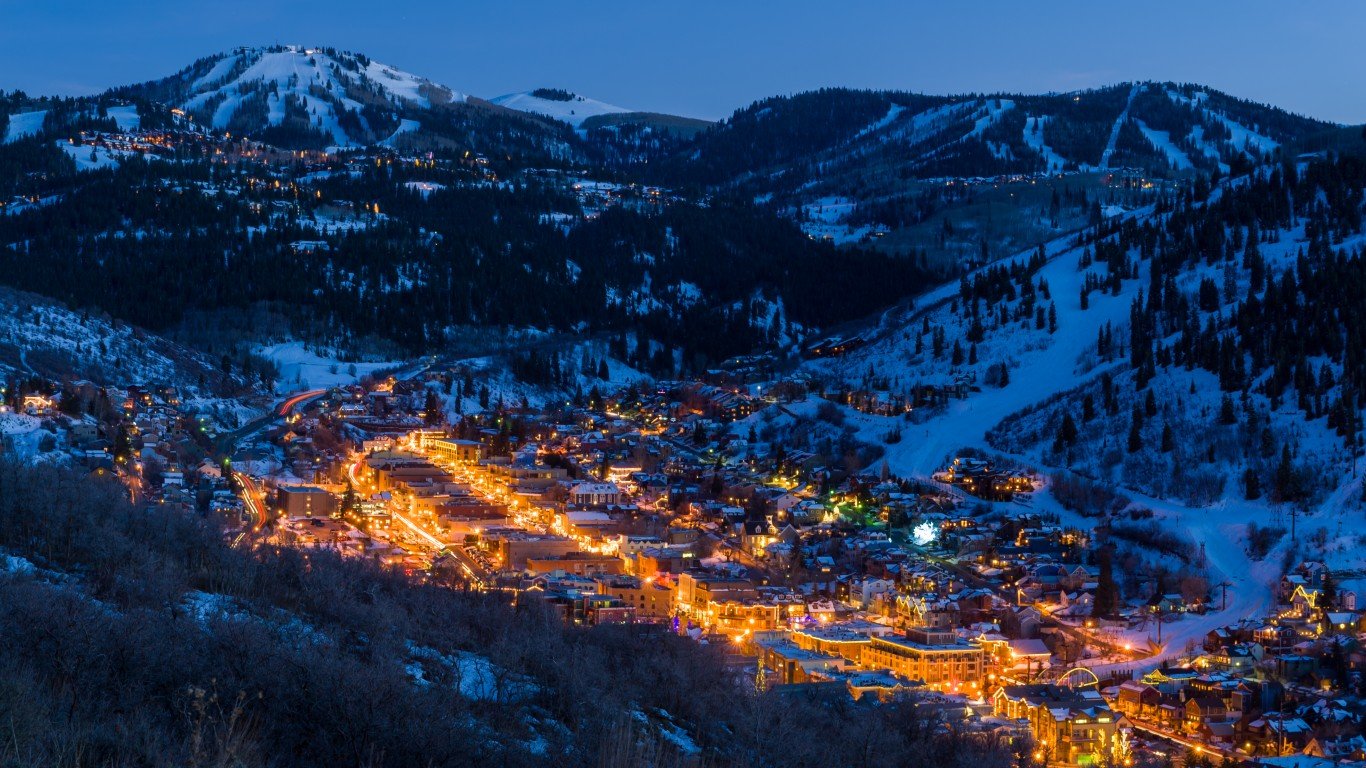
44. Utah
> 2018 per capita beer consumption: 18.6 gallons (the least)
> 10 yr. consumption change: -9.3% (12th highest)
> Excessive drinking rate: 13.4% (3rd lowest)
> Driving deaths involving alcohol: 20.4% (the lowest)
See all stories featuring: Utah
[in-text-ad-2]
Source: SeanPavonePhoto / Getty Images
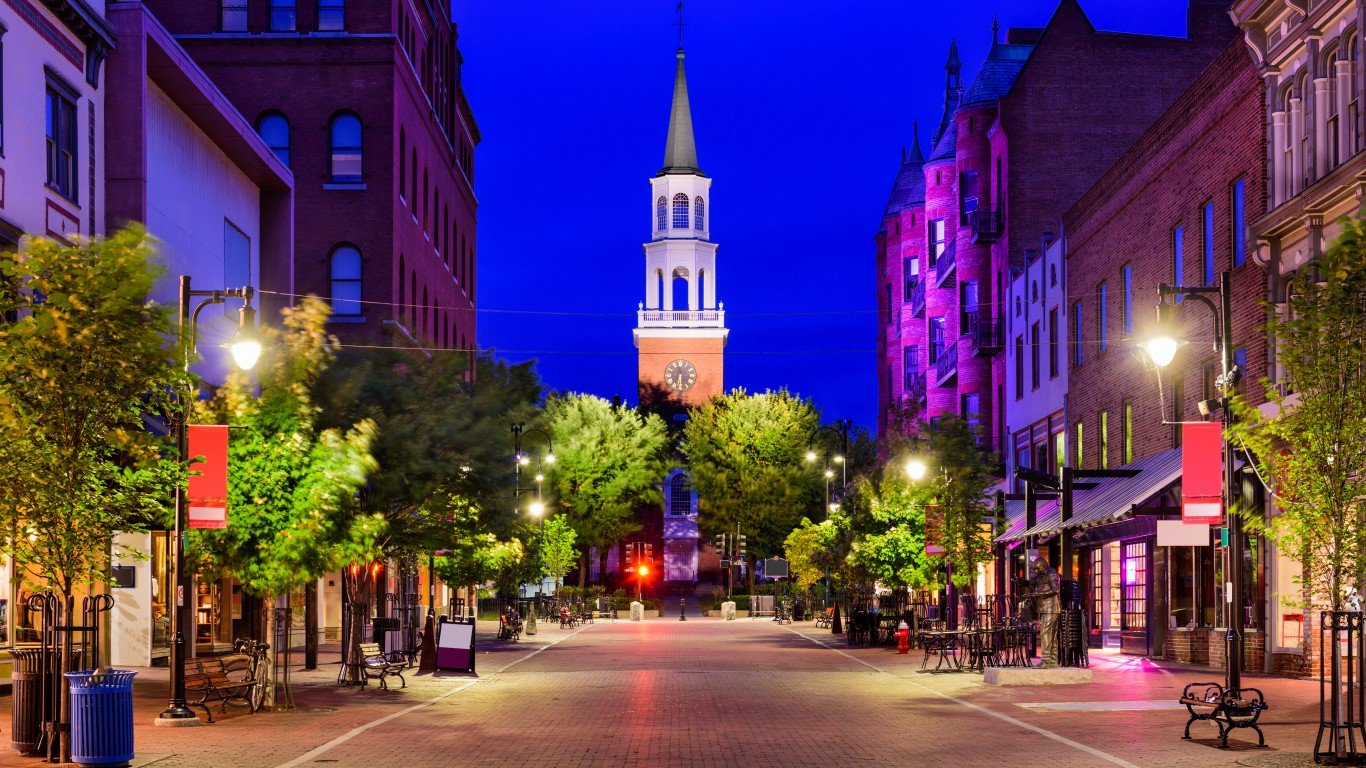
45. Vermont
> 2018 per capita beer consumption: 33.3 gallons (7th most)
> 10 yr. consumption change: +3.7% (the highest)
> Excessive drinking rate: 20.6% (8th highest)
> Driving deaths involving alcohol: 35.2% (10th highest)
See all stories featuring: Vermont

Source: SeanPavonePhoto / Getty Images
46. Virginia
> 2018 per capita beer consumption: 24.5 gallons (tied – 14th least)
> 10 yr. consumption change: -15.5% (21st lowest)
> Excessive drinking rate: 17.4% (15th lowest)
> Driving deaths involving alcohol: 31.1% (24th highest)
See all stories featuring: Virginia
[in-text-ad]

Source: Yatharth / Wikimedia Commons
47. Washington
> 2018 per capita beer consumption: 24.3 gallons (12th least)
> 10 yr. consumption change: -15.3% (22nd lowest)
> Excessive drinking rate: 18.2% (22nd lowest)
> Driving deaths involving alcohol: 33.1% (16th highest)
See all stories featuring: Washington
Source: Davel5957 / Getty Images
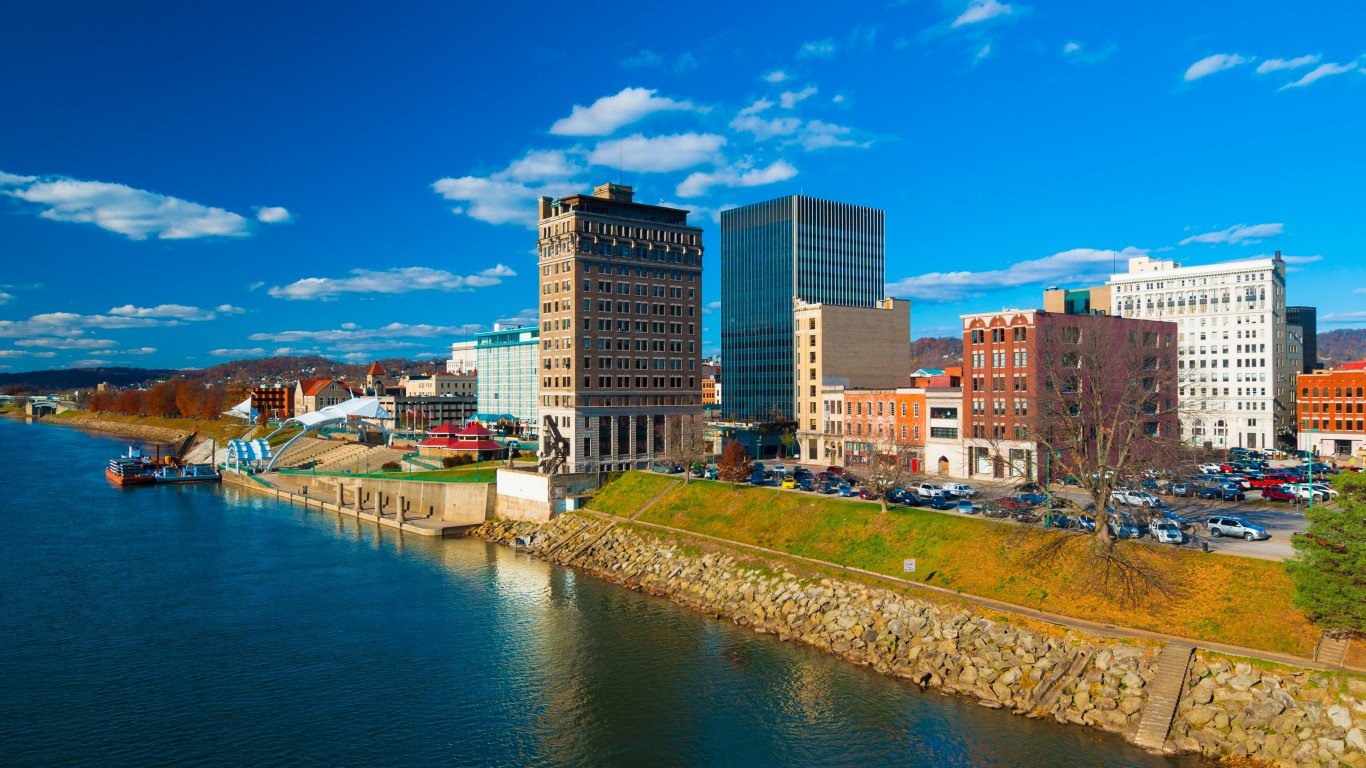
48. West Virginia
> 2018 per capita beer consumption: 27.3 gallons (24th most)
> 10 yr. consumption change: -16.3% (16th lowest)
> Excessive drinking rate: 11.8% (the lowest)
> Driving deaths involving alcohol: 30.7% (25th highest)
See all stories featuring: West Virginia

Source: Sean Pavone / Getty Images
49. Wisconsin
> 2018 per capita beer consumption: 33.6 gallons (6th most)
> 10 yr. consumption change: -12.5% (18th highest)
> Excessive drinking rate: 26.2% (the highest)
> Driving deaths involving alcohol: 35.8% (6th highest)
See all stories featuring: Wisconsin
[in-text-ad-2]
Source: SeanXu / Getty Images
50. Wyoming
> 2018 per capita beer consumption: 30.1 gallons (15th most)
> 10 yr. consumption change: -22.4% (3rd lowest)
> Excessive drinking rate: 19.9% (17th highest)
> Driving deaths involving alcohol: 35.7% (7th highest)
See all stories featuring: Wyoming
Methodology
To identify the states that drink the most beer, 24/7 Tempo reviewed 2018 data from the Beer Institute on per capita consumption of beer (in gallons). Previous years consumption and the percent change in consumption between 2008 and 2018 also came from the Beer Institute.
Data on excessive drinking and driving deaths involving alcohol came from County Health Rankings & Roadmaps, a Robert Wood Johnson Foundation and University of Wisconsin Population Health Institute joint program. Data on driving deaths and excessive drinking include all forms of alcohol and are not strictly limited to beer.
Sponsored: Find a Qualified Financial Advisor
Finding a qualified financial advisor doesn’t have to be hard. SmartAsset’s free tool matches you with up to 3 fiduciary financial advisors in your area in 5 minutes. Each advisor has been vetted by SmartAsset and is held to a fiduciary standard to act in your best interests. If you’re ready to be matched with local advisors that can help you achieve your financial goals, get started now.
Thank you for reading! Have some feedback for us?
Contact the 24/7 Wall St. editorial team.
Editors' Picks