
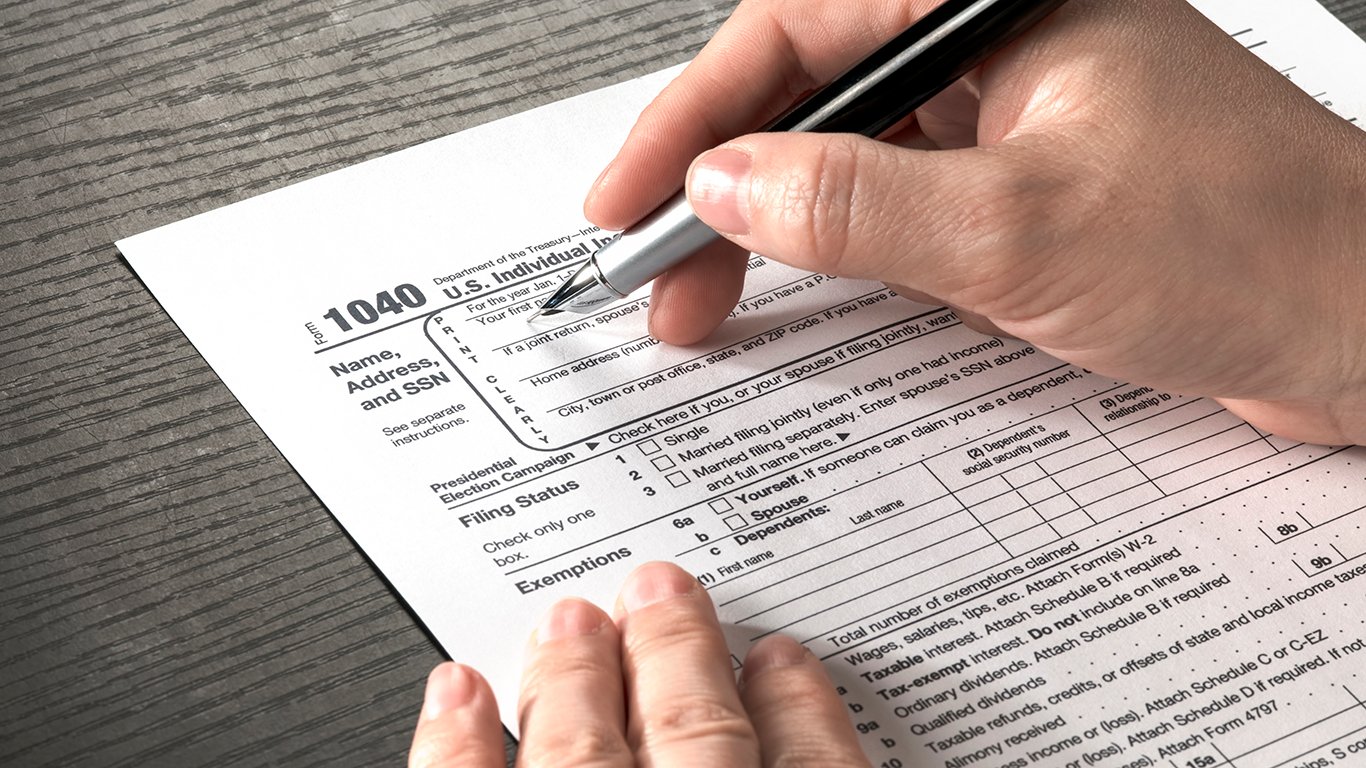
The prospect of an income tax audit by the Internal Revenue Service is a daunting one. The IRS audits about 1.1 million tax returns each year. To minimize the likelihood of a mistake — and reduce the risk of an audit — an estimated 60% of U.S. taxpayers sought professional help to fill out their 1040 form in 2017.
Fortunately, the likelihood of being audited by the IRS is very low. Each year, there are only about 7.7 audits for every 1,000 returns. Audit rates are not even across the country, however. Depending on the state, audit rates range from as low as 6.9 per 1,000 in New Hampshire to as high as 8.9 per 1,000 in Mississippi. Rates vary even more at the city level, and in most states, there is at least one metro area where taxpayers are more likely than the typical taxpayer nationwide to be targeted by the IRS.
Using data on tax returns and audits compiled by tax analysis website Tax Notes, 24/7 Wall St. reviewed audit rates in 382 metropolitan areas to identify the most audited city in each state. It is important to note that four states — Delaware, New Hampshire, Rhode Island, and Vermont — have only one metro area, and as a result, the city listed is the most audited by default.
Many might assume that wealthier Americans are more likely to be audited than low-income Americans. Afterall, higher incomes mean greater revenue for the IRS and perhaps higher potential of errors on 1040 forms. The opposite, however, appears to be true. Poverty is more common in 37 of the 50 cities on this list than it is across the respective state as a whole. In many of the cities on this list, poverty is a bigger problem than it is anywhere else in the state. Here is a full list of the cities hit hardest by extreme poverty in by state.
This is no coincidence. Many low-income households claim the earned income tax credit, or EITC, a program designed to ease financial hardship for the working poor. According to a 2018 report released by ProPublica, a nonprofit investigative publication, EITC recipients are disproportionately targeted for audit to better ensure no one is unfairly taking advantage of the system. Further reinforcing evidence of the trend, only 13 cities on this list have a higher median annual household income than the median nationwide of $57,652.
Ultimately, which tax return is selected for audit is up the IRS. However, there are measures taxpayers can take to minimize errors and reduce the risk of raising potential red flags. These are the 19 most common tax mistakes and how to avoid them.
Click here to see the most audited city in every state
Click here to read our methodology

Source: George Dodd / Getty Images
1. Alabama: Mobile
> Audits per 1,000 tax returns: 8.69 (state: 8.20)
> Median household income: $45,802 (state: $46,472)
> Poverty rate: 19.3% (state: 18.0%)
> Adults with a bachelor’s degree: 23.0% (state: 24.5%)
See all stories featuring: Alabama
[in-text-ad]

Source: Chilkoot / Getty Images
2. Alaska: Anchorage
> Audits per 1,000 tax returns: 6.99 (state: 7.02)
> Median household income: $80,724 (state: $76,114)
> Poverty rate: 8.5% (state: 10.2%)
> Adults with a bachelor’s degree: 31.0% (state: 29.0%)
See all stories featuring: Alaska

Source: ianmcdonnell / Getty Images
3. Arizona: Yuma
> Audits per 1,000 tax returns: 9.25 (state: 7.87)
> Median household income: $43,253 (state: $53,510)
> Poverty rate: 19.7% (state: 17.0%)
> Adults with a bachelor’s degree: 14.3% (state: 28.4%)
See all stories featuring: Arizona

Source: Paul Sableman (Flickr user: pasa47) / Wikimedia Commons
4. Arkansas: Pine Bluff
> Audits per 1,000 tax returns: 8.75 (state: 8.16)
> Median household income: $38,547 (state: $43,813)
> Poverty rate: 23.4% (state: 18.1%)
> Adults with a bachelor’s degree: 15.4% (state: 22.0%)
See all stories featuring: Arkansas
[in-text-ad-2]
Source: Cbl62 / Wikimedia Commons
5. California: El Centro
> Audits per 1,000 tax returns: 9.71 (state: 7.96)
> Median household income: $44,779 (state: $67,169)
> Poverty rate: 23.8% (state: 15.1%)
> Adults with a bachelor’s degree: 14.3% (state: 32.6%)
See all stories featuring: California

Source: chapin31 / Getty Images
6. Colorado: Pueblo
> Audits per 1,000 tax returns: 7.76 (state: 7.36)
> Median household income: $42,386 (state: $65,458)
> Poverty rate: 19.8% (state: 11.5%)
> Adults with a bachelor’s degree: 21.7% (state: 39.4%)
See all stories featuring: Colorado
[in-text-ad]

Source: DenisTangneyJr / Getty Images
7. Connecticut: Bridgeport-Stamford-Norwalk
> Audits per 1,000 tax returns: 8.17 (state: 7.39)
> Median household income: $89,773 (state: $73,781)
> Poverty rate: 8.8% (state: 10.1%)
> Adults with a bachelor’s degree: 46.5% (state: 38.4%)
See all stories featuring: Connecticut

Source: Ataraxy22 / Wikimedia Commons
8. Delaware: Dover
> Audits per 1,000 tax returns: 7.37 (state: 7.31)
> Median household income: $57,647 (state: $63,036)
> Poverty rate: 13.0% (state: 12.1%)
> Adults with a bachelor’s degree: 23.5% (state: 31.0%)
See all stories featuring: Delaware

Source: littleny / Getty Images
9. Florida: Miami-Fort Lauderdale-West Palm Beach
> Audits per 1,000 tax returns: 8.74 (state: 8.21)
> Median household income: $51,758 (state: $50,883)
> Poverty rate: 16.1% (state: 15.5%)
> Adults with a bachelor’s degree: 30.6% (state: 28.5%)
See all stories featuring: Florida
[in-text-ad-2]

Source: highlander411 / Flickr
10. Georgia: Albany
> Audits per 1,000 tax returns: 9.39 (state: 8.40)
> Median household income: $40,612 (state: $52,977)
> Poverty rate: 25.7% (state: 16.9%)
> Adults with a bachelor’s degree: 19.5% (state: 29.9%)
See all stories featuring: Georgia

Source: unclegene / Getty Images
11. Hawaii: Kahului-Wailuku-Lahaina
> Audits per 1,000 tax returns: 7.60 (state: 7.39)
> Median household income: $72,743 (state: $74,923)
> Poverty rate: 10.0% (state: 10.3%)
> Adults with a bachelor’s degree: 26.3% (state: 32.0%)
See all stories featuring: Hawaii
[in-text-ad]

Source: Richard Schafer / Getty Images
12. Idaho: Idaho Falls
> Audits per 1,000 tax returns: 7.79 (state: 7.69)
> Median household income: $54,663 (state: $50,985)
> Poverty rate: 11.5% (state: 14.5%)
> Adults with a bachelor’s degree: 27.5% (state: 26.8%)
See all stories featuring: Idaho

Source: Daniel Schwen / Wikimedia Commons
13. Illinois: Danville
> Audits per 1,000 tax returns: 7.67 (state: 7.49)
> Median household income: $44,930 (state: $61,229)
> Poverty rate: 19.8% (state: 13.5%)
> Adults with a bachelor’s degree: 14.6% (state: 33.4%)
See all stories featuring: Illinois

Source: Davel5957 / Getty Images
14. Indiana: South Bend-Mishawaka
> Audits per 1,000 tax returns: 7.52 (state: 7.31)
> Median household income: $48,681 (state: $52,182)
> Poverty rate: 16.5% (state: 14.6%)
> Adults with a bachelor’s degree: 26.7% (state: 25.3%)
See all stories featuring: Indiana
[in-text-ad-2]

Source: DenisTangneyJr / Getty Images
15. Iowa: Sioux City
> Audits per 1,000 tax returns: 7.35 (state: 7.03)
> Median household income: $54,474 (state: $56,570)
> Poverty rate: 12.9% (state: 12.0%)
> Adults with a bachelor’s degree: 21.7% (state: 27.7%)
See all stories featuring: Iowa

Source: Sean Pavone / Getty Images
16. Kansas: Wichita
> Audits per 1,000 tax returns: 7.33 (state: 7.30)
> Median household income: $53,953 (state: $55,477)
> Poverty rate: 13.9% (state: 12.8%)
> Adults with a bachelor’s degree: 30.0% (state: 32.3%)
See all stories featuring: Kansas
[in-text-ad]

Source: DenisTangneyJr / Getty Images
17. Kentucky: Bowling Green
> Audits per 1,000 tax returns: 7.79 (state: 7.76)
> Median household income: $46,716 (state: $46,535)
> Poverty rate: 18.7% (state: 18.3%)
> Adults with a bachelor’s degree: 25.1% (state: 23.2%)
See all stories featuring: Kentucky

Source: DenisTangneyJr / Getty Images
18. Louisiana: Monroe
> Audits per 1,000 tax returns: 8.92 (state: 8.39)
> Median household income: $39,904 (state: $46,710)
> Poverty rate: 24.2% (state: 19.6%)
> Adults with a bachelor’s degree: 22.8% (state: 23.4%)
See all stories featuring: Louisiana

Source: DenisTangneyJr / Getty Images
19. Maine: Lewiston-Auburn
> Audits per 1,000 tax returns: 7.29 (state: 7.17)
> Median household income: $49,538 (state: $53,024)
> Poverty rate: 14.3% (state: 12.9%)
> Adults with a bachelor’s degree: 22.1% (state: 30.3%)
See all stories featuring: Maine
[in-text-ad-2]

Source: Acroterion / Wikimedia Commons
20. Maryland: Salisbury
> Audits per 1,000 tax returns: 7.54 (state: 7.36)
> Median household income: $56,283 (state: $78,916)
> Poverty rate: 13.3% (state: 9.7%)
> Adults with a bachelor’s degree: 25.8% (state: 39.0%)
See all stories featuring: Maryland

Source: Sean Pavone / Getty Images
21. Massachusetts: Boston-Cambridge-Newton
> Audits per 1,000 tax returns: 7.28 (state: 7.24)
> Median household income: $81,838 (state: $74,167)
> Poverty rate: 10.0% (state: 11.1%)
> Adults with a bachelor’s degree: 46.4% (state: 42.1%)
See all stories featuring: Massachusetts
[in-text-ad]
Source: coophil / Getty Images
22. Michigan: Niles-Benton Harbor
> Audits per 1,000 tax returns: 7.73 (state: 7.40)
> Median household income: $47,132 (state: $52,668)
> Poverty rate: 17.2% (state: 15.6%)
> Adults with a bachelor’s degree: 26.7% (state: 28.1%)
See all stories featuring: Michigan

Source: StevenGaertner / Getty Images
23. Minnesota: Minneapolis-St. Paul-Bloomington
> Audits per 1,000 tax returns: 7.01 (state: 6.99)
> Median household income: $73,735 (state: $65,699)
> Poverty rate: 9.4% (state: 10.5%)
> Adults with a bachelor’s degree: 40.5% (state: 34.8%)
See all stories featuring: Minnesota

Source: SeanPavonePhoto / Getty Images
24. Mississippi: Jackson
> Audits per 1,000 tax returns: 8.76 (state: 8.86)
> Median household income: $49,381 (state: $42,009)
> Poverty rate: 18.5% (state: 21.5%)
> Adults with a bachelor’s degree: 29.7% (state: 21.3%)
See all stories featuring: Mississippi
[in-text-ad-2]

Source: Michael Munster / Getty Images
25. Missouri: Joplin
> Audits per 1,000 tax returns: 7.93 (state: 7.57)
> Median household income: $45,913 (state: $51,542)
> Poverty rate: 15.9% (state: 14.6%)
> Adults with a bachelor’s degree: 21.6% (state: 28.2%)
See all stories featuring: Missouri

Source: akpakp / Getty Images
26. Montana: Missoula
> Audits per 1,000 tax returns: 7.32 (state: 7.43)
> Median household income: $49,412 (state: $50,801)
> Poverty rate: 15.9% (state: 14.4%)
> Adults with a bachelor’s degree: 42.6% (state: 30.7%)
See all stories featuring: Montana
[in-text-ad]

Source: Public Domain / Wikimedia Commons
27. Nebraska: Grand Island
> Audits per 1,000 tax returns: 7.48 (state: 7.16)
> Median household income: $54,479 (state: $56,675)
> Poverty rate: 12.3% (state: 12.0%)
> Adults with a bachelor’s degree: 20.3% (state: 30.6%)
See all stories featuring: Nebraska

Source: f11photo / Getty Images
28. Nevada: Las Vegas-Henderson-Paradise
> Audits per 1,000 tax returns: 7.73 (state: 7.64)
> Median household income: $54,882 (state: $55,434)
> Poverty rate: 14.6% (state: 14.2%)
> Adults with a bachelor’s degree: 23.3% (state: 23.7%)
See all stories featuring: Nevada

Source: DenisTangneyJr / Getty Images
29. New Hampshire: Manchester-Nashua
> Audits per 1,000 tax returns: 6.91 (state: 6.91)
> Median household income: $75,777 (state: $71,305)
> Poverty rate: 8.6% (state: 8.1%)
> Adults with a bachelor’s degree: 36.5% (state: 36.0%)
See all stories featuring: New Hampshire
[in-text-ad-2]

Source: ChrisBoswell / Getty Images
30. New Jersey: Trenton
> Audits per 1,000 tax returns: 7.65 (state: 7.52)
> Median household income: $77,027 (state: $76,475)
> Poverty rate: 11.3% (state: 10.7%)
> Adults with a bachelor’s degree: 41.5% (state: 38.1%)
See all stories featuring: New Jersey

Source: SWCargill / Getty Images
31. New Mexico: Las Cruces
> Audits per 1,000 tax returns: 8.66 (state: 8.13)
> Median household income: $39,114 (state: $46,718)
> Poverty rate: 27.9% (state: 20.6%)
> Adults with a bachelor’s degree: 27.4% (state: 26.9%)
See all stories featuring: New Mexico
[in-text-ad]

Source: Sean Pavone / Getty Images
32. New York: New York-Newark-Jersey City
> Audits per 1,000 tax returns: 7.97 (state: 7.82)
> Median household income: $72,205 (state: $62,765)
> Poverty rate: 13.8% (state: 15.1%)
> Adults with a bachelor’s degree: 38.7% (state: 35.3%)
See all stories featuring: New York

Source: Mikereichold 16:11, 4 September 2008 (UTC) / Wikimedia Commons
33. North Carolina: Rocky Mount
> Audits per 1,000 tax returns: 8.63 (state: 7.87)
> Median household income: $41,593 (state: $50,320)
> Poverty rate: 19.1% (state: 16.1%)
> Adults with a bachelor’s degree: 17.2% (state: 29.9%)
See all stories featuring: North Carolina

Source: DenisTangneyJr / Getty Images
34. North Dakota: Grand Forks
> Audits per 1,000 tax returns: 6.81 (state: 6.98)
> Median household income: $52,377 (state: $61,285)
> Poverty rate: 15.5% (state: 11.0%)
> Adults with a bachelor’s degree: 30.8% (state: 28.9%)
See all stories featuring: North Dakota
[in-text-ad-2]

Source: Mshake / Getty Images
35. Ohio: Toledo
> Audits per 1,000 tax returns: 7.33 (state: 7.23)
> Median household income: $48,284 (state: $52,407)
> Poverty rate: 17.8% (state: 14.9%)
> Adults with a bachelor’s degree: 26.4% (state: 27.2%)
See all stories featuring: Ohio

Source: DenisTangneyJr / Getty Images
36. Oklahoma: Lawton
> Audits per 1,000 tax returns: 7.95 (state: 7.82)
> Median household income: $49,608 (state: $49,767)
> Poverty rate: 16.6% (state: 16.2%)
> Adults with a bachelor’s degree: 21.5% (state: 24.8%)
See all stories featuring: Oklahoma
[in-text-ad]

Source: dberry / Flickr
37. Oregon: Grants Pass
> Audits per 1,000 tax returns: 7.95 (state: 7.35)
> Median household income: $40,705 (state: $56,119)
> Poverty rate: 18.6% (state: 14.9%)
> Adults with a bachelor’s degree: 17.6% (state: 32.3%)
See all stories featuring: Oregon

Source: Sean Pavone / Getty Images
38. Pennsylvania: Philadelphia-Camden-Wilmington
> Audits per 1,000 tax returns: 7.51 (state: 7.19)
> Median household income: $66,285 (state: $56,951)
> Poverty rate: 13.1% (state: 13.1%)
> Adults with a bachelor’s degree: 36.2% (state: 30.1%)
See all stories featuring: Pennsylvania

Source: SeanPavonePhoto / Getty Images
39. Rhode Island: Providence-Warwick
> Audits per 1,000 tax returns: 7.16 (state: 7.26)
> Median household income: $61,536 (state: $61,043)
> Poverty rate: 13.0% (state: 13.4%)
> Adults with a bachelor’s degree: 31.0% (state: 33.0%)
See all stories featuring: Rhode Island
[in-text-ad-2]

Source: Florence Conventions and Visitors Bureau / Wikimedia Commons
40. South Carolina: Florence
> Audits per 1,000 tax returns: 8.71 (state: 8.02)
> Median household income: $40,888 (state: $48,781)
> Poverty rate: 20.6% (state: 16.6%)
> Adults with a bachelor’s degree: 21.0% (state: 27.0%)
See all stories featuring: South Carolina

Source: disorderly / Getty Images
41. South Dakota: Rapid City
> Audits per 1,000 tax returns: 7.27 (state: 7.34)
> Median household income: $52,683 (state: $54,126)
> Poverty rate: 13.0% (state: 13.9%)
> Adults with a bachelor’s degree: 28.3% (state: 27.8%)
See all stories featuring: South Dakota
[in-text-ad]

Source: Sean Pavone / Getty Images
42. Tennessee: Memphis
> Audits per 1,000 tax returns: 8.63 (state: 7.92)
> Median household income: $50,194 (state: $48,708)
> Poverty rate: 18.9% (state: 16.7%)
> Adults with a bachelor’s degree: 27.2% (state: 26.1%)
See all stories featuring: Tennessee
 24/7 Wall St.
Source: DenisTangneyJr / Getty Images
43. Texas: McAllen-Edinburg-Mission
> Audits per 1,000 tax returns: 9.86 (state: 8.13)
> Median household income: $37,097 (state: $57,051)
> Poverty rate: 31.8% (state: 16.0%)
> Adults with a bachelor’s degree: 17.8% (state: 28.7%)
See all stories featuring: Texas

Source: Eddie Maloney from North Las Vegas, USA / Wikimedia Commons
44. Utah: St. George
> Audits per 1,000 tax returns: 7.69 (state: 7.24)
> Median household income: $55,175 (state: $65,325)
> Poverty rate: 14.2% (state: 11.0%)
> Adults with a bachelor’s degree: 28.1% (state: 32.5%)
See all stories featuring: Utah
[in-text-ad-2]

Source: ErikaMitchell / Getty Images
45. Vermont: Burlington-South Burlington
> Audits per 1,000 tax returns: 6.81 (state: 7.10)
> Median household income: $65,476 (state: $57,808)
> Poverty rate: 10.4% (state: 11.4%)
> Adults with a bachelor’s degree: 43.4% (state: 36.8%)
See all stories featuring: Vermont

Source: Davel5957 / Getty Images
46. Virginia: Virginia Beach-Norfolk-Newport News
> Audits per 1,000 tax returns: 7.53 (state: 7.55)
> Median household income: $61,889 (state: $68,766)
> Poverty rate: 12.2% (state: 11.2%)
> Adults with a bachelor’s degree: 30.8% (state: 37.6%)
See all stories featuring: Virginia
[in-text-ad]

Source: brostad / Flickr
47. Washington: Yakima
> Audits per 1,000 tax returns: 7.92 (state: 7.23)
> Median household income: $47,470 (state: $66,174)
> Poverty rate: 19.0% (state: 12.2%)
> Adults with a bachelor’s degree: 15.9% (state: 34.5%)
See all stories featuring: Washington

Source: Tim Kiser (w:User:Malepheasant) / Wikimedia Commons
48. West Virginia: Beckley
> Audits per 1,000 tax returns: 7.63 (state: 7.44)
> Median household income: $41,141 (state: $44,061)
> Poverty rate: 18.5% (state: 17.8%)
> Adults with a bachelor’s degree: 17.1% (state: 19.9%)
See all stories featuring: West Virginia

Source: Sean Pavone / Getty Images
49. Wisconsin: Milwaukee-Waukesha-West Allis
> Audits per 1,000 tax returns: 7.20 (state: 6.93)
> Median household income: $57,531 (state: $56,759)
> Poverty rate: 14.5% (state: 12.3%)
> Adults with a bachelor’s degree: 34.5% (state: 29.0%)
See all stories featuring: Wisconsin
[in-text-ad-2]
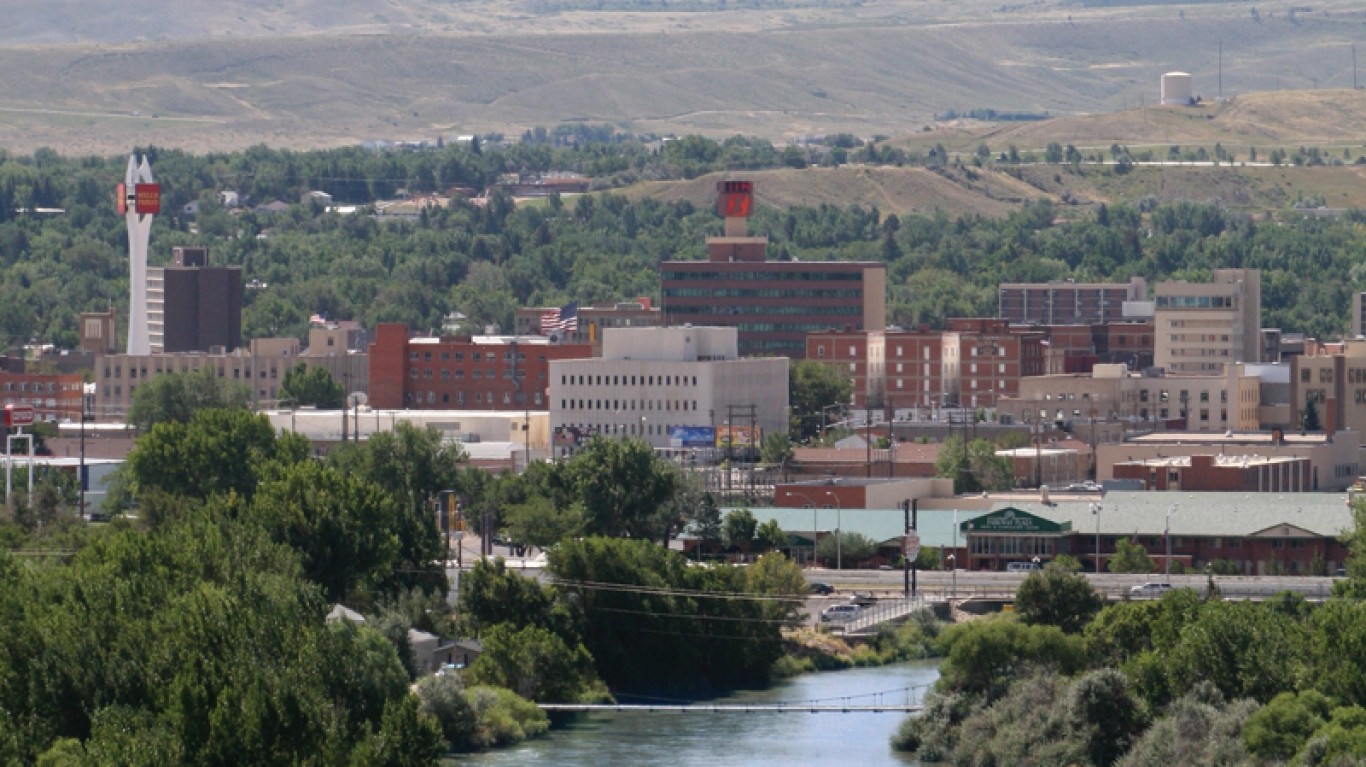
Source: Public Domain / Wikimedia Commons
50. Wyoming: Casper
> Audits per 1,000 tax returns: 7.15 (state: 7.14)
> Median household income: $59,400 (state: $60,938)
> Poverty rate: 9.9% (state: 11.1%)
> Adults with a bachelor’s degree: 22.8% (state: 26.7%)
See all stories featuring: Wyoming
Methodology
To identify the city in each state where you are most likely to be audited, 24/7 Wall St. analyzed data on tax returns and audits, originally compiled by Tax Notes, on the metropolitan statistical area (MSA) level. Weighted averages for audit rates were calculated using American Community Survey (ACS) 2017 5-Year Estimates for population on a county level.
Median household income, poverty rates, and educational attainment by MSA and state also came from the ACS.
Essential Tips for Investing: Sponsored
A financial advisor can help you understand the advantages and disadvantages of investment properties. Finding a qualified financial advisor doesn’t have to be hard. SmartAsset’s free tool matches you with up to three financial advisors who serve your area, and you can interview your advisor matches at no cost to decide which one is right for you. If you’re ready to find an advisor who can help you achieve your financial goals, get started now.
Investing in real estate can diversify your portfolio. But expanding your horizons may add additional costs. If you’re an investor looking to minimize expenses, consider checking out online brokerages. They often offer low investment fees, helping you maximize your profit.
Thank you for reading! Have some feedback for us?
Contact the 24/7 Wall St. editorial team.
Editors' Picks