Cities Where Neighborhoods Are Gentrifying the Fastest
September 25, 2019 by Evan Comen
While in recent years cities across the United States have experienced an influx of young, wealthy, educated professionals, not all residents are benefitting from the rapid growth and development.
Since the 1960s, gentrification has been a controversial and hotly debated topic in urban planning. While there are a number of existing models of gentrification among sociologists and urban researchers, the process generally occurs when a large number of wealthy, educated residents relocates to an economically disadvantaged area. The influx of wealth often leads to an increase in rent and property value, subsequently pricing out many of the area’s long-time residents.
This process often reinforces the cycle of poverty for a city’s poorest residents, leading to highly concentrated areas of poverty. Here is a state-by-state look at the cities hit hardest by extreme poverty.
To determine the cities where neighborhoods are gentrifying the fastest, 24/7 Wall St. reviewed the change in home value and bachelor’s degree attainment in neighborhoods, using census-tract-level data from the U.S. Census Bureau. We identified metro areas with the largest shares of residents living in gentrified neighborhoods — middle- to low-income neighborhoods that have had above-average increases in home value and college attainment since 2000.
Displacement caused by gentrification can also contribute to racial segregation. Indeed, some of the cities on this list are also among the most heavily segregated. These are the 25 most segregated cities in America.
Click here to see the full list of cities where neighborhoods are gentrifying the fastest
Click here to see our detailed findings and methodology
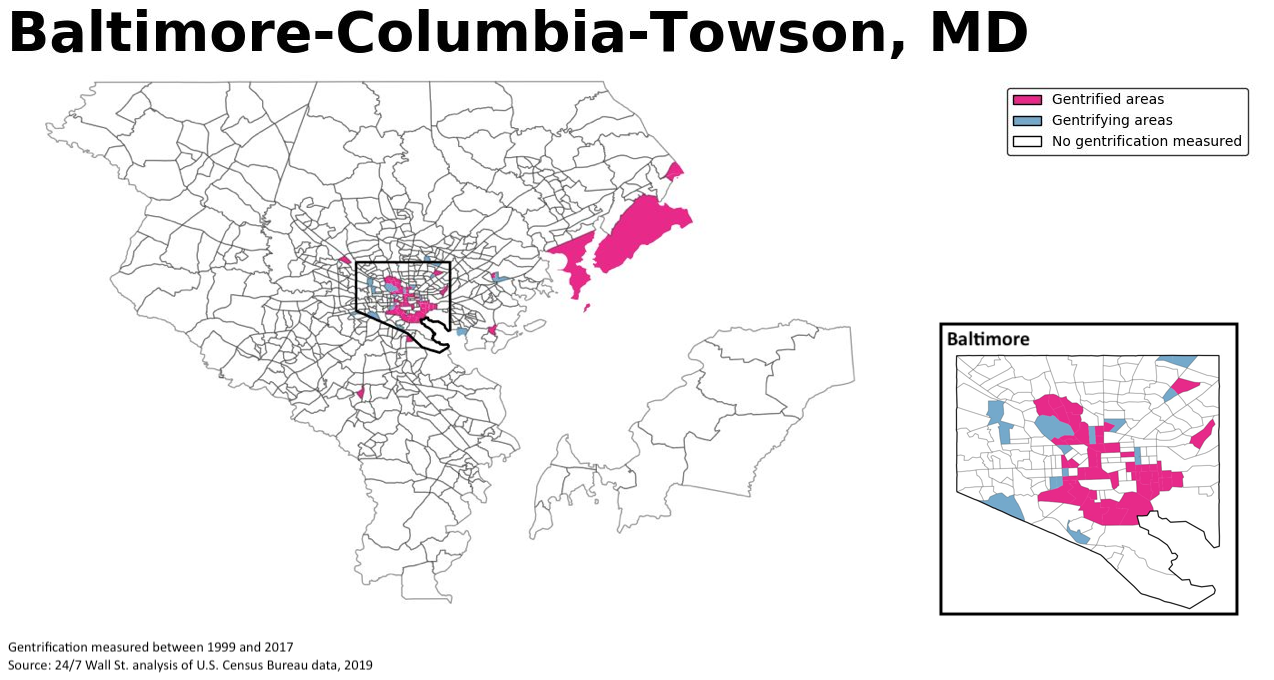
16. Baltimore-Columbia-Towson, MD
> Pct. of population in gentrified neighborhoods: 5.1%
> Metro area population: 2.6 million (2000); 2.8 million (2017)
> Median home value in gentrified areas: $97,785 (2000); $222,361 (2017)
> Median household income in gentrified areas: $40,152 (2000); $62,973 (2017)
Some 3.3% of urban-dwelling Americans nationwide live in gentrified neighborhoods — census tracts where income and home values were in the bottom 40% of all metro neighborhoods in 2000 and that have since experienced home value and educational attainment growth in the top 40% of all metro neighborhoods. In the Baltimore metro area, 5.1% of residents live in gentrified neighborhoods, one of the largest shares of any city.
The rapid process of gentrification in Baltimore has likely displaced residents across several income brackets. While the median household income in gentrified tracts rose by 56.8% from 2000 to 2017, the median home value more than doubled, from $97,785 to $222,361.
[in-text-ad]
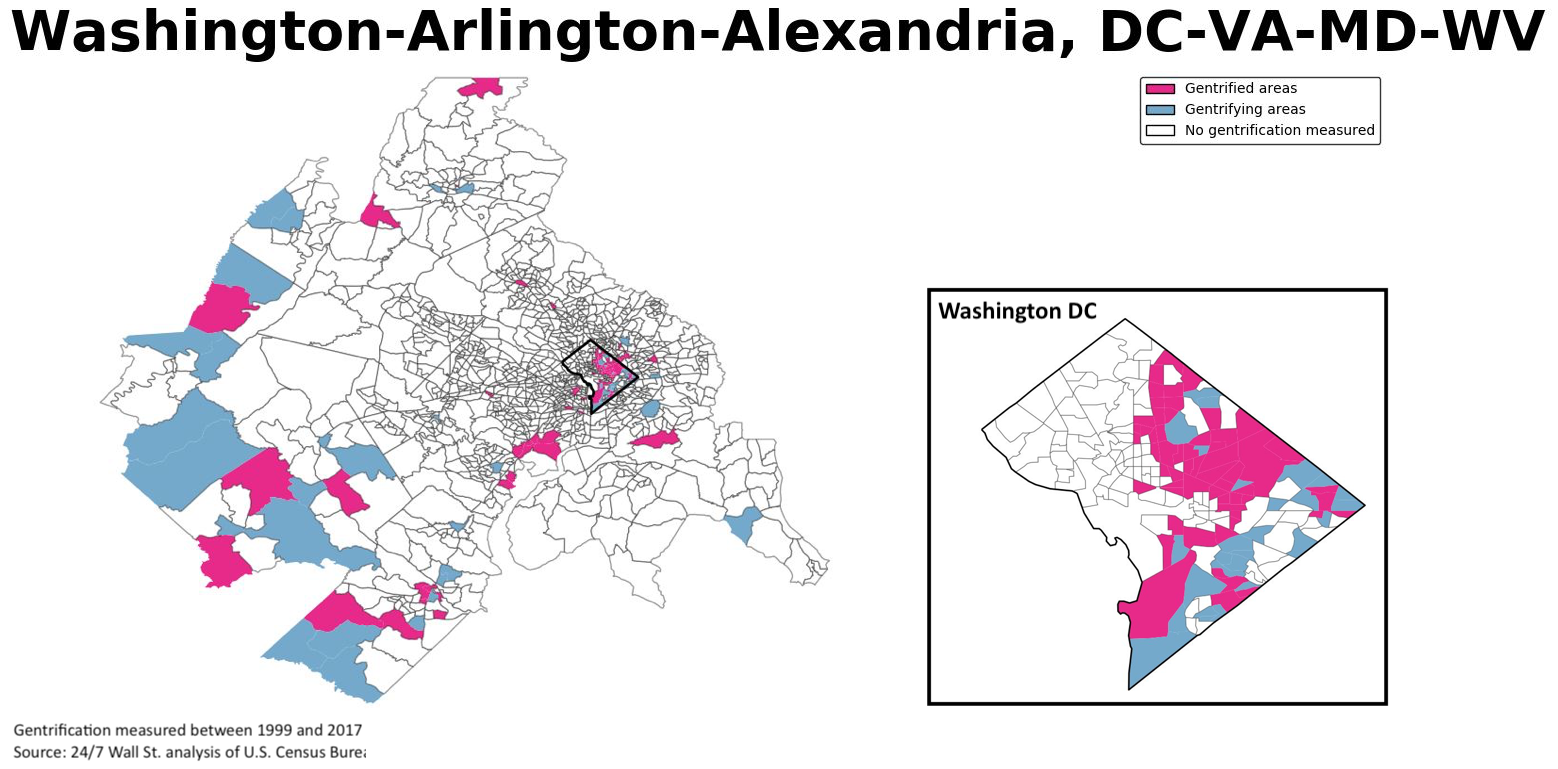
15. Washington-Arlington-Alexandria, DC-VA-MD-WV
> Pct. of population in gentrified neighborhoods: 5.2%
> Metro area population: 4.8 million (2000); 6.1 million (2017)
> Median home value in gentrified areas: $174,787 (2000); $417,951 (2017)
> Median household income in gentrified areas: $54,431 (2000); $81,942 (2017)
The population of the Washington, D.C. metro area rose by 25.9% from 2000 to 2017, far more than the 16.2% growth rate for all U.S. cities. Over that period, a handful of neighborhoods in the bottom 40% of income and home value experienced above-average growth in home value and college attainment.
As wealthy, educated transplants flocked to the D.C. suburbs, growth in home values far outpaced that of income, potentially displacing some of the city’s middle- to lower-income residents. While the median household income in gentrified neighborhoods rose by 50.5% from 2000 to 2017, the median home value more than doubled, rising from $174,787 to $417,951.
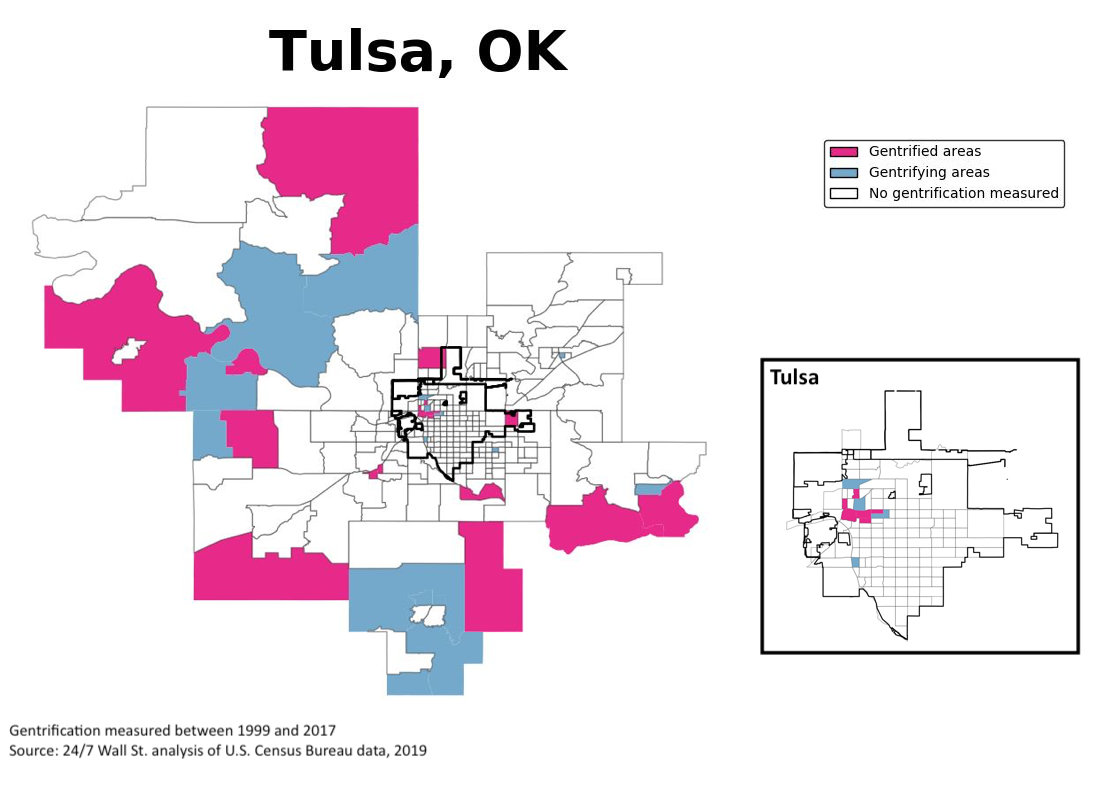
14. Tulsa, OK
> Pct. of population in gentrified neighborhoods: 5.3%
> Metro area population: 859,532 (2000); 977,869 (2017)
> Median home value in gentrified areas: $74,788 (2000); $96,873 (2017)
> Median household income in gentrified areas: $39,515 (2000); $45,463 (2017)
Some 5.3% of Tulsa residents live in gentrified neighborhoods. While home values in gentrified tracts grew by 29.5%, incomes grew by just 15.1% — potentially displacing some of the area’s residents.
One of the neighborhoods at stake is the historic Greenwood District — a hub of African American-owned businesses known colloquially as “Black Wall Street.” According to local accounts published in Tulsa World, new coffee shops, boutiques, and exercise studios have been encroaching from the neighboring Tulsa Arts District into Greenwood. Other sites of gentrification in Tulsa are found along the suburban borders of the metropolitan area.
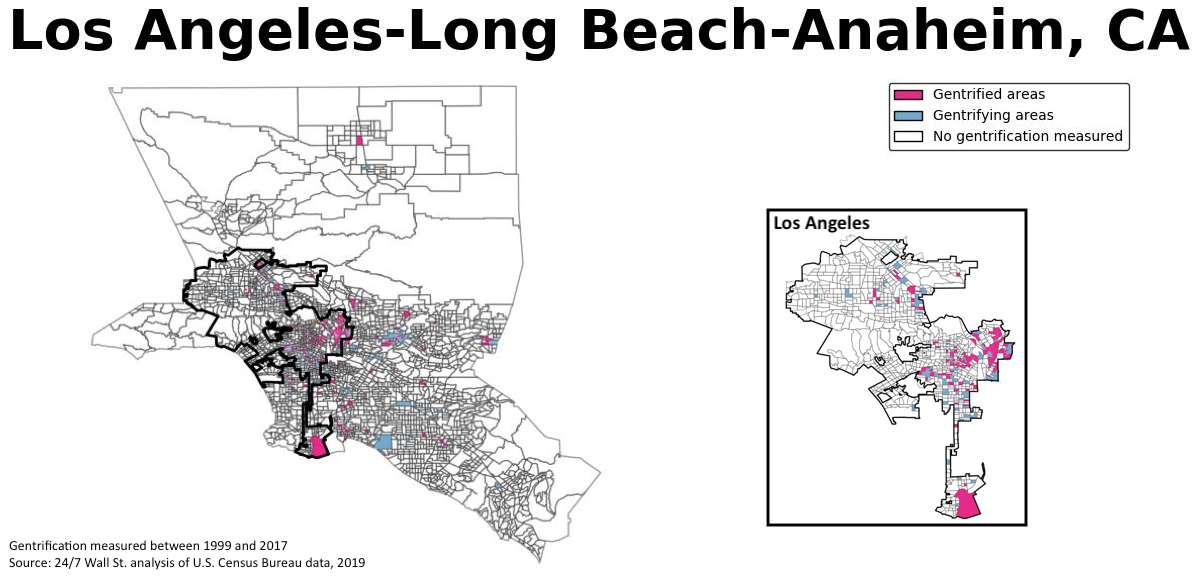
13. Los Angeles-Long Beach-Anaheim, CA
> Pct. of population in gentrified neighborhoods: 5.4%
> Metro area population: 12.4 million (2000); 13.3 million (2017)
> Median home value in gentrified areas: $186,462 (2000); $407,225 (2017)
> Median household income in gentrified areas: $37,613 (2000); $44,775 (2017)
One of America’s melting pot cities, Los Angeles has long been one of the most diverse metro areas in the country. In recent decades, however, gentrification has threatened to displace the city’s middle- to lower-income residents and increase economic segregation in the area. From 2000 to 2017, median home value in gentrified neighborhoods in Los Angeles more than doubled from $186,462 to $407,225 — one of the fastest increases of any city. Over the same period, however, the median annual household income in gentrified neighborhoods rose from $37,613 to just $44,775.
In that time, the share of white residents in gentrified neighborhoods rose from 7.9% to 9.4%, the share of black residents fell from 11.6% to 9.2%, and the share of Hispanic or Latino residents fell from 68.6% to 67.6%.
[in-text-ad-2]
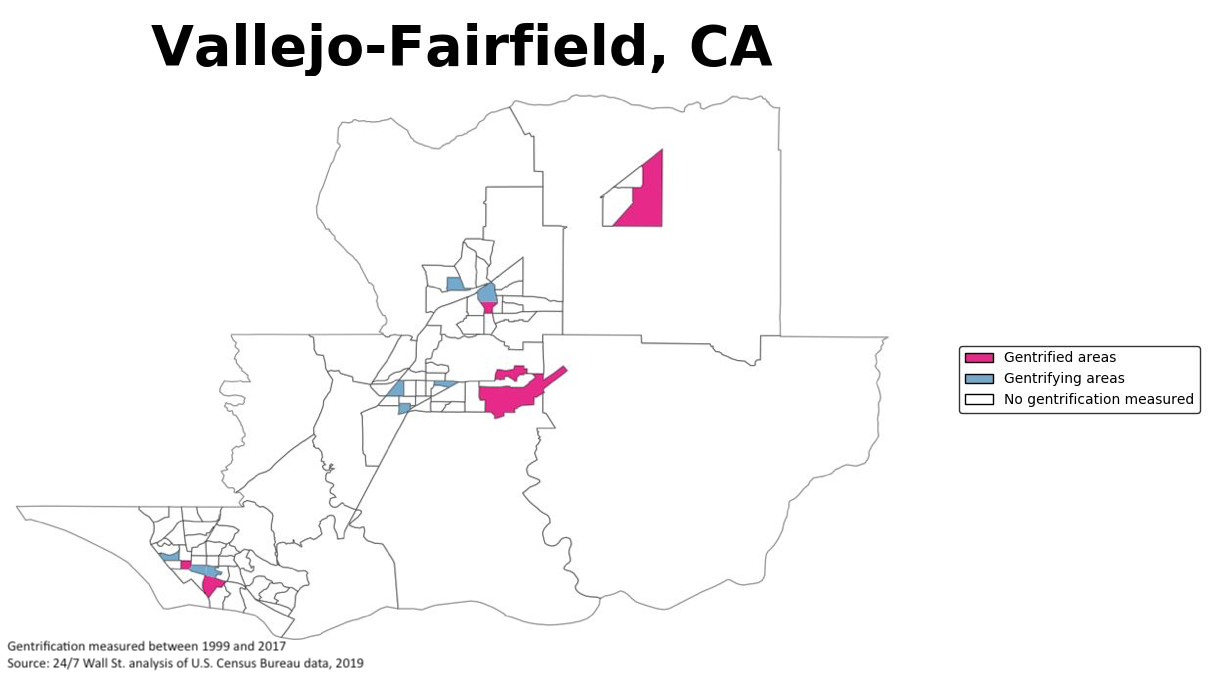
12. Vallejo-Fairfield, CA
> Pct. of population in gentrified neighborhoods: 5.6%
> Metro area population: 394,542 (2000); 434,981 (2017)
> Median home value in gentrified areas: $200,537 (2000); $247,610 (2017)
> Median household income in gentrified areas: $58,460 (2000); $65,835 (2017)
Vallejo is one of several metro areas where an outsized share of residents live in gentrified neighborhoods. Today, 5.6% of the city residents live in six gentrified neighborhoods in Vallejo, far more than the 3.3% national share. While the value of the typical home in these neighborhoods rose from $200,537 in 2000 to $247,610 in 2017, a 23.5% jump, the median annual household income rose by just 12.6%, from $58,460 to $65,835. The rapid growth in home values relative to income is likely due in part to an influx of tech workers from Silicon Valley, which threatens to displace middle- and low-income residents in the metro area.
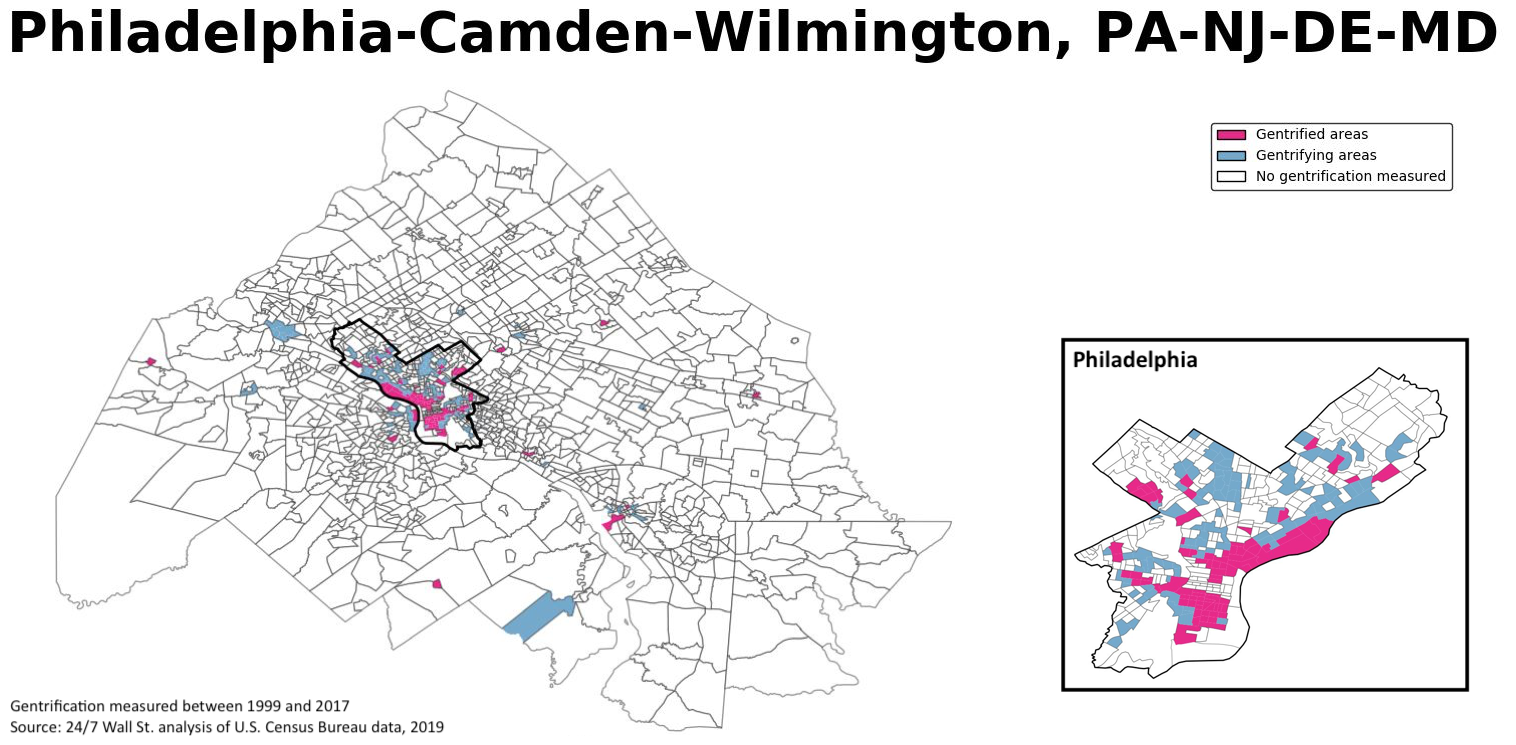
11. Philadelphia-Camden-Wilmington, PA-NJ-DE-MD
> Pct. of population in gentrified neighborhoods: 5.6%
> Metro area population: 5.7 million (2000); 6.1 million (2017)
> Median home value in gentrified areas: $81,560 (2000); $205,297 (2017)
> Median household income in gentrified areas: $38,705 (2000); $52,468 (2017)
Philadelphia already ranks as one of the most segregated cities in America, and gentrification in the City of Brotherly Love may further contribute to economic and racial stratification in the metro area. From 2000 to 2017, 92 middle- to low-income neighborhoods in the Philadelphia metro area experienced above-average growth in home value and college attainment, setting the conditions for economic displacement. While the median home value in gentrified neighborhoods more than doubled, from $81,560 to $205,297, the median household income rose by just 35.6%, from $38,705 to $52,468. Much of the gentrification occurred in revitalized neighborhoods in the city center.
[in-text-ad]
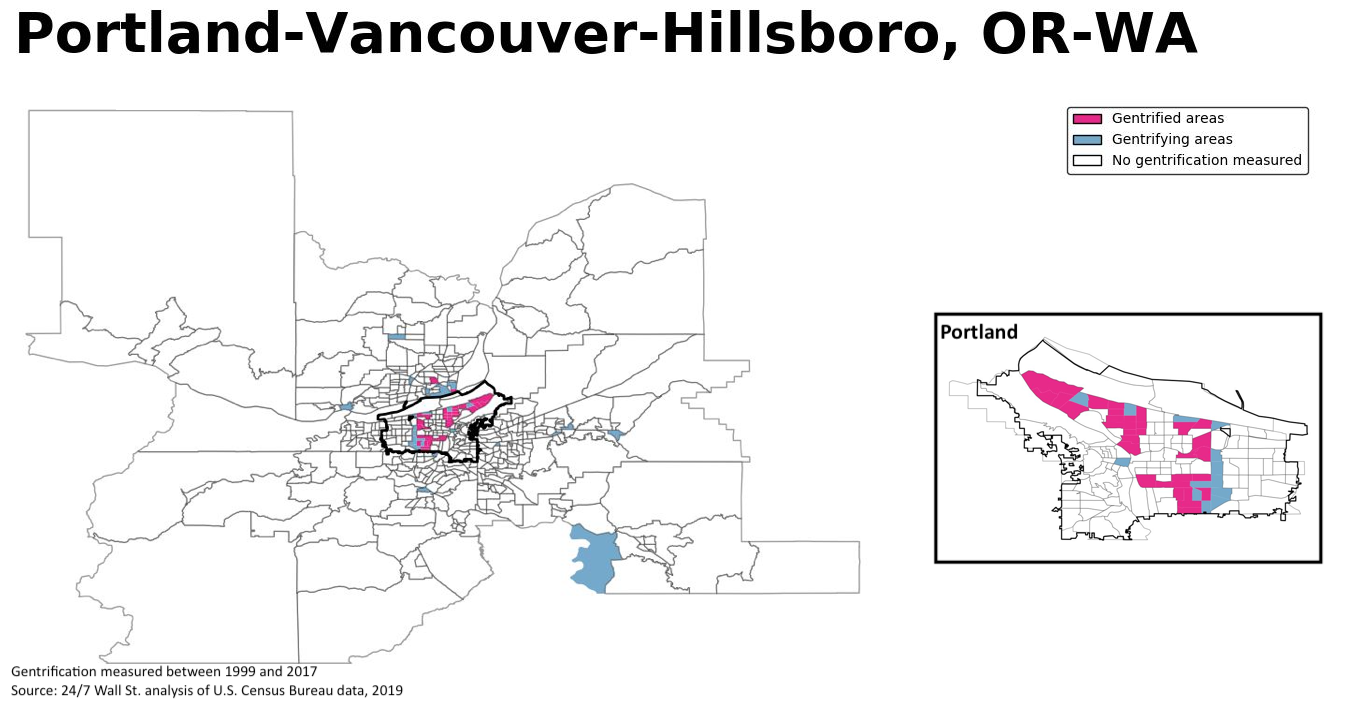
10. Portland-Vancouver-Hillsboro, OR-WA
> Pct. of population in gentrified neighborhoods: 5.7%
> Metro area population: 1.9 million (2000); 2.4 million (2017)
> Median home value in gentrified areas: $187,211 (2000); $331,817 (2017)
> Median household income in gentrified areas: $51,047 (2000); $62,176 (2017)
The 23.6% population growth in the Portland metro area from 2000 to 2017, far outpaced the 16.2% growth rate for all U.S. cities. In that period, 34 neighborhoods that ranked in the bottom 40% for income and home value experienced home value and college attainment growth in the top 40%, creating the conditions for gentrification and displacement. Today, 5.7% of the Portland population lives in such neighborhoods, compared to the 3.3% national share.
As wealthy, educated residents flocked to downtown Portland, growth in home values far outpaced that of income, making some neighborhoods less affordable for middle- and low-income residents. While home values in gentrified neighborhoods rose by 77.2% from 2000 to 2017, the median household income rose by just 21.8% over the same period.
 24/7 Wall St.
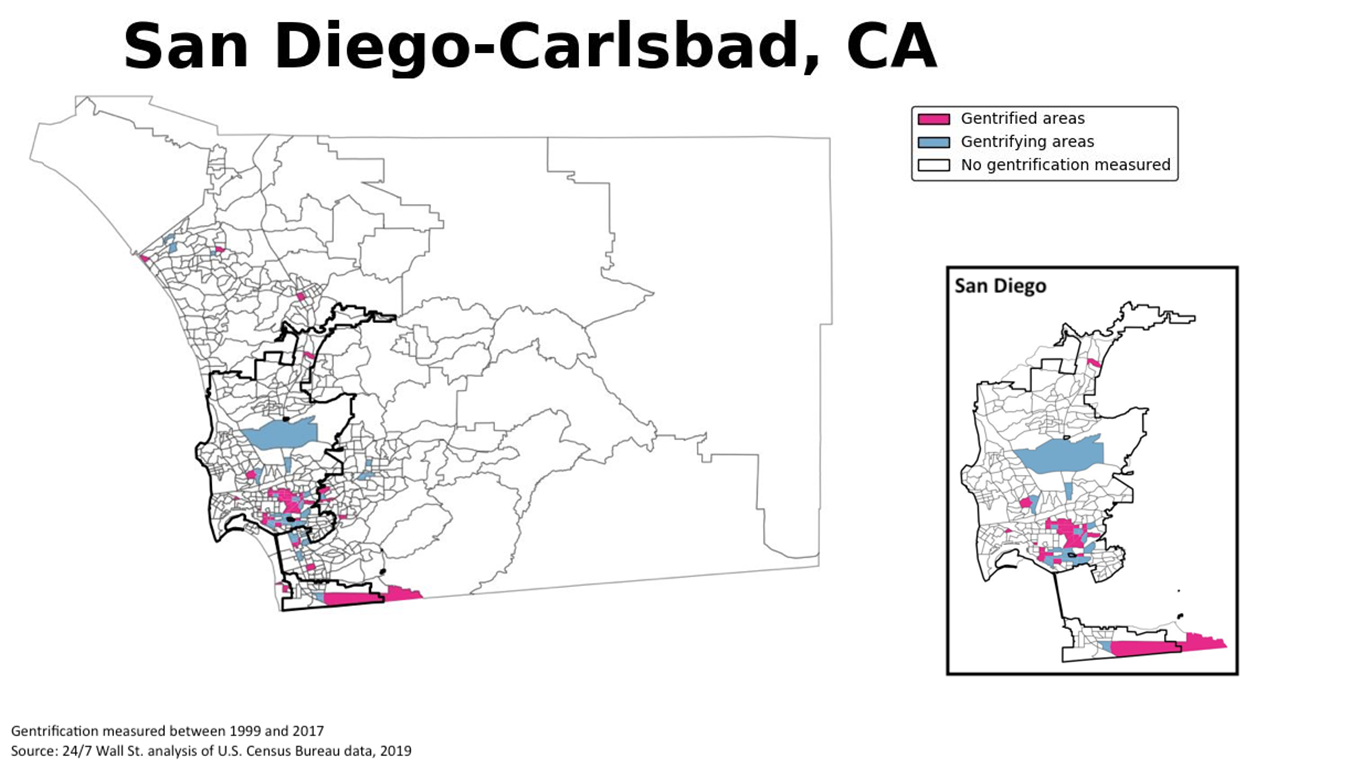
9. San Diego-Carlsbad, CA
> Pct. of population in gentrified neighborhoods: 5.8%
> Metro area population: 2.8 million (2000); 3.3 million (2017)
> Median home value in gentrified areas: $194,201 (2000); $372,220 (2017)
> Median household income in gentrified areas: $40,032 (2000); $47,869 (2017)
San Diego is one of several metro areas along the U.S.-Mexico border where gentrification is contributing to a rapid rise in home values. From 2000 to 2017, 43 middle- to low-income neighborhoods in the San Diego metro area experienced above-average home value and college attainment growth, setting the conditions for economic displacement. While the median home value in gentrified neighborhoods nearly doubled, from $194,201 to $372,220, the median annual household income rose by just 19.6%, from $40,032 to $47,869, making the area less unaffordable for a large number of residents. Many of the gentrified neighborhoods are located in downtown San Diego.
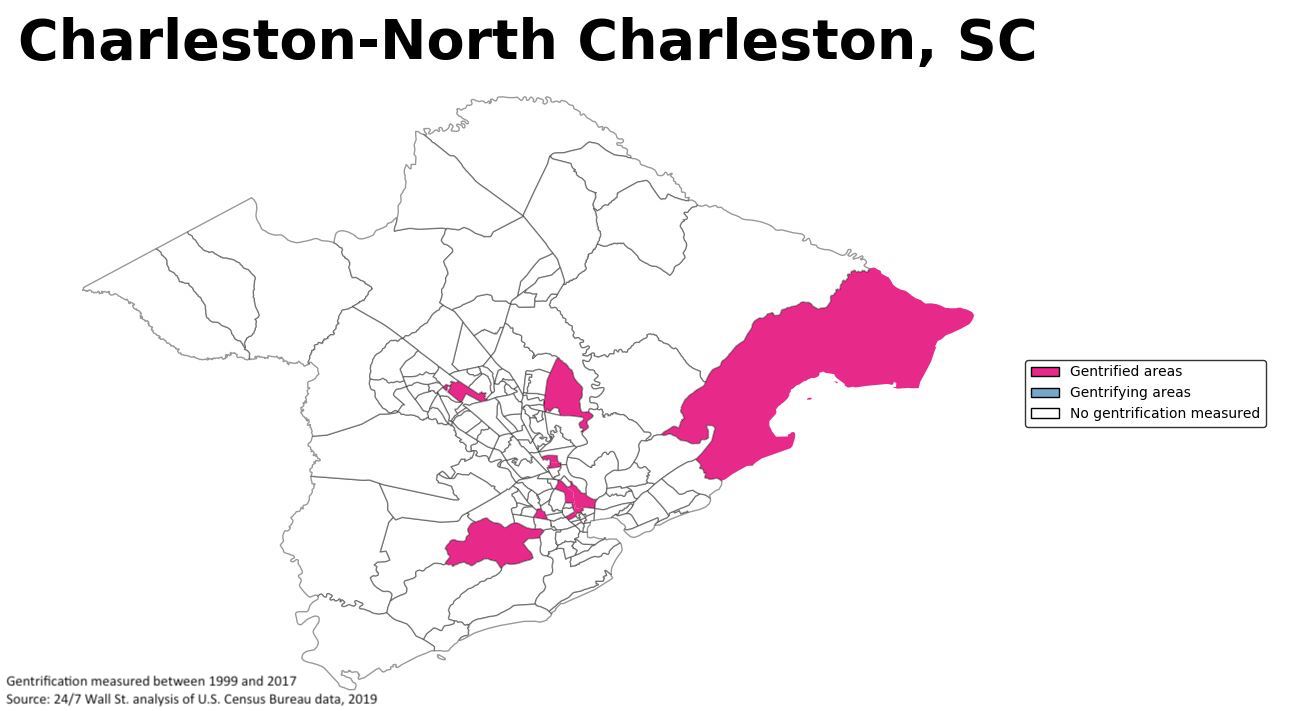
8. Charleston-North Charleston, SC
> Pct. of population in gentrified neighborhoods: 6.1%
> Metro area population: 549,033 (2000); 744,195 (2017)
> Median home value in gentrified areas: $99,669 (2000); $203,407 (2017)
> Median household income in gentrified areas: $37,493 (2000); $49,220 (2017)
The population of the Charleston metro area rose by 35.5% from 2000 to 2017, nearly double the 16.2% national metro area growth rate and the 19th largest increase of any U.S. city. Over that period, 12 middle- to low-income neighborhoods experienced above-average home value and college attainment growth, creating the conditions for gentrification and displacement. While home values in gentrified neighborhoods more than doubled, the median household income rose just by 31.3% — likely forcing some residents to move to more affordable neighborhoods.
Gentrification in Charleston has contributed to displacement along racial lines in the metro area. From 2000 to 2017, the white population as a share of the gentrified neighborhood population rose from 38.3% to 51.9%. Meanwhile, the portion of the black population fell from 55.7% to 39.6%.
[in-text-ad-2]
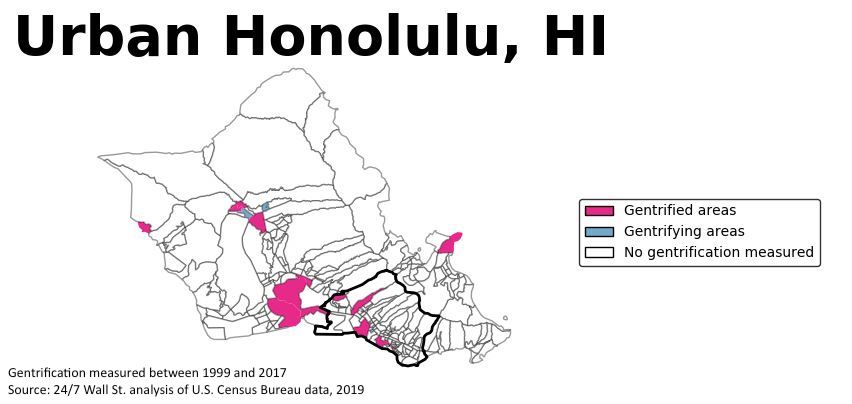
7. Urban Honolulu, HI
> Pct. of population in gentrified neighborhoods: 6.3%
> Metro area population: 876,156 (2000); 990,060 (2017)
> Median home value in gentrified areas: $202,915 (2000); $286,508 (2017)
> Median household income in gentrified areas: $50,652 (2000); $65,674 (2017)
From 2000 to 2017, 17 neighborhoods in Honolulu that ranked in the bottom 40% for income and home value experienced home value and college attainment growth in the top 40%. In these gentrified neighborhoods, median home values rose from $202,915 to $286,508, a 41.2% increase. Meanwhile, the median household income rose from $50,652 to $65,674, a 29.7% increase. As a result, a large number of middle- to low-income residents in these neighborhoods — many of which are located along the southern shore of the island — are likely being priced out of their homes. One neighborhood receiving particular attention in the media is Chinatown, where remnants of the city’s once-thriving red-light district are being replaced by upscale stores and restaurants.
Click image to enlarge
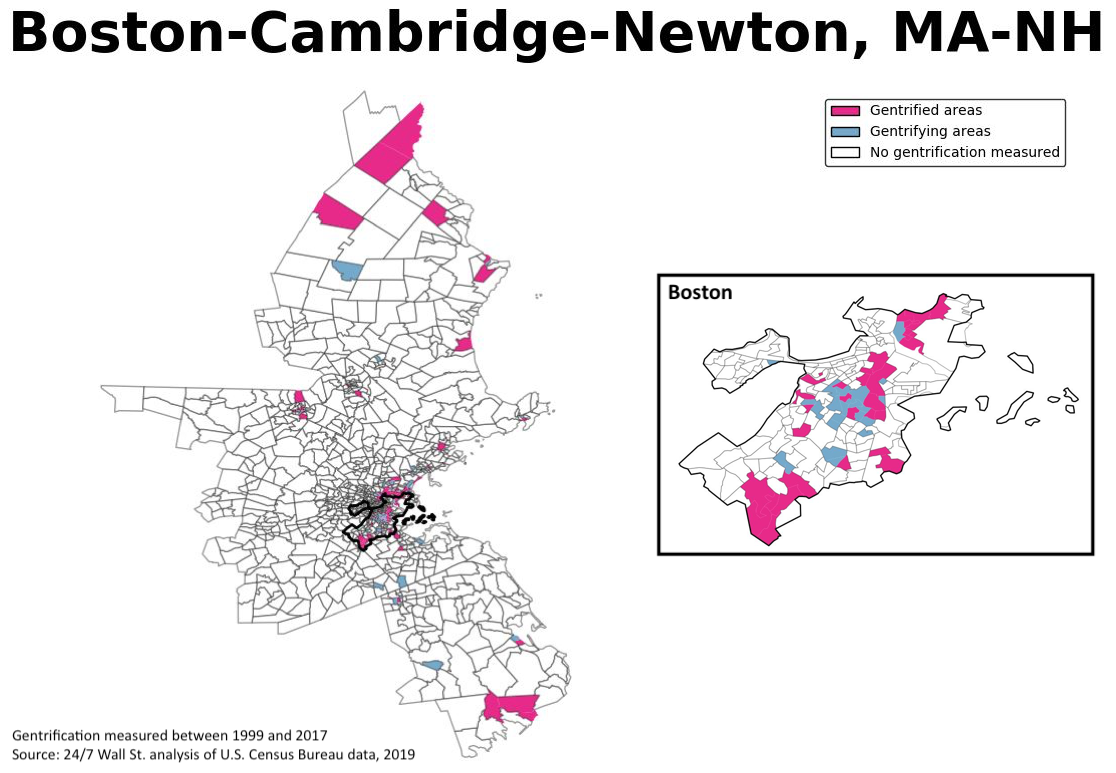
6. Boston-Cambridge-Newton, MA-NH
> Pct. of population in gentrified neighborhoods: 6.3%
> Metro area population: 4.4 million (2000); 4.8 million (2017)
> Median home value in gentrified areas: $196,319 (2000); $352,689 (2017)
> Median household income in gentrified areas: $52,701 (2000); $63,963 (2017)
Some 6.3% of Boston area residents live in gentrified neighborhoods — middle- to lower-income census tracts that experienced above-average growth in home value and college attainment from 2000 to 2017 — far more than the 3.3% of urban-dwelling Americans who do in metro areas nationwide. While the median home value in gentrified neighborhoods in Boston rose by 79.7% from $196,319 in 2000 to $352,689 in 2017, the median household income rose by just 21.4% — from $52,701 to $63,963 — likely pricing out a large number of residents.
Much of the gentrification in Boston is taking place in neighborhoods such as Roxbury, Allston, and South End, and according to local sources, it is being driven in part by the expansion of schools like Harvard and Northeastern University.
[in-text-ad]
Click image to enlarge
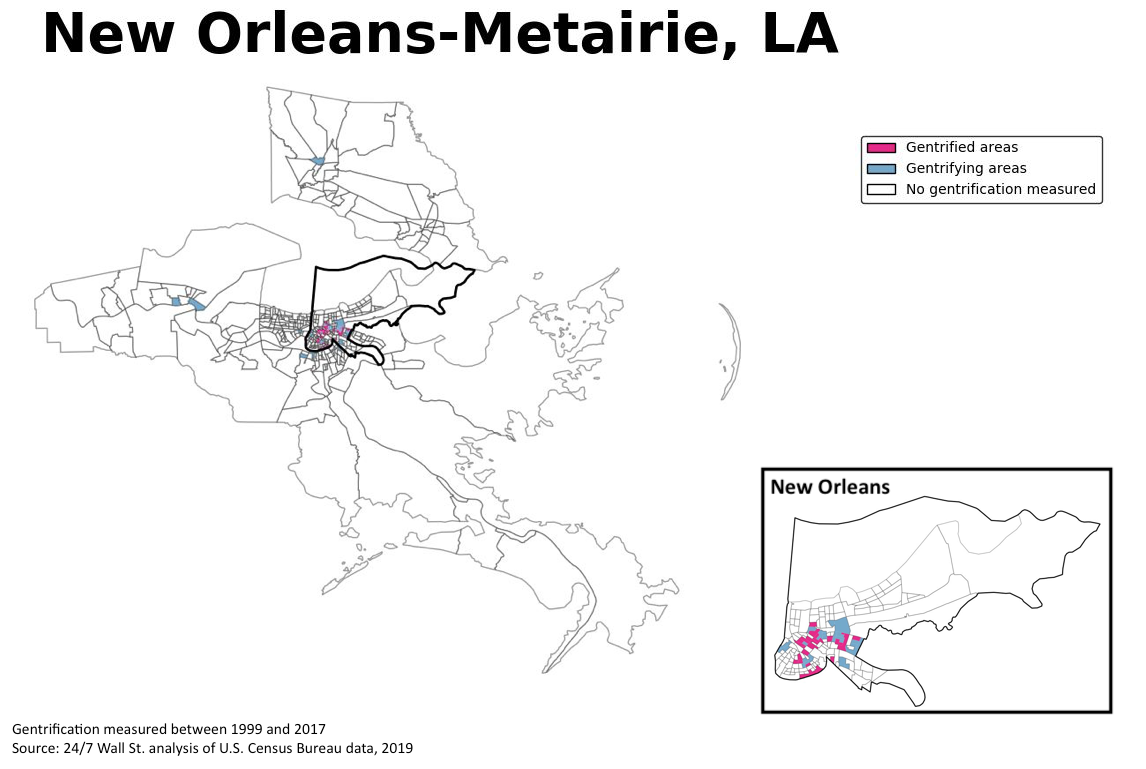
5. New Orleans-Metairie, LA
> Pct. of population in gentrified neighborhoods: 6.3%
> Metro area population: 1.3 million (2000); 1.3 million (2017)
> Median home value in gentrified areas: $89,464 (2000); $208,370 (2017)
> Median household income in gentrified areas: $23,129 (2000); $32,235 (2017)
Some 3.3% of urban-dwelling Americans nationwide live in gentrified neighborhoods — census tracts where income and home values were in the bottom 40% of all metro neighborhoods in 2000, and have since experienced home value and educational attainment growth in the top 40% of all metro neighborhoods. In the New Orleans metro area, 6.3% of residents live in gentrified neighborhoods, the fifth largest share of any city.
Many of the neighborhoods that were gentrified are located in parts of the city that were damaged by Hurricane Katrina. In one December 2018 study published in the academic journal Urban Studies, researchers found a positive correlation between hurricane damage and the likelihood of gentrification in New Orleans.
Click image to enlarge
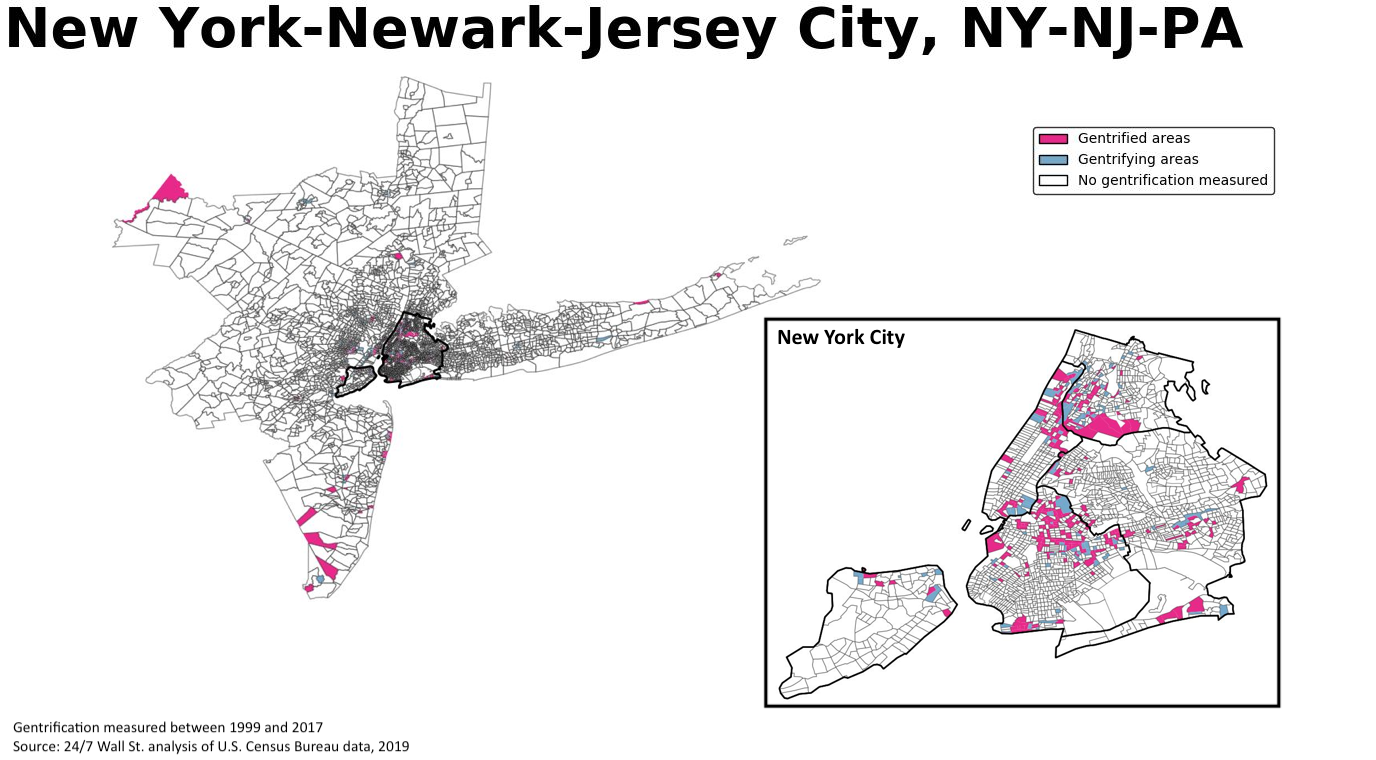
4. New York-Newark-Jersey City, NY-NJ-PA
> Pct. of population in gentrified neighborhoods: 6.4%
> Metro area population: 18.9 million (2000); 20.2 million (2017)
> Median home value in gentrified areas: $117,146 (2000); $422,728 (2017)
> Median household income in gentrified areas: $35,683 (2000); $48,630 (2017)
In the past two decades, hundreds of neighborhoods in the bottom 40% of income and home value in the New York metro area have undergone above-average growth in home prices and college attainment, creating the conditions for gentrification and displacement. While household incomes in neighborhoods that gentrified from 2000 to 2017 rose by 36.3%, the median home value in these tracts more than tripled, from $117,146 to $422,728.
Gentrification has led to displacement along racial lines in the metro area. The number of white residents as a share of the gentrified neighborhood population rose from 16.2% to 21.5% from 2000 to 2017, while the black population fell from 34.1% to 28.6%. Some of the starkest examples of gentrification in New York include Williamsburg, Greenpoint, and Bushwick in Brooklyn, and Harlem, the Lower East Side, and Morningside Heights in Manhattan.
Click image to enlarge
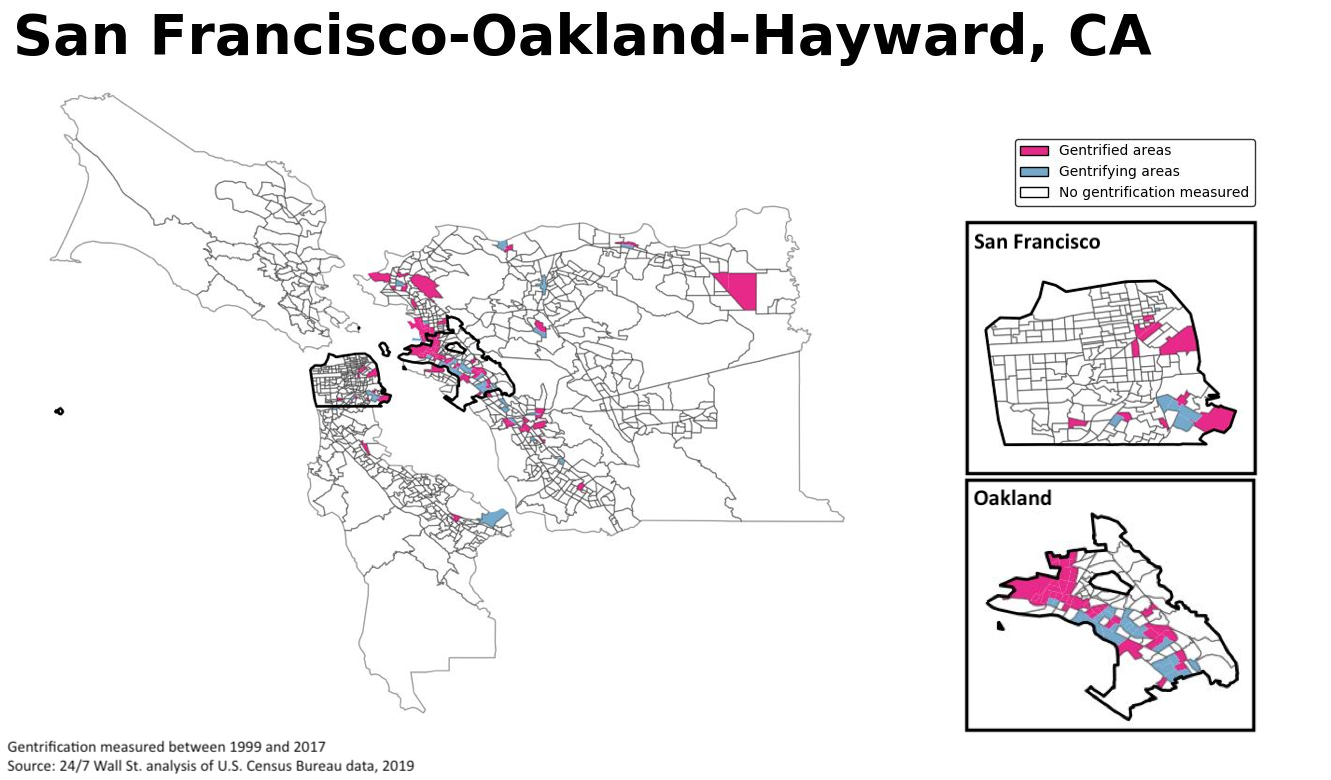
3. San Francisco-Oakland-Hayward, CA
> Pct. of population in gentrified neighborhoods: 6.5%
> Metro area population: 4.1 million (2000); 4.6 million (2017)
> Median home value in gentrified areas: $251,346 (2000); $520,345 (2017)
> Median household income in gentrified areas: $50,875 (2000); $66,795 (2017)
San Francisco is one of several California metro areas where an influx of wealthy, educated residents is rapidly driving up home values and pricing out middle- to low-income residents. From 2000 to 2017, 86 neighborhoods in the bottom 40% of income and home value in the San Francisco metro area experienced above-average growth in real estate value and college attainment. Today, 6.5% of area residents live in these neighborhoods, nearly twice the 3.3% of Americans who live in gentrified neighborhoods in metro areas nationwide.
Gentrification has likely contributed to racial segregation in San Francisco. From 2000 to 2017, the number of white residents as a share of the gentrified neighborhood population rose from 25.6% to 28.6%, and the black population fell from 28.4% to 17.2%.
[in-text-ad-2]
Click image to enlarge
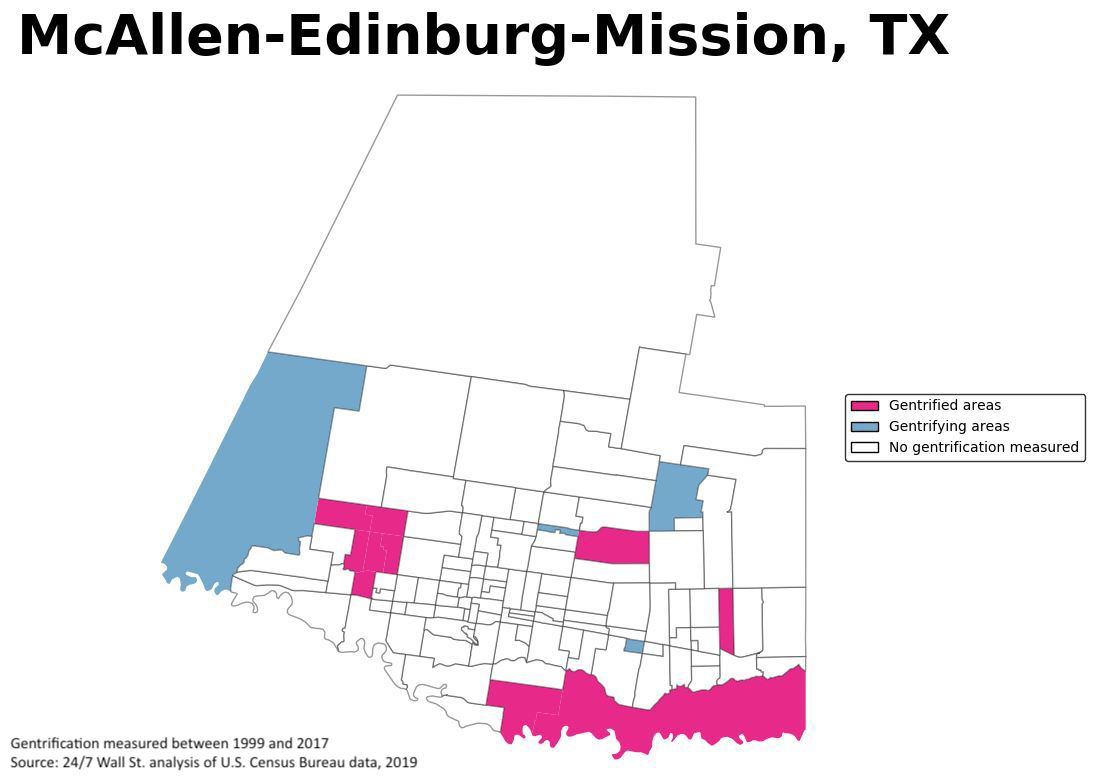
2. McAllen-Edinburg-Mission, TX
> Pct. of population in gentrified neighborhoods: 6.6%
> Metro area population: 569,463 (2000); 839,539 (2017)
> Median home value in gentrified areas: $52,276 (2000); $74,710 (2017)
> Median household income in gentrified areas: $26,097 (2000); $33,222 (2017)
From 2000 to 2017, the population of McAllen rose by 47.4%, more than twice the 16.2% growth rate across all U.S. cities. Over that period, 10 neighborhoods in the bottom 40% of income and home experienced above-average growth in home prices and college attainment, creating the conditions for gentrification and displacement.
While McAllen is one of America’s poorest cities, and the median home value in gentrified neighborhoods rose by 42.9% from just $52,276 in 2000 to $74,710 to 2017, incomes rose even less. The median annual household income rose by just 27.3% from $26,097 in 2000 to $33,222 to 2017, likely pricing out a large number of low-income residents.
Click image to enlarge
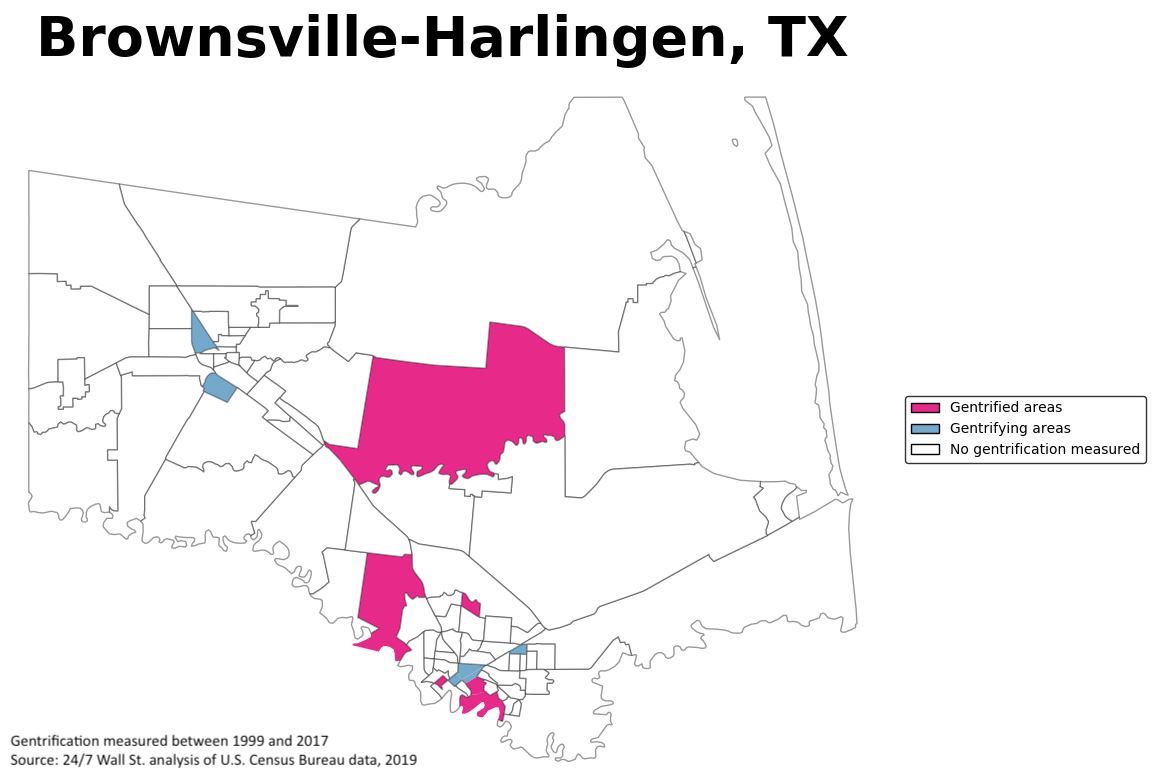
1. Brownsville-Harlingen, TX
> Pct. of population in gentrified neighborhoods: 6.6%
> Metro area population: 335,227 (2000); 420,201 (2017)
> Median home value in gentrified areas: $51,895 (2000); $64,251 (2017)
> Median household income in gentrified areas: $26,049 (2000); $28,968 (2017)
While Brownsville is one of the poorest metro areas in the country, recent real estate development in the border city has led to a rapid increase in home value in a number of poor and middle-income colonias. From 2000 to 2017, six census tracts in the bottom 40% for income and home value in the Brownsville metro area had above-average home price and college attainment growth. With incomes rising more slowly, this potentially priced out some of the region’s low- to middle-income residents.
The median home value in these neighborhoods rose from $51,895 in 2000 to $64,251 in 2017, a 23.8% increase. Meanwhile, the median household income rose by just 11.2%, from $26,049 to $28,968. Some 6.6% of the Brownsville population lives in these neighborhoods, twice the 3.3% national share and the most of any large U.S. metro area.
Detailed Findings
In all of the metro areas on this list, the increase in home values in gentrified neighborhoods has far outpaced the increase in incomes. In New York City, for example, the median home value in gentrified census tracts has more than tripled in the last two decades, rising from $117,146 in 2000 to $422,728 in 2017. Meanwhile, the median household income in gentrified tracts rose from $35,683 to $48,630, just a 36.3% increase. On average, median home value growth in gentrified tracts outpaced income growth by 3.7 times in metro areas across the country.
As a result, displacement, frequently occurring along racial lines, is taking place in many of the cities where neighborhoods are gentrifying the fastest. In New Orleans, for example, the share of white residents in neighborhoods that would qualify as “gentrified” rose from 9.1% in 2000 to 28.1% in 2017. Meanwhile, the share of African American residents in those neighborhoods fell from 86.8% to 62.0%. Other gentrifying metro areas with a large degree of measurable displacement on this list include New York, Charleston, and Washington, D.C.
While the starkest examples of gentrification often occur as a byproduct of revitalization efforts in the downtowns of major U.S. cities, the process is far from uniform. In cities such as Boston and Washington, D.C., gentrification is taking place both in the city center and in the outlying suburbs. In Baltimore and Philadelphia, the process is mostly occurring in economically disadvantaged tracts in the city center.
Meanwhile, gentrification is largely occurring away from the city center in smaller cities such as Brownsville and McAllen, Texas, which also rank as some of the poorest cities in the country. Here is a full list of America’s poorest cities.
Methodology
To determine the cities where neighborhoods are gentrifying the fastest, 24/7 Wall St. reviewed the change in home value and college attainment rate in neighborhoods using census-tract-level data from the U.S. Census Bureau. We ranked metropolitan areas based on the share of the population living in “gentrified” census tracts in 2017. To be considered gentrified, a census tract must have been in the bottom 40th percentile for median home value and median household income relative to all tracts in its respective metro area in 2000, and it must have experienced an increase in both median home value and the percent of adults with a college degree from 2000 to 2017 in the top 40th percentile of all tracts in the metro area. The gentrified tract must have also experienced an increase in median household income of any magnitude. Only census tracts with at least 500 people in metro areas with at least 250,000 people as of 2000 were considered in the analysis.
Data for the year 2000 came from the 2000 decennial census of the U.S. Census Bureau, while data for the year 2017 came from the Census Bureau’s American Community Survey and are five-year estimates for the years 2013 to 2017. Data on median household income, median home value, and gross rents from 2000 were adjusted for inflation using the Consumer Price Index research series using current methods (CPI-U-RS) for all items from the Bureau of Labor Statistics. Census tract data from 2000 were interpolated to 2010 census tract boundaries based on shapefile overlays. Metro area aggregates for 2000 were calculated from county-level data according to the Office of Management and Budget’s 2017 metro area definitions.
Sponsored: Attention Savvy Investors: Speak to 3 Financial Experts – FREE
Ever wanted an extra set of eyes on an investment you’re considering? Now you can speak with up to 3 financial experts in your area for FREE. By simply
clicking here you can begin to match with financial professionals who can help guide you through the financial decisions you’re making. And the best part? The first conversation with them is free.
Click here to match with up to 3 financial pros who would be excited to help you make financial decisions.