
Median household income in the United States hit an all time high in 2018, according to data from the U.S. Census Bureau’s American Community Survey. The recently-released data shows that the typical American household now has an income of $61,937 a year, up slightly from $61,423 in 2017. Over the same period, the poverty rate nationwide also improved, from 13.4% to 13.1%.
The slight uptick in median household income at the national level does not paint a complete picture, however. Only 14 states reported a statistically significant increase in median household income — and in one state, Maine, the median household income actually declined by a statistically significant amount. For context, there was a statistically significant increase in median household income in nearly half of all states between 2016 and 2017.
Income levels vary widely across the country. In some states, the majority of households live on less than $50,000 a year. Meanwhile, in a number of other states, most households earn at least $75,000 annually. 24/7 Wall St. reviewed recently released 2018 ACS median household income data identify America’s richest and poorest states. The share of adults 25 and over with a bachelor’s degree and the share of the population living below the poverty line also came from the 2018 ACS. We also reviewed annual average unemployment data from the Bureau of Labor Statistics for 2018 and 2017.
The national increase in median household income is likely partially attributable to the strengthening job market. Nationwide, the unemployment rate fell from 4.4% in 2017 to 3.9% in 2018. The average annual unemployment rate climbed in only three states — Oregon, West Virginia, and Colorado — between 2017 and 2018. While lower-income states do not necessarily have weaker job markets than many of the wealthier states, the availability of jobs can have a considerable impact on median income in a given area. Here is a look at the states where it is hardest to find full-time work.
Educational attainment is one of the strongest predictors of income, as workers with more education are more likely to have high-paying, secure jobs. Nationwide, the typical college graduate earns $54,628 a year, more than double the median earnings of $24,530 for those who did not graduate high school.
Not surprisingly, the states with the highest median incomes also tend to be home to a larger share of college-educated adults than the nationwide share of 32.6% — and many of the wealthiest states are also among the best educated. Here is a full list of America’s most and least educated states.
Click here to see America’s richest and poorest states

Source: Davel5957 / Getty Images
1. Maryland
> Median household income: $83,242 (2018); $82,747 (2017)
> Bachelor’s degree attainment: 40.8% (2018); 39.7% (2017)
> Poverty rate: 9.0% (2018); 9.3% (2017)
> Unemployment: 3.9% (2018); 4.3% (2017)
See all stories featuring: Maryland
[in-text-ad]

Source: bluebeat76 / Getty Images
2. New Jersey
> Median household income: $81,740 (2018); $81,763 (2017)
> Bachelor’s degree attainment: 40.8% (2018); 39.7% (2017)
> Poverty rate: 9.5% (2018); 10.0% (2017)
> Unemployment: 4.1% (2018); 4.6% (2017)
See all stories featuring: New Jersey

Source: maximkabb / Getty Images
3. Hawaii
> Median household income: $80,212 (2018); $79,648 (2017)
> Bachelor’s degree attainment: 33.5% (2018); 32.9% (2017)
> Poverty rate: 8.8% (2018); 9.5% (2017)
> Unemployment: 2.4% (2018); 2.4% (2017)
See all stories featuring: Hawaii

Source: SeanPavonePhoto / Getty Images
4. Massachusetts
> Median household income: $79,835 (2018); $79,371 (2017)
> Bachelor’s degree attainment: 44.5% (2018); 43.4% (2017)
> Poverty rate: 10.0% (2018); 10.5% (2017)
> Unemployment: 3.3% (2018); 3.8% (2017)
See all stories featuring: Massachusetts
[in-text-ad-2]

Source: DenisTangneyJr / Getty Images
5. Connecticut
> Median household income: $76,348 (2018); $75,947 (2017)
> Bachelor’s degree attainment: 39.6% (2018); 38.7% (2017)
> Poverty rate: 10.4% (2018); 9.6% (2017)
> Unemployment: 4.1% (2018); 4.7% (2017)
See all stories featuring: Connecticut

Source: choness / Getty Images
6. California
> Median household income: $75,277 (2018); $73,513 (2017)
> Bachelor’s degree attainment: 34.2% (2018); 33.6% (2017)
> Poverty rate: 12.8% (2018); 13.3% (2017)
> Unemployment: 4.2% (2018); 4.8% (2017)
See all stories featuring: California
[in-text-ad]

Source: Sean Pavone / Getty Images
7. New Hampshire
> Median household income: $74,991 (2018); $75,051 (2017)
> Bachelor’s degree attainment: 36.8% (2018); 36.9% (2017)
> Poverty rate: 7.6% (2018); 7.7% (2017)
> Unemployment: 2.5% (2018); 2.7% (2017)
See all stories featuring: New Hampshire

Source: AngelSchwai / Getty Images
8. Alaska
> Median household income: $74,346 (2018); $75,092 (2017)
> Bachelor’s degree attainment: 30.2% (2018); 28.8% (2017)
> Poverty rate: 10.9% (2018); 11.1% (2017)
> Unemployment: 6.6% (2018); 7.0% (2017)
See all stories featuring: Alaska

Source: RomanKhomlyak / Getty Images
9. Washington
> Median household income: $74,073 (2018); $72,591 (2017)
> Bachelor’s degree attainment: 36.7% (2018); 35.5% (2017)
> Poverty rate: 10.3% (2018); 11.0% (2017)
> Unemployment: 4.5% (2018); 4.7% (2017)
See all stories featuring: Washington
[in-text-ad-2]

Source: Sean Pavone / Getty Images
10. Virginia
> Median household income: $72,577 (2018); $73,155 (2017)
> Bachelor’s degree attainment: 39.3% (2018); 38.7% (2017)
> Poverty rate: 10.7% (2018); 10.6% (2017)
> Unemployment: 3.0% (2018); 3.7% (2017)
See all stories featuring: Virginia

Source: juliannafunk / Getty Images
11. Colorado
> Median household income: $71,953 (2018); $70,676 (2017)
> Bachelor’s degree attainment: 41.7% (2018); 41.2% (2017)
> Poverty rate: 9.6% (2018); 10.3% (2017)
> Unemployment: 3.3% (2018); 2.7% (2017)
See all stories featuring: Colorado
[in-text-ad]

Source: Adventure_Photo / Getty Images
12. Utah
> Median household income: $71,414 (2018); $69,917 (2017)
> Bachelor’s degree attainment: 34.9% (2018); 34.6% (2017)
> Poverty rate: 9.0% (2018); 9.7% (2017)
> Unemployment: 3.1% (2018); 3.3% (2017)
See all stories featuring: Utah

Source: Scruggelgreen / Getty Images
13. Minnesota
> Median household income: $70,315 (2018); $70,049 (2017)
> Bachelor’s degree attainment: 36.7% (2018); 36.1% (2017)
> Poverty rate: 9.6% (2018); 9.5% (2017)
> Unemployment: 2.9% (2018); 3.4% (2017)
See all stories featuring: Minnesota

Source: Ultima_Gaina / Getty Images
14. New York
> Median household income: $67,844 (2018); $66,201 (2017)
> Bachelor’s degree attainment: 37.2% (2018); 36.0% (2017)
> Poverty rate: 13.6% (2018); 14.1% (2017)
> Unemployment: 4.1% (2018); 4.7% (2017)
See all stories featuring: New York
[in-text-ad-2]

Source: RudyBalasko / Getty Images
15. Illinois
> Median household income: $65,030 (2018); $64,493 (2017)
> Bachelor’s degree attainment: 35.1% (2018); 34.4% (2017)
> Poverty rate: 12.1% (2018); 12.6% (2017)
> Unemployment: 4.3% (2018); 4.9% (2017)
See all stories featuring: Illinois

Source: mdgmorris / Getty Images
16. Delaware
> Median household income: $64,805 (2018); N/A (2017)
> Bachelor’s degree attainment: 31.3% (2018); 31.5% (2017)
> Poverty rate: 12.5% (2018); N/A (2017)
> Unemployment: 3.8% (2018); 4.5% (2017)
See all stories featuring: Delaware
[in-text-ad]

Source: SeanPavonePhoto / Getty Images
17. Rhode Island
> Median household income: $64,340 (2018); $65,366 (2017)
> Bachelor’s degree attainment: 34.4% (2018); 33.5% (2017)
> Poverty rate: 12.9% (2018); 11.6% (2017)
> Unemployment: 4.1% (2018); 4.4% (2017)
See all stories featuring: Rhode Island
 24/7 Wall St.
Source: csfotoimages / Getty Images
18. North Dakota
> Median household income: $63,837 (2018); $63,245 (2017)
> Bachelor’s degree attainment: 29.7% (2018); 30.7% (2017)
> Poverty rate: 10.7% (2018); 10.3% (2017)
> Unemployment: 2.6% (2018); 2.7% (2017)
See all stories featuring: North Dakota

Source: 4nadia / Getty Images
19. Oregon
> Median household income: $63,426 (2018); $61,369 (2017)
> Bachelor’s degree attainment: 34.0% (2018); 33.7% (2017)
> Poverty rate: 12.6% (2018); 13.2% (2017)
> Unemployment: 4.2% (2018); 4.1% (2017)
See all stories featuring: Oregon
[in-text-ad-2]

Source: Dean_Fikar / Getty Images
20. Wyoming
> Median household income: $61,584 (2018); $61,523 (2017)
> Bachelor’s degree attainment: 26.9% (2018); 27.6% (2017)
> Poverty rate: 11.1% (2018); 11.3% (2017)
> Unemployment: 4.1% (2018); 4.2% (2017)
See all stories featuring: Wyoming

Source: SeanPavonePhoto / Getty Images
21. Pennsylvania
> Median household income: $60,905 (2018); $60,460 (2017)
> Bachelor’s degree attainment: 31.8% (2018); 31.4% (2017)
> Poverty rate: 12.2% (2018); 12.5% (2017)
> Unemployment: 4.3% (2018); 4.9% (2017)
See all stories featuring: Pennsylvania
[in-text-ad]

Source: Sean Pavone / iStock
22. Vermont
> Median household income: $60,782 (2018); $59,028 (2017)
> Bachelor’s degree attainment: 38.7% (2018); 38.3% (2017)
> Poverty rate: 11.0% (2018); 11.3% (2017)
> Unemployment: 2.7% (2018); 3.0% (2017)
See all stories featuring: Vermont

Source: Sean Pavone / Getty Images
23. Wisconsin
> Median household income: $60,773 (2018); $60,552 (2017)
> Bachelor’s degree attainment: 30.0% (2018); 30.4% (2017)
> Poverty rate: 11.0% (2018); 11.3% (2017)
> Unemployment: 3.0% (2018); 3.3% (2017)
See all stories featuring: Wisconsin

Source: RoschetzkyIstockPhoto / Getty Images
24. Texas
> Median household income: $60,629 (2018); $60,416 (2017)
> Bachelor’s degree attainment: 30.3% (2018); 29.6% (2017)
> Poverty rate: 14.9% (2018); 14.7% (2017)
> Unemployment: 3.9% (2018); 4.3% (2017)
See all stories featuring: Texas
[in-text-ad-2]

Source: JoeChristensen / Getty Images
25. Iowa
> Median household income: $59,955 (2018); $60,002 (2017)
> Bachelor’s degree attainment: 29.0% (2018); 28.9% (2017)
> Poverty rate: 11.2% (2018); 10.7% (2017)
> Unemployment: 2.5% (2018); 3.1% (2017)
See all stories featuring: Iowa

Source: DenisTangneyJr / Getty Images
26. Nebraska
> Median household income: $59,566 (2018); $60,847 (2017)
> Bachelor’s degree attainment: 32.4% (2018); 31.7% (2017)
> Poverty rate: 11.0% (2018); 10.8% (2017)
> Unemployment: 2.8% (2018); 2.9% (2017)
See all stories featuring: Nebraska
[in-text-ad]

Source: Sean Pavone / Getty Images
27. Arizona
> Median household income: $59,246 (2018); $57,884 (2017)
> Bachelor’s degree attainment: 29.7% (2018); 29.4% (2017)
> Poverty rate: 14.0% (2018); 14.9% (2017)
> Unemployment: 4.8% (2018); 4.9% (2017)
See all stories featuring: Arizona
 24/7 Wall St.
Source: ferrantraite / Getty Images
28. Georgia
> Median household income: $58,756 (2018); $57,322 (2017)
> Bachelor’s degree attainment: 31.9% (2018); 30.9% (2017)
> Poverty rate: 14.3% (2018); 14.9% (2017)
> Unemployment: 3.9% (2018); 4.7% (2017)
See all stories featuring: Georgia

Source: f11photo / Getty Images
29. Nevada
> Median household income: $58,646 (2018); $59,340 (2017)
> Bachelor’s degree attainment: 24.9% (2018); 24.9% (2017)
> Poverty rate: 12.9% (2018); 13.0% (2017)
> Unemployment: 4.6% (2018); 5.1% (2017)
See all stories featuring: Nevada
[in-text-ad-2]

Source: ricardoreitmeyer / Getty Images
30. Kansas
> Median household income: $58,218 (2018); $57,652 (2017)
> Bachelor’s degree attainment: 33.8% (2018); 33.7% (2017)
> Poverty rate: 12.0% (2018); 11.9% (2017)
> Unemployment: 3.4% (2018); 3.7% (2017)
See all stories featuring: Kansas
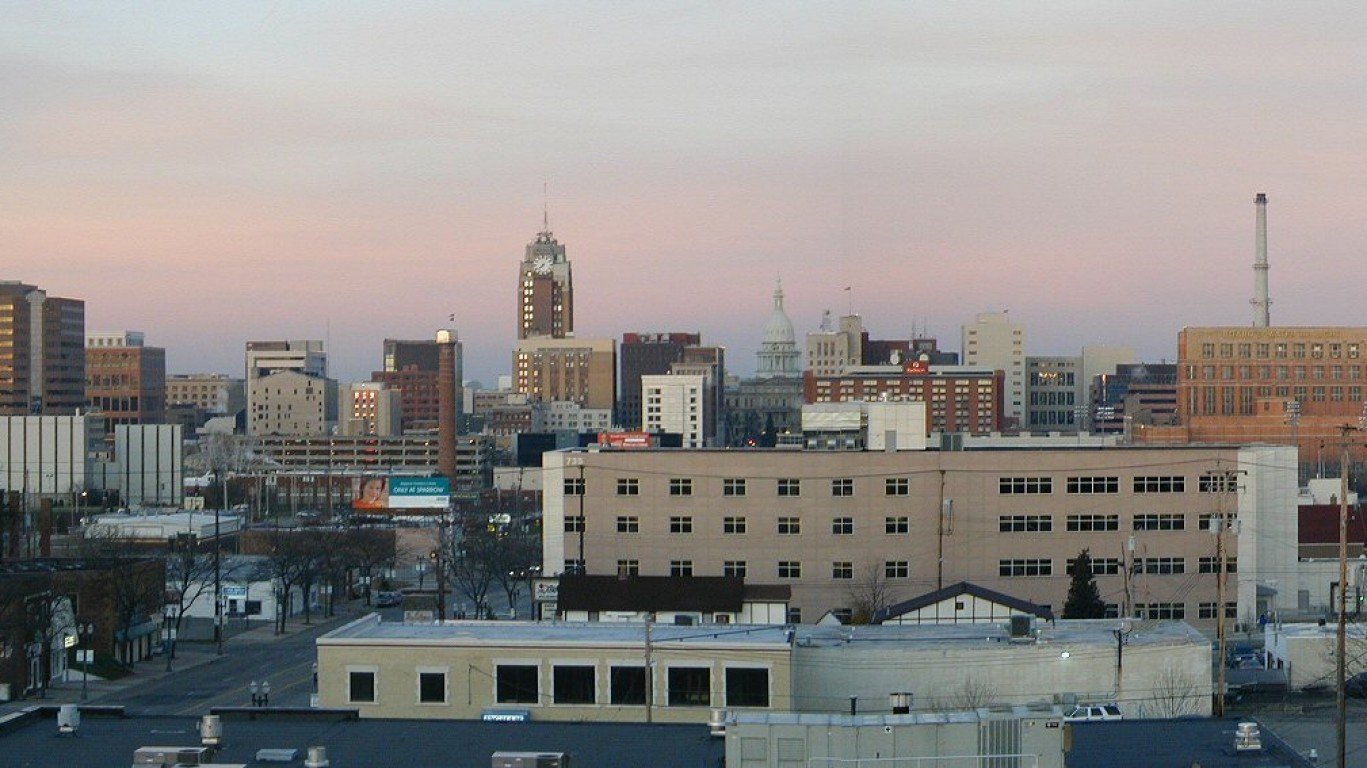
Source: User Criticalthinker on en.wikipedia / Wikimedia Commons
31. Michigan
> Median household income: $56,697 (2018); $56,081 (2017)
> Bachelor’s degree attainment: 29.6% (2018); 29.1% (2017)
> Poverty rate: 14.1% (2018); 14.2% (2017)
> Unemployment: 4.1% (2018); 4.6% (2017)
See all stories featuring: Michigan
[in-text-ad]

Source: KenCanning / Getty Images
32. South Dakota
> Median household income: $56,274 (2018); $57,613 (2017)
> Bachelor’s degree attainment: 29.2% (2018); 28.1% (2017)
> Poverty rate: 13.1% (2018); 13.0% (2017)
> Unemployment: 3.0% (2018); 3.2% (2017)
See all stories featuring: South Dakota

Source: Sean Pavone / Getty Images
33. Ohio
> Median household income: $56,111 (2018); $55,236 (2017)
> Bachelor’s degree attainment: 29.0% (2018); 28.0% (2017)
> Poverty rate: 13.9% (2018); 14.0% (2017)
> Unemployment: 4.6% (2018); 5.0% (2017)
See all stories featuring: Ohio

Source: f11photo / Getty Images
34. Indiana
> Median household income: $55,746 (2018); $55,368 (2017)
> Bachelor’s degree attainment: 27.1% (2018); 26.8% (2017)
> Poverty rate: 13.1% (2018); 13.5% (2017)
> Unemployment: 3.4% (2018); 3.6% (2017)
See all stories featuring: Indiana
[in-text-ad-2]

Source: rickberk / iStock
35. Maine
> Median household income: $55,602 (2018); $57,486 (2017)
> Bachelor’s degree attainment: 31.5% (2018); 32.1% (2017)
> Poverty rate: 11.6% (2018); 11.1% (2017)
> Unemployment: 3.4% (2018); 3.4% (2017)
See all stories featuring: Maine

Source: mattalberts / Getty Images
36. Idaho
> Median household income: $55,583 (2018); $53,392 (2017)
> Bachelor’s degree attainment: 27.7% (2018); 26.8% (2017)
> Poverty rate: 11.8% (2018); 12.8% (2017)
> Unemployment: 2.8% (2018); 3.2% (2017)
See all stories featuring: Idaho
[in-text-ad]

Source: Sean Pavone / Getty Images
37. Florida
> Median household income: $55,462 (2018); $53,945 (2017)
> Bachelor’s degree attainment: 30.4% (2018); 29.7% (2017)
> Poverty rate: 13.6% (2018); 14.0% (2017)
> Unemployment: 3.6% (2018); 4.2% (2017)
See all stories featuring: Florida

Source: Gary Tognoni / Getty Images
38. Montana
> Median household income: $55,328 (2018); $54,643 (2017)
> Bachelor’s degree attainment: 31.7% (2018); 32.3% (2017)
> Poverty rate: 13.0% (2018); 12.5% (2017)
> Unemployment: 3.7% (2018); 3.9% (2017)
See all stories featuring: Montana

Source: f11photo / Getty Images
39. Missouri
> Median household income: $54,478 (2018); $54,910 (2017)
> Bachelor’s degree attainment: 29.5% (2018); 29.1% (2017)
> Poverty rate: 13.2% (2018); 13.4% (2017)
> Unemployment: 3.2% (2018); 3.8% (2017)
See all stories featuring: Missouri
[in-text-ad-2]

Source: SeanPavonePhoto / Getty Images
40. North Carolina
> Median household income: $53,855 (2018); $53,951 (2017)
> Bachelor’s degree attainment: 31.9% (2018); 31.3% (2017)
> Poverty rate: 14.0% (2018); 14.7% (2017)
> Unemployment: 3.9% (2018); 4.5% (2017)
See all stories featuring: North Carolina

Source: Imilious / Wikimedia Commons
41. Tennessee
> Median household income: $52,375 (2018); $52,201 (2017)
> Bachelor’s degree attainment: 27.5% (2018); 27.3% (2017)
> Poverty rate: 15.3% (2018); 15.0% (2017)
> Unemployment: 3.5% (2018); 3.8% (2017)
See all stories featuring: Tennessee
[in-text-ad]

Source: traveler1116 / Getty Images
42. South Carolina
> Median household income: $52,306 (2018); $51,396 (2017)
> Bachelor’s degree attainment: 28.3% (2018); 28.0% (2017)
> Poverty rate: 15.3% (2018); 15.4% (2017)
> Unemployment: 3.4% (2018); 4.3% (2017)
See all stories featuring: South Carolina
 24/7 Wall St.
Source: Majestic_Aerials / Getty Images
43. Oklahoma
> Median household income: $51,924 (2018); $50,839 (2017)
> Bachelor’s degree attainment: 25.6% (2018); 25.5% (2017)
> Poverty rate: 15.6% (2018); 15.8% (2017)
> Unemployment: 3.4% (2018); 4.2% (2017)
See all stories featuring: Oklahoma

Source: Davel5957 / Getty Images
44. Kentucky
> Median household income: $50,247 (2018); $49,437 (2017)
> Bachelor’s degree attainment: 24.8% (2018); 24.0% (2017)
> Poverty rate: 16.9% (2018); 17.2% (2017)
> Unemployment: 4.3% (2018); 4.9% (2017)
See all stories featuring: Kentucky
[in-text-ad-2]

Source: RobHainer / Getty Images
45. Alabama
> Median household income: $49,861 (2018); $49,249 (2017)
> Bachelor’s degree attainment: 25.5% (2018); 25.5% (2017)
> Poverty rate: 16.8% (2018); 16.9% (2017)
> Unemployment: 3.9% (2018); 4.4% (2017)
See all stories featuring: Alabama

Source: f11photo / Getty Images
46. Louisiana
> Median household income: $47,905 (2018); $47,050 (2017)
> Bachelor’s degree attainment: 24.3% (2018); 23.8% (2017)
> Poverty rate: 18.6% (2018); 19.7% (2017)
> Unemployment: 4.9% (2018); 5.1% (2017)
See all stories featuring: Louisiana
[in-text-ad]

Source: ivanastar / Getty Images
47. New Mexico
> Median household income: $47,169 (2018); $47,646 (2017)
> Bachelor’s degree attainment: 27.7% (2018); 27.1% (2017)
> Poverty rate: 19.5% (2018); 19.7% (2017)
> Unemployment: 4.9% (2018); 5.9% (2017)
See all stories featuring: New Mexico

Source: Davel5957 / Getty Images
48. Arkansas
> Median household income: $47,062 (2018); $46,859 (2017)
> Bachelor’s degree attainment: 23.3% (2018); 23.4% (2017)
> Poverty rate: 17.2% (2018); 16.4% (2017)
> Unemployment: 3.7% (2018); 3.7% (2017)
See all stories featuring: Arkansas

Source: dszc / Getty Images
49. Mississippi
> Median household income: $44,717 (2018); $44,604 (2017)
> Bachelor’s degree attainment: 23.2% (2018); 21.9% (2017)
> Poverty rate: 19.7% (2018); 19.8% (2017)
> Unemployment: 4.8% (2018); 5.1% (2017)
See all stories featuring: Mississippi
[in-text-ad-2]

Source: tristanbnz / Getty Images
50. West Virginia
> Median household income: $44,097 (2018); $44,587 (2017)
> Bachelor’s degree attainment: 21.3% (2018); 20.2% (2017)
> Poverty rate: 17.8% (2018); 19.1% (2017)
> Unemployment: 5.3% (2018); 5.2% (2017)
See all stories featuring: West Virginia
Sponsored: Attention Savvy Investors: Speak to 3 Financial Experts – FREE
Ever wanted an extra set of eyes on an investment you’re considering? Now you can speak with up to 3 financial experts in your area for FREE. By simply
clicking here you can begin to match with financial professionals who can help guide you through the financial decisions you’re making. And the best part? The first conversation with them is free.
Click here to match with up to 3 financial pros who would be excited to help you make financial decisions.
Thank you for reading! Have some feedback for us?
Contact the 24/7 Wall St. editorial team.
Editors' Picks