The United States is in the midst of its longest period of job growth in history. The total number of jobs in the country has increased for 108 consecutive months, driving down the unemployment rate. When people have good, stable jobs, they have better financial security. Nationwide, certain metro areas have benefitted from these strong economic conditions more than others.
24/7 Wall St. reviewed the share of residents living in households with incomes below the poverty line in 382 U.S. metro areas with one-year data from the U.S. Census Bureau’s 2018 American Community Survey to identify the cities with the lowest poverty rates.
The metro areas with the lowest poverty rates are spread out relatively evenly across the country. There are 42 metro areas, in 22 different states and Washington D.C., with a poverty rate of 9.3% or less — well below the national 13.1% poverty rate. California has five metro areas on this list, more than any other state, while Wisconsin and Washington each have four.
It should come as no surprise that many of these cities with a low share of residents living in poverty have many other positive economic indicators, such as low unemployment. These are the cities adding the most jobs in every state.
Not all of the metro areas with the lowest poverty rates are necessarily wealthy. Some places on the West Coast — like San Jose, San Francisco, and Seattle — are home to many wealthy residents and have median annual household incomes near or above $100,000. Yet many midwestern cities on this list have low poverty rates while having median household incomes close to or below the national median. These are America’s richest and poorest states.
Click here to see cities with the lowest poverty rates.
Click here to see our methodology.

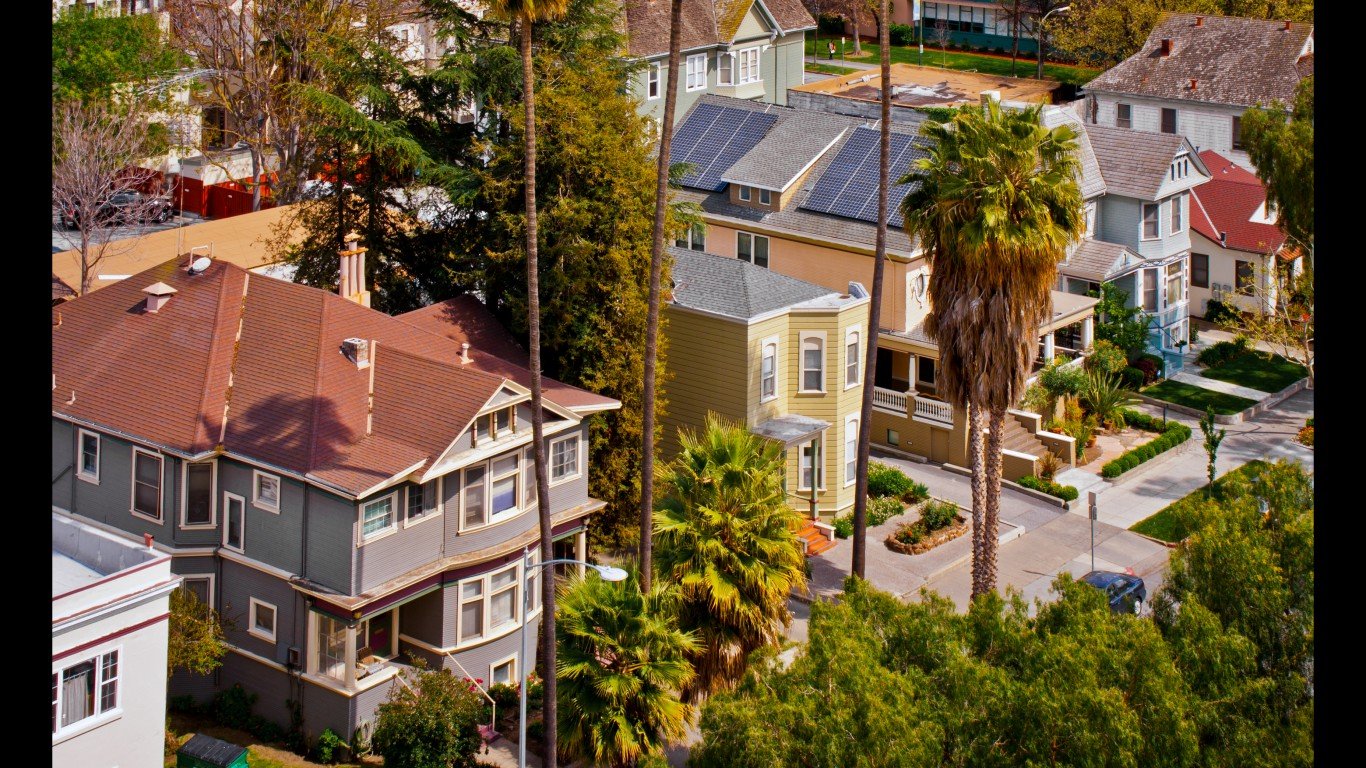
Source: AlbertPego / Getty Images
42. Bend-Redmond, OR
> Poverty rate: 9.3% (Oregon: 12.6%)
> 2018 unemployment: 4.2% (Oregon: 4.2%)
> Households receiving SNAP benefits: 10.9% (Oregon: 14.7%)
> Median household income: $67,577 (Oregon: $63,426)
[in-text-ad]

Source: DenisTangneyJr / Getty Images
41. Worcester, MA-CT
> Poverty rate: 9.3% (Massachusetts: 10.0%)
> 2018 unemployment: 3.6% (Massachusetts: 3.3%)
> Households receiving SNAP benefits: 12.3% (Massachusetts: 11.5%)
> Median household income: $70,869 (Massachusetts: $79,835)
 24/7 Wall St.
Source: JoeChristensen / Getty Images
40. Des Moines-West Des Moines, IA
> Poverty rate: 9.3% (Iowa: 11.2%)
> 2018 unemployment: 2.4% (Iowa: 2.5%)
> Households receiving SNAP benefits: 9.3% (Iowa: 9.6%)
> Median household income: $71,352 (Iowa: $59,955)
Source: Javin Weaver / Wikimedia Commons
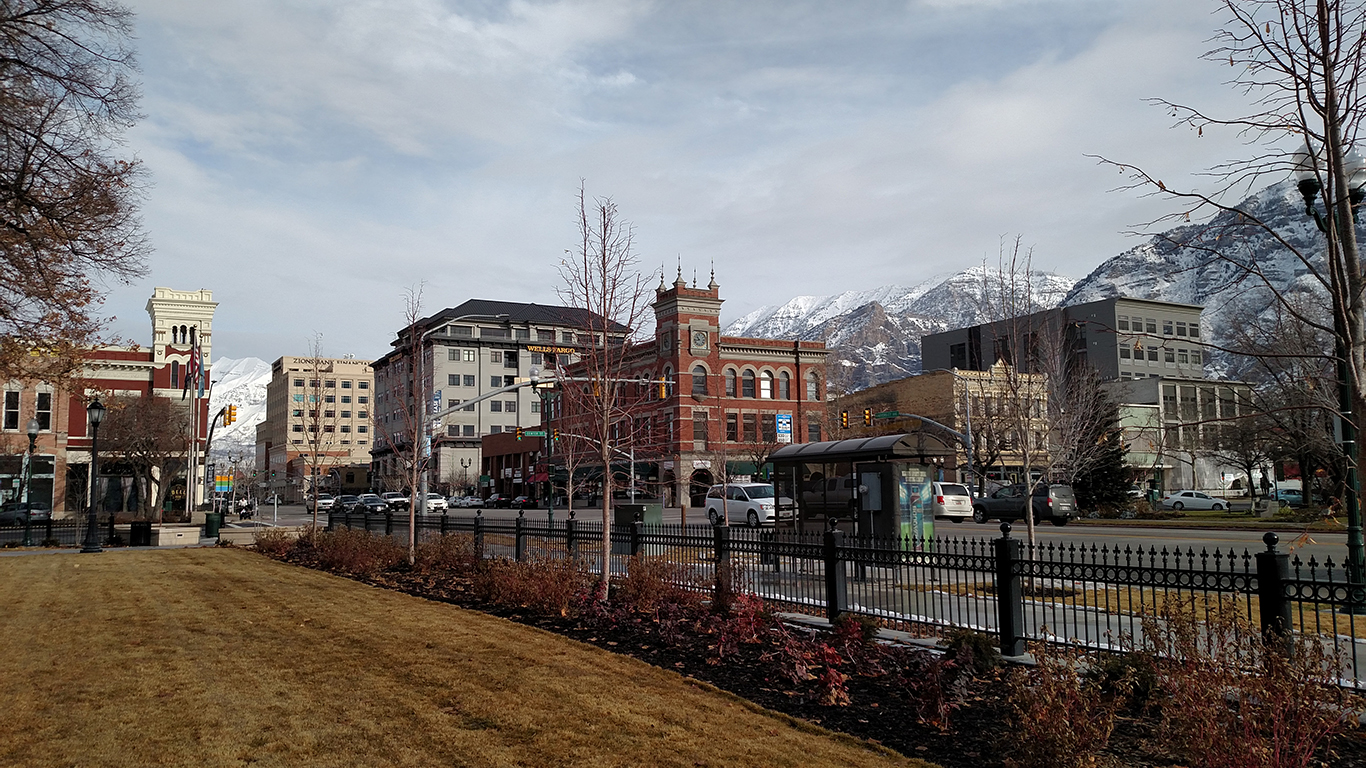
39. Provo-Orem, UT
> Poverty rate: 9.3% (Utah: 9.0%)
> 2018 unemployment: 2.8% (Utah: 3.1%)
> Households receiving SNAP benefits: 5.6% (Utah: 6.5%)
> Median household income: $75,344 (Utah: $71,414)
[in-text-ad-2]
Source: DenisTangneyJr / Getty Images
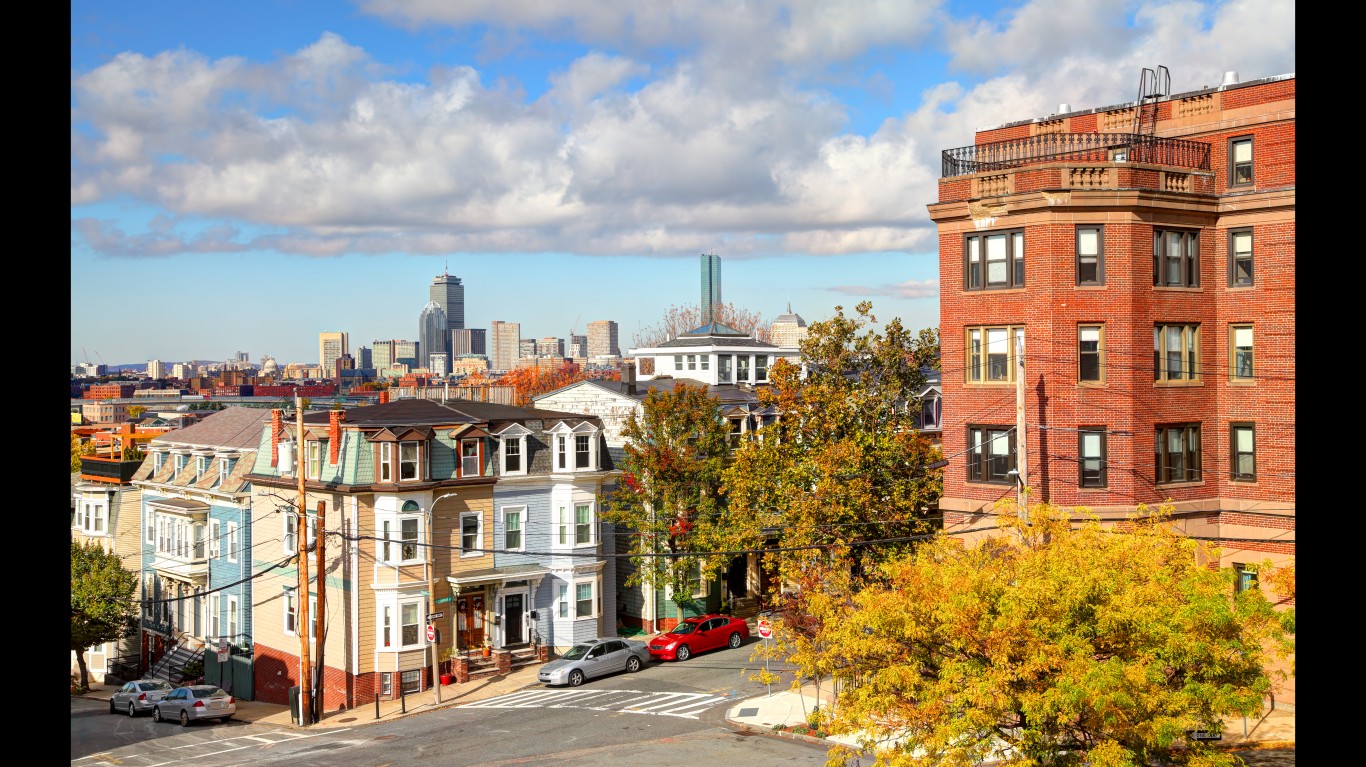
38. Boston-Cambridge-Newton, MA-NH
> Poverty rate: 9.2% (Massachusetts: 10.0%)
> 2018 unemployment: 3.0% (Massachusetts: 3.3%)
> Households receiving SNAP benefits: 9.7% (Massachusetts: 11.5%)
> Median household income: $88,711 (Massachusetts: $79,835)
Source: MasaoTaira / Getty Images
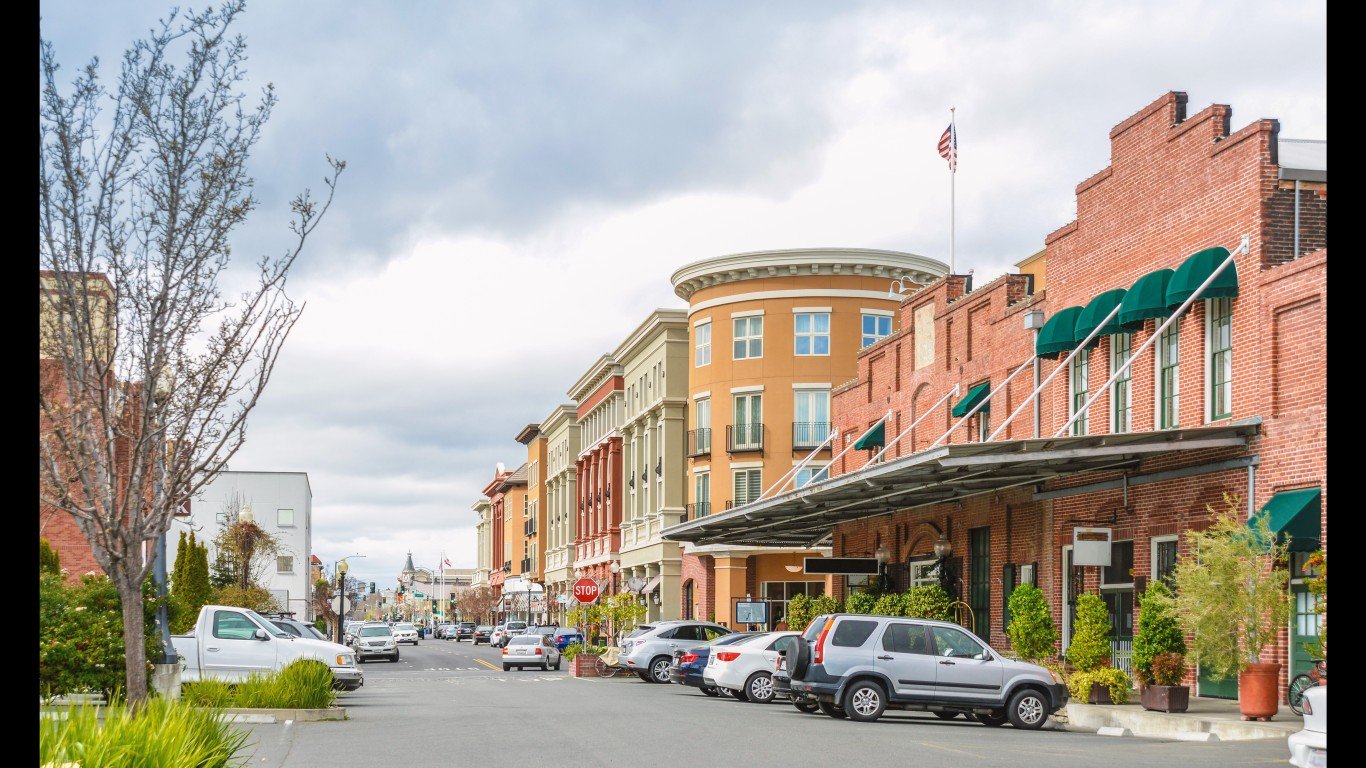
37. Napa, CA
> Poverty rate: 9.1% (California: 12.8%)
> 2018 unemployment: 2.9% (California: 4.2%)
> Households receiving SNAP benefits: 7.4% (California: 8.5%)
> Median household income: $87,025 (California: $75,277)
[in-text-ad]

Source: Tom Collins / Flickr
36. Bremerton-Silverdale, WA
> Poverty rate: 9.0% (Washington: 10.3%)
> 2018 unemployment: 4.6% (Washington: 4.5%)
> Households receiving SNAP benefits: 10.0% (Washington: 11.1%)
> Median household income: $76,945 (Washington: $74,073)

Source: dmtilley / Wikimedia Commons
35. Daphne-Fairhope-Foley, AL
> Poverty rate: 8.9% (Alabama: 16.8%)
> 2018 unemployment: 3.6% (Alabama: 3.9%)
> Households receiving SNAP benefits: 7.6% (Alabama: 13.3%)
> Median household income: $56,813 (Alabama: $49,861)
Source: KenWiedemann / Getty Images
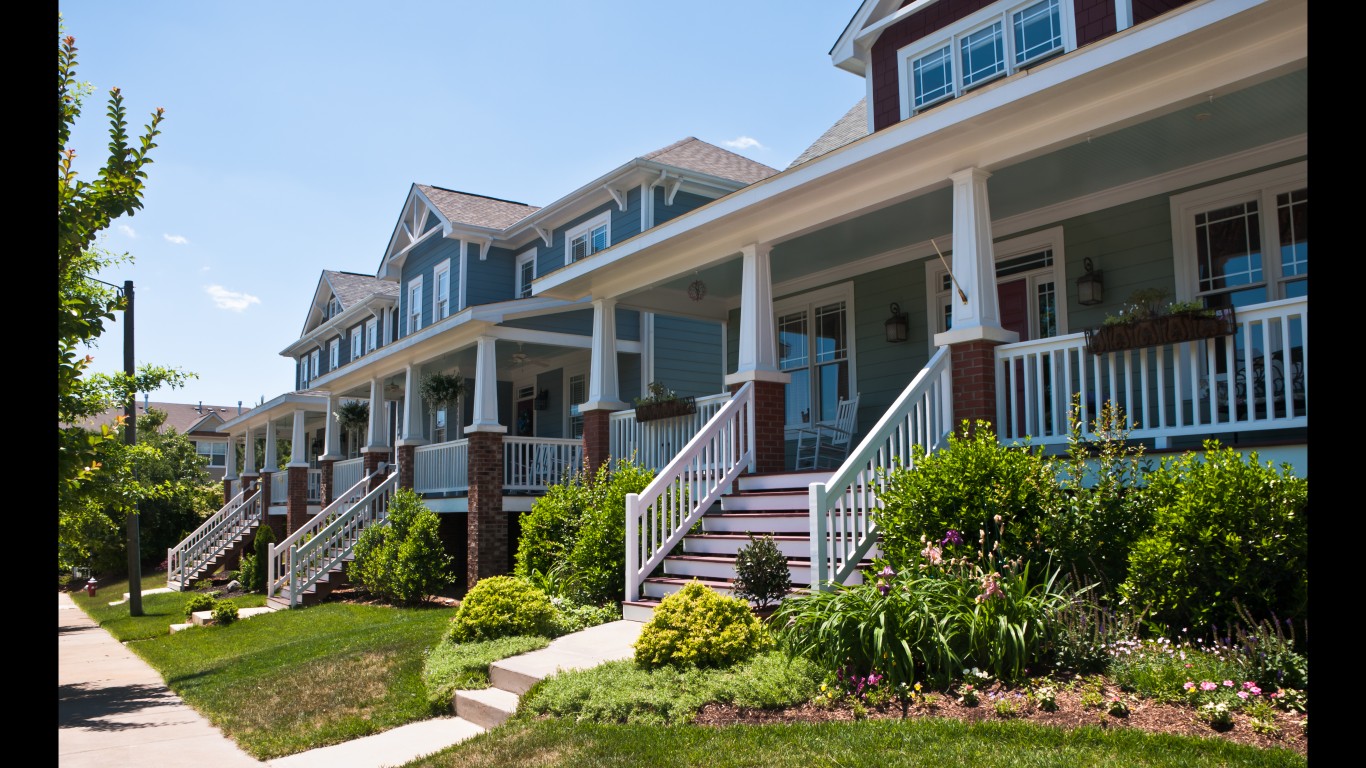
34. Raleigh, NC
> Poverty rate: 8.9% (North Carolina: 14.0%)
> 2018 unemployment: 3.4% (North Carolina: 3.9%)
> Households receiving SNAP benefits: 7.3% (North Carolina: 11.6%)
> Median household income: $75,165 (North Carolina: $53,855)
[in-text-ad-2]
Source: benedek / Getty Images
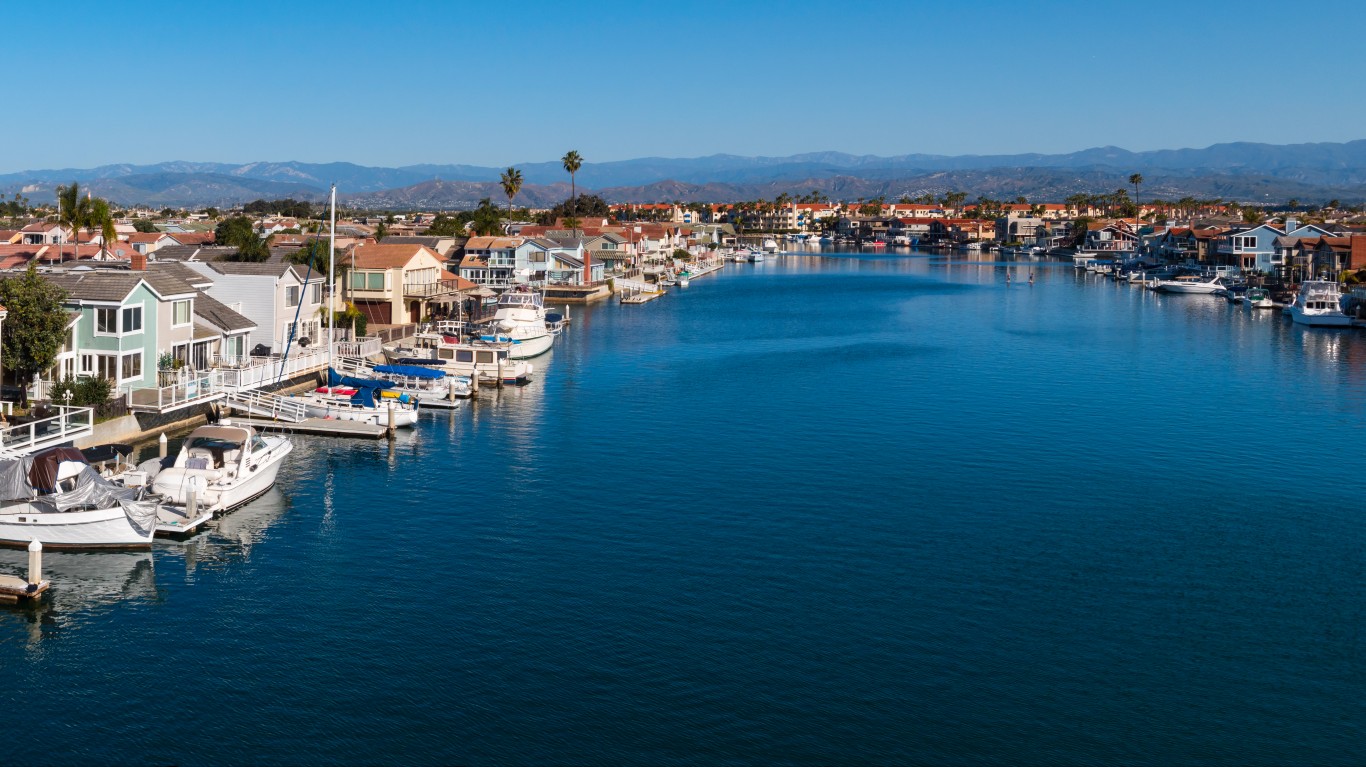
33. Oxnard-Thousand Oaks-Ventura, CA
> Poverty rate: 8.9% (California: 12.8%)
> 2018 unemployment: 3.8% (California: 4.2%)
> Households receiving SNAP benefits: 7.5% (California: 8.5%)
> Median household income: $84,566 (California: $75,277)
Source: Joe Mabel / Wikimedia Commons
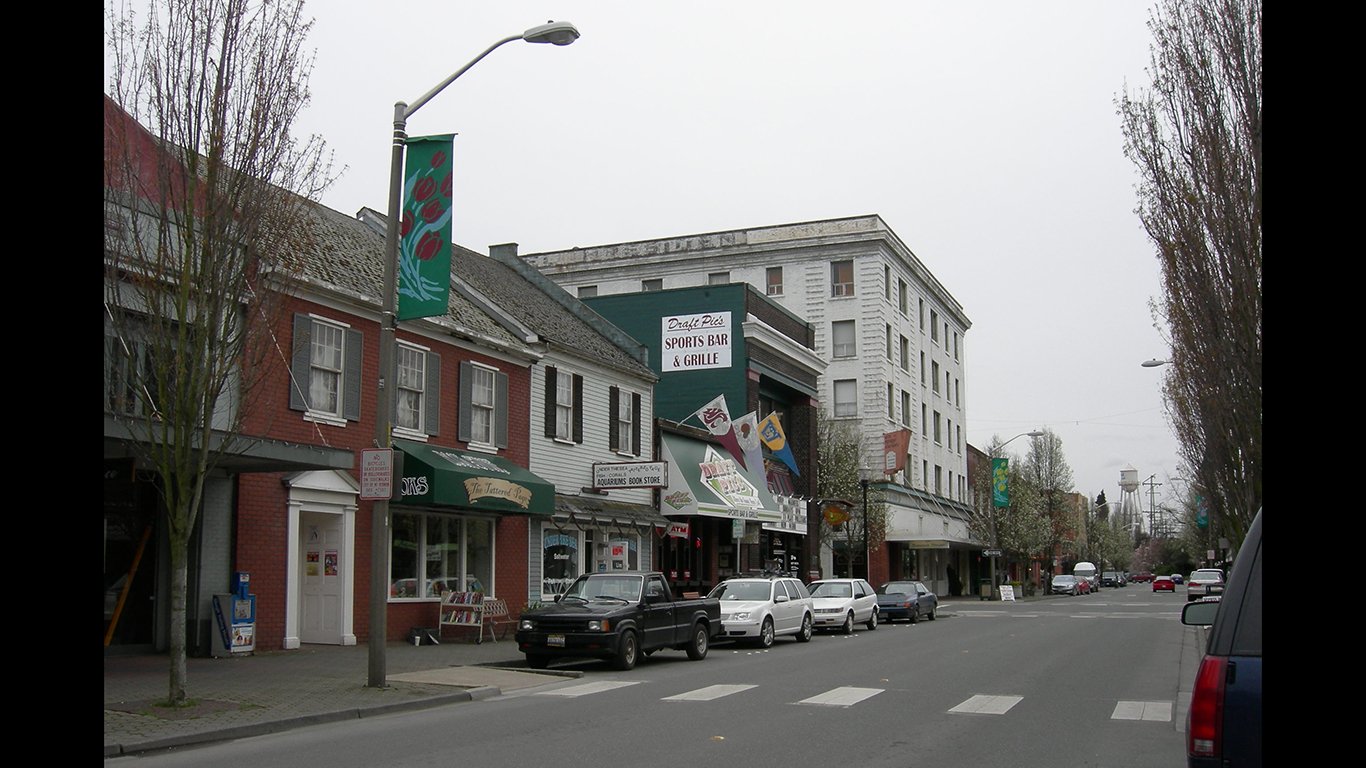
32. Mount Vernon-Anacortes, WA
> Poverty rate: 8.8% (Washington: 10.3%)
> 2018 unemployment: 5.2% (Washington: 4.5%)
> Households receiving SNAP benefits: 11.8% (Washington: 11.1%)
> Median household income: $73,206 (Washington: $74,073)
[in-text-ad]
Source: grandriver / Getty Images
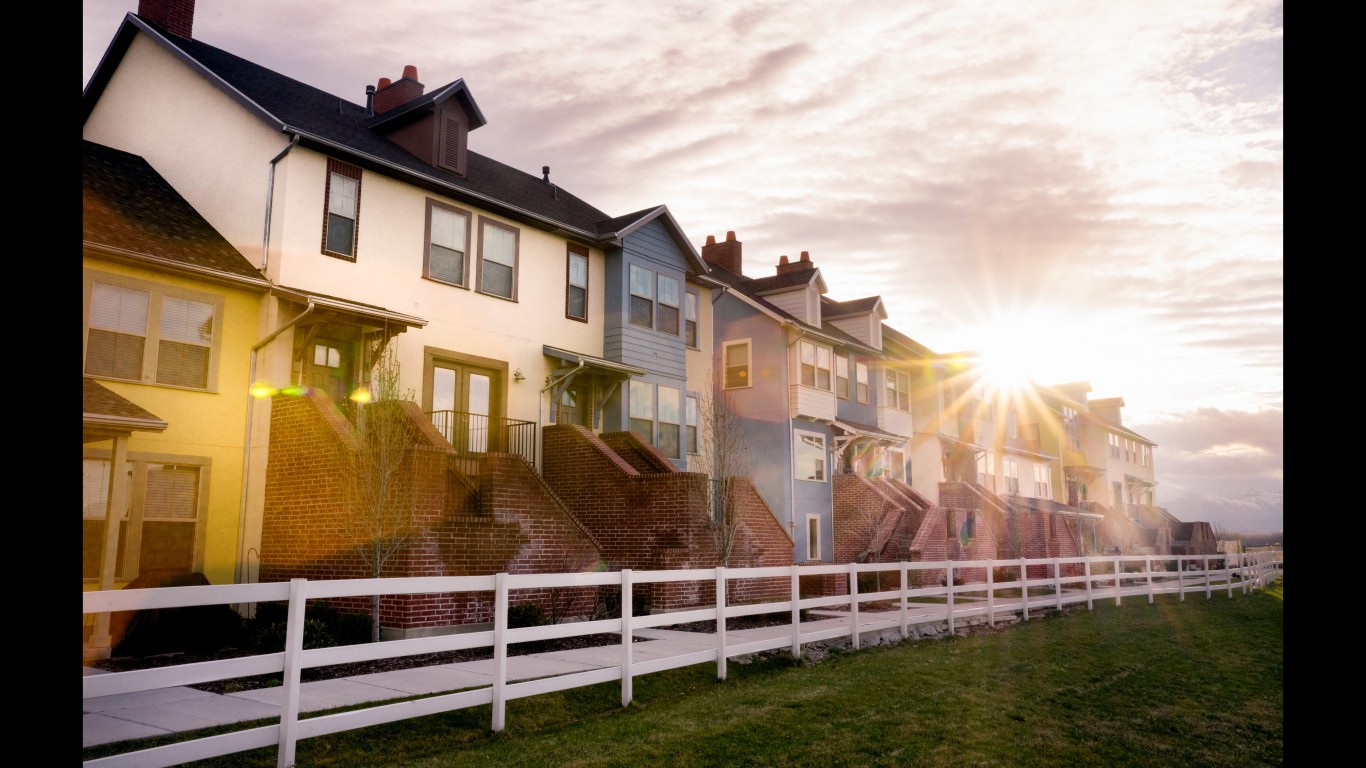
31. Salt Lake City, UT
> Poverty rate: 8.8% (Utah: 9.0%)
> 2018 unemployment: 3.0% (Utah: 3.1%)
> Households receiving SNAP benefits: 6.7% (Utah: 6.5%)
> Median household income: $73,730 (Utah: $71,414)

Source: gnagel / Getty Images
30. Jefferson City, MO
> Poverty rate: 8.7% (Missouri: 13.2%)
> 2018 unemployment: 2.7% (Missouri: 3.2%)
> Households receiving SNAP benefits: 8.0% (Missouri: 10.7%)
> Median household income: $60,281 (Missouri: $54,478)

Source: drnadig / Getty Images
29. York-Hanover, PA
> Poverty rate: 8.7% (Pennsylvania: 12.2%)
> 2018 unemployment: 3.9% (Pennsylvania: 4.3%)
> Households receiving SNAP benefits: 11.5% (Pennsylvania: 13.4%)
> Median household income: $65,239 (Pennsylvania: $60,905)
[in-text-ad-2]
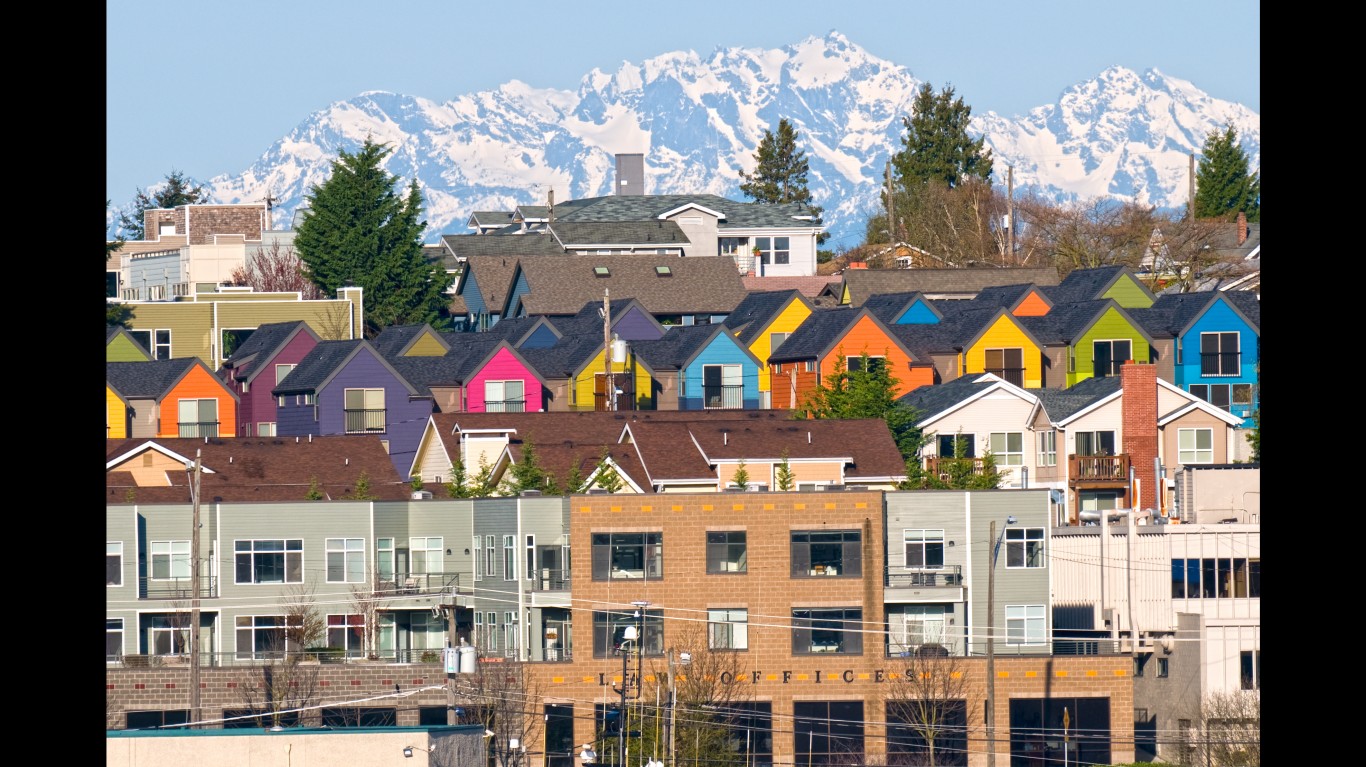
Source: PhilAugustavo / Getty Images
28. Seattle-Tacoma-Bellevue, WA
> Poverty rate: 8.7% (Washington: 10.3%)
> 2018 unemployment: 3.9% (Washington: 4.5%)
> Households receiving SNAP benefits: 8.7% (Washington: 11.1%)
> Median household income: $87,910 (Washington: $74,073)
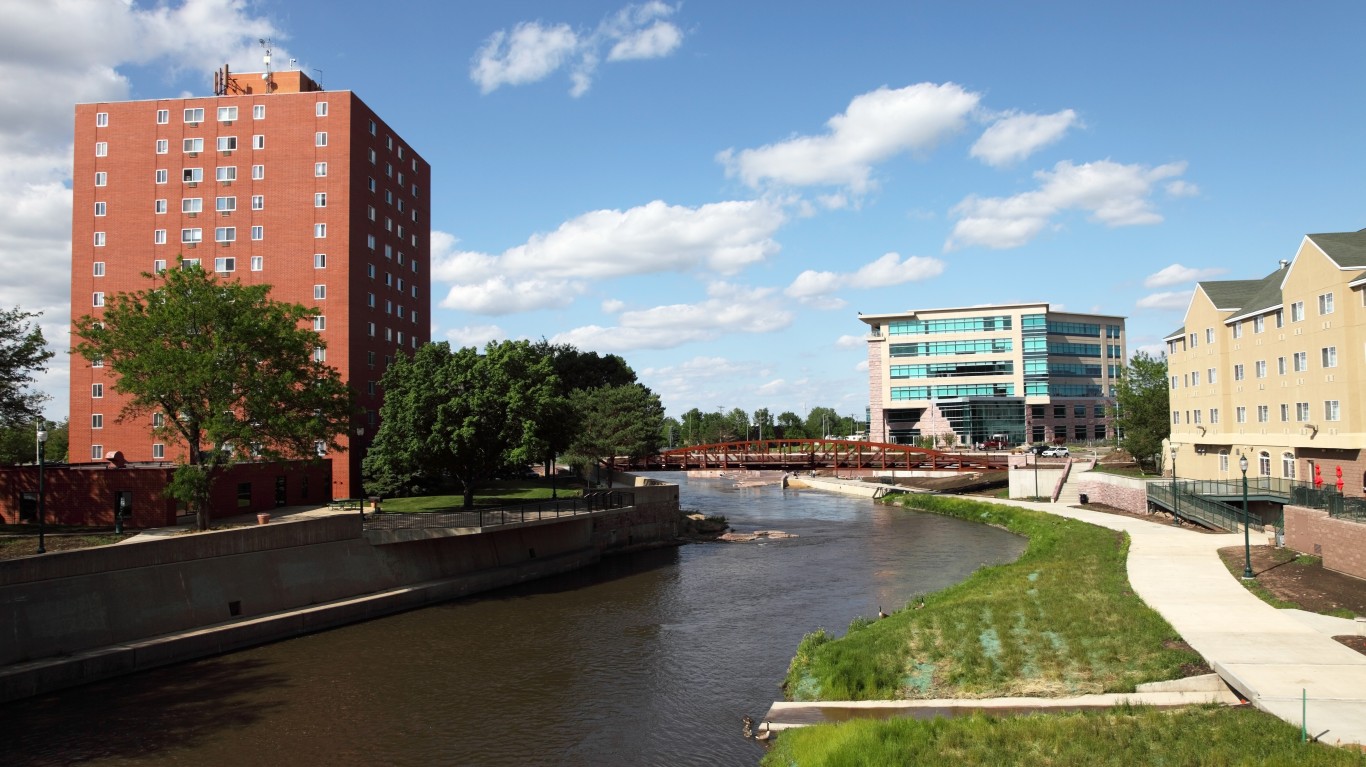
Source: DenisTangneyJr / Getty Images
27. Sioux Falls, SD
> Poverty rate: 8.6% (South Dakota: 13.1%)
> 2018 unemployment: 2.5% (South Dakota: 3.0%)
> Households receiving SNAP benefits: 8.1% (South Dakota: 8.1%)
> Median household income: $61,196 (South Dakota: $56,274)
[in-text-ad]
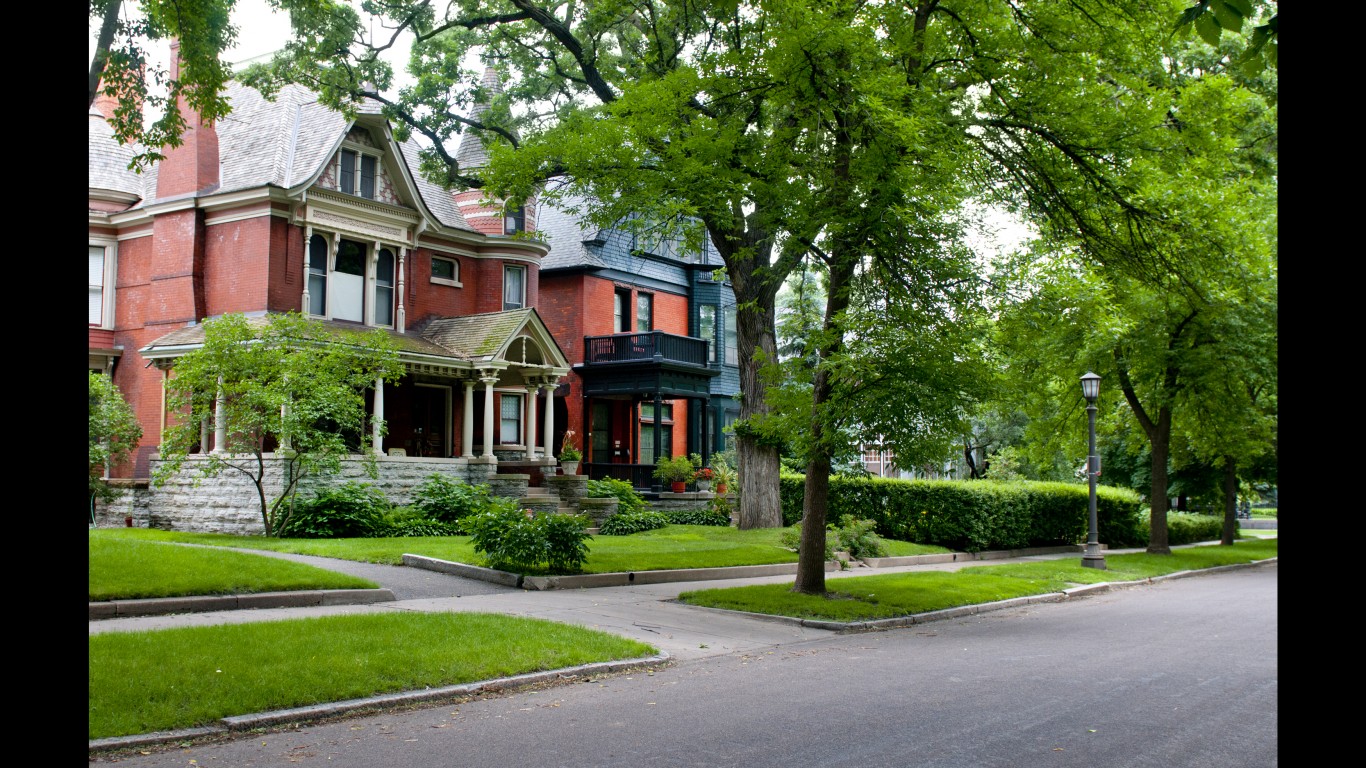
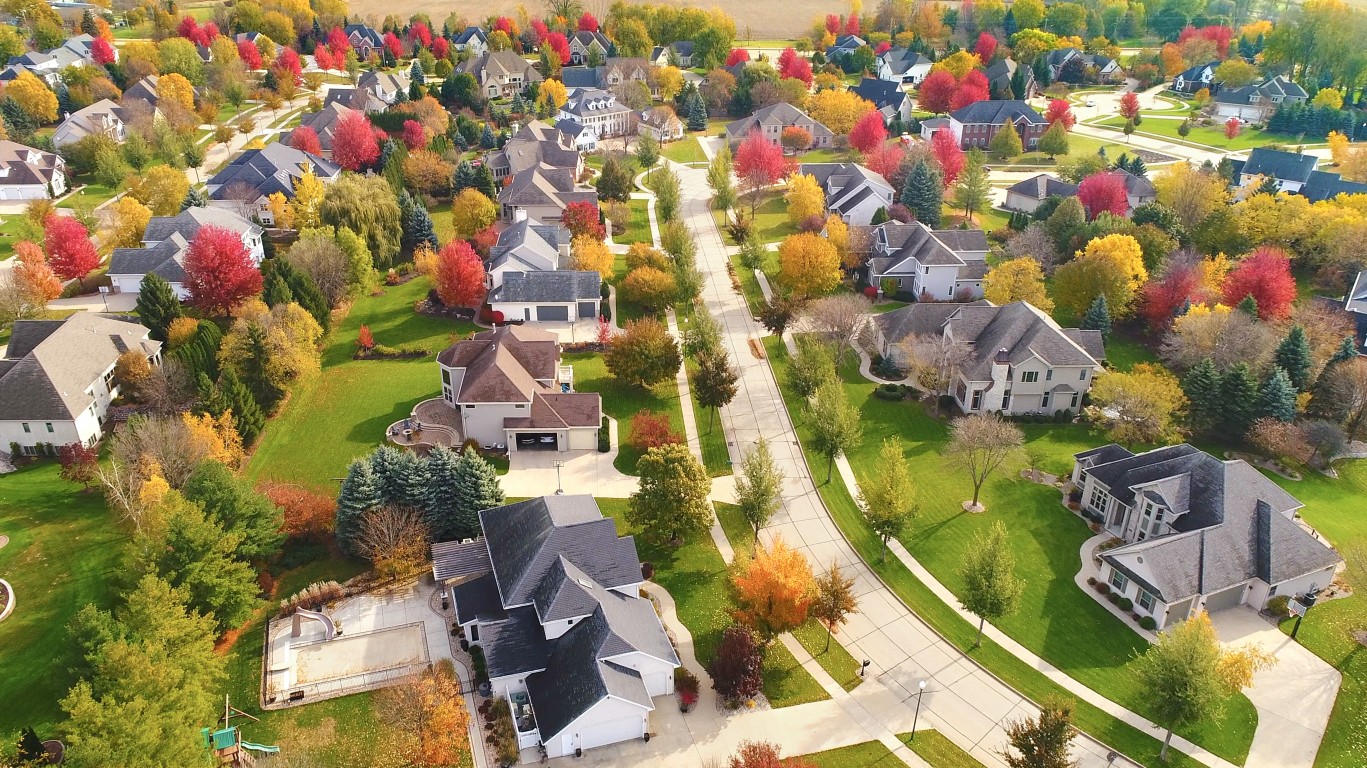
Source: JenniferPhotographyImaging / Getty Images
26. Minneapolis-St. Paul-Bloomington, MN-WI
> Poverty rate: 8.5% (Minnesota: 9.6%)
> 2018 unemployment: 2.7% (Minnesota: 2.9%)
> Households receiving SNAP benefits: 6.9% (Minnesota: 7.3%)
> Median household income: $79,578 (Minnesota: $70,315)
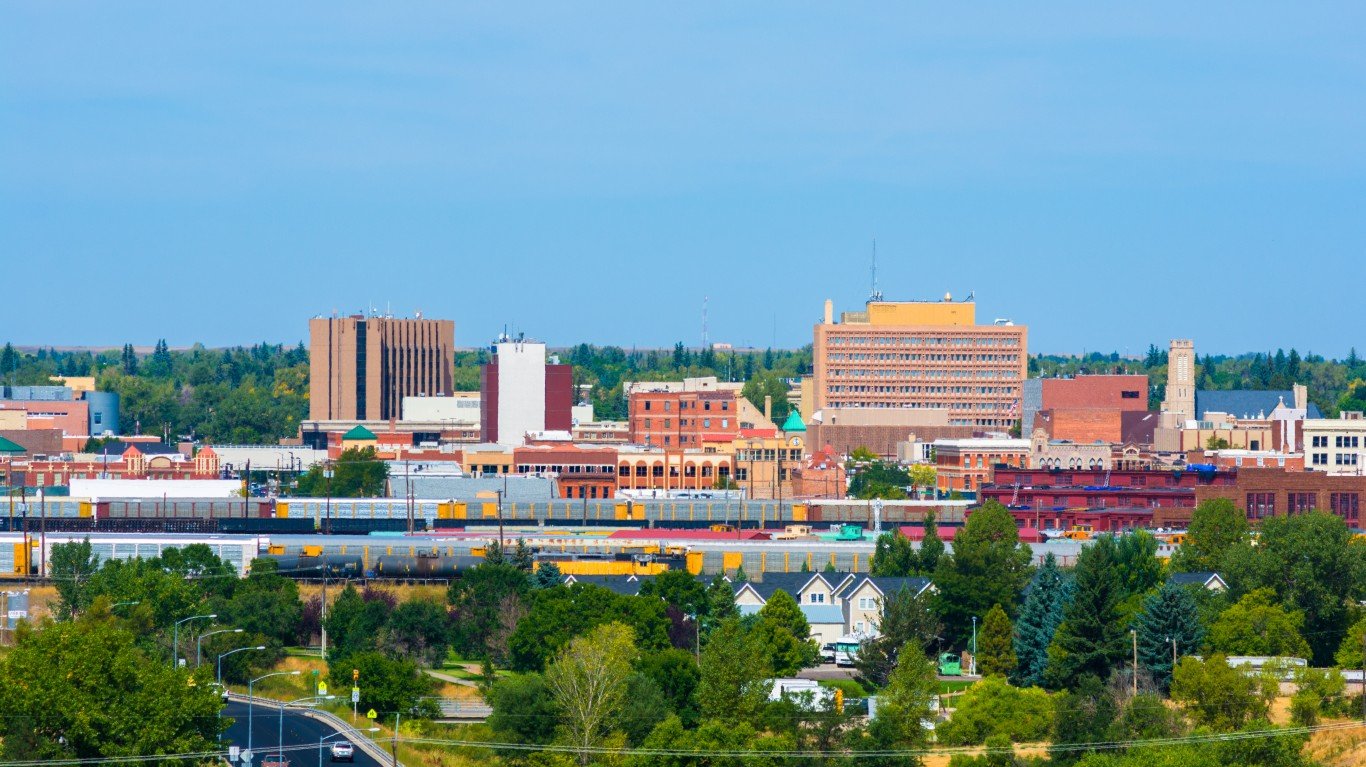
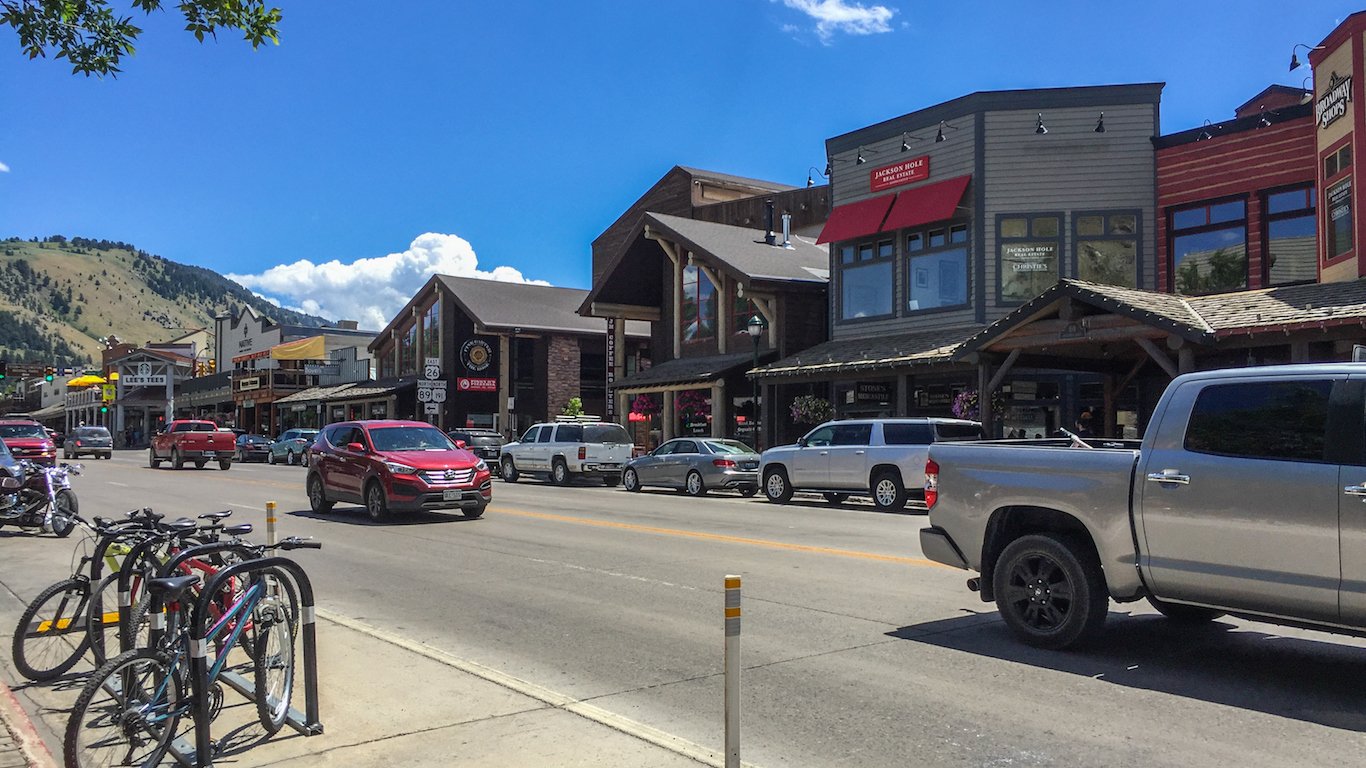
Source: Davel5957 / Getty Images
25. Cheyenne, WY
> Poverty rate: 8.4% (Wyoming: 11.1%)
> 2018 unemployment: 3.9% (Wyoming: 4.1%)
> Households receiving SNAP benefits: 7.4% (Wyoming: 5.0%)
> Median household income: $64,306 (Wyoming: $61,584)
Source: KenWiedemann / Getty Images
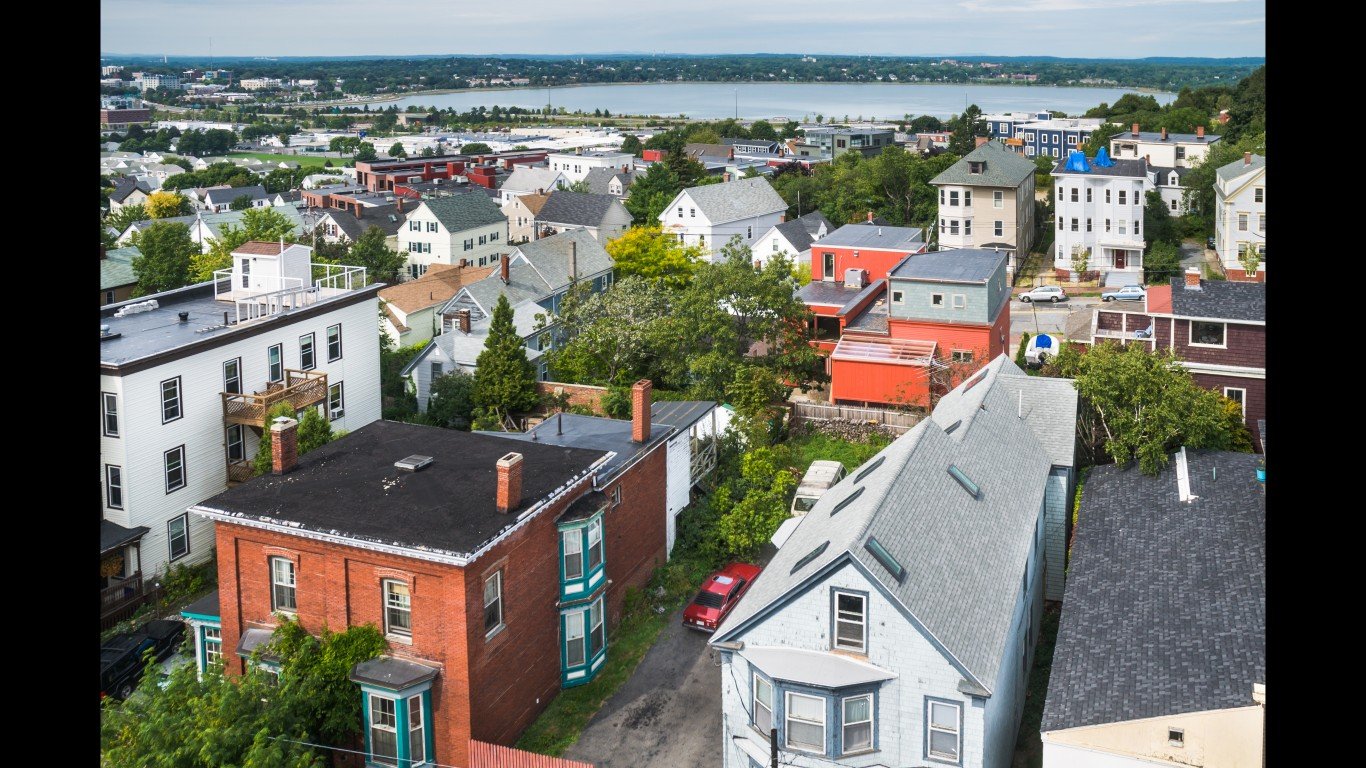
24. Portland-South Portland, ME
> Poverty rate: 8.4% (Maine: 11.6%)
> 2018 unemployment: 2.7% (Maine: 3.4%)
> Households receiving SNAP benefits: 8.2% (Maine: 12.9%)
> Median household income: $69,980 (Maine: $55,602)
[in-text-ad-2]
Source: John Callery / Getty Images
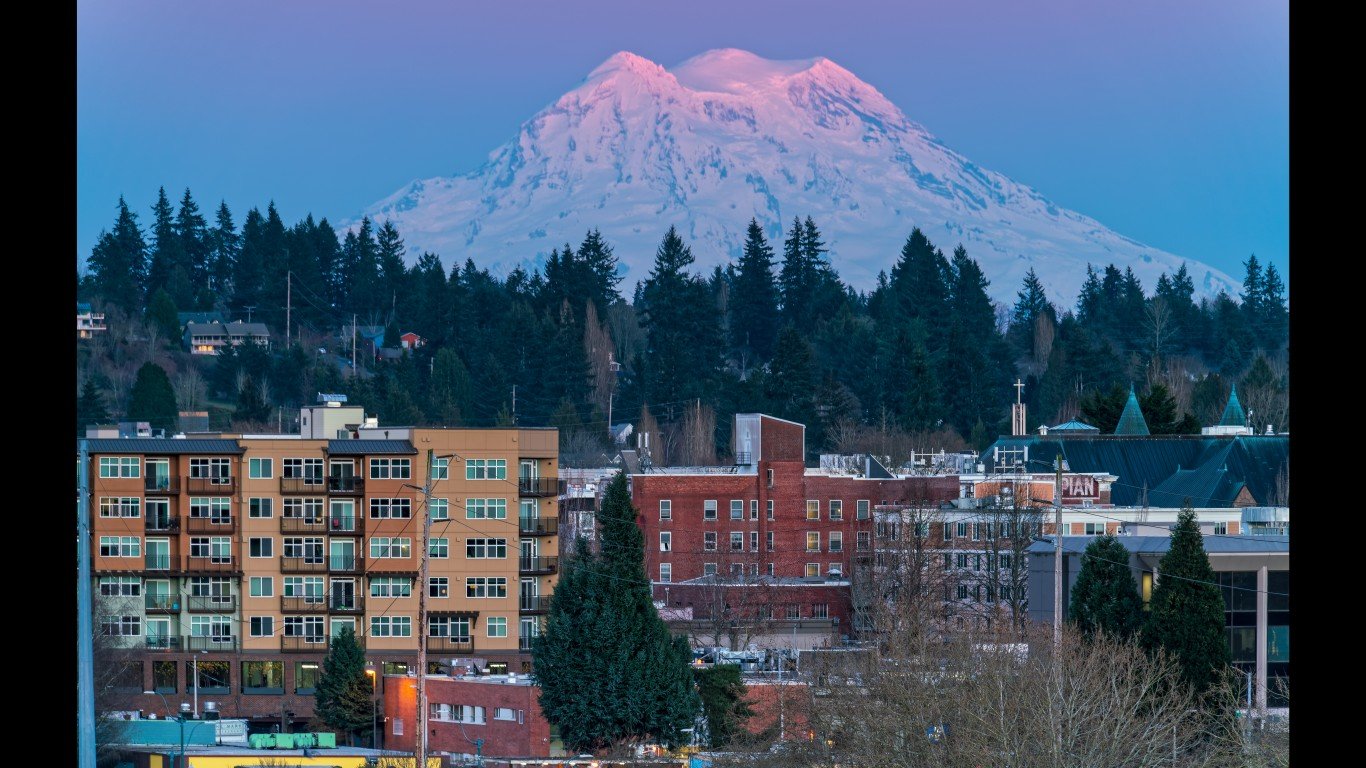
23. Olympia-Tumwater, WA
> Poverty rate: 8.4% (Washington: 10.3%)
> 2018 unemployment: 4.8% (Washington: 4.5%)
> Households receiving SNAP benefits: 11.7% (Washington: 11.1%)
> Median household income: $72,703 (Washington: $74,073)

Source: Chris Rand / Wikimedia Commons
22. Green Bay, WI
> Poverty rate: 8.3% (Wisconsin: 11.0%)
> 2018 unemployment: 2.8% (Wisconsin: 3.0%)
> Households receiving SNAP benefits: 7.3% (Wisconsin: 10.0%)
> Median household income: $61,400 (Wisconsin: $60,773)
[in-text-ad]

Source: rarrarorro / Getty Images
21. San Francisco-Oakland-Hayward, CA
> Poverty rate: 8.3% (California: 12.8%)
> 2018 unemployment: 2.7% (California: 4.2%)
> Households receiving SNAP benefits: 5.1% (California: 8.5%)
> Median household income: $107,898 (California: $75,277)
 24/7 Wall St.
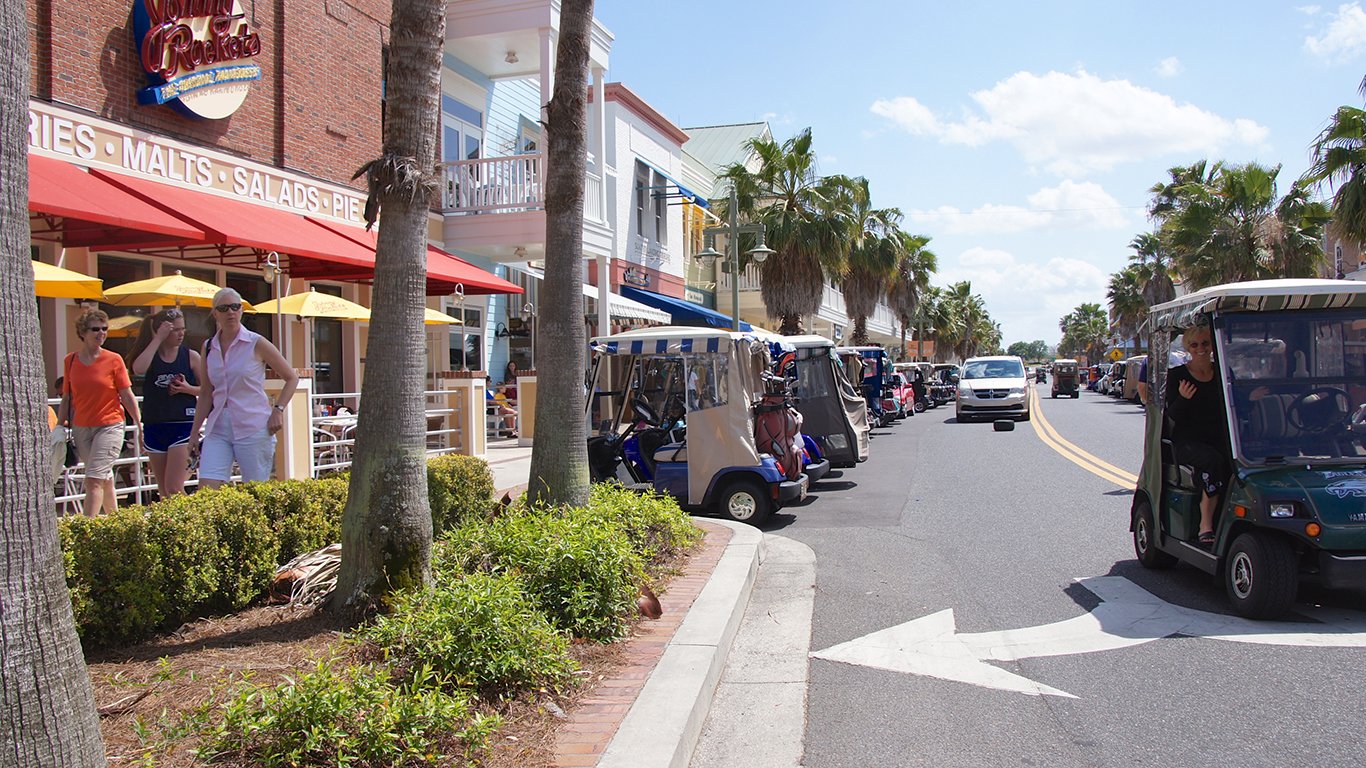
Source: Ted Eytan / Flickr
20. The Villages, FL
> Poverty rate: 8.2% (Florida: 13.6%)
> 2018 unemployment: 5.1% (Florida: 3.6%)
> Households receiving SNAP benefits: 4.7% (Florida: 13.8%)
> Median household income: $53,895 (Florida: $55,462)

Source: Famartin / Wikimedia Commons
19. California-Lexington Park, MD
> Poverty rate: 8.2% (Maryland: 9.0%)
> 2018 unemployment: 3.8% (Maryland: 3.9%)
> Households receiving SNAP benefits: 5.9% (Maryland: 9.4%)
> Median household income: $92,250 (Maryland: $83,242)
[in-text-ad-2]

Source: sarkophoto / Getty Images
18. Fairbanks, AK
> Poverty rate: 8.1% (Alaska: 10.9%)
> 2018 unemployment: 5.8% (Alaska: 6.6%)
> Households receiving SNAP benefits: 5.3% (Alaska: 10.9%)
> Median household income: $75,448 (Alaska: $74,346)
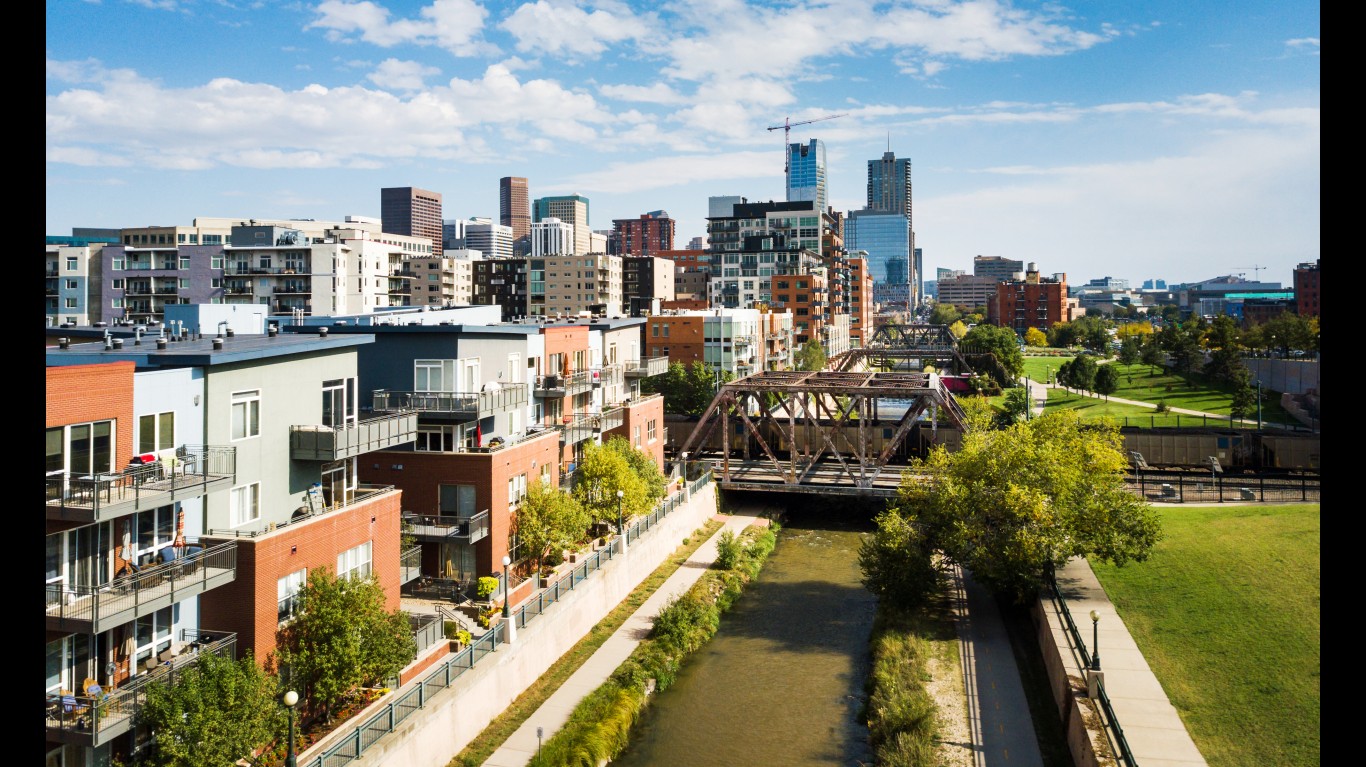
Source: Stefan Tomic / Getty Images
17. Denver-Aurora-Lakewood, CO
> Poverty rate: 8.0% (Colorado: 9.6%)
> 2018 unemployment: 3.2% (Colorado: 3.3%)
> Households receiving SNAP benefits: 5.9% (Colorado: 7.2%)
> Median household income: $79,478 (Colorado: $71,953)
[in-text-ad]
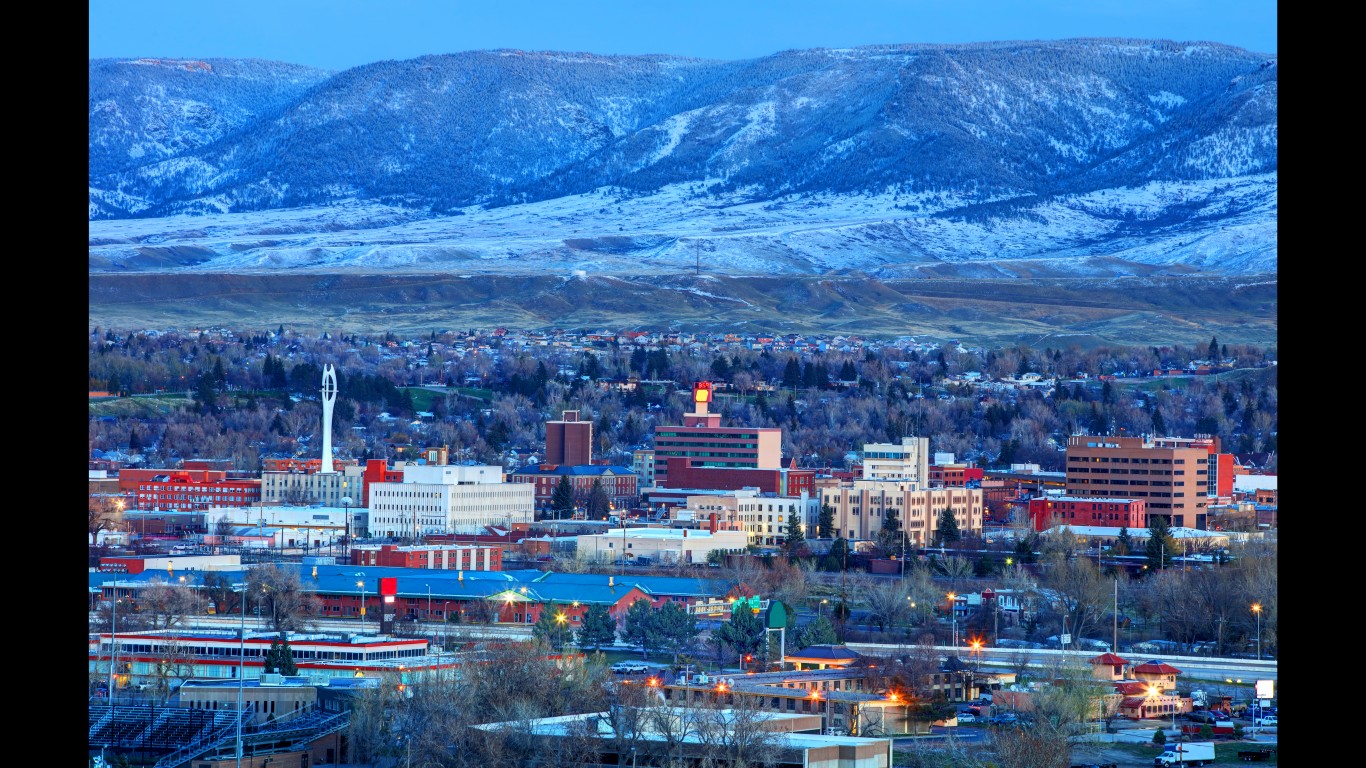
Source: DenisTangneyJr / Getty Images
16. Casper, WY
> Poverty rate: 7.9% (Wyoming: 11.1%)
> 2018 unemployment: 4.6% (Wyoming: 4.1%)
> Households receiving SNAP benefits: 4.9% (Wyoming: 5.0%)
> Median household income: $64,833 (Wyoming: $61,584)
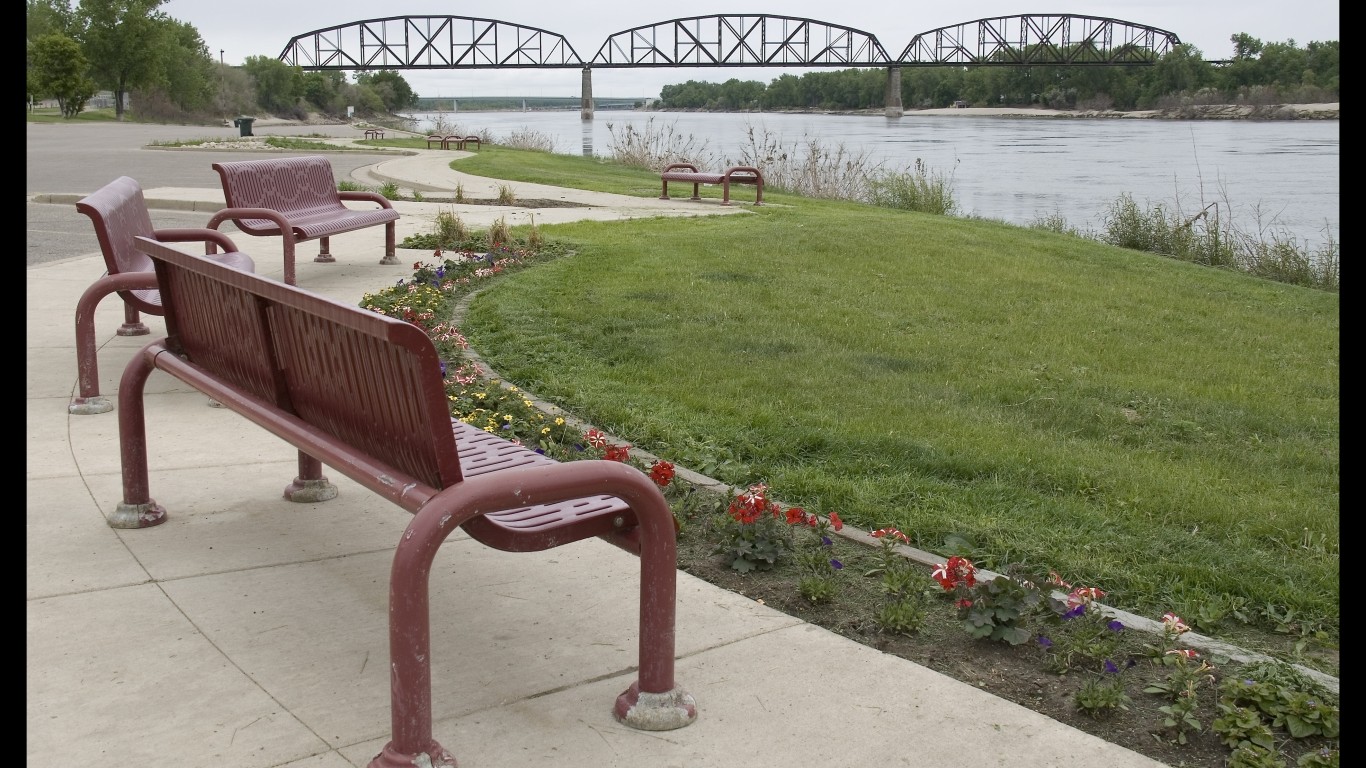
Source: jerryhopman / Getty Images
15. Bismarck, ND
> Poverty rate: 7.9% (North Dakota: 10.7%)
> 2018 unemployment: 2.8% (North Dakota: 2.6%)
> Households receiving SNAP benefits: 7.6% (North Dakota: 7.0%)
> Median household income: $70,550 (North Dakota: $63,837)

Source: YinYang / Getty Images
14. Urban Honolulu, HI
> Poverty rate: 7.8% (Hawaii: 8.8%)
> 2018 unemployment: 2.3% (Hawaii: 2.4%)
> Households receiving SNAP benefits: 8.3% (Hawaii: 10.0%)
> Median household income: $84,423 (Hawaii: $80,212)
[in-text-ad-2]
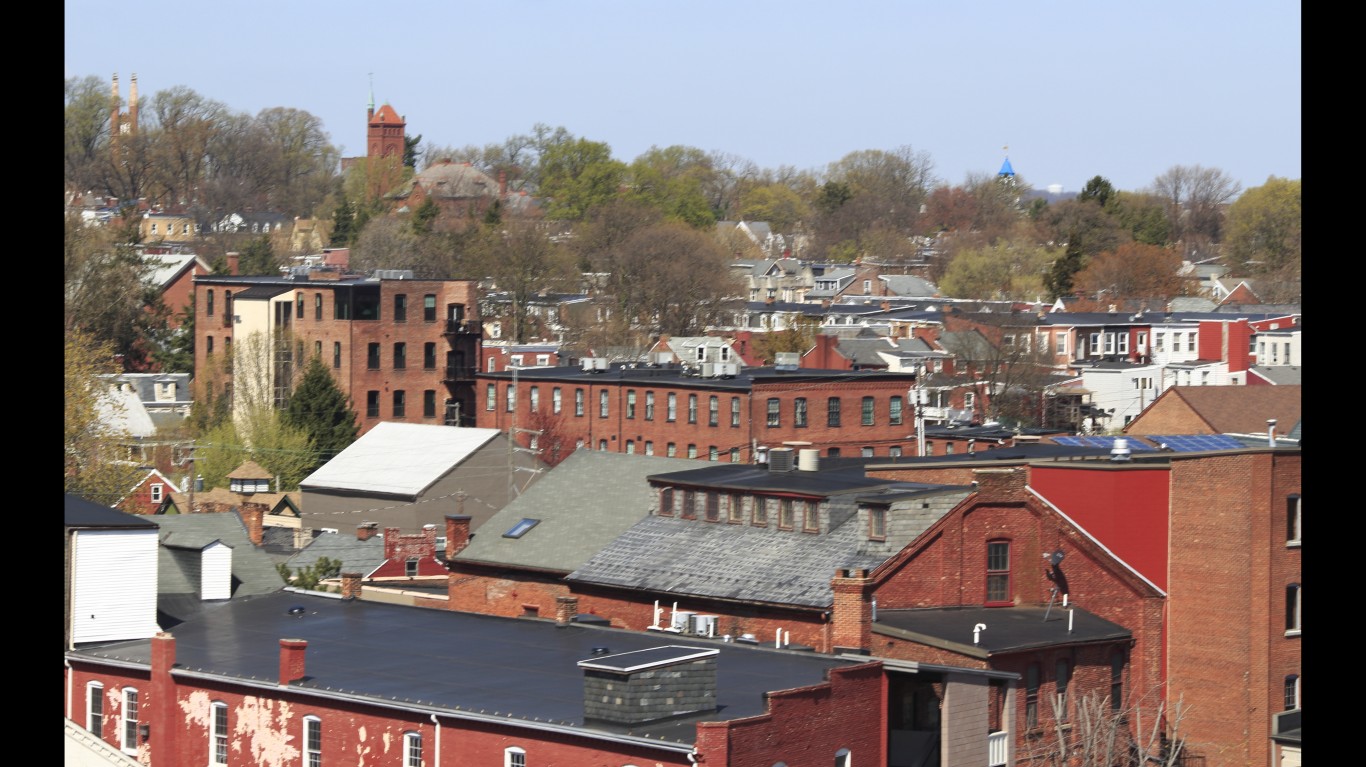
Source: Dillon_Naber_Cruz / Getty Images
13. Lancaster, PA
> Poverty rate: 7.6% (Pennsylvania: 12.2%)
> 2018 unemployment: 3.4% (Pennsylvania: 4.3%)
> Households receiving SNAP benefits: 8.6% (Pennsylvania: 13.4%)
> Median household income: $66,277 (Pennsylvania: $60,905)

Source: OlegAlbinsky / Getty Images
12. Barnstable Town, MA
> Poverty rate: 7.6% (Massachusetts: 10.0%)
> 2018 unemployment: 4.1% (Massachusetts: 3.3%)
> Households receiving SNAP benefits: 6.5% (Massachusetts: 11.5%)
> Median household income: $68,902 (Massachusetts: $79,835)
[in-text-ad]
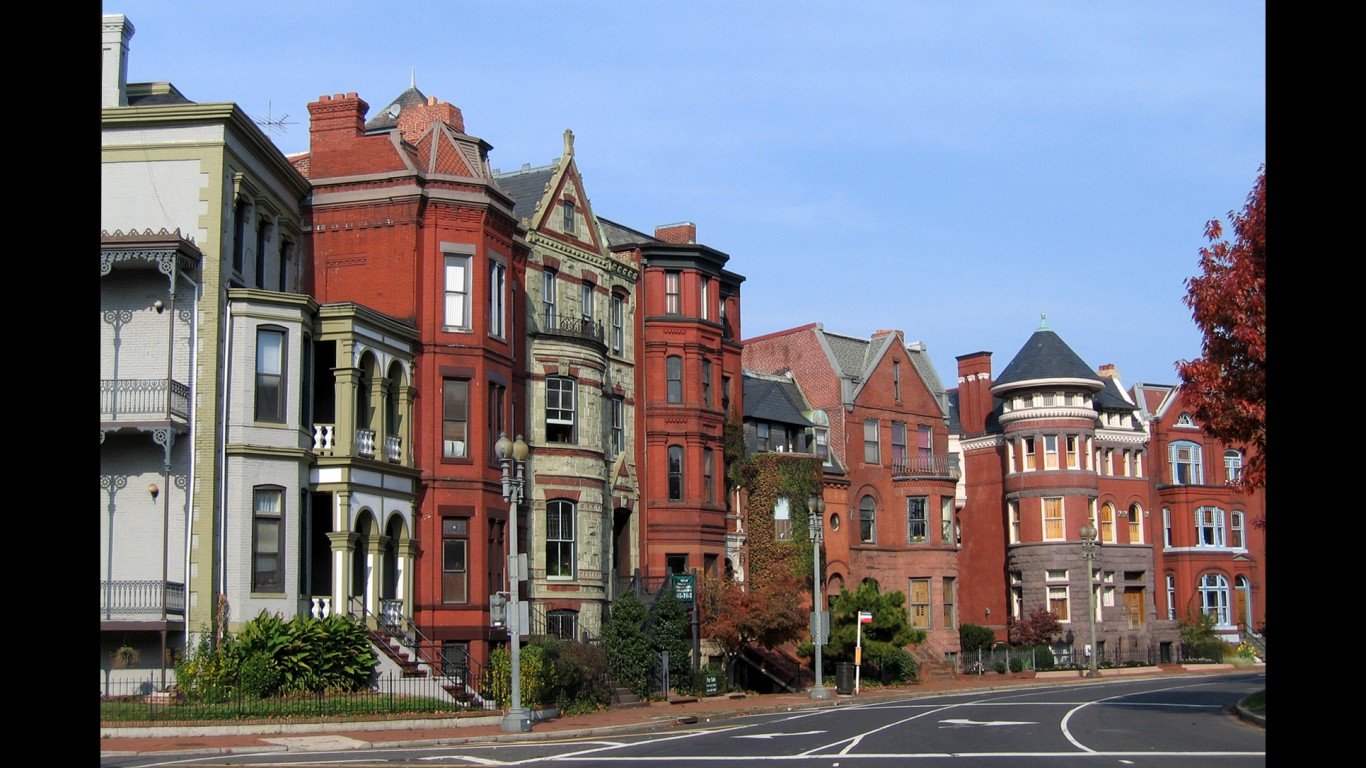
Source: Kimprobable / Getty Images
11. Washington-Arlington-Alexandria, DC-VA-MD-WV
> Poverty rate: 7.6%
> 2018 unemployment: 3.3%
> Households receiving SNAP benefits: 6.5%
> Median household income: $102,180
 24/7 Wall St.
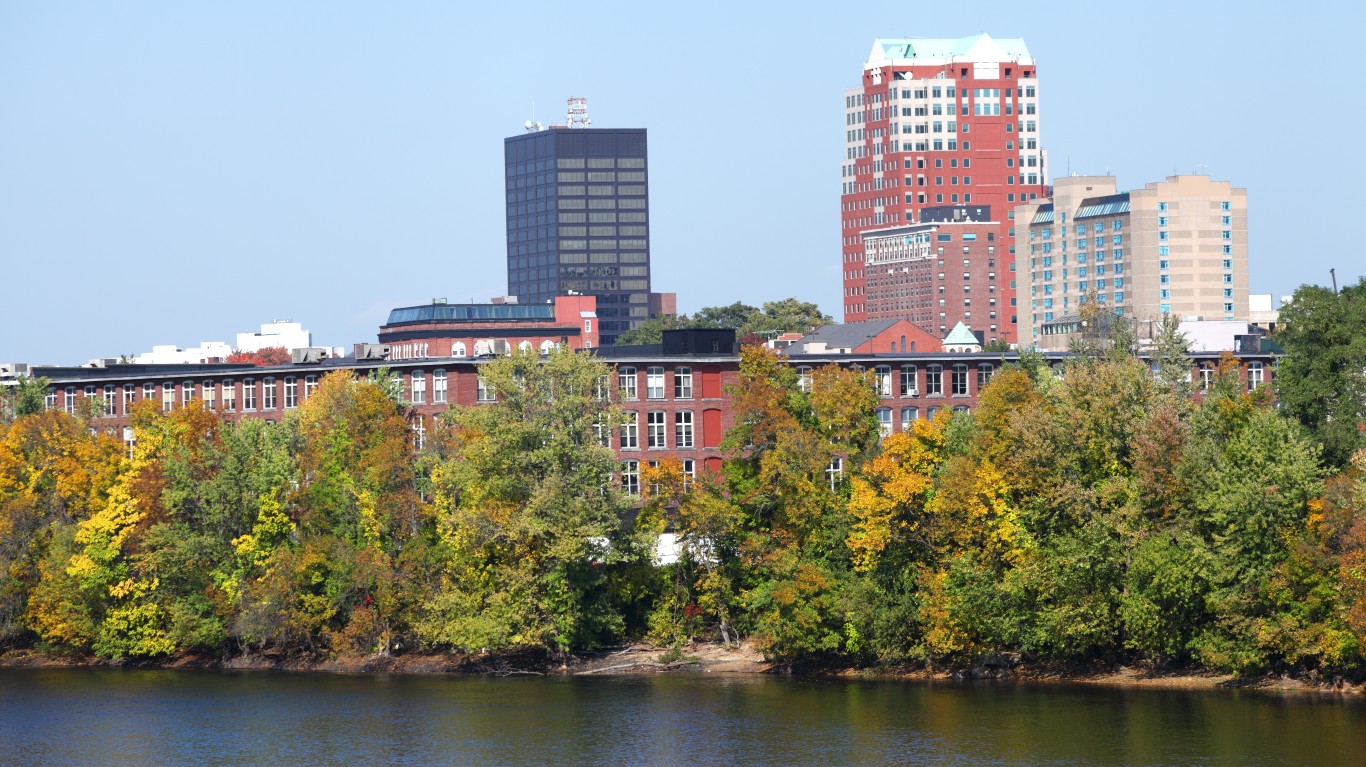
Source: DenisTangneyJr / Getty Images
10. Manchester-Nashua, NH
> Poverty rate: 7.5% (New Hampshire: 7.6%)
> 2018 unemployment: 2.4% (New Hampshire: 2.5%)
> Households receiving SNAP benefits: 7.4% (New Hampshire: 6.7%)
> Median household income: $78,978 (New Hampshire: $74,991)
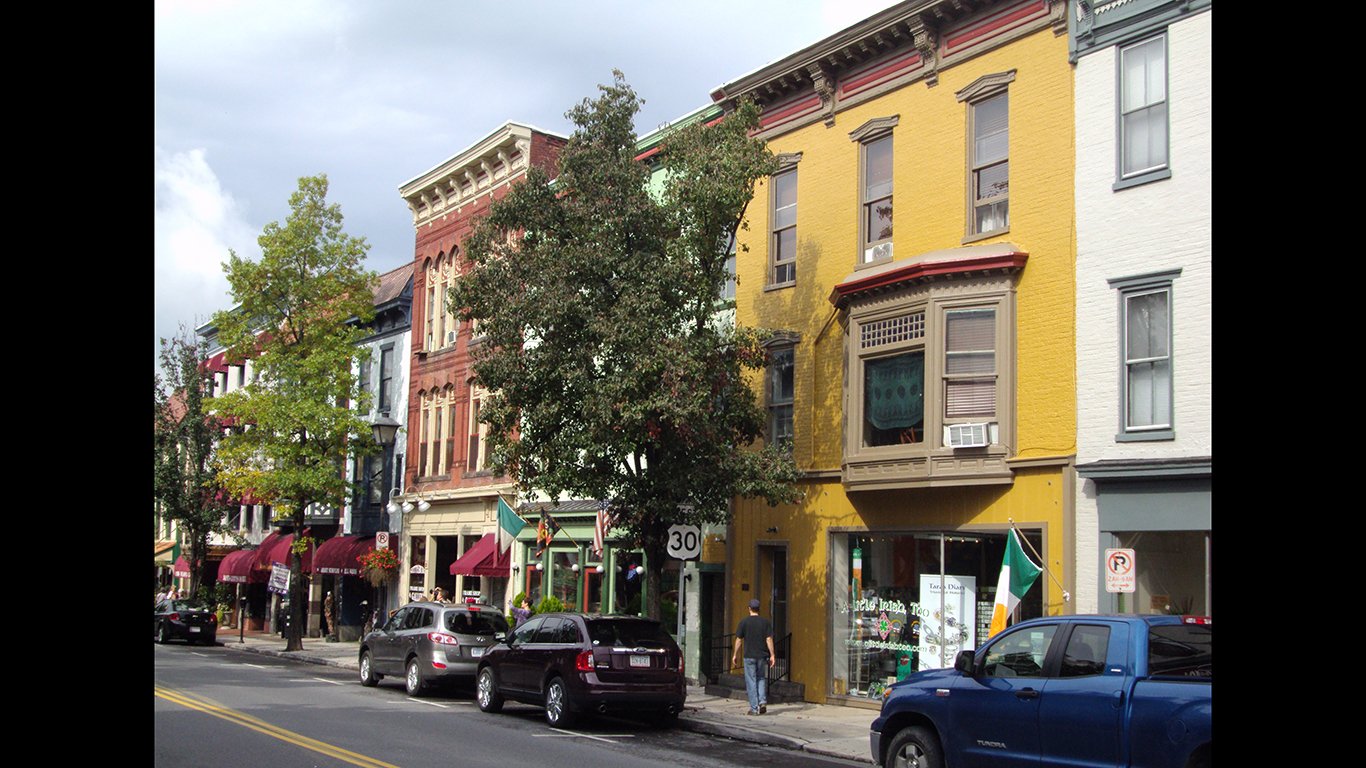
Source: denisbin / Flickr
9. Gettysburg, PA
> Poverty rate: 7.3% (Pennsylvania: 12.2%)
> 2018 unemployment: 3.3% (Pennsylvania: 4.3%)
> Households receiving SNAP benefits: 7.1% (Pennsylvania: 13.4%)
> Median household income: $62,284 (Pennsylvania: $60,905)
[in-text-ad-2]

Source: Patrick Nouhailler / Flickr
8. Vallejo-Fairfield, CA
> Poverty rate: 7.3% (California: 12.8%)
> 2018 unemployment: 3.9% (California: 4.2%)
> Households receiving SNAP benefits: 7.2% (California: 8.5%)
> Median household income: $84,395 (California: $75,277)
Source: pbk-pg / Getty Images
7. San Jose-Sunnyvale-Santa Clara, CA
> Poverty rate: 7.2% (California: 12.8%)
> 2018 unemployment: 2.7% (California: 4.2%)
> Households receiving SNAP benefits: 4.2% (California: 8.5%)
> Median household income: $124,696 (California: $75,277)
[in-text-ad]
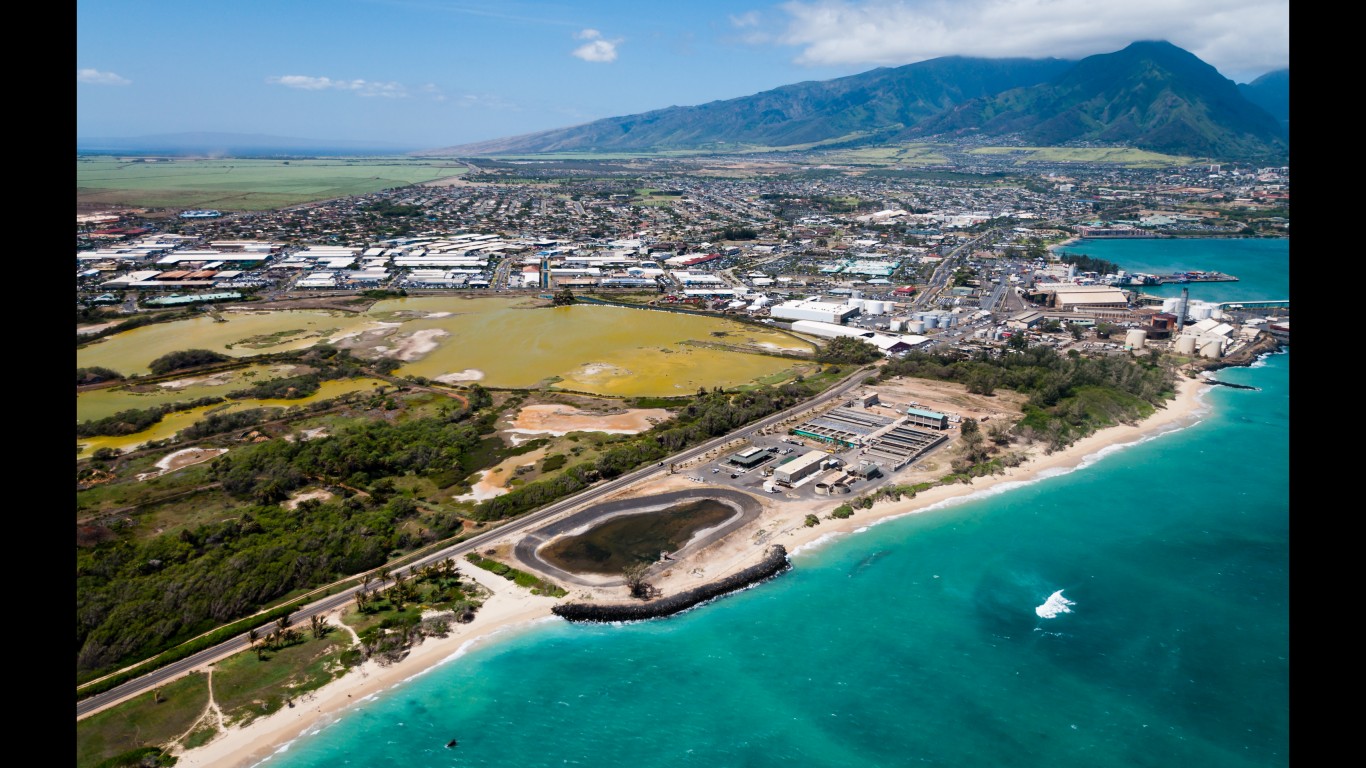
Source: unclegene / Getty Images
6. Kahului-Wailuku-Lahaina, HI
> Poverty rate: 7.1% (Hawaii: 8.8%)
> 2018 unemployment: 2.4% (Hawaii: 2.4%)
> Households receiving SNAP benefits: 8.4% (Hawaii: 10.0%)
> Median household income: $82,917 (Hawaii: $80,212)

Source: benkrut / Getty Images
5. Wausau, WI
> Poverty rate: 7.0% (Wisconsin: 11.0%)
> 2018 unemployment: 2.7% (Wisconsin: 3.0%)
> Households receiving SNAP benefits: 7.5% (Wisconsin: 10.0%)
> Median household income: $62,890 (Wisconsin: $60,773)
Source: JamesBrey / Getty Images
4. Appleton, WI
> Poverty rate: 6.9% (Wisconsin: 11.0%)
> 2018 unemployment: 2.7% (Wisconsin: 3.0%)
> Households receiving SNAP benefits: 6.0% (Wisconsin: 10.0%)
> Median household income: $65,826 (Wisconsin: $60,773)
[in-text-ad-2]
Source: Scott Catron / Wikimedia Commons
3. Ogden-Clearfield, UT
> Poverty rate: 6.7% (Utah: 9.0%)
> 2018 unemployment: 3.2% (Utah: 3.1%)
> Households receiving SNAP benefits: 5.9% (Utah: 6.5%)
> Median household income: $76,653 (Utah: $71,414)

Source: DenisTangneyJr / Getty Images
2. Sheboygan, WI
> Poverty rate: 6.6% (Wisconsin: 11.0%)
> 2018 unemployment: 2.5% (Wisconsin: 3.0%)
> Households receiving SNAP benefits: 7.7% (Wisconsin: 10.0%)
> Median household income: $60,896 (Wisconsin: $60,773)
[in-text-ad]

Source: DenisTangneyJr / Getty Images
1. Rochester, MN
> Poverty rate: 6.6% (Minnesota: 9.6%)
> 2018 unemployment: 2.5% (Minnesota: 2.9%)
> Households receiving SNAP benefits: 6.4% (Minnesota: 7.3%)
> Median household income: $72,129 (Minnesota: $70,315)
Methodology
To identify the cities with the lowest poverty rates, 24/7 Wall St. reviewed the share of residents living in households with incomes below the poverty line in 382 U.S. metro areas with one-year data from the U.S. Census Bureau’s 2018 American Community Survey. In cases where two or more cities had the same poverty rate, median household income was used as a tiebreaker, favoring the city with a higher income. Data on the share of households receiving SNAP benefits, or food stamps, and median household income also came from the 2018 ACS. Data on annual unemployment for 2018 came from the Local Area Unemployment Statistics Program of the Bureau of Labor Statistics.
Take This Retirement Quiz To Get Matched With An Advisor Now (Sponsored)
Are you ready for retirement? Planning for retirement can be overwhelming, that’s why it could be a good idea to speak to a fiduciary financial advisor about your goals today.
Start by taking this retirement quiz right here from SmartAsset that will match you with up to 3 financial advisors that serve your area and beyond in 5 minutes. Smart Asset is now matching over 50,000 people a month.
Click here now to get started.
Thank you for reading! Have some feedback for us?
Contact the 24/7 Wall St. editorial team.
Editors' Picks