
Cities like New York, San Francisco, and Washington D.C. are commonly referred to as “superstar cities” — innovation hubs that are home to major companies in industries like defense, finance, and technology. Companies in these cities pay top dollar to attract talent from across the country and around the world, thus contributing to skyrocketing living costs that are often well above what the typical American can afford.
The overall cost of living ranges from 18% to 28% higher than average in these cities. Housing can be particularly unaffordable, with rents costing at least 50% more on average. These are the cities where the middle class can no longer afford housing.
Living in a major city, and benefitting from the concentration of jobs, amenities, and culture, does not have to break the bank, however. There are dozens of cities nationwide with a lower than average cost of living and with relatively affordable housing markets — and many of them are growing rapidly.
Using data from the U.S. Census Bureau and the Bureau of Economic Analysis, 24/7 Wall St. identified the 50 most affordable metropolitan areas Americans are moving to. In each of the metro areas on this list, the overall cost of living is lower than the national average, and typical housing costs are more in line with area incomes than average across all cities. Additionally, between 2010 and 2018, far more people have moved to these cities than have left.
Not only are people moving to these cities, but many are also choosing to start families in these areas. About half of the cities on this list also reported higher than average natural population growth — meaning there were more births than deaths between 2010 and 2018. Not surprisingly, many of these cities are among the fastest growing in the United States. Here is a closer look at America’s 25 fastest growing cities.
Click here to see America’s cheapest cities where everyone wants to live right now
Click here to read our methodology

Source: Sean Pavone / Getty Images
50. Atlanta-Sandy Springs-Roswell, GA
> Total population: 5,949,951
> Pop. growth due to net migration, 2010-2018: +6.7% (+351,958)
> Cost of living: 3.2% less than nat’l avg.
> Median home value: $233,700
> Median household income: $69,464 (top 25%)
[in-text-ad]

Source: SeanPavonePhoto / Getty Images
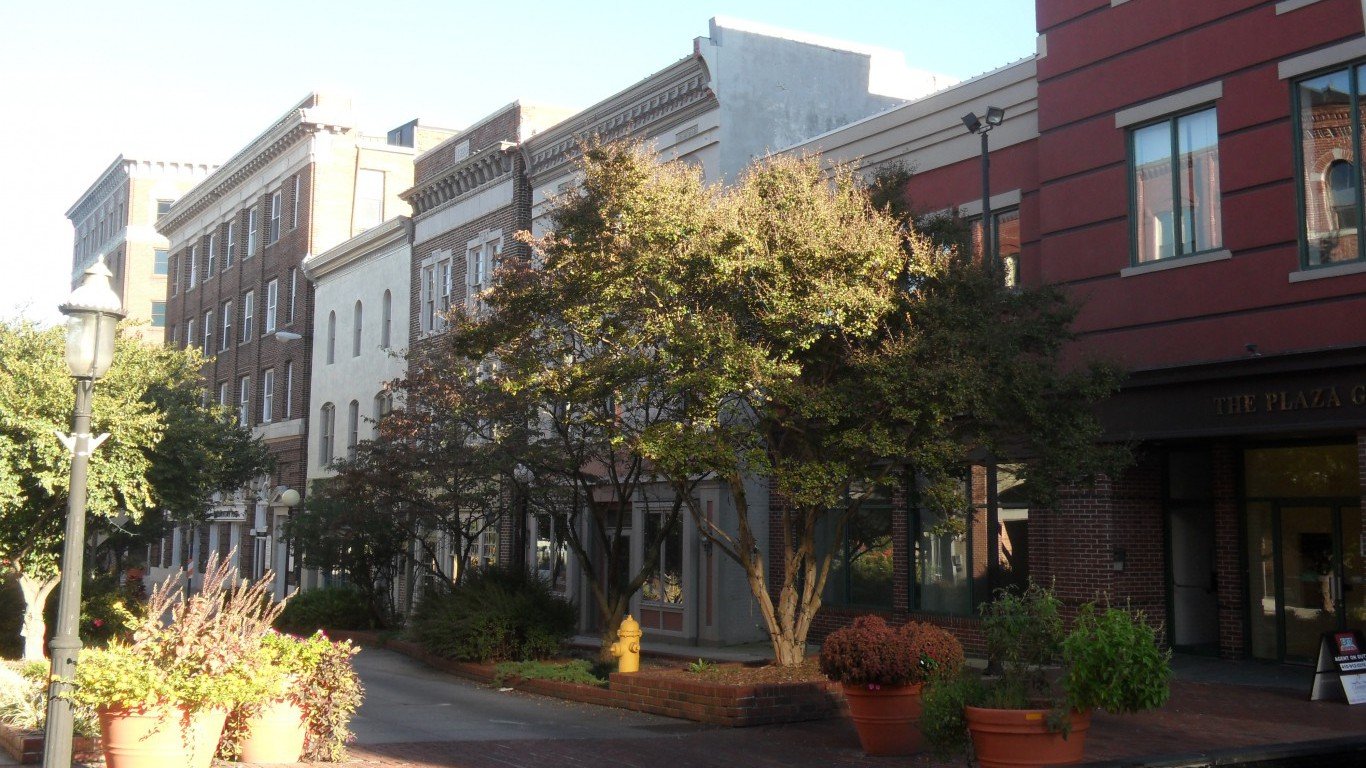
49. Savannah, GA
> Total population: 389,494
> Pop. growth due to net migration, 2010-2018: +6.9% (+23,958)
> Cost of living: 6.1% less than nat’l avg.
> Median home value: $205,600
> Median household income: $58,178
 24/7 Wall St.
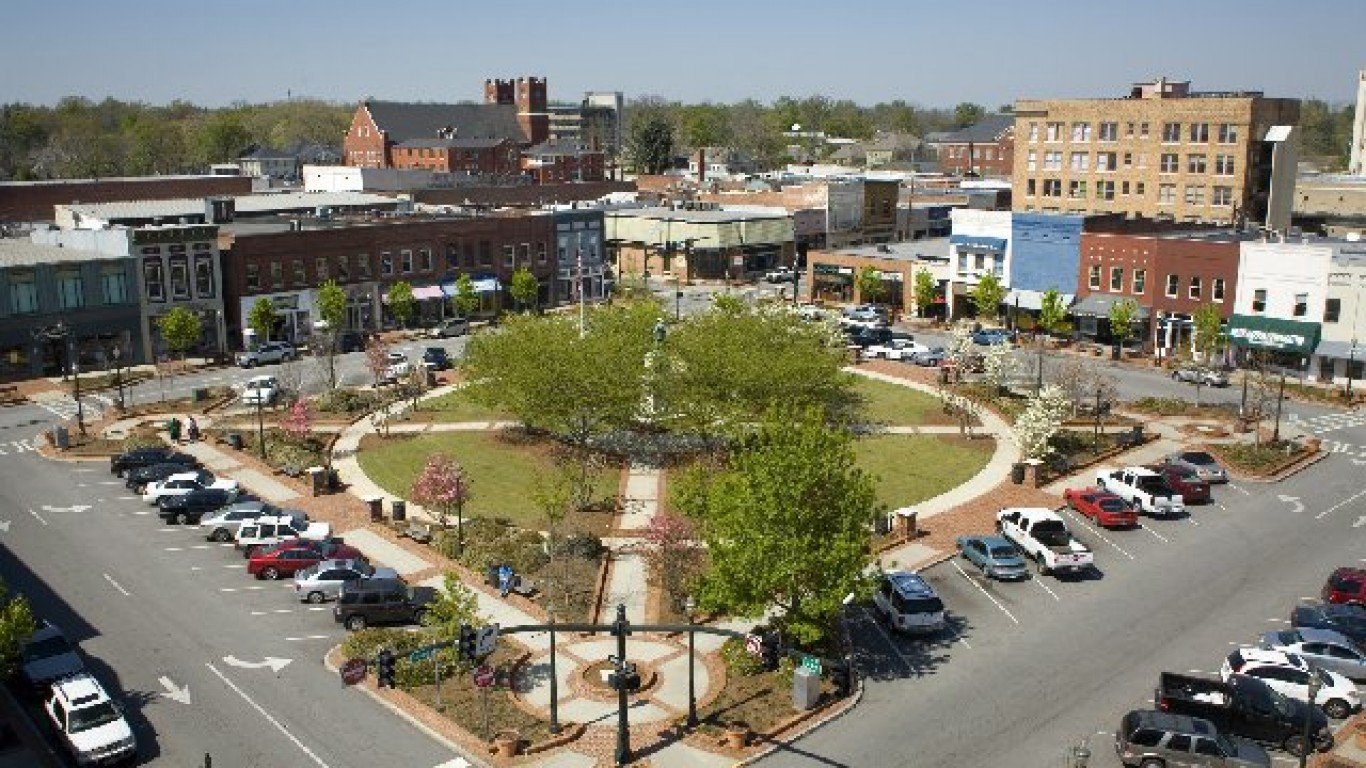
Source: Public Domain / Wikimedia Commons
48. Gainesville, GA
> Total population: 202,148
> Pop. growth due to net migration, 2010-2018: +7.1% (+12,744)
> Cost of living: 11.5% less than nat’l avg.
> Median home value: $217,900
> Median household income: $61,699

Source: RobHainer / Getty Images
47. Panama City, FL
> Total population: 201,451
> Pop. growth due to net migration, 2010-2018: +7.2% (+13,302)
> Cost of living: 6.1% less than nat’l avg.
> Median home value: $175,000
> Median household income: $51,842
[in-text-ad-2]
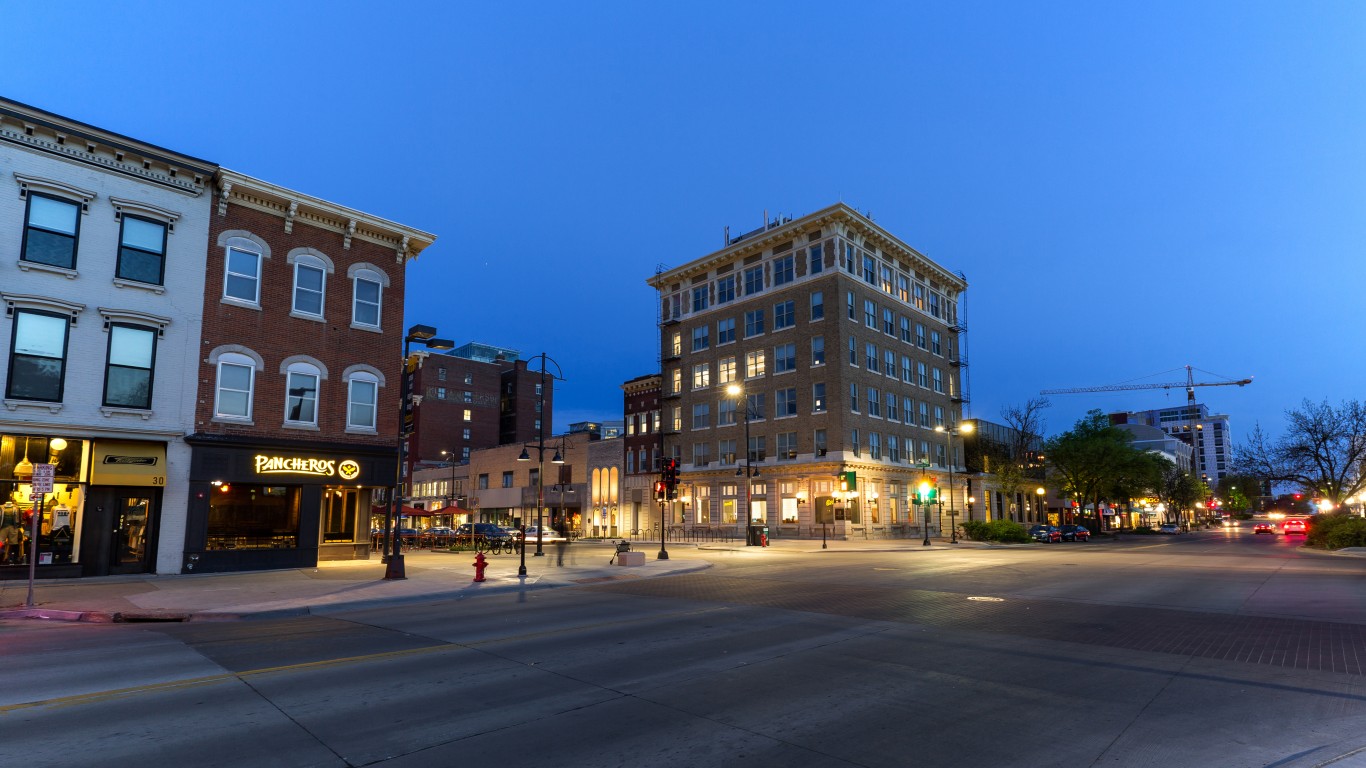
Source: harmantasdc / Getty Images
46. Iowa City, IA
> Total population: 173,401
> Pop. growth due to net migration, 2010-2018: +7.3% (+11,156)
> Cost of living: 5.7% less than nat’l avg.
> Median home value: $225,300
> Median household income: $64,635 (top 25%)

Source: Kruck20 / Getty Images
45. Spartanburg, SC
> Total population: 341,298
> Pop. growth due to net migration, 2010-2018: +7.4% (+23,140)
> Cost of living: 11.6% less than nat’l avg.
> Median home value: $147,800
> Median household income: $51,853
[in-text-ad]

Source: SeanPavonePhoto / Getty Images
44. Greenville-Anderson-Mauldin, SC
> Total population: 906,626
> Pop. growth due to net migration, 2010-2018: +7.6% (+62,935)
> Cost of living: 10.1% less than nat’l avg.
> Median home value: $169,100
> Median household income: $55,790
 24/7 Wall St.
Source: SWKrullImaging / Getty Images
43. Colorado Springs, CO
> Total population: 738,939
> Pop. growth due to net migration, 2010-2018: +7.7% (+50,027)
> Cost of living: 0.4% less than nat’l avg.
> Median home value: $290,100 (top 25%)
> Median household income: $67,430 (top 25%)

Source: traveler1116 / Getty Images
42. Huntsville, AL
> Total population: 462,693
> Pop. growth due to net migration, 2010-2018: +7.9% (+32,831)
> Cost of living: 10.1% less than nat’l avg.
> Median home value: $187,000
> Median household income: $63,765 (top 25%)
[in-text-ad-2]

Source: benedek / Getty Images
41. Pensacola-Ferry Pass-Brent, FL
> Total population: 494,883
> Pop. growth due to net migration, 2010-2018: +8.0% (+35,963)
> Cost of living: 7.7% less than nat’l avg.
> Median home value: $169,800
> Median household income: $57,998
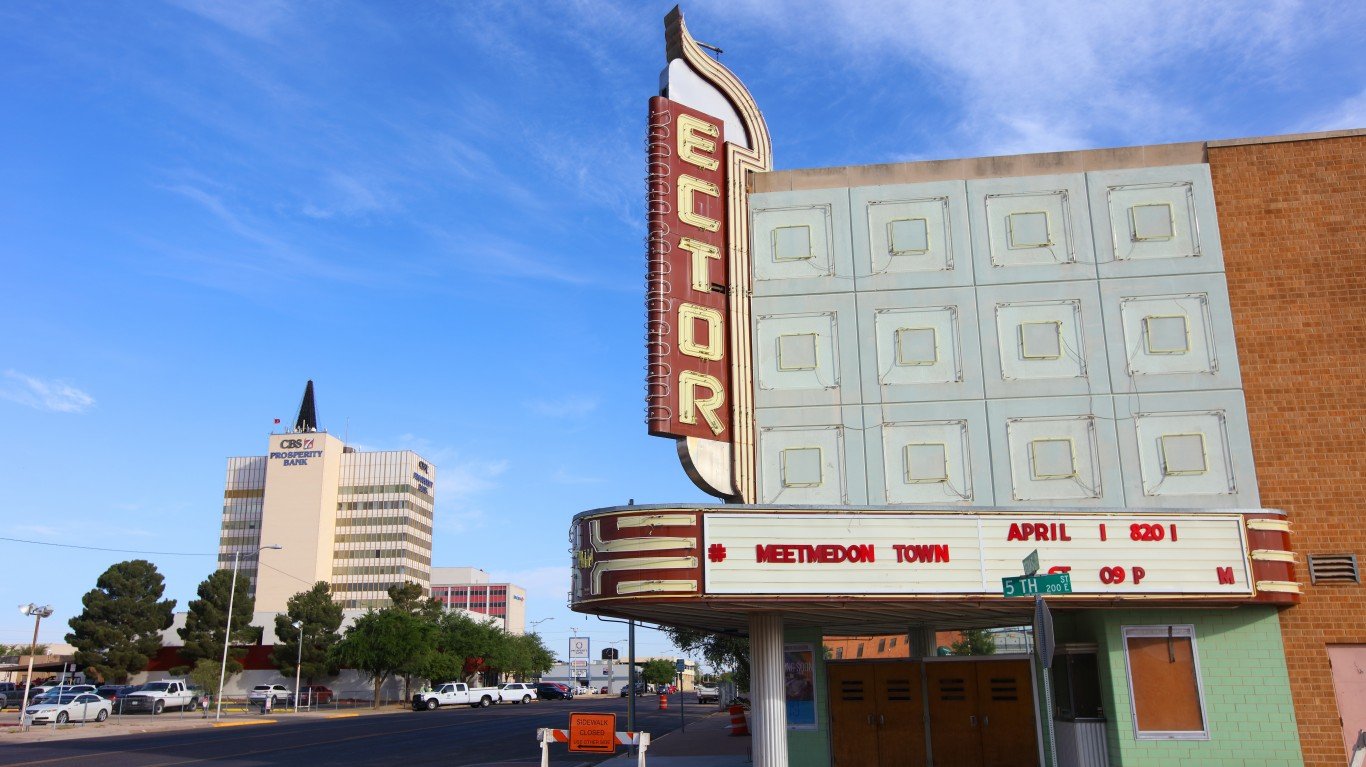
Source: DenisTangneyJr / Getty Images
40. Odessa, TX
> Total population: 162,124
> Pop. growth due to net migration, 2010-2018: +8.3% (+11,351)
> Cost of living: 4.2% less than nat’l avg.
> Median home value: $148,000
> Median household income: $64,165 (top 25%)
[in-text-ad]

Source: TriciaDaniel / Getty Images
39. College Station-Bryan, TX
> Total population: 262,431
> Pop. growth due to net migration, 2010-2018: +8.3% (+19,042)
> Cost of living: 6.7% less than nat’l avg.
> Median home value: $213,100
> Median household income: $50,512
 24/7 Wall St.
Source: Cecil_Kindle / Getty Images
38. Kennewick-Richland, WA
> Total population: 296,224
> Pop. growth due to net migration, 2010-2018: +8.5% (+21,491)
> Cost of living: 3.4% less than nat’l avg.
> Median home value: $248,600 (top 25%)
> Median household income: $64,908 (top 25%)
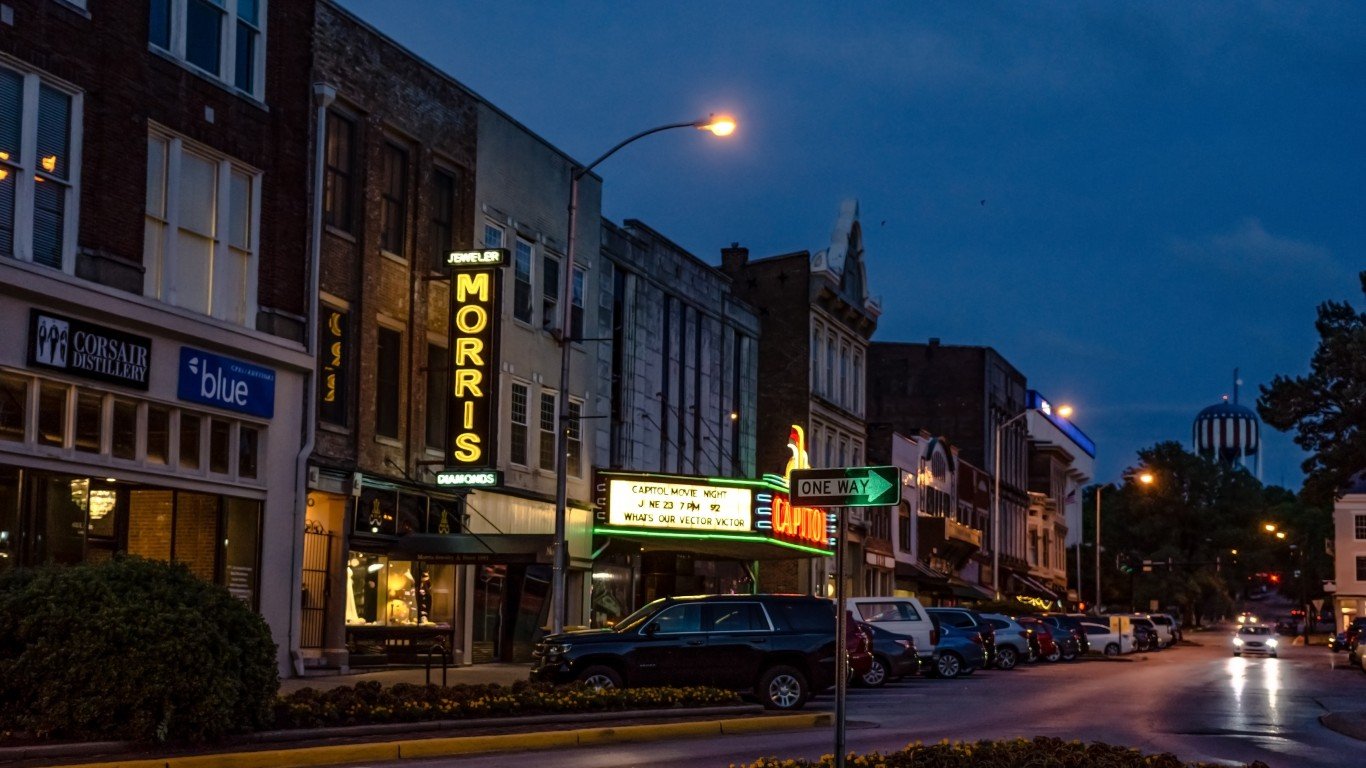
Source: Jacqueline Nix / Getty Images
37. Bowling Green, KY
> Total population: 177,432
> Pop. growth due to net migration, 2010-2018: +8.5% (+13,518)
> Cost of living: 14.8% less than nat’l avg.
> Median home value: $166,600
> Median household income: $51,365
[in-text-ad-2]

Source: Chris Szwedo / Getty Images
36. Lake Havasu City-Kingman, AZ
> Total population: 209,550
> Pop. growth due to net migration, 2010-2018: +8.6% (+17,225)
> Cost of living: 8.8% less than nat’l avg.
> Median home value: $189,300
> Median household income: $46,060 (bottom 25%)

Source: Davel5957 / Getty Images
35. Des Moines-West Des Moines, IA
> Total population: 655,409
> Pop. growth due to net migration, 2010-2018: +8.6% (+49,051)
> Cost of living: 6.5% less than nat’l avg.
> Median home value: $195,300
> Median household income: $71,352 (top 25%)
[in-text-ad]

Source: DenisTangneyJr / Getty Images
34. Sioux Falls, SD
> Total population: 265,653
> Pop. growth due to net migration, 2010-2018: +8.7% (+19,823)
> Cost of living: 8.4% less than nat’l avg.
> Median home value: $199,500
> Median household income: $61,196
 24/7 Wall St.
Source: Courtesy of the City of Burlington, NC
33. Burlington, NC
> Total population: 166,436
> Pop. growth due to net migration, 2010-2018: +8.9% (+13,430)
> Cost of living: 10.9% less than nat’l avg.
> Median home value: $151,900
> Median household income: $49,979 (bottom 25%)

Source: SeanPavonePhoto / Getty Images
32. Durham-Chapel Hill, NC
> Total population: 575,412
> Pop. growth due to net migration, 2010-2018: +9.0% (+45,535)
> Cost of living: 4.8% less than nat’l avg.
> Median home value: $250,200 (top 25%)
> Median household income: $62,114
[in-text-ad-2]

Source: powerofforever / Getty Images
31. Bismarck, ND
> Total population: 132,678
> Pop. growth due to net migration, 2010-2018: +9.6% (+11,045)
> Cost of living: 7% less than nat’l avg.
> Median home value: $258,700 (top 25%)
> Median household income: $70,550 (top 25%)
Source: Eric Fischer / Wikimedia Commons
30. Salisbury, MD-DE
> Total population: 409,979
> Pop. growth due to net migration, 2010-2018: +9.6% (+35,981)
> Cost of living: 11.5% less than nat’l avg.
> Median home value: $231,800
> Median household income: $59,214
[in-text-ad]
Source: Courtesy of the City of Sherman, TX
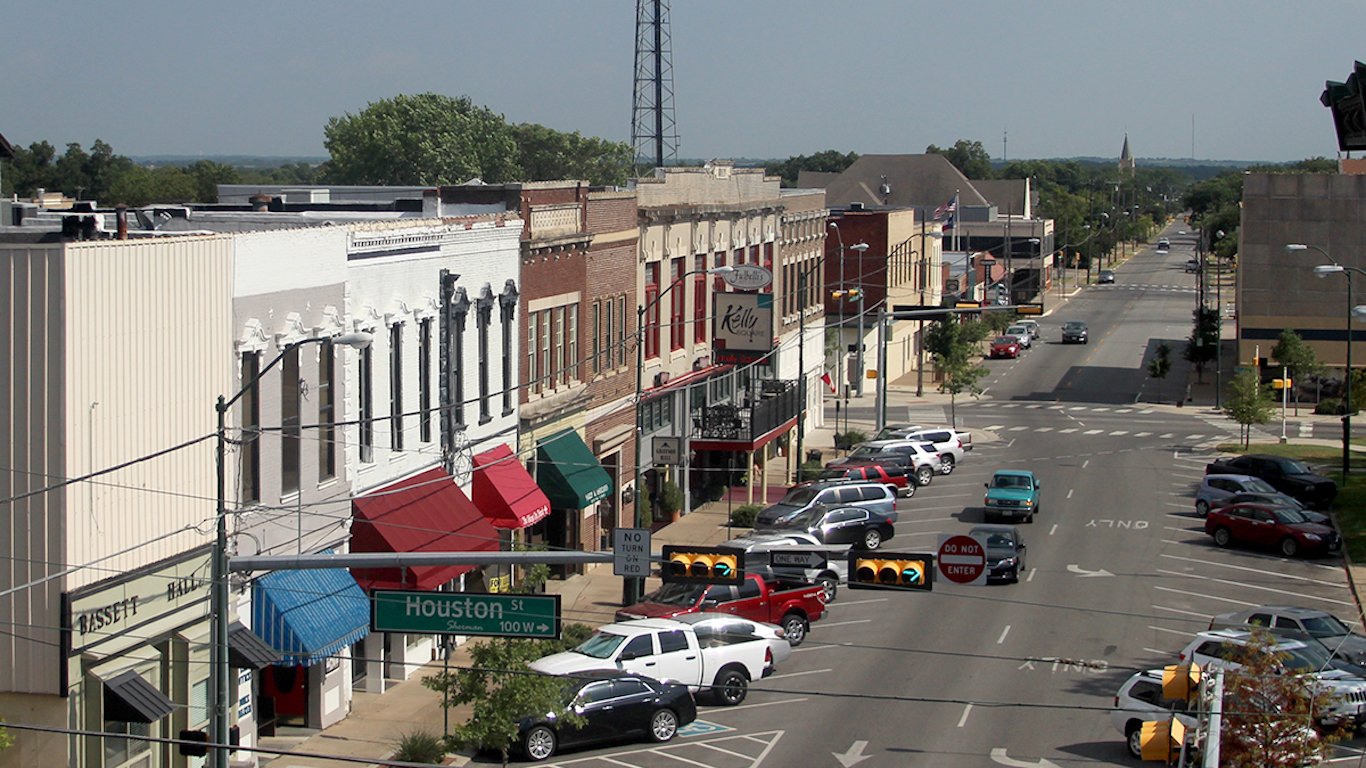
29. Sherman-Denison, TX
> Total population: 133,991
> Pop. growth due to net migration, 2010-2018: +9.8% (+11,842)
> Cost of living: 8.1% less than nat’l avg.
> Median home value: $163,100
> Median household income: $51,158
 24/7 Wall St.
Source: DenisTangneyJr / Getty Images
28. Fargo, ND-MN
> Total population: 245,471
> Pop. growth due to net migration, 2010-2018: +10.2% (+21,211)
> Cost of living: 8.3% less than nat’l avg.
> Median home value: $221,400
> Median household income: $65,073 (top 25%)

Source: JacobH / Getty Images
27. Phoenix-Mesa-Scottsdale, AZ
> Total population: 4,857,962
> Pop. growth due to net migration, 2010-2018: +10.4% (+435,114)
> Cost of living: 2.3% less than nat’l avg.
> Median home value: $267,000 (top 25%)
> Median household income: $64,427 (top 25%)
[in-text-ad-2]

Source: SeanPavonePhoto / Getty Images
26. Jacksonville, FL
> Total population: 1,534,701
> Pop. growth due to net migration, 2010-2018: +10.4% (+140,382)
> Cost of living: 4.6% less than nat’l avg.
> Median home value: $217,200
> Median household income: $60,238

Source: Sean Pavone / Getty Images
25. Nashville-Davidson–Murfreesboro–Franklin, TN
> Total population: 1,930,961
> Pop. growth due to net migration, 2010-2018: +10.7% (+178,958)
> Cost of living: 4.7% less than nat’l avg.
> Median home value: $261,900 (top 25%)
> Median household income: $65,919 (top 25%)
[in-text-ad]

Source: Sean Pavone / Getty Images
24. San Antonio-New Braunfels, TX
> Total population: 2,518,036
> Pop. growth due to net migration, 2010-2018: +11.2% (+239,501)
> Cost of living: 5.6% less than nat’l avg.
> Median home value: $182,000
> Median household income: $57,379

Source: Sean Pavone / Getty Images
23. Charlotte-Concord-Gastonia, NC-SC
> Total population: 2,569,213
> Pop. growth due to net migration, 2010-2018: +11.3% (+250,067)
> Cost of living: 6.2% less than nat’l avg.
> Median home value: $215,500
> Median household income: $62,068

Source: Warren-Pender / Getty Images
22. Sebring, FL
> Total population: 105,424
> Pop. growth due to net migration, 2010-2018: +11.7% (+11,590)
> Cost of living: 16.8% less than nat’l avg.
> Median home value: $105,800 (bottom 10%)
> Median household income: $39,796 (bottom 10%)
[in-text-ad-2]

Source: DenisTangneyJr / Getty Images
21. Fayetteville-Springdale-Rogers, AR-MO
> Total population: 549,128
> Pop. growth due to net migration, 2010-2018: +11.9% (+55,068)
> Cost of living: 10.6% less than nat’l avg.
> Median home value: $173,600
> Median household income: $57,911
Source: Michael Warren / Getty Images
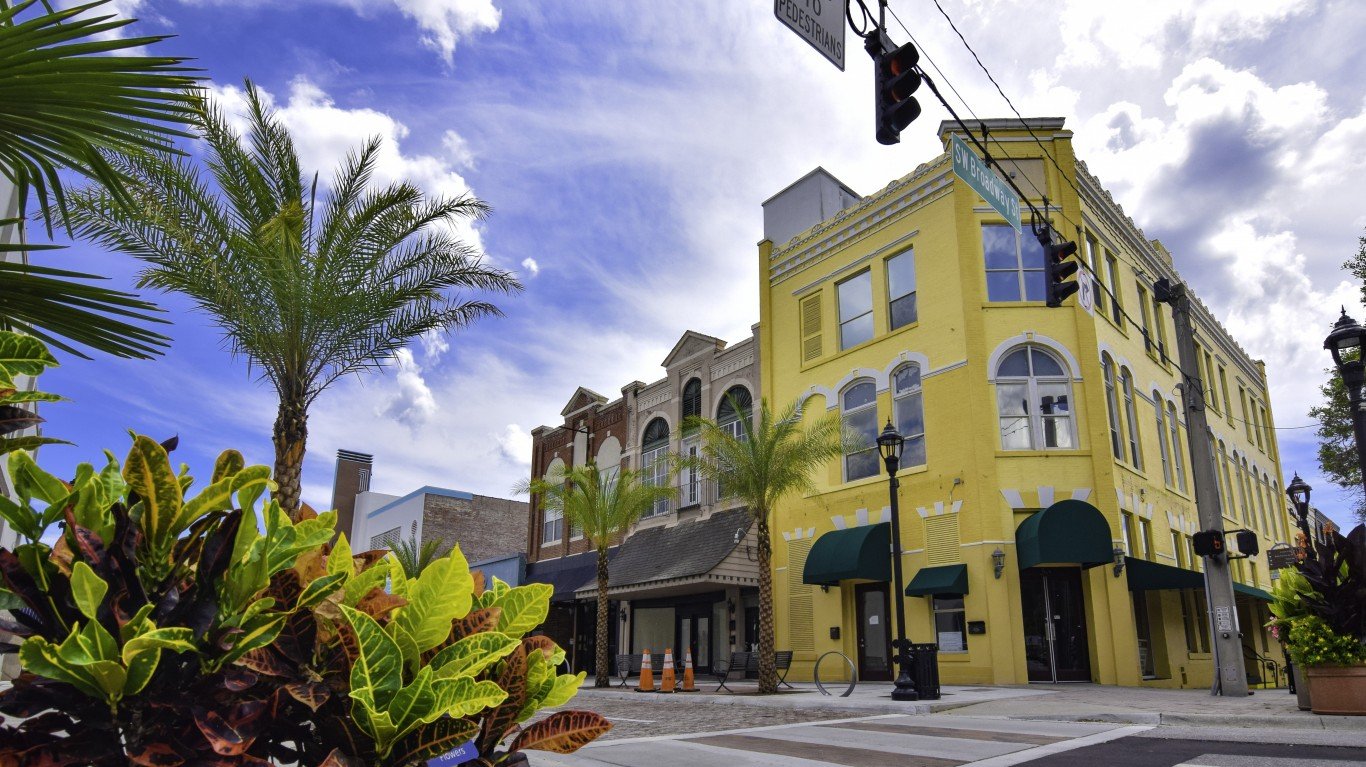
20. Ocala, FL
> Total population: 359,977
> Pop. growth due to net migration, 2010-2018: +11.9% (+39,511)
> Cost of living: 9.5% less than nat’l avg.
> Median home value: $150,600
> Median household income: $44,576 (bottom 10%)
[in-text-ad]
Source: wellesenterprises / Getty Images
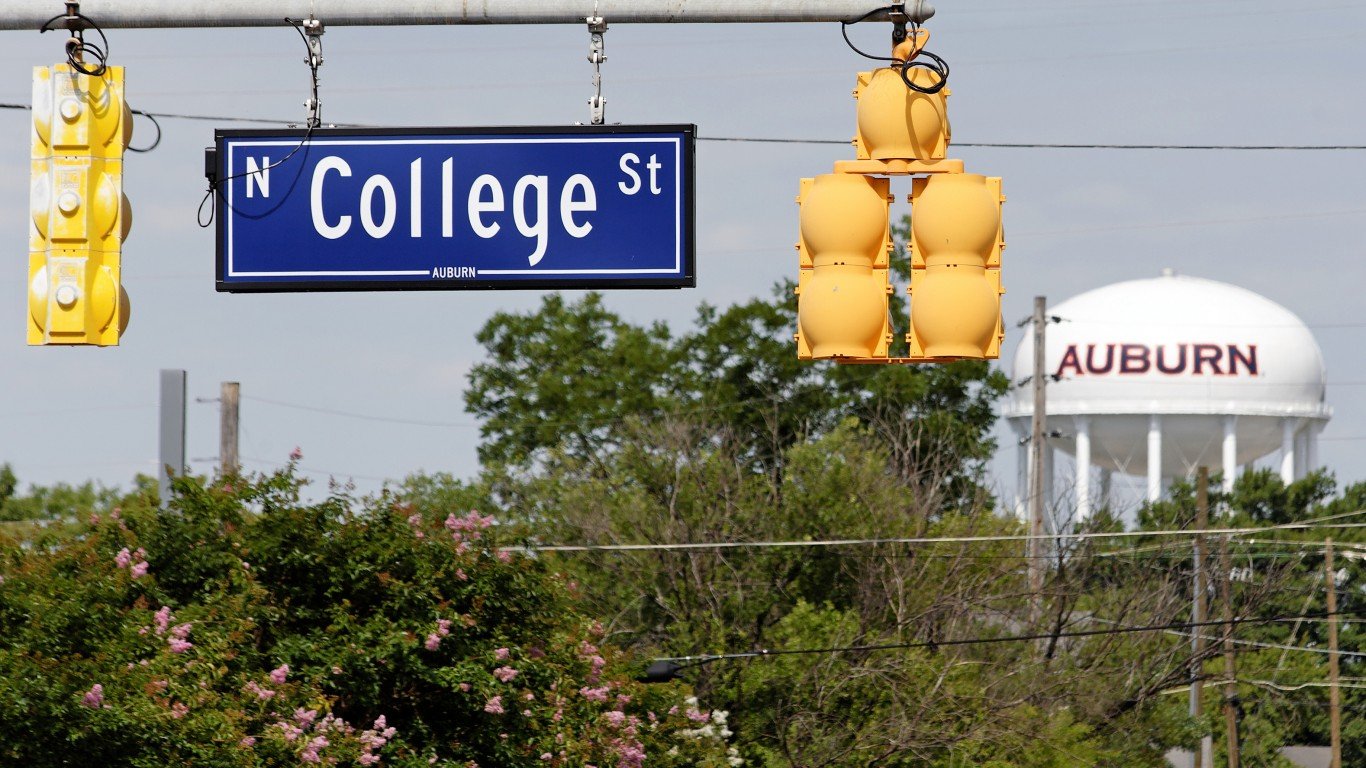
19. Auburn-Opelika, AL
> Total population: 163,941
> Pop. growth due to net migration, 2010-2018: +12.0% (+16,848)
> Cost of living: 15.6% less than nat’l avg.
> Median home value: $182,700
> Median household income: $46,456 (bottom 25%)
 24/7 Wall St.
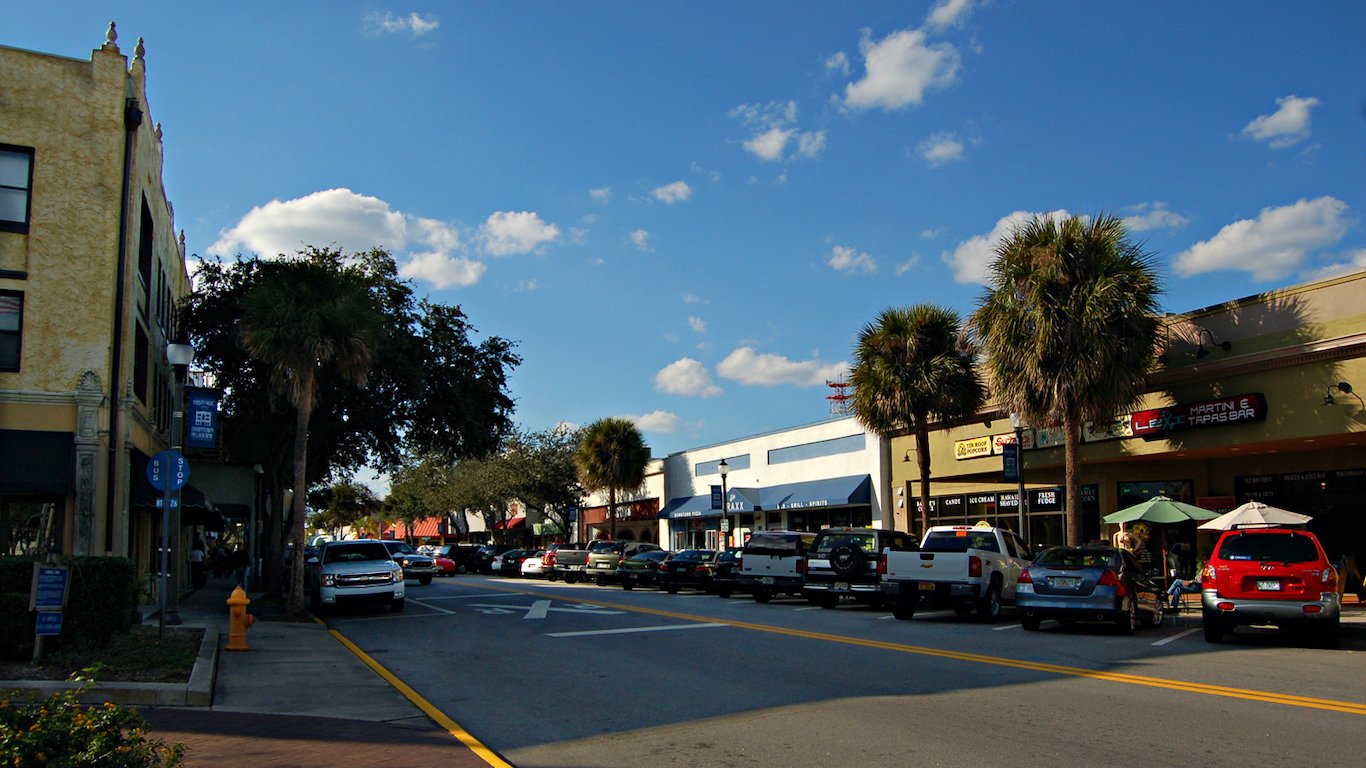
Source: MicheleHaro / Wikimedia Commons
18. Palm Bay-Melbourne-Titusville, FL
> Total population: 596,849
> Pop. growth due to net migration, 2010-2018: +12.3% (+66,747)
> Cost of living: 4.1% less than nat’l avg.
> Median home value: $221,300
> Median household income: $57,888

Source: Sean Pavone / Getty Images
17. Tampa-St. Petersburg-Clearwater, FL
> Total population: 3,142,663
> Pop. growth due to net migration, 2010-2018: +12.4% (+344,163)
> Cost of living: 1.1% less than nat’l avg.
> Median home value: $210,000
> Median household income: $54,912
[in-text-ad-2]

Source: peeterv / Getty Images
16. Boise City, ID
> Total population: 730,426
> Pop. growth due to net migration, 2010-2018: +12.9% (+79,539)
> Cost of living: 5.8% less than nat’l avg.
> Median home value: $264,400 (top 25%)
> Median household income: $61,407

Source: csfotoimages / Getty Images
15. Homosassa Springs, FL
> Total population: 147,929
> Pop. growth due to net migration, 2010-2018: +13.0% (+18,293)
> Cost of living: 13% less than nat’l avg.
> Median home value: $137,600 (bottom 25%)
> Median household income: $39,964 (bottom 10%)
[in-text-ad]

Source: SeanPavonePhoto / Getty Images
14. Charleston-North Charleston, SC
> Total population: 787,643
> Pop. growth due to net migration, 2010-2018: +13.5% (+89,826)
> Cost of living: 3.8% less than nat’l avg.
> Median home value: $252,900 (top 25%)
> Median household income: $64,283 (top 25%)

Source: 8 Fifty Productions / Getty Images
13. Crestview-Fort Walton Beach-Destin, FL
> Total population: 278,644
> Pop. growth due to net migration, 2010-2018: +13.9% (+32,718)
> Cost of living: 5.7% less than nat’l avg.
> Median home value: $238,600
> Median household income: $63,710 (top 25%)

Source: SeanPavonePhoto / Getty Images
12. Raleigh, NC
> Total population: 1,362,540
> Pop. growth due to net migration, 2010-2018: +14.1% (+159,756)
> Cost of living: 3.8% less than nat’l avg.
> Median home value: $267,600 (top 25%)
> Median household income: $75,165 (top 10%)
[in-text-ad-2]
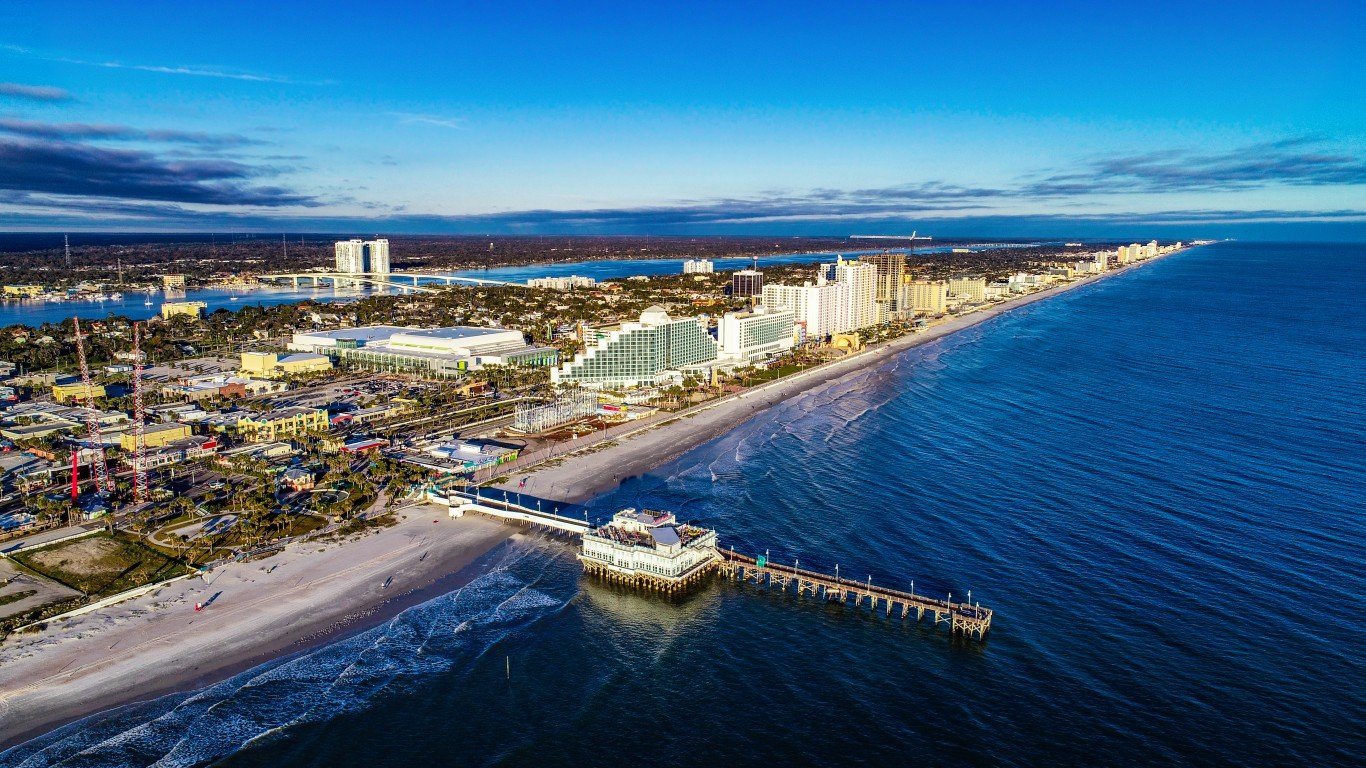
Source: Kruck20 / Getty Images
11. Deltona-Daytona Beach-Ormond Beach, FL
> Total population: 659,605
> Pop. growth due to net migration, 2010-2018: +14.8% (+87,461)
> Cost of living: 4.7% less than nat’l avg.
> Median home value: $199,400
> Median household income: $51,364
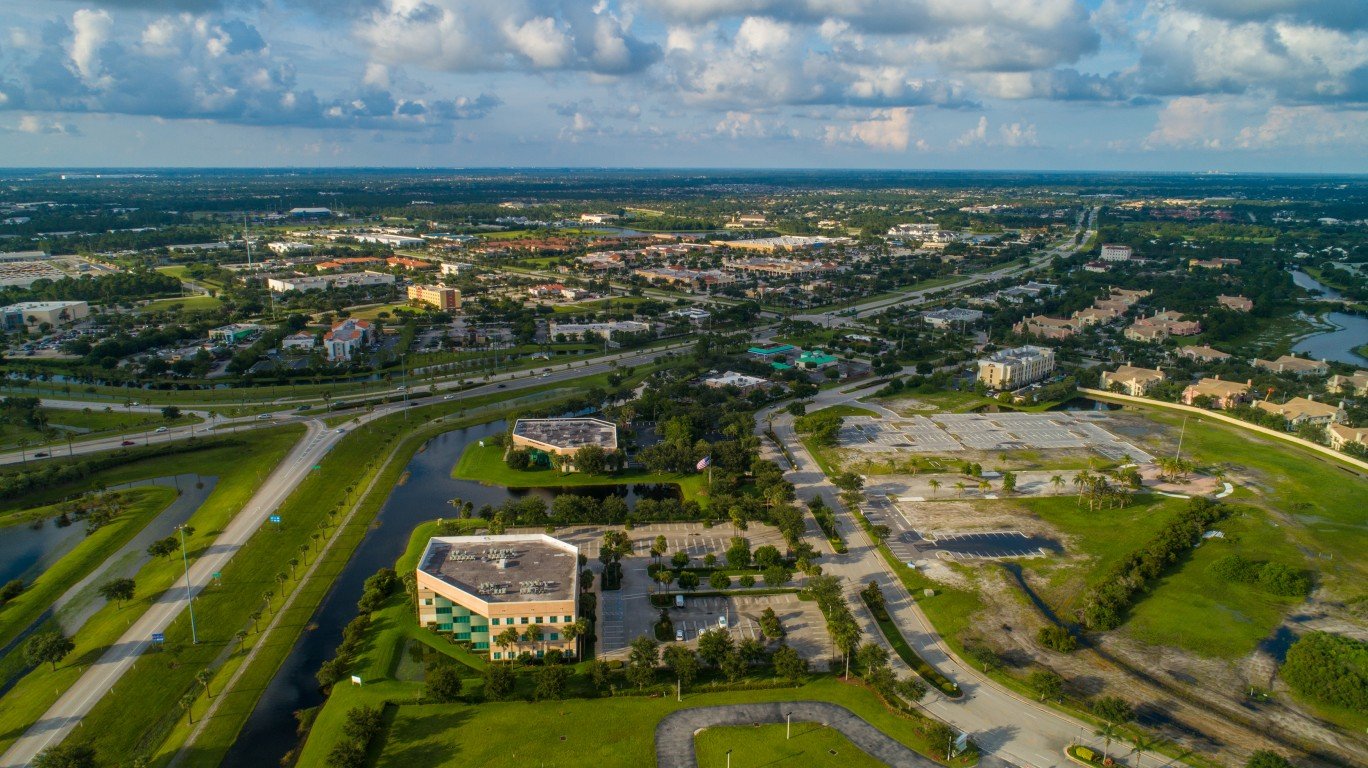
Source: felixmizioznikov / Getty Images
10. Port St. Lucie, FL
> Total population: 482,040
> Pop. growth due to net migration, 2010-2018: +14.8% (+62,896)
> Cost of living: 3% less than nat’l avg.
> Median home value: $233,300
> Median household income: $55,714
[in-text-ad]

Source: RobHainer / Getty Images
9. Lakeland-Winter Haven, FL
> Total population: 708,009
> Pop. growth due to net migration, 2010-2018: +16.0% (+96,548)
> Cost of living: 7% less than nat’l avg.
> Median home value: $161,300
> Median household income: $51,670

Source: LUNAMARINA / Getty Images
8. Orlando-Kissimmee-Sanford, FL
> Total population: 2,572,962
> Pop. growth due to net migration, 2010-2018: +16.1% (+344,022)
> Cost of living: 1.7% less than nat’l avg.
> Median home value: $242,500
> Median household income: $58,610

Source: Bryan Bean / Wikimedia Commons
7. Greeley, CO
> Total population: 314,305
> Pop. growth due to net migration, 2010-2018: +16.3% (+41,180)
> Cost of living: 0.8% less than nat’l avg.
> Median home value: $325,400 (top 10%)
> Median household income: $75,938 (top 10%)
[in-text-ad-2]
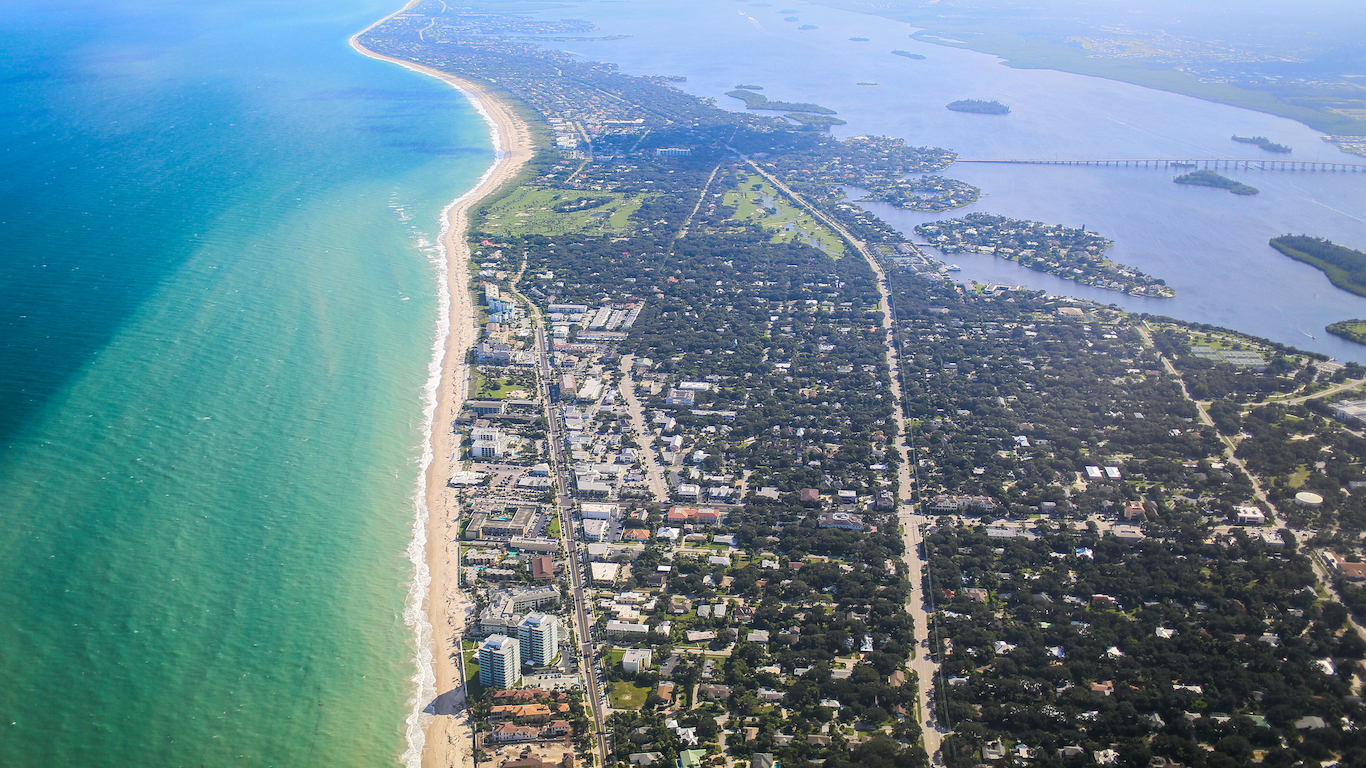
Source: Crystal Bolin Photography / Getty Images
6. Sebastian-Vero Beach, FL
> Total population: 157,413
> Pop. growth due to net migration, 2010-2018: +17.9% (+24,647)
> Cost of living: 8.2% less than nat’l avg.
> Median home value: $220,800
> Median household income: $57,508

Source: George Dodd / Getty Images
5. Daphne-Fairhope-Foley, AL
> Total population: 218,022
> Pop. growth due to net migration, 2010-2018: +18.5% (+33,655)
> Cost of living: 9.2% less than nat’l avg.
> Median home value: $193,800
> Median household income: $56,813
[in-text-ad]
Source: Ryan McGill / Getty Images
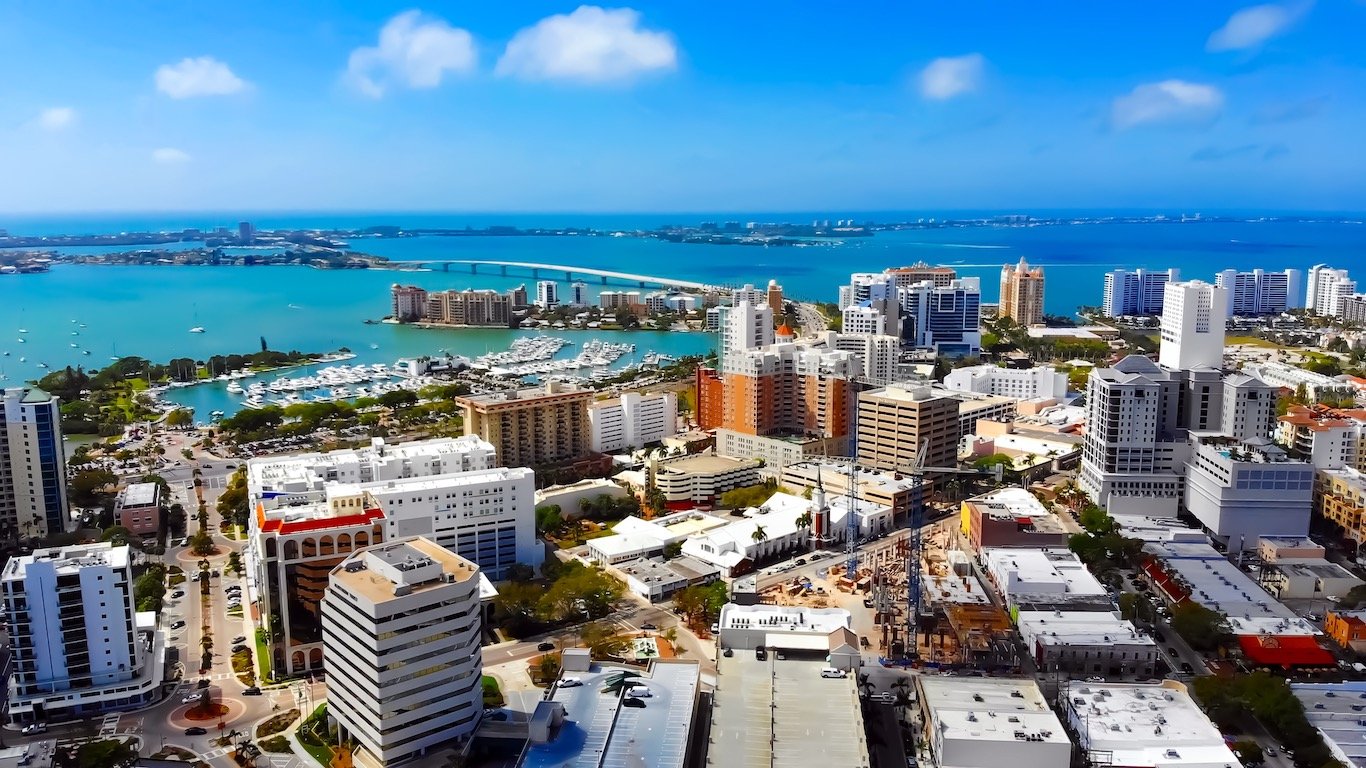
4. North Port-Sarasota-Bradenton, FL
> Total population: 821,573
> Pop. growth due to net migration, 2010-2018: +20.1% (+140,889)
> Cost of living: 0.1% less than nat’l avg.
> Median home value: $257,600 (top 25%)
> Median household income: $60,921

Source: derejeb / Getty Images
3. Cape Coral-Fort Myers, FL
> Total population: 754,610
> Pop. growth due to net migration, 2010-2018: +21.9% (+135,696)
> Cost of living: 3.3% less than nat’l avg.
> Median home value: $235,000
> Median household income: $56,129

Source: Photoladybug / Getty Images
2. Punta Gorda, FL
> Total population: 184,998
> Pop. growth due to net migration, 2010-2018: +22.8% (+36,551)
> Cost of living: 4.5% less than nat’l avg.
> Median home value: $206,600
> Median household income: $52,927
[in-text-ad-2]

Source: Sean Pavone / Getty Images
1. Myrtle Beach-Conway-North Myrtle Beach, SC-NC
> Total population: 480,891
> Pop. growth due to net migration, 2010-2018: +28.0% (+105,460)
> Cost of living: 8.1% less than nat’l avg.
> Median home value: $194,700
> Median household income: $51,580
Methodology
To identify America’s cheapest cities where everyone wants to live, 24/7 Wall St. considered three factors: cost of living, housing affordability, and population growth from migration. Of the 383 U.S. metro areas, we considered only those with a regional price parity — or cost of living — below the national average. Metro areas also had to have a housing affordability ratio — median home value divided by median annual household income — below the average ratio across all metro areas of 4.46. Finally, we ranked the 50 metro areas by the largest population growth due to net migration between 2010 and 2018.
Median household income and median home values are from the 2018 American Community Survey from the U.S. Census Bureau. July 1, 2018 population estimates and population change between 2010 and 2018 are from the Census Bureau’s Population Estimates Program. Regional price parity, or cost of living, is from the Bureau of Economic Analysis.
Percentile ranks for median household income and median home value are provided for context and were calculated against all 383 U.S. metro areas.
Sponsored: Attention Savvy Investors: Speak to 3 Financial Experts – FREE
Ever wanted an extra set of eyes on an investment you’re considering? Now you can speak with up to 3 financial experts in your area for FREE. By simply
clicking here you can begin to match with financial professionals who can help guide you through the financial decisions you’re making. And the best part? The first conversation with them is free.
Click here to match with up to 3 financial pros who would be excited to help you make financial decisions.
Thank you for reading! Have some feedback for us?
Contact the 24/7 Wall St. editorial team.
Editors' Picks