One of the most common measures used for ranking the level of development and wealth of a given country or geography is gross national income adjusted for population — or GNI per capita. And by this measure, the U.S. compares very well to much of the world.
This measure, however, reveals very little about the well-being of the population. In order to address this shortcoming, the United Nations Development Programme designed the Human Development Index, or HDI, which consists of three core concepts of well-being: health, knowledge and education, and financial security.
24/7 Wall St. created its own index using the HDI model in order to rank the best and worst states to live in. Our index consists of three measures: life expectancy at birth, bachelor’s degree attainment, and poverty.
After ranking states based on these criteria, some clear geographic patterns emerge. For example, all but one state in the Northeast ranks among the top 25 states, while nine out of the 10 lowest ranking states on this list are in the South. This is partially the result of higher educational attainment rates in the Northeastern United States — not only was education included in the index, but also better-educated adults tend to have healthier lifestyles and higher incomes, which are reflected in the index’s other measures of poverty and life expectancy. Here is a full ranking of America’s most and least educated states.
The measures used to rank this index tend to correlate strongly with other socioeconomic measures indicative of overall quality of life. For example, the high-ranking states on this list tend to have strong job markets, while low ranking states tend to have higher unemployment rates. Similarly, high-ranking states tend to have relatively low violent crime rates, while the lowest-ranked states tend to be more dangerous. These are America’s most violent and peaceful states.
Click here to see the best and worst states to live in
Click here to read our methodology

Source: DenisTangneyJr / Getty Images
1. Massachusetts
> 10-yr. population change: +4.7% (23rd lowest)
> 2018 unemployment: 3.3% (15th lowest)
> Poverty rate: 10.0% (8th lowest)
> Life expectancy at birth: 80.4 years (8th longest)
Massachusetts ranks as the best state to live in, in part due to its well-educated population. Among state residents age 25 and older, 44.5% have a bachelor’s degree or higher, the highest bachelor’s degree attainment rate of any state. Americans with a college education are generally qualified for a wider range of high-paying jobs, and in Massachusetts, the typical household has an income of nearly $80,000 a year, far more than the median household income nationwide of about $62,000.
Americans with higher incomes tend to have better access to health care and can afford a wider range of options related to diet and lifestyle, and partially as a result they often report better than average health outcomes. In Massachusetts, life expectancy at birth is 80.4 years, over a year longer than the life expectancy of 79.1 years nationwide.
See all stories featuring: Massachusetts
[in-text-ad]

Source: Ron and Patty Thomas / Getty Images
2. Colorado
> 10-yr. population change: +13.4% (7th highest)
> 2018 unemployment: 3.3% (15th lowest)
> Poverty rate: 9.6% (7th lowest)
> Life expectancy at birth: 80.5 years (7th longest)
By several socioeconomic measures indicative of quality of life, Colorado ranks as the second best state to live in in the country. Colorado residents are more likely to live longer, healthier lives and less likely to face serious financial hardship than the typical American. Life expectancy at birth in the state is 80.5 years, compared to the 79.1-year life expectancy nationwide. Additionally, Colorado is one of only seven states where fewer than one in every 10 residents live below the poverty line.
Further evidence of the generally high quality of life in the state is its growing popularity as a place to live. In the last decade, Colorado’s population has grown by 13.4%, faster than all but six other states.
See all stories featuring: Colorado
 24/7 Wall St.
Source: DenisTangneyJr / Getty Images
3. New Jersey
> 10-yr. population change: +2.3% (12th lowest)
> 2018 unemployment: 4.1% (15th highest)
> Poverty rate: 9.5% (5th lowest)
> Life expectancy at birth: 80.5 years (6th longest)
Along with Massachusetts and Connecticut, New Jersey is one of three states in the Northeast to rank among the five best states to live in. Like those other states, New Jersey has a well-educated population, with a bachelor’s degree attainment rate of 40.8%, well above the comparable national rate of 32.6%. New Jersey is also a relatively prosperous state, with a median annual household income of $81,740 — nearly $20,000 more than the national median.
Like most of the best states to live in, New Jersey is relatively safe. There were just 208 violent crimes for every 100,000 people in New Jersey in 2018, well below the national violent crime rate of 369 per 100,000.
See all stories featuring: New Jersey

Source: Art Wager / Getty Images
4. Hawaii
> 10-yr. population change: +9.7% (11th highest)
> 2018 unemployment: 2.4% (the lowest)
> Poverty rate: 8.8% (2nd lowest)
> Life expectancy at birth: 82.2 years (the longest)
People living in Hawaii are less likely to face serious financial hardship than the vast majority of Americans. Just 8.8% of state residents live below the poverty line, the smallest share of any state other than New Hampshire, and well below the national poverty rate of 13.1%. The state’s relative prosperity is likely due in part to its strong job market. An average of just 2.4% of Hawaii’s labor force was out of work in 2018, the lowest unemployment rate among states and well below the 3.9% national rate.
Hawaii is also growing rapidly in terms of population. In the last decade, the number of people living in the state climbed by 9.7%, outpacing the 6.6% national population growth rate.
See all stories featuring: Hawaii
[in-text-ad-2]

Source: enfi / Getty Images
5. Connecticut
> 10-yr. population change: +1.5% (10th lowest)
> 2018 unemployment: 4.1% (15th highest)
> Poverty rate: 10.4% (10th lowest)
> Life expectancy at birth: 80.8 years (5th longest)
Along with Massachusetts, Connecticut is one of two states in the New England region to rank among the top five states to live. One of the wealthiest states in the country, Connecticut’s median annual household income of $76,348 is about $14,400 higher than national median. Incomes tend to rise with educational attainment, and indeed Connecticut has a relatively well-educated population. Some 39.6% of adults in the state have a bachelor’s degree or higher, compared to just 32.6% of adults nationwide.
Connecticut residents also tend to be healthier than most Americans, as evidenced by the state’s high average life expectancy. Life expectancy at birth is 80.8 years, over a year and a half longer than the national life expectancy of 79.1 years.
See all stories featuring: Connecticut

Source: culbertson / Getty Images
6. Minnesota
> 10-yr. population change: +6.6% (23rd highest)
> 2018 unemployment: 2.9% (8th lowest)
> Poverty rate: 9.6% (7th lowest)
> Life expectancy at birth: 80.9 years (4th longest)
Minnesota is the only Midwestern state to rank among the 10 best places to live. Its high ranking is attributable in part to its well-educated population. Some 93.4% of adults in the state have completed high school, and 36.7% have earned a bachelor’s degree, each a higher share than the respective educational attainment rates nationwide of 88.3% and 32.6%.
Serious financial hardship is also relatively uncommon in Minnesota. The state is one of only seven where fewer than one in every 10 residents live below the poverty line. The state’s relative prosperity is due in part to a strong economy and job market. The state’s annual unemployment rate of just 2.9% is well below the 3.9% national rate.
See all stories featuring: Minnesota
[in-text-ad]

Source: SeanPavonePhoto / Getty Images
7. Maryland
> 10-yr. population change: +6.0% (25th highest)
> 2018 unemployment: 3.9% (21st highest)
> Poverty rate: 9.0% (4th lowest)
> Life expectancy at birth: 79.2 years (24th longest)
With a median household income of $83,242, Maryland is the wealthiest state in the country. The state also has the fourth lowest poverty rate. Just 9.0% of Maryland residents live below the poverty line, well below the U.S. poverty rate of 13.1%.
Incomes tend to rise with educational attainment, and Maryland has one of the best-educated populations of any state. Some 40.8% of adults 25 and older in Maryland have a bachelor’s degree or higher, compared to 32.6% of adults nationwide.
See all stories featuring: Maryland

Source: DenisTangneyJr / Getty Images
8. New Hampshire
> 10-yr. population change: +2.4% (14th lowest)
> 2018 unemployment: 2.5% (3rd lowest)
> Poverty rate: 7.6% (the lowest)
> Life expectancy at birth: 79.5 years (19th longest)
New Hampshire residents are more likely to be healthy and financially secure than those living in the vast majority of other states. The state’s poverty rate of 7.6% is the lowest among states, and life expectancy at birth in New Hampshire is 79.5 years, nearly half a year longer than life expectancy across the U.S. as a whole.
Americans with a college education are more likely to lead healthy lives and earn higher incomes than those with less educational attainment. In New Hampshire, 36.8% of adults have a bachelor’s degree or higher, compared to 32.6% of adults nationwide.
See all stories featuring: New Hampshire
Source: 4nadia / Getty Images
9. Washington
> 10-yr. population change: +13.1% (8th highest)
> 2018 unemployment: 4.5% (9th highest)
> Poverty rate: 10.3% (9th lowest)
> Life expectancy at birth: 80.3 years (9th longest)
Along with Colorado and Hawaii, Washington is one of three states in the West to rank among the best places to live. One of the healthiest states in the country, Washington has a life expectancy at birth of 80.3 years, over a year longer than the national average. Better-educated Americans typically report healthier lifestyles and better health outcomes, and in Washington, the high average life expectancy may be partially attributable to the high educational attainment. Among state residents 25 and older, 36.7% have at least a bachelor’s degree, compared to 32.6% of adults nationwide.
Like most high-ranking states on this list, Washington had a rapidly-growing population. In the last decade, the state’s population grew by 13.1%, nearly double the 6.6% national growth rate.
See all stories featuring: Washington
[in-text-ad-2]

Source: Sean Pavone / Getty Images
10. Virginia
> 10-yr. population change: +8.1% (17th highest)
> 2018 unemployment: 3.0% (11th lowest)
> Poverty rate: 10.7% (12th lowest)
> Life expectancy at birth: 79.4 years (21st longest)
Virginia has one of the highest college degree attainment rates in the country. Of adults 25 and older living in the state, 39.3% have a bachelor’s degree or higher, well above the 32.6% national bachelor’s degree attainment rate. Adults with higher educational attainment are more likely to earn high salaries and less likely to be unemployed — and the high educational attainment may help explain the state’s low poverty rate. Just 10.7% of Virginians live below the poverty line, well below the 13.1% national poverty rate.
Like most of the best states to live in, Virginia is a relatively safe state. There were only 200 violent crimes reported for every 100,000 state residents in 2018, nearly the lowest rate of any state. Meanwhile, the national violent crime rate stands at 369 incidents per 100,000 people.
See all stories featuring: Virginia

Source: CodyHaskell / Getty Images
11. Utah
> 10-yr. population change: +13.5% (5th highest)
> 2018 unemployment: 3.1% (12th lowest)
> Poverty rate: 9.0% (4th lowest)
> Life expectancy at birth: 79.8 years (14th longest)
Supported by a strong economy and lower than average 3.1% annual unemployment rate, serious financial hardship is uncommon in Utah. Just 9.0% of state residents live below the poverty line, a lower poverty rate than in all but three other states and well below the national rate of 13.1%.
Utah’s desirability as a place to live is underscored by its surging population. In the last decade, the number of people living in the state spiked by 13.5%, more than double the national population growth rate of 6.6%.
See all stories featuring: Utah
[in-text-ad]

Source: Sean Pavone / Getty Images
12. Vermont
> 10-yr. population change: +0.7% (6th lowest)
> 2018 unemployment: 2.7% (5th lowest)
> Poverty rate: 11.0% (16th lowest)
> Life expectancy at birth: 79.7 years (15th longest)
Outranking New York, which lies along its western border, Vermont ranks as the 12th best state to live in. Like most other states in the New England region, Vermont has a well-educated population. The state’s 38.7% bachelor’s degree attainment rate is among the highest in the country and well above the 32.6% share of adults nationwide with a bachelor’s degree.
Vermonters also tend to be relatively healthy. They are less likely to lead sedentary lives and also less likely to be obese than the typical American adult. The prevalence of healthy lifestyles may help explain the state’s higher than average life expectancy. Life expectancy at birth in Vermont is 79.7 years, compared to the 79.1-year average national life expectancy.
See all stories featuring: Vermont

Source: spyarm / Getty Images
13. New York
> 10-yr. population change: 0.0% (3rd lowest)
> 2018 unemployment: 4.1% (15th highest)
> Poverty rate: 13.6% (17th highest)
> Life expectancy at birth: 81.2 years (3rd longest)
New York is one of the best educated states in the country. Some 37.2% of adults across the state have a bachelor’s degree or higher, a higher share than in all but seven other states and considerably higher than the 32.6% bachelor’s degree attainment rate nationwide. Better-educated adults tend to report healthier lifestyles, which may explain some of the positive health outcomes in the state. For example, life expectancy at birth in New York is 81.2 years, the third highest among states and over two years longer than the national average.
See all stories featuring: New York

Source: miroslav_1 / Getty Images
14. California
> 10-yr. population change: +7.0% (21st highest)
> 2018 unemployment: 4.2% (13th highest)
> Poverty rate: 12.8% (25th highest)
> Life expectancy at birth: 81.5 years (2nd longest)
California is one of the healthiest states in the country. Life expectancy at birth in the state is 81.5 years, second only to Hawaii and about two and a half years longer than the national average. Adults in California are far more likely than the typical American adult to regularly be physically active, likely due in part to easy access to places like parks and recreation centers. Nearly 93% of Californians have easy access to such venues for physical activity, compared to just 84% of adults nationwide.
See all stories featuring: California
[in-text-ad-2]

Source: Davel5957 / Getty Images
15. Nebraska
> 10-yr. population change: +7.4% (19th highest)
> 2018 unemployment: 2.8% (7th lowest)
> Poverty rate: 11.0% (16th lowest)
> Life expectancy at birth: 79.5 years (17th longest)
Along with Minnesota, which ranks sixth on this list, Nebraska is one of only two states in the Midwest to rank among the top 15 best places to live. Although Nebraska is not a particularly wealthy state — the median household income of $59,566 is about $2,000 less than the national median — serious financial hardship is less common in the state than it is nationwide. Just 11.0% of state residents live below the poverty line compared to 13.1% of Americans nationwide.
Nebraskans tend to live longer, healthier lives than the typical American. The average life expectancy at birth in the state is 79.5 years, compared to the national average of 79.1 years.
See all stories featuring: Nebraska

Source: Sean Pavone / Getty Images
16. Illinois
> 10-yr. population change: -1.3% (the lowest)
> 2018 unemployment: 4.3% (10th highest)
> Poverty rate: 12.1% (22nd lowest)
> Life expectancy at birth: 79.3 years (23rd longest)
Illinois is a relatively well-educated state. Of all state residents 25 and older, 35.1% have a bachelor’s degree or higher, a larger share than the 32.6% share of adults nationwide. As educational attainment increases, incomes and job security typically do as well. This may partially explain the relatively low poverty rate of 12.1% in Illinois, which is lower than the 13.1% national poverty rate.
Unlike nearly every other state, Illinois has reported a population decline in recent years. There are 1.3% fewer people living in the state now than there were a decade ago, the largest population drop of any state. The only other state to report a population decline over the same period is West Virginia, which ranks as the second worst state to live in.
See all stories featuring: Illinois
[in-text-ad]

Source: Meybruck / Getty Images
17. Rhode Island
> 10-yr. population change: +0.4% (5th lowest)
> 2018 unemployment: 4.1% (15th highest)
> Poverty rate: 12.9% (23rd highest)
> Life expectancy at birth: 79.8 years (13th longest)
Though it ranks among the 20 best states to live in, Rhode Island trails far behind its neighbors Connecticut and Massachusetts on this list. Rhode Island’s poverty rate of 12.9% — while lower than the national rate of 13.1% — is the highest of the six New England states. Similarly, Maine is the only state in the region with a lower bachelor’s degree attainment rate than the 34.4% rate in Rhode Island.
Rhode Island, however, has an average life expectancy higher than most states in the region. Life expectancy at birth in Rhode Island is 79.8 years, slightly lower than the life expectancy of over 80 years in Connecticut and Massachusetts, but well above the 79.1-year national average.
See all stories featuring: Rhode Island

Source: svetlana57 / Getty Images
18. Oregon
> 10-yr. population change: +9.5% (12th highest)
> 2018 unemployment: 4.2% (13th highest)
> Poverty rate: 12.6% (25th lowest)
> Life expectancy at birth: 79.6 years (16th longest)
Oregon ranks behind the other two states along the Pacific coast in the continental U.S. Though the bachelor’s degree attainment rate of 34.0% in the state is larger than the 32.6% rate nationwide, it lags slightly behind educational attainment rates in the neighboring states of Washington and California.
Like other states in the region, Oregon is growing rapidly in terms of population. In the last decade, the number of people living in the state climbed by 9.5%, well above the 6.6% national population growth rate over the same period.
See all stories featuring: Oregon

Source: gabetcarlson / Getty Images
19. North Dakota
> 10-yr. population change: +17.5% (the highest)
> 2018 unemployment: 2.6% (4th lowest)
> Poverty rate: 10.7% (12th lowest)
> Life expectancy at birth: 79.8 years (12th longest)
Just 29.7% of adults in North Dakota have a bachelor’s degree, a smaller share than the 32.6% of adults nationwide. Job security tends to rise with educational attainment, but despite the low bachelor’s degree attainment rate, North Dakota’s 2.6% annual unemployment rate is among the lowest of any state.
The strong job market may explain the state’s rapid population growth and relative lack of serious financial hardship. In the last decade, the state’s population surged by 17.5%, the most of any state. Additionally, just 10.7% of North Dakota residents live below the poverty line, well below the 13.1% national poverty rate.
See all stories featuring: North Dakota
[in-text-ad-2]
Source: Sean Pavone / Getty Images
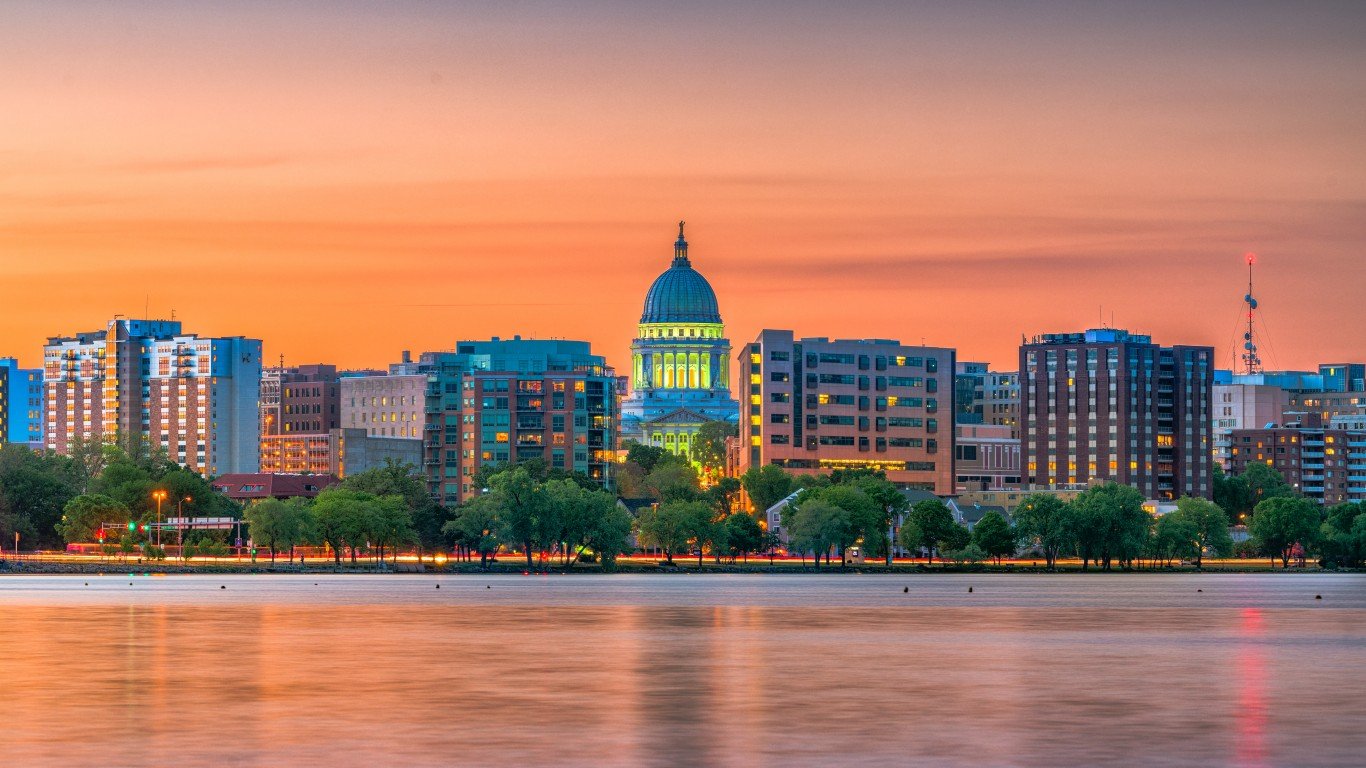
20. Wisconsin
> 10-yr. population change: +2.8% (15th lowest)
> 2018 unemployment: 3.0% (11th lowest)
> Poverty rate: 11.0% (16th lowest)
> Life expectancy at birth: 79.5 years (18th longest)
Just 30.0% of adults in Wisconsin have a bachelor’s degree or higher, a slightly smaller share than the 32.6% share of adults nationwide.
Higher educational attainment typically leads to higher incomes and increased job security. But despite Wisconsin’s smaller than average college-educated population, both unemployment and poverty are relatively uncommon in the state. Just 3.0% of workers in the state were unemployed in 2018, and 11.0% of the state’s population live below the poverty line, compared to the respective national rates of 3.9% and 13.1%.
See all stories featuring: Wisconsin

Source: RudyBalasko / Getty Images
21. Kansas
> 10-yr. population change: +3.3% (16th lowest)
> 2018 unemployment: 3.4% (20th lowest)
> Poverty rate: 12.0% (21st lowest)
> Life expectancy at birth: 78.6 years (23rd shortest)
Kansas is the highest ranking state with a below average life expectancy. Life expectancy at birth in Kansas is 78.6 years, compared to the national life expectancy of 79.1 years.
In other measures, Kansas also has some advantages over the nation as a whole. For example, just 12.0% of state residents live below the poverty line, compared to the 13.1% U.S. poverty rate. Similarly, Kansas’s bachelor’s degree attainment rate of 33.8% is slightly higher than the 32.6% national rate.
See all stories featuring: Kansas
[in-text-ad]

Source: Ron_Thomas / Getty Images
22. Iowa
> 10-yr. population change: +4.9% (24th lowest)
> 2018 unemployment: 2.5% (3rd lowest)
> Poverty rate: 11.2% (18th lowest)
> Life expectancy at birth: 79.5 years (20th longest)
Just 29% of adults in Iowa have a bachelor’s degree, a smaller share than the share of 32.6% of adults nationwide. Incomes typically rise with educational attainment, and in Iowa, the typical household earns $59,955 a year — slightly less than the national median household income of $61,937. Still, Iowa residents are less likely to face serious financial hardship as the state’s 11.2% poverty rate is slightly lower than the 13.1% national rate.
Iowans are also more likely than most Americans to lead long, healthy lives. Life expectancy at birth in the state is 79.5 years, slightly higher than the national average of 79.1 years.
See all stories featuring: Iowa

Source: SeanPavonePhoto / Getty Images
23. Maine
> 10-yr. population change: +1.5% (9th lowest)
> 2018 unemployment: 3.4% (20th lowest)
> Poverty rate: 11.6% (19th lowest)
> Life expectancy at birth: 78.6 years (22nd shortest)
Maine, which ranks towards the middle of all 50 states on this list, is the lowest ranked state in New England. It is the only state in the region with a lower bachelor’s degree attainment rate than the U.S. as a whole. Just 31.5% adults in Maine have completed four years of college, compared to 32.6% of American adults nationwide. Better-educated adults are more likely to report healthy lifestyles and better health outcomes than average. In Maine, life expectancy at birth is 78.6 years, about six months fewer than the national average life expectancy and the lowest of any New England state.
Still, Maine does not lag behind all of its regional neighbors in every measure used to gauge quality of life. Maine’s 11.6% poverty rate is lower than both the rate of 12.9% in Rhode Island and the rate of 13.1% nationwide.
See all stories featuring: Maine

Source: urbanglimpses / Getty Images
24. Alaska
> 10-yr. population change: +5.6% (25th lowest)
> 2018 unemployment: 6.6% (the highest)
> Poverty rate: 10.9% (13th lowest)
> Life expectancy at birth: 78.5 years (19th shortest)
Americans with a four-year college degree are more likely to report higher incomes and be financially secure than those with lower educational attainment. In Alaska, 30.2% of adults have a bachelor’s degree, a smaller share than the share of 32.6% of adults nationwide. Despite the lower educational attainment, Alaska’s 10.9% poverty rate is below the 13.1% national average.
Joblessness is more of a problem in Alaska than in any other state. In 2018, an average of 6.6% of the labor force was out of work, the highest unemployment rate among states and well above the 3.9% national unemployment rate.
See all stories featuring: Alaska
[in-text-ad-2]

Source: marchello74 / Getty Images
25. Florida
> 10-yr. population change: +14.9% (3rd highest)
> 2018 unemployment: 3.6% (22nd lowest)
> Poverty rate: 13.6% (17th highest)
> Life expectancy at birth: 80.0 years (10th longest)
Floridians are less likely to have a college education and more likely to face serious financial hardship than the typical American. Just 30.4% of adults in the state have a bachelor’s degree or higher, and 13.6% of state residents live below the poverty line — compared to the national shares of 32.6% and 13.1%, respectively.
Still, the state ranks better than most in terms of life expectancy. Life expectancy at birth is 80 years in Florida, nearly a full-year longer than the national average. Florida is also one of the fastest growing states in the country in terms of population. In the last decade, the number of people living in the Sunshine State climbed by 14.9%, more than double the 6.6% national population growth rate.
See all stories featuring: Florida

Source: SeanPavonePhoto / iStock
26. Pennsylvania
> 10-yr. population change: +1.6% (11th lowest)
> 2018 unemployment: 4.3% (10th highest)
> Poverty rate: 12.2% (23rd lowest)
> Life expectancy at birth: 78.3 years (17th shortest)
Average life expectancy at birth in Pennsylvania is just 78.3 years, nearly a year short of the national average life expectancy of 79.1 years. Adults with a college education are more likely to lead healthier lifestyles and report better health outcomes, and the lower than average life expectancy in Pennsylvania may be tied in part to the lower educational attainment in the state. Some 31.8% of adults in Pennsylvania have a bachelor’s degree compared to 32.6% of American adults.
Slow population growth in a state can be a sign that state is a relatively less desirable place to live compared to its neighbors. In the last decade, the number of people living in Pennsylvania climbed by only 1.6% while the U.S. population grew by 6.6% over the same period.
See all stories featuring: Pennsylvania
[in-text-ad]

Source: CodyHaskell / Getty Images
27. Idaho
> 10-yr. population change: +13.5% (6th highest)
> 2018 unemployment: 2.8% (7th lowest)
> Poverty rate: 11.8% (20th lowest)
> Life expectancy at birth: 79.4 years (22nd longest)
Idaho has one of the lower bachelor’s degree attainment rates among states. Just 27.7% of adults in Idaho have a bachelor’s degree or higher, well below the share of 32.6% of adults nationwide.
Americans with higher educational attainment typically report better health outcomes and higher incomes. Despite the lower bachelor’s degree attainment rate, Idaho residents are less likely to live in poverty and more likely to live longer than the typical American. The state’s 11.8% poverty rate is below the 13.6% national poverty rate, and life expectancy at birth in the state is 79.4 years, slightly higher than the national average of 79.1 years.
See all stories featuring: Idaho

Source: Harry Collins / Getty Images
28. Delaware
> 10-yr. population change: +9.3% (13th highest)
> 2018 unemployment: 3.8% (25th lowest)
> Poverty rate: 12.5% (24th lowest)
> Life expectancy at birth: 78.6 years (21st shortest)
Delaware residents are more likely to be less healthy than the typical American. The average life expectancy at birth in Delaware in 78.6 years, about six months below the national average. State residents are more likely to be financially secure, however, as Delaware’s poverty rate of 12.5% is slightly lower than the national rate of 13.6%.
In recent years, Delaware has reported a faster growing population than most states. Over the last decade, the number of people living in the state has climbed by 9.3%, far faster than the 6.6% national population growth over the same period.
See all stories featuring: Delaware
Source: Davel5957 / Getty Images
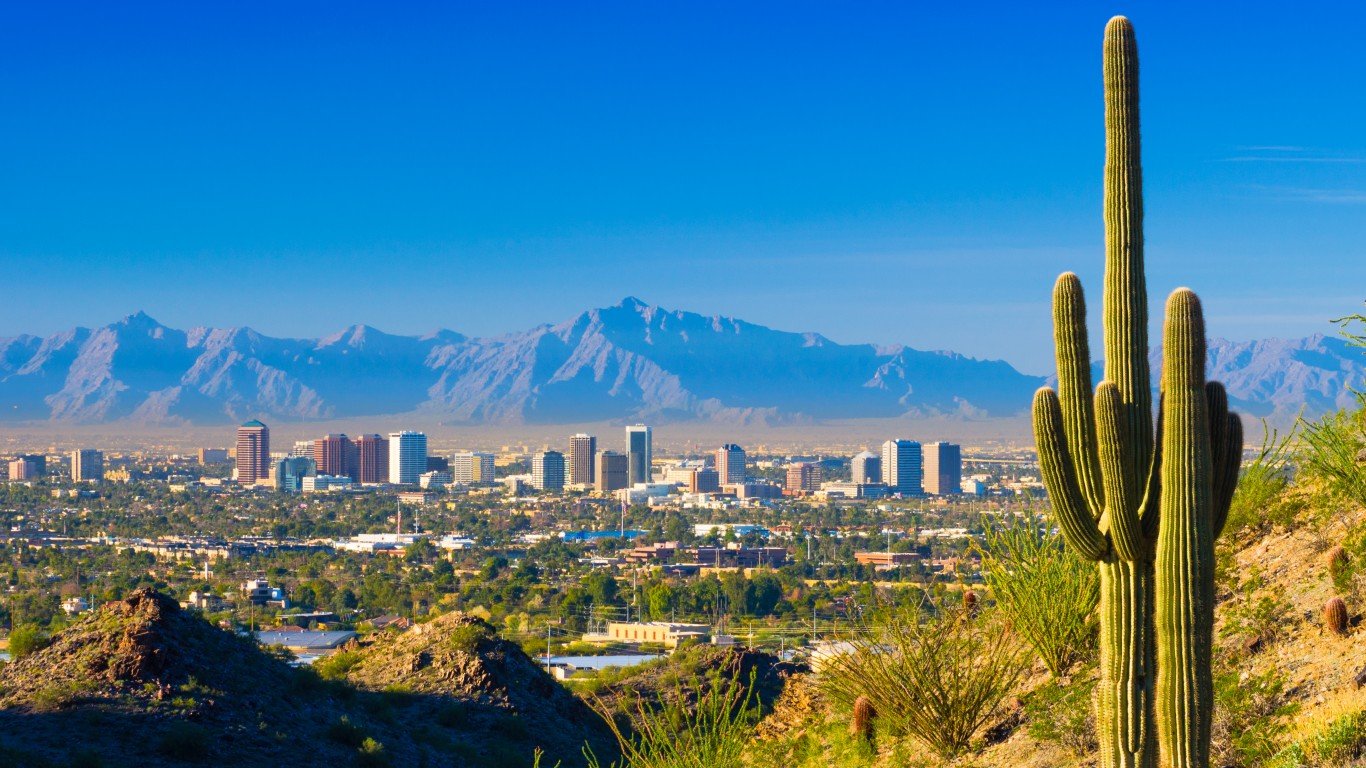
29. Arizona
> 10-yr. population change: +8.7% (15th highest)
> 2018 unemployment: 4.8% (5th highest)
> Poverty rate: 14.0% (14th highest)
> Life expectancy at birth: 79.9 years (11th longest)
The Arizona population appears to be healthier in general than the U.S. population as a whole. The average life expectancy at birth in the state is 79.9 years, longer than the national average of 79.1 years.
Many in the state, however, are likely suffering financially due to the relatively weak job market. Arizona’s annual unemployment rate of 4.8% is well above the comparable national rate of 3.9%. The lack of jobs is likely contributing to the state’s higher than average poverty rate. Some 14.0% of Arizona residents live below the poverty line, compared to 13.1% of Americans nationwide.
See all stories featuring: Arizona
[in-text-ad-2]

Source: aoldman / Getty Images
30. Wyoming
> 10-yr. population change: +6.1% (24th highest)
> 2018 unemployment: 4.1% (15th highest)
> Poverty rate: 11.1% (17th lowest)
> Life expectancy at birth: 79.0 years (24th shortest)
Population growth can be indicative of how attractive a state is to potential new residents and those looking to start a family. The number of people living in Wyoming climbed by 6.1% over the last 10 years, a slower pace than the 6.6% national population growth rate over that time.
Wyoming’s job market is relatively weak. An average of 4.1% of the labor force was unemployed in 2018, compared to the national annual unemployment rate of 3.9%. Despite the relative lack of employment opportunities, Wyoming residents are more likely to be financially secure than the typical American. Just 11.1% of Wyoming residents live below the poverty line, a smaller share than in most states and below the 13.1% national poverty rate.
See all stories featuring: Wyoming
Source: Tashka / Getty Images
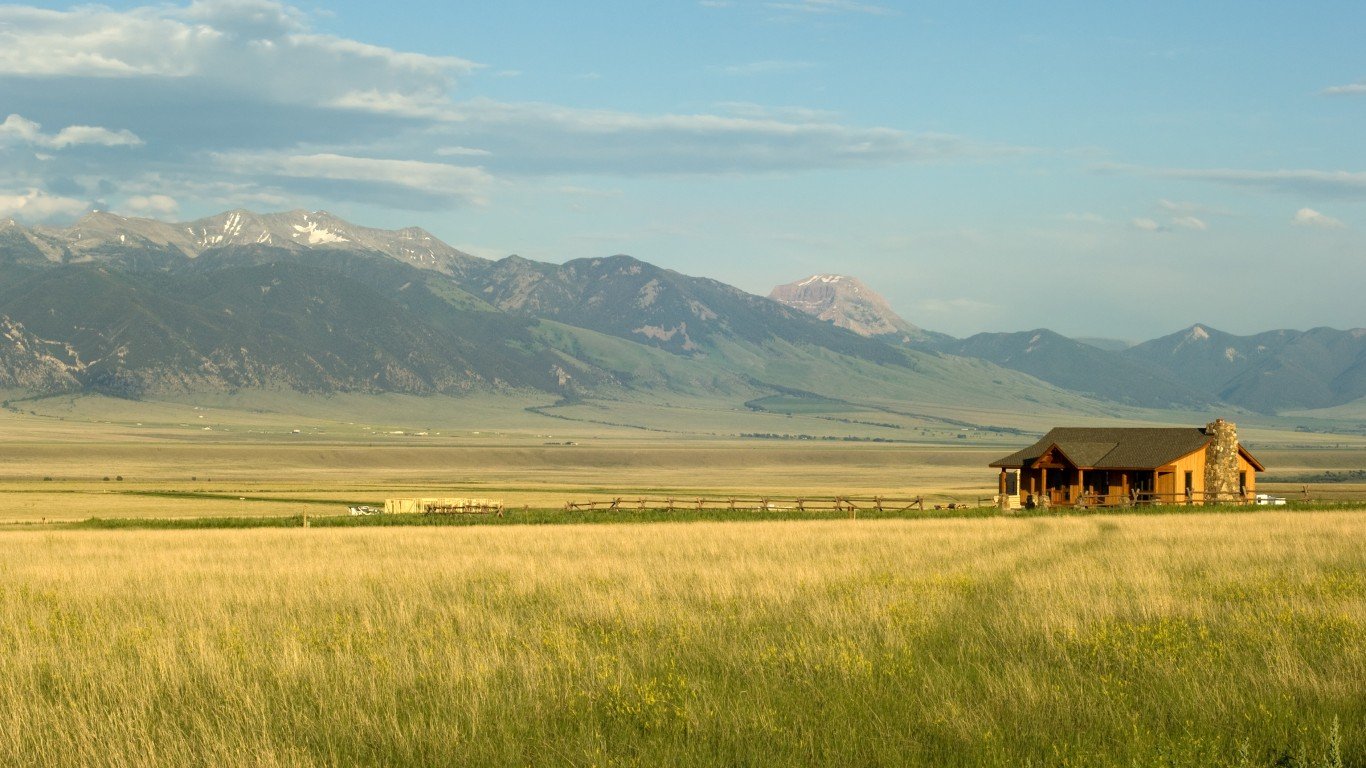
31. Montana
> 10-yr. population change: +9.0% (14th highest)
> 2018 unemployment: 3.7% (24th lowest)
> Poverty rate: 13.0% (22nd highest)
> Life expectancy at birth: 78.5 years (20th shortest)
Serious financial hardship is about as common in Montana as it is nationwide. Across the state, 13.0% of residents live below the poverty line, compared to 13.1% of Americans nationwide. While people in Montana are about as likely to be financially secure as the typical American, they are slightly less likely to live as long. Life expectancy at birth in the state is 78.5 years, about six months shy of the national average.
Population growth can be indicative of how attractive a state is to potential new residents and those looking to start a family — and Montana is growing faster than most states. In the last decade, the number of people living in the state climbed by 9.0%, outpacing the comparable 6.6% U.S. population growth.
See all stories featuring: Montana
[in-text-ad]

Source: KenCanning / Getty Images
32. South Dakota
> 10-yr. population change: +8.6% (16th highest)
> 2018 unemployment: 3.0% (11th lowest)
> Poverty rate: 13.1% (20th highest)
> Life expectancy at birth: 79.0 years (25th shortest)
Just 29.2% of adults in South Dakota have a bachelor’s degree, below the 32.6% national average. Incomes tend to rise with educational attainment, and the typical household in South Dakota earns $56,274 a year, well below the national median household income of $61,937. Despite the lower median income, South Dakota’s 13.1% poverty rate is exactly in line with the national rate. Similarly, at 79.0 years, life expectancy in South Dakota is also closely aligned with the average nationwide of 79.1 years.
See all stories featuring: South Dakota
 24/7 Wall St.
Source: SeanPavonePhoto / Getty Images
33. North Carolina
> 10-yr. population change: +10.7% (10th highest)
> 2018 unemployment: 3.9% (21st highest)
> Poverty rate: 14.0% (14th highest)
> Life expectancy at birth: 78.0 years (14th shortest)
North Carolina’s population growth of over 10% over the past decade is relatively high for a state that ranks just outside of the bottom third on this list. The state’s poverty rate and life expectancy each ranks 14th worst in the nation. The state’s adult bachelor’s attainment rate, at 31.9%, compares slightly better, likely in part due to the presence of the research triangle, the cluster of major universities and research institutions in the Raleigh-Durham-Chapel Hill region.
The state ranks close to, or slightly worse than the national average in a number of other socioeconomic measures, including unemployment, violent crime, and the share of residents without health insurance coverage.
See all stories featuring: North Carolina

Source: SeanPavonePhoto / Getty Images
34. Texas
> 10-yr. population change: +15.8% (2nd highest)
> 2018 unemployment: 3.9% (21st highest)
> Poverty rate: 14.9% (11th highest)
> Life expectancy at birth: 79.0 years (25th longest)
Many places that rank poorly for overall quality of life tend to have declining populations, which can be indicative of their lower desirability as a place to live. Texas is perhaps the biggest exception to that rule. While the state ranks in the bottom third of states, its population has increased by 15.8% in the past decade, second only to that of North Dakota.
Those with a higher level of education are more likely to have more options in life and higher incomes. Texas has nearly the lowest high school diploma attainment rate among adults, at just 84%. The state’s bachelor’s degree attainment rate among adults is a little better. Some 30.3% of state residents 25 or over have a bachelor’s degree, compared to 32.6% of all adults nationwide.
See all stories featuring: Texas
[in-text-ad-2]

Source: BrianLasenby / iStock
35. Georgia
> 10-yr. population change: +7.0% (20th highest)
> 2018 unemployment: 3.9% (21st highest)
> Poverty rate: 14.3% (12th highest)
> Life expectancy at birth: 77.7 years (13th shortest)
Georgia residents are more likely to struggle financially than the typical American. The state’s 14.3% poverty rate is higher than the comparable 13.1% national rate. Crime tends to be more common in poorer areas, and crime is more common in Georgia than it is nationwide. There were 405 violent crimes reported for every 100,000 people in Georgia in 2018 — compared to the national violent crime rate of 369 per 100,000.
The higher than average poverty rate may also help explain the relatively low life expectancy in Georgia, as lower-income Americans can afford fewer healthy options related to diet, lifestyle, and health care. Life expectancy at birth in Georgia is 77.7 years, over a year below the 79.1-year national average.
See all stories featuring: Georgia

Source: DougLemke / Getty Images
36. Michigan
> 10-yr. population change: +0.3% (4th lowest)
> 2018 unemployment: 4.1% (15th highest)
> Poverty rate: 14.1% (13th highest)
> Life expectancy at birth: 78.1 years (15th shortest)
Rapid population growth can be indicative of a state’s appeal as a place to move or start a family. Over the last decade, Michigan’s population grew by only 0.3%, even as over the same period, the U.S. population expanded by 6.6%.
Incomes in Michigan are relatively low. The typical household in the state earns $56,697 a year, considerably less than the $61,937 the typical American household earns a year. Serious financial hardship is also more common in Michigan than it is nationwide, as 14.1% of state residents live below the poverty line compared to the 13.1% U.S. poverty rate.
See all stories featuring: Michigan
[in-text-ad]

37. Missouri
> 10-yr. population change: +2.3% (13th lowest)
> 2018 unemployment: 3.2% (13th lowest)
> Poverty rate: 13.2% (19th highest)
> Life expectancy at birth: 77.4 years (12th shortest)
Life expectancy at birth is just 77.4 years in Missouri, lower than in the vast majority of states and nearly two years below the 79.1-year national average. Lower-income Americans can afford fewer healthy options related to diet, lifestyle, and health care, and often report worse health outcomes as a result. In Missouri, the typical household earns $54,478 a year, about $7,500 less than the national median household income.
Higher educational attainment typically leads to higher incomes, and adults in Missouri are less likely to have completed college than the typical American adult. Just 29.5% of state residents 25 and older have a bachelor’s degree, a smaller share than the 32.6% of American adults in the same age group.
See all stories featuring: Missouri

Source: 4kodiak / Getty Images
38. Nevada
> 10-yr. population change: +14.8% (4th highest)
> 2018 unemployment: 4.6% (7th highest)
> Poverty rate: 12.9% (23rd highest)
> Life expectancy at birth: 78.4 years (18th shortest)
Lower educational attainment can be indicative of lower quality of life overall. Those with a higher level of education are more likely to lead healthier lives and have higher incomes. In Nevada, just 24.9% of adults have a bachelor’s degree, the sixth lowest share among states.
The state’s unemployment rate has long been one of the highest in the country. In 2018, 4.6% of the state’s labor force, on average, was out of a job, the seventh highest unemployment rate among states. A large share of Americans have health insurance through their employers, and 11.2% of Nevada’s population does not have health insurance — also the seventh highest uninsured rate among states.
See all stories featuring: Nevada

Source: Davel5957 / Getty Images
39. Ohio
> 10-yr. population change: +1.3% (8th lowest)
> 2018 unemployment: 4.6% (7th highest)
> Poverty rate: 13.9% (16th highest)
> Life expectancy at birth: 77.0 years (10th shortest)
Rapid population growth can be indicative of a state’s appeal to new residents looking to move or start a family. Over the last decade, Ohio’s population grew by only 1.3%, even as over the same period, the U.S. population expanded by 6.6%.
The low population growth may be attributable in part to a weak job market and low incomes. The annual unemployment in Ohio is 4.6%, compared to the 3.9% national rate. Additionally, Ohio residents are more likely than the typical American to live below the poverty line, and the typical household in the state has an income of $56,111 a year, nearly $6,000 less than the typical American household income.
See all stories featuring: Ohio
[in-text-ad-2]
Source: DenisTangneyJr / Getty Images
40. Indiana
> 10-yr. population change: +4.2% (20th lowest)
> 2018 unemployment: 3.4% (20th lowest)
> Poverty rate: 13.1% (20th highest)
> Life expectancy at birth: 77.1 years (11th shortest)
Indiana has one of the lower average life expectancies among states, at 77.1 years, compared to a national life expectancy at birth of 79.1 years. Considering some of the state’s major health indicators, Indiana’s life expectancy figure is not surprising. Among all states, Indiana has the 10th highest share of adults who smoke, the 10th highest adult obesity rate, and the 10th highest share of adults who report getting no exercise during their leisure time.
One bright spot for the state is the fact that it has a relatively low rate of severe poverty. Among the state’s households, 6.1% have an annual income of less than $10,000 — slightly less than the national figure of 6.3%.
See all stories featuring: Indiana

Source: traveler1116 / Getty Images
41. South Carolina
> 10-yr. population change: +11.5% (9th highest)
> 2018 unemployment: 3.4% (20th lowest)
> Poverty rate: 15.3% (9th highest)
> Life expectancy at birth: 77.0 years (9th shortest)
South Carolina is one of the poorest states in the country. The state’s poverty rate of 15.3% is considerably higher than the national poverty rate of 13.1%. Lower-income Americans and those facing serious financial hardship typically report worse health outcomes, and in South Carolina, life expectancy at birth is just 77 years, about two years lower than the national average.
Crime is often more heavily concentrated in lower-income areas, and South Carolina is a relatively dangerous state. There were 488 violent crimes reported in the state for every 100,000 people in 2018, compared to the national violent crime rate of 369 per 100,000.
See all stories featuring: South Carolina
[in-text-ad]

Source: DenisTangneyJr / Getty Images
42. Tennessee
> 10-yr. population change: +7.5% (18th highest)
> 2018 unemployment: 3.5% (21st lowest)
> Poverty rate: 15.3% (9th highest)
> Life expectancy at birth: 76.1 years (8th shortest)
Tennesee has the third highest violent crime rate of any state, with 624 reported incidents of rape, robbery, muder, and aggravated assault per 100,000 people, compared to a national rate of 369 violent crimes per 100,000 people. Memphis, in particular, has one of the highest violent crime rates in the country.
The state is also one of the least healthy in the country. Life expectancy at birth in Tennessee is 76.1 years, three years lower than the national average. The state ranks among the 10 worst for obesity, smoking, physical activity, and infant birth weight — all among the biggest indicators of a population’s overall health.
See all stories featuring: Tennessee
 24/7 Wall St.
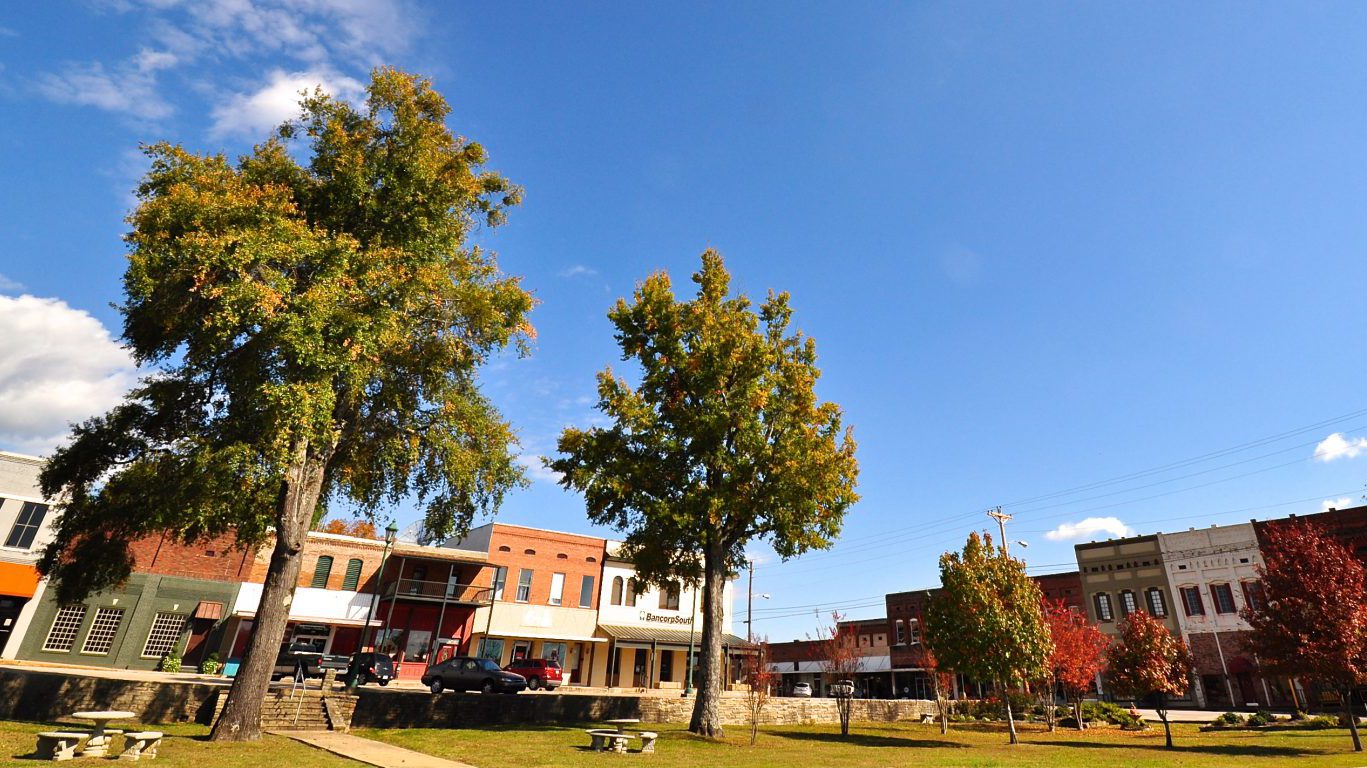
43. New Mexico
> 10-yr. population change: +4.3% (21st lowest)
> 2018 unemployment: 4.9% (3rd highest)
> Poverty rate: 19.5% (2nd highest)
> Life expectancy at birth: 78.2 years (16th shortest)
New Mexico is one of the most dangerous states in the country. There were 857 violent crimes reported for every 100,000 people in the state in 2018, more than double the national rate of 369 per 100,000. Crime tends to be concentrated in poorer areas, and in New Mexico, 19.5% of the population lives below the poverty line, the second highest poverty rate among states and well above the 13.1% national poverty rate.
High crime and widespread financial hardship may make New Mexico less attractive to potential new residents and families. In the last decade, the number of people living in the state climbed by just 4.3%, at a time the U.S. population climbed by 6.6%.
See all stories featuring: New Mexico

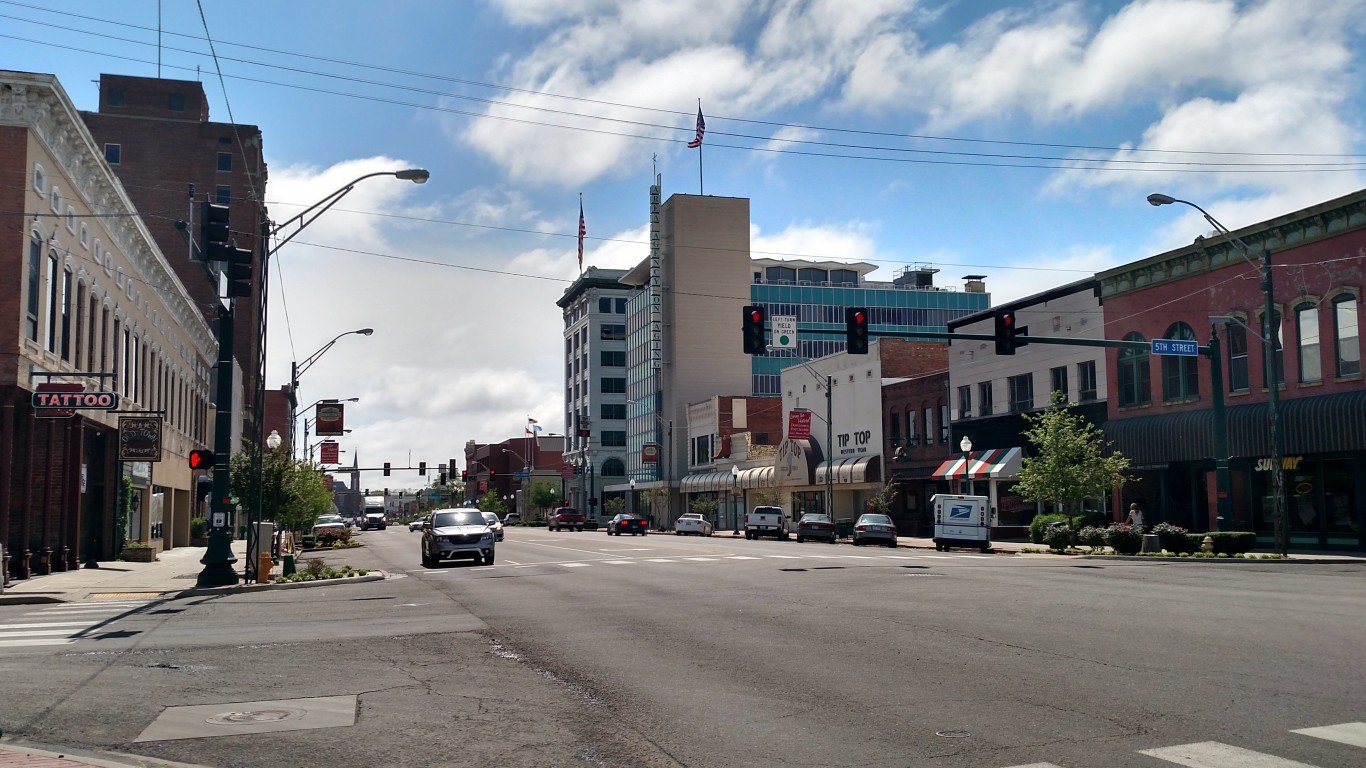
44. Oklahoma
> 10-yr. population change: +6.9% (22nd highest)
> 2018 unemployment: 3.4% (20th lowest)
> Poverty rate: 15.6% (8th highest)
> Life expectancy at birth: 75.9 years (6th shortest)
In Oklahoma, 14.2% of residents lack health insurance, the second highest uninsured rate among states and well above the national rate of 8.9%. Those who are uninsured, and particularly those who live in poverty, potentially face worse health outcomes. Oklahoma, which has one of the highest poverty rates in the country, has a life expectancy at birth of just 75.9 years — the sixth lowest among states and 3.2 years below the national average.
See all stories featuring: Oklahoma
[in-text-ad-2]
Source: SeanPavonePhoto / Getty Images
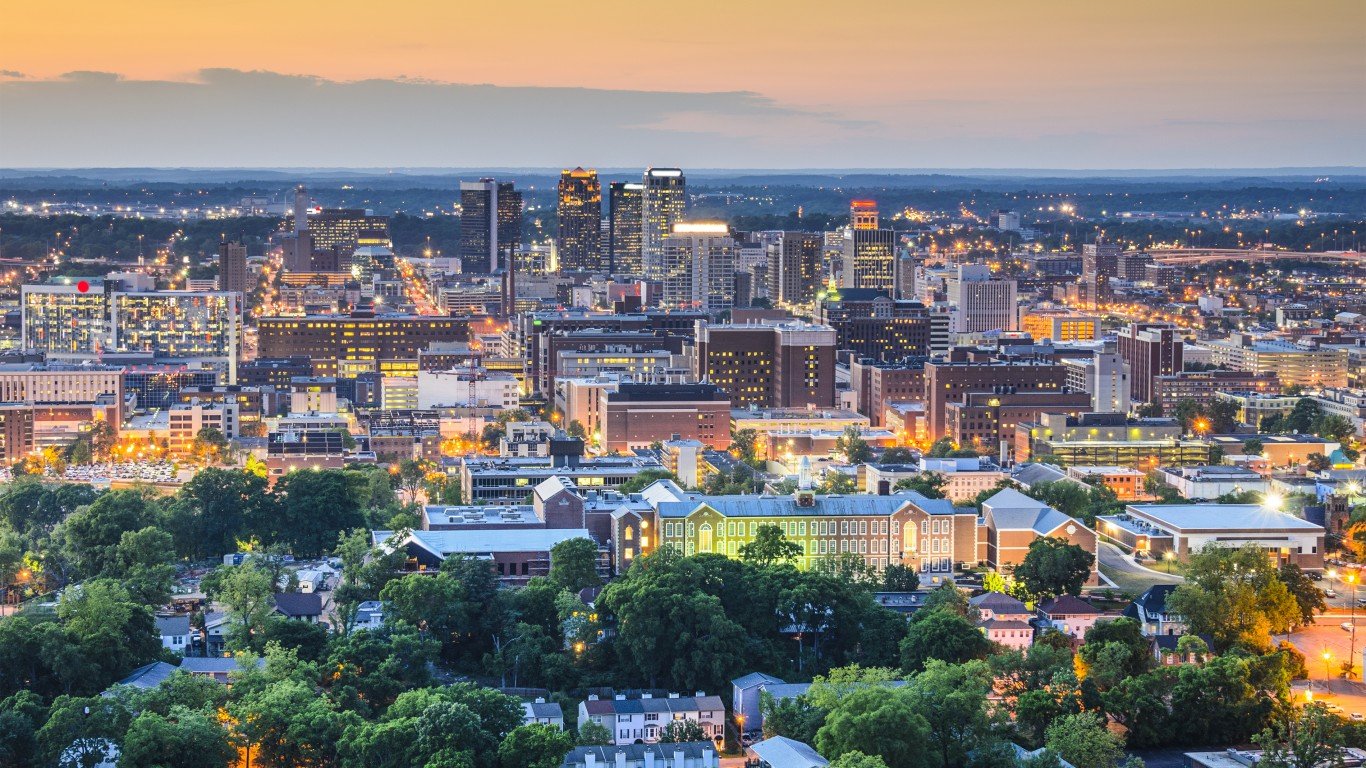
45. Alabama
> 10-yr. population change: +3.8% (19th lowest)
> 2018 unemployment: 3.9% (21st highest)
> Poverty rate: 16.8% (7th highest)
> Life expectancy at birth: 75.4 years (4th shortest)
Incomes tend to rise with educational attainment, and in Alabama, only 25.5% of adults have a bachelor’s degree or higher, compared to 32.6% of adults nationwide. The low educational attainment helps explain why most households in Alabama earn less than $50,000 a year, even as the typical American household earns nearly $62,000 a year.
Lower-income Americans can afford fewer healthy options related to diet and lifestyle, and adults with lower educational attainment are more likely to have unhealthy habits. Life expectancy at birth in Alabama, at 75.4 years, is about four years below the national average.
See all stories featuring: Alabama

Source: Sean Pavone / Getty Images
46. Kentucky
> 10-yr. population change: +3.6% (17th lowest)
> 2018 unemployment: 4.3% (10th highest)
> Poverty rate: 16.9% (6th highest)
> Life expectancy at birth: 75.4 years (3rd shortest)
Kentucky is one of the least healthy states in the country. The state’s life expectancy of 75.4 years is third lowest among states and about three and a half years below the national average life expectancy. Smoking is the leading cause of premature death in the United States, and nearly one in every four Kentucky adults smoke — the second highest smoking rate in the country. Kentucky also has one of the highest adult obesity rates and one of the lowest shares of adults who exercise regularly.
One bright spot is the state’s relatively low violent crime rate. There were 212 reported violent crimes per 100,000 people in Kentucky in 2018, the seventh lowest among states.
See all stories featuring: Kentucky
[in-text-ad]
Source: Brandonrush / Wikimedia Commons
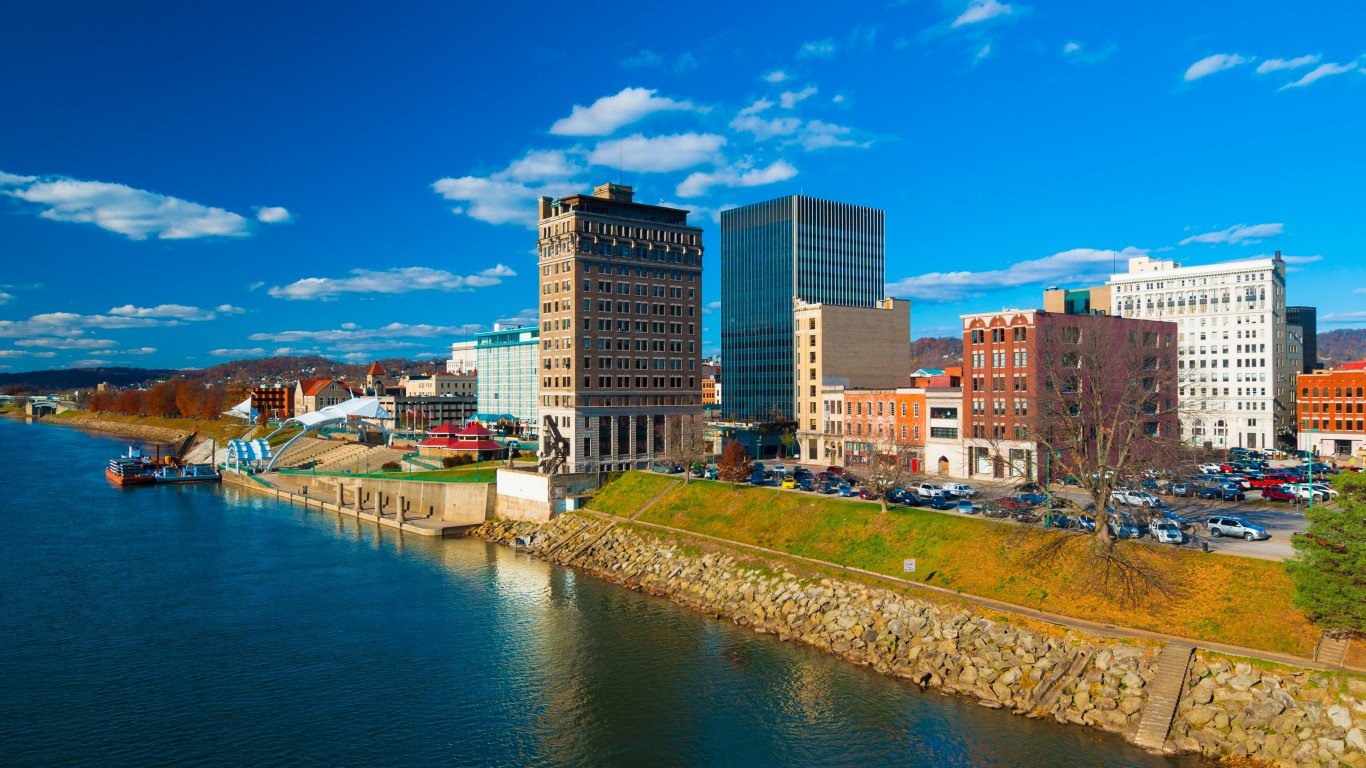
47. Arkansas
> 10-yr. population change: +4.3% (22nd lowest)
> 2018 unemployment: 3.7% (24th lowest)
> Poverty rate: 17.2% (5th highest)
> Life expectancy at birth: 75.8 years (5th shortest)
By almost every major socioeconomic measure, Arkansas ranks poorly compared to the vast majority of states. Nearly 25% of adults surveyed in the state said they were in fair or poor health, the highest share of any state. Arkansas also ranks among the worst five states in obesity, smoking, and physical inactivity. Adults in the state report the second longest average time spent in a state of poor mental health.
Arkansas residents are among the most likely in the United States to be poor. The typical household has an annual income of $47,062, nearly $15,000 below the national median household income. The state’s poverty rate of 17.2% is the fifth highest among states.
See all stories featuring: Arkansas

Source: Jaimie Tuchman / Getty Images
48. Louisiana
> 10-yr. population change: +3.7% (18th lowest)
> 2018 unemployment: 4.9% (3rd highest)
> Poverty rate: 18.6% (3rd highest)
> Life expectancy at birth: 76.1 years (7th shortest)
Louisiana is one of only six states where fewer than one in every four adults have a bachelor’s degree. Americans with a college education are less likely to be unemployed, and Louisiana’s annual unemployment rate of 4.9% is nearly the highest among states and well above the comparable 3.9% national rate.
With a weak job market, Louisiana is also home to a large share of residents facing serious financial hardship. The state’s 18.6% poverty rate is higher than all but two other states and well above the 13.1% national poverty rate.
See all stories featuring: Louisiana
Source: Davel5957 / Getty Images
49. West Virginia
> 10-yr. population change: -0.8% (2nd lowest)
> 2018 unemployment: 5.3% (2nd highest)
> Poverty rate: 17.8% (4th highest)
> Life expectancy at birth: 75.0 years (2nd shortest)
West Virginia’s population has declined by 0.8% over the past decade, making it one of just two states home to fewer people now than in 2009. This decline comes as the state continues to struggle with long-term social and economic issues. The state ranks either worst or second worst in nearly every major measure of health — it has the highest smoking rate and the longest average time spent by adults in a state of poor mental health per month.
The state has the lowest median home value, at just $121,300, compared to a national median home value of $229,700. This low home value reflects both the shrinking population and West Virginia’s nation-lowest median household income of just $44,097 a year.
See all stories featuring: West Virginia
[in-text-ad-2]
Source: Skye Marthaler / Wikimedia Commons
50. Mississippi
> 10-yr. population change: +1.2% (7th lowest)
> 2018 unemployment: 4.8% (5th highest)
> Poverty rate: 19.7% (the highest)
> Life expectancy at birth: 74.8 years (the shortest)
As it has in each of the last two years, Mississippi ranks as the worst state in which to live. It is the only U.S. state that has a life expectancy at birth of less than 75 years. It has the highest adult obesity rate, at 36.5%, and the largest share of adults who report no leisure-time physical activity, at 31.3%. Mississippi is also the only state in the country where more than 10% of households have an income of less than $10,000. It also has a poverty rate of nearly 20% — the highest of any state.
The state ranks among the worst five in the country in a number of other socioeconomic indicators, including adult bachelor’s degree and high school diploma attainment and unemployment.
See all stories featuring: Mississippi
Methodology
To identify the best and worst states to live in, 24/7 Wall St. constructed an index comprising three socioeconomic measures for each state: poverty rate, the percentage of adults (25 and older) who have at least a bachelor’s degree, and life expectancy at birth. The selection of these three measures was modeled on the United Nations’ Human Development Index.
Poverty rates and bachelor’s degree attainment rates came from the U.S. Census Bureau’s 2018 American Community Survey. Life expectancy at birth is from the 2019 County Health Rankings & Roadmaps, a Robert Wood Johnson Foundation and the University of Wisconsin Population Health Institute joint program, and is based on data for the years 2015-2017.
Unemployment rates are from the Bureau of Labor Statistics and are annual for 2018. Crime data came from the FBI’s 2018 Uniform Crime Report. Uninsured rates, median household incomes, high school diploma attainment rates, and median home values also came from the ACS. Other data on health behaviors and outcomes came from County Health Rankings & Roadmaps.
Take This Retirement Quiz To Get Matched With A Financial Advisor (Sponsored)
Take the quiz below to get matched with a financial advisor today.
Each advisor has been vetted by SmartAsset and is held to a fiduciary standard to act in your best interests.
Here’s how it works:
1. Answer SmartAsset advisor match quiz
2. Review your pre-screened matches at your leisure. Check out the
advisors’ profiles.
3. Speak with advisors at no cost to you. Have an introductory call on the phone or introduction in person and choose whom to work with in the future
Take the retirement quiz right here.
Thank you for reading! Have some feedback for us?
Contact the 24/7 Wall St. editorial team.
Editors' Picks