Here Is the Poverty Rate for Every Quantifiable Group in the United States
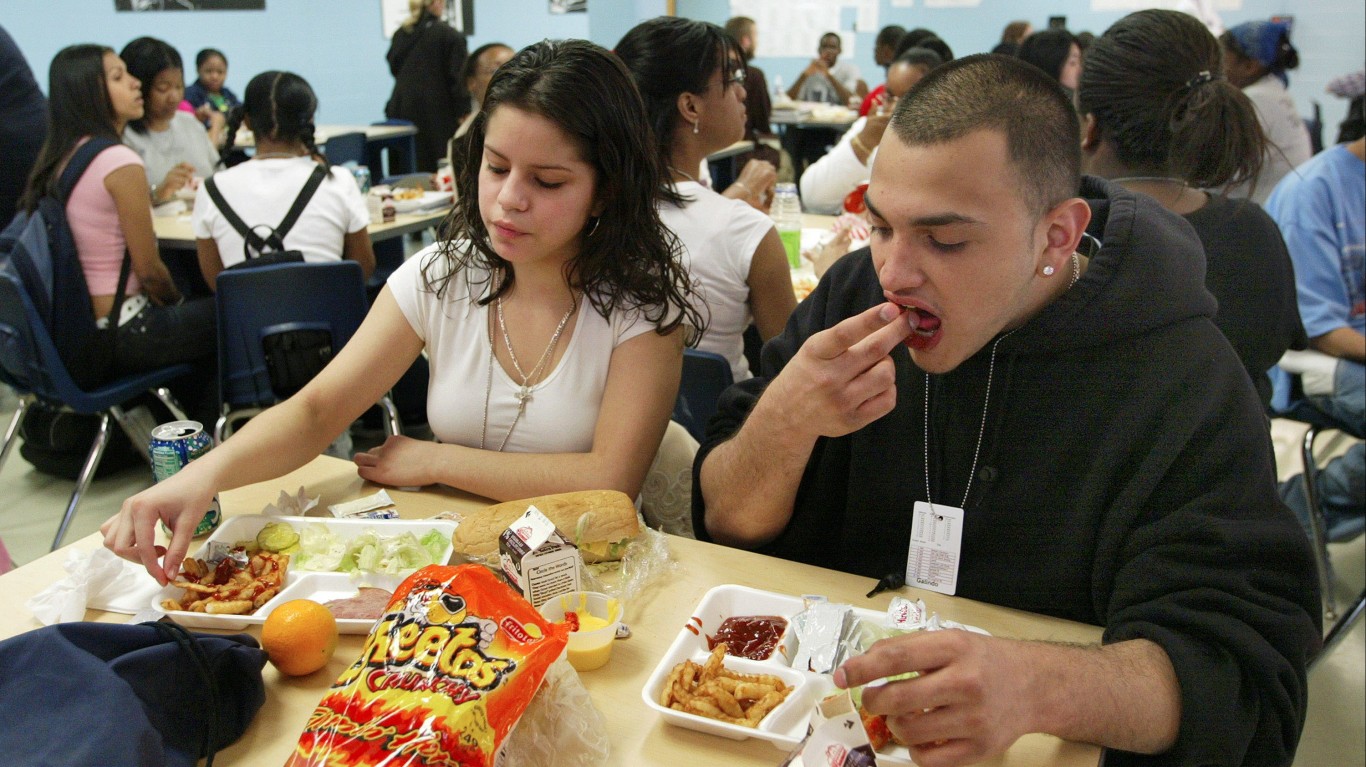
November 4, 2019 by Sam StebbinsA range of factors affect the likelihood of living in poverty — the poverty threshold in the United States was defined in 2018 as a four-person household earning $25,000 or less. Where and when a person was born, their race, their education level and that of their parents, their age and health, the composition of their family, and the status of their relationship are all variables determining poverty status in the United States.
Perhaps because poverty is due in part to circumstances beyond our control and in part to personal choices and behaviors, it seems that no group of Americans is completely immune to poverty.
24/7 Wall St. analyzed government poverty statistics for 28 selected population groups from the U.S. Census Bureau’s Current Population Survey (CPS). The list is grouped so each item lends context to the next. We compared men and women, Hispanic Americans of all races, black Americans, and white Americans, as well as full-time, part-time, and unemployed individuals (for more on this point, see the cities where having a job doesn’t keep you out of poverty).
We also compared poverty rates for people living in the South, Midwest, West, and Northeast parts of the United States. (For more on regional differences, here are America’s richest and poorest states).
It is important to note that poverty levels for certain groups are not broken down by the CPS. For example, American Indian and Alaskan Natives, whose poverty rate has been pegged by some organizations as well over 20%, are not on this list.
Click here to see our full list of who lives in poverty
Click here to see our detailed findings
Age and Sex
> Total group size: 158.7 million people
> Group members living below the poverty line: 16.8 million people
> Group poverty rate: 10.6%
Of the 158.7 million men in the United States, 16.8 million live below the poverty line, or 10.6% — below the 11.8% poverty rate across all groups. For a number of reasons, men are more likely than women to be in the workforce, and less likely to face discrimination related to salary or hiring.
[in-text-ad]
Women
> Total group size: 165.1 million people
> Group members living below the poverty line: 21.4 million people
> Group poverty rate: 12.9%
Women in the United States earn, on average, about 85 cents for every dollar men earn. Women are also far more likely than men to live below the poverty line. Of the 165.1 million women nationwide, 12.9% live below the poverty line, compared to 10.6% of the 158.7 million U.S. men.
 24/7 Wall St.
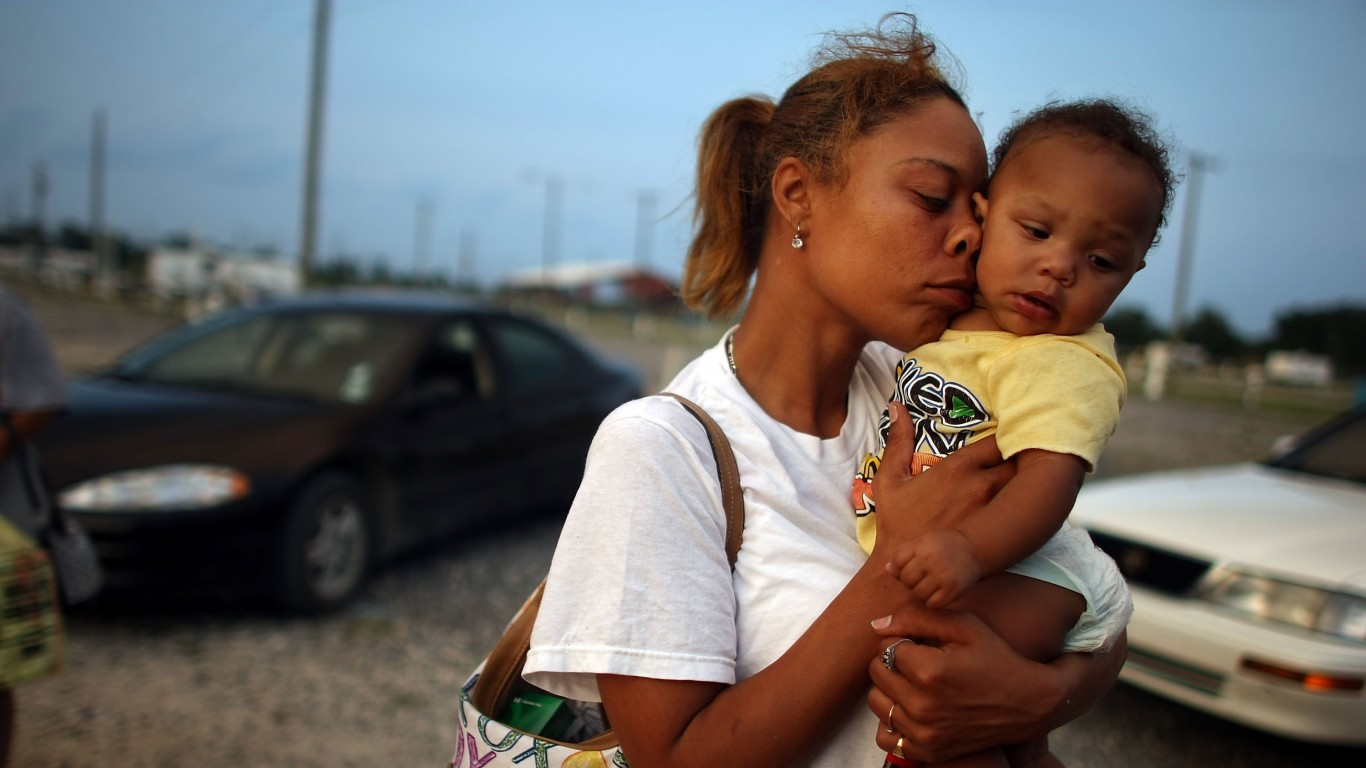
Under age 18
> Total group size: 73.3 million people
> Group members living below the poverty line: 11.9 million people
> Group poverty rate: 16.2%
American children are far more likely to live below the poverty line than adults. Younger children are at an even greater risk of living in poverty, as are children of minority families.

Age 25 and over
> Total group size: 221.5 million people
> Group members living below the poverty line: 21.9 million people
> Group poverty rate: 9.9%
About one in every 10 Americans age 25 or older live below the poverty line. The age range covers broad demographic groups, including those of prime working age as well as those who have retired.
[in-text-ad-2]

Age 65 and over
> Total group size: 52.8 million people
> Group members living below the poverty line: 5.1 million people
> Group poverty rate: 9.7%
After age 65, many working Americans start transitioning into retirement. Those who have not saved enough or are not enrolled in a pension fund are at particularly high risk, and may need to continue working into their old age to stay out of poverty. As senior citizens continue to age, the risk of poverty increases, as 11.3% of Americans 75 and older live in poverty compared to 9.7% of those 65 and over.
Region

Northeast
> Total group size: 55.3 million people
> Group members living below the poverty line: 5.7 million people
> Group poverty rate: 10.3%
The Northeastern U.S. — a region extending from New Jersey and Pennsylvania up through New England — has the lowest poverty rate of all four Census designated regions. Of all nine states in the Northeast, Pennsylvania has the highest poverty rate, at 11.8%. New Hampshire has the lowest, at 6.1%
[in-text-ad]
Midwest
> Total group size: 67.5 million people
> Group members living below the poverty line: 7.0 million people
> Group poverty rate: 10.4%
There are 12 states in the Midwest, extending from Ohio down and across to Kansas. Large swaths of the Midwest have been hit especially hard by the decline of American manufacturing. State poverty rates in the region range from 7.5% in Kansas to 12.4% in neighboring Missouri.

West
> Total group size: 77.6 million people
> Group members living below the poverty line: 8.7 million people
> Group poverty rate: 11.2%
The poverty rate among the 13 states in the West is 11.2%, slightly lower than the 11.8% rate across the U.S. as a whole. New Mexico’s 16.6% poverty rate is the highest in the region and third highest among states. Meanwhile, Utah, its neighbor to the northwest, has a poverty rate of 6.9%, second lowest among states.

South
> Total group size: 123.5 million people
> Group members living below the poverty line: 16.8 million people
> Group poverty rate: 13.6%
Ameicans in the South are more likely to live in poverty than those in any other geographic region. Across the 16 states that make up the South, the poverty rate is 13.6%. The region includes both of the states with the highest poverty rates — Louisiana and Mississippi, which have poverty rates of 19.0% and 19.6%, respectively.
[in-text-ad-2]
Educational Attainment
Adults without a high school diploma
> Total group size: 22.0 million people
> Group members living below the poverty line: 5.7 million people
> Group poverty rate: 25.9%
Education is the best way to help ensure financial security in the United States, and American adults who have not completed high school are at an especially high risk of living in poverty. More than one in every four of the 22 million adults age 25 and over who dropped out of high school live below the poverty line.

Adults with a high school diploma, no college
> Total group size: 62.3 million people
> Group members living below the poverty line: 7.9 million people
> Group poverty rate: 12.7%
Adults for whom the highest level of education is high school are at a slightly greater than average risk of poverty. Of the 62.3 million Americans who fit into this demographic, 12.7% live in poverty, compared to 11.8% of all Americans.
[in-text-ad]

Adults with some college
> Total group size: 57.4 million people
> Group members living below the poverty line: 4.8 million people
> Group poverty rate: 8.4%
Income tends to rise with educational attainment, and the risk of poverty tends to fall. Of the 57.4 million Americans with some college education but less than a bachelor’s degree, 8.4% live in poverty.
 24/7 Wall St.
Adults with a bachelor’s degree or higher
> Total group size: 79.8 million people
> Group members living below the poverty line: 3.5 million people
> Group poverty rate: 4.4%
The median weekly wage for working Americans with a bachelor’s degree or higher is $1,198, well above the weekly median of $932 for all workers. Adults with a four-year degree are also far less likely to face serious financial hardship — but that does not mean that college-educated adults are immune by any means. There are some 3.5 million Americans age 25 and over with a bachelor’s degree or higher, or 4.4% of the demographics, who live below the poverty line.
Family Structure

All families
> Total group size: 83.5 million people
> Group members living below the poverty line: 7.5 million people
> Group poverty rate: 9.0%
People living with family members in the United States are less likely than the typical American to live below the poverty line. The poverty rate among the 83.5 million Americans living with their family is just 9.0%, compared to the 11.8% poverty rate across the population as a whole.
[in-text-ad-2]
Married-couple families
> Total group size: 62.0 million people
> Group members living below the poverty line: 2.9 million people
> Group poverty rate: 4.7%
Those living in a two-parent household are far less likely than those in other living situations to live on poverty level incomes. Married-couple families have a greater range of options related to childcare and employment than single-parent households. Nationwide, some 4.7% of people living in married-couple families live below the poverty line, less than half the 11.8% poverty rate among all Americans.

Single parent households with male head of household
> Total group size: 6.5 million people
> Group members living below the poverty line: 824,000 people
> Group poverty rate: 12.7%
Single-father households are far less common in the United States than single-mother households. And just as men are less likely to live in poverty than women, those living in single-father households are far less likely to live in poverty than single-mother households. Some 12.7% of Americans in single-parent households headed by a man live in poverty, compared to 24.9% of such households headed by a woman.
[in-text-ad]
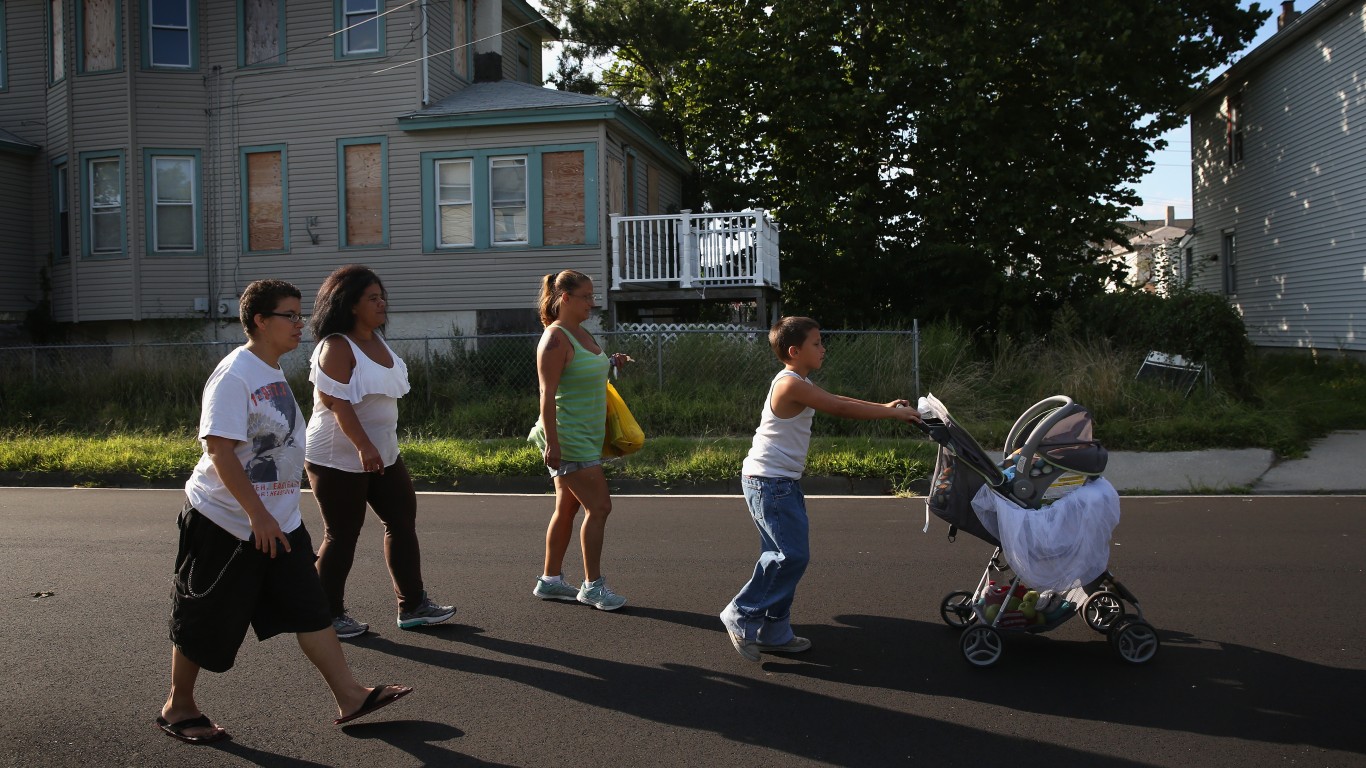
Single parent households with female head of household
> Total group size: 15.1 million people
> Group members living below the poverty line: 3.7 million people
> Group poverty rate: 24.9%
Women are more likely than men to live in poverty, and adding dependents into the picture, the poverty rate among women jumps substantially. Nearly one in every four people living in single-parent households headed by a woman live below the poverty line, compared to the poverty rate of 12.9% among women alone.
The increased likelihood of financial hardship is due to a number of factors, including that employed mothers are less likely to work full-time than employed fathers, and nationwide, women earn an average of 85 cents for every dollar men earn.
Employment Status

Worked full-time, year round
> Total group size: 118.0 million people
> Group members living below the poverty line: 2.6 million people
> Group poverty rate: 2.2%
The best way to avoid serious financial hardship is to have a steady source of income. Perhaps not surprisingly, the poverty rate among Americans working full-time is just 2.2%, a fraction of the overall 11.8% poverty rate. Still, for many working Americans, particularly those in low-paying jobs with dependents to support financially, even working 40 hours a week is not enough to stay out of poverty. There are some 2.6 million Americans working full-time living below the poverty line.

Part-time workers
> Total group size: 49.3 million people
> Group members living below the poverty line: 5.6 million people
> Group poverty rate: 11.4%
Americans may be working part-time for any number of reasons, including setting aside time to further their education, childcare responsibilities, or difficulty finding a full-time position. Of the 49.3 million Americans working part time, 11.4% live below the poverty line, closely in line with the 11.8% overall poverty rate.
[in-text-ad-2]
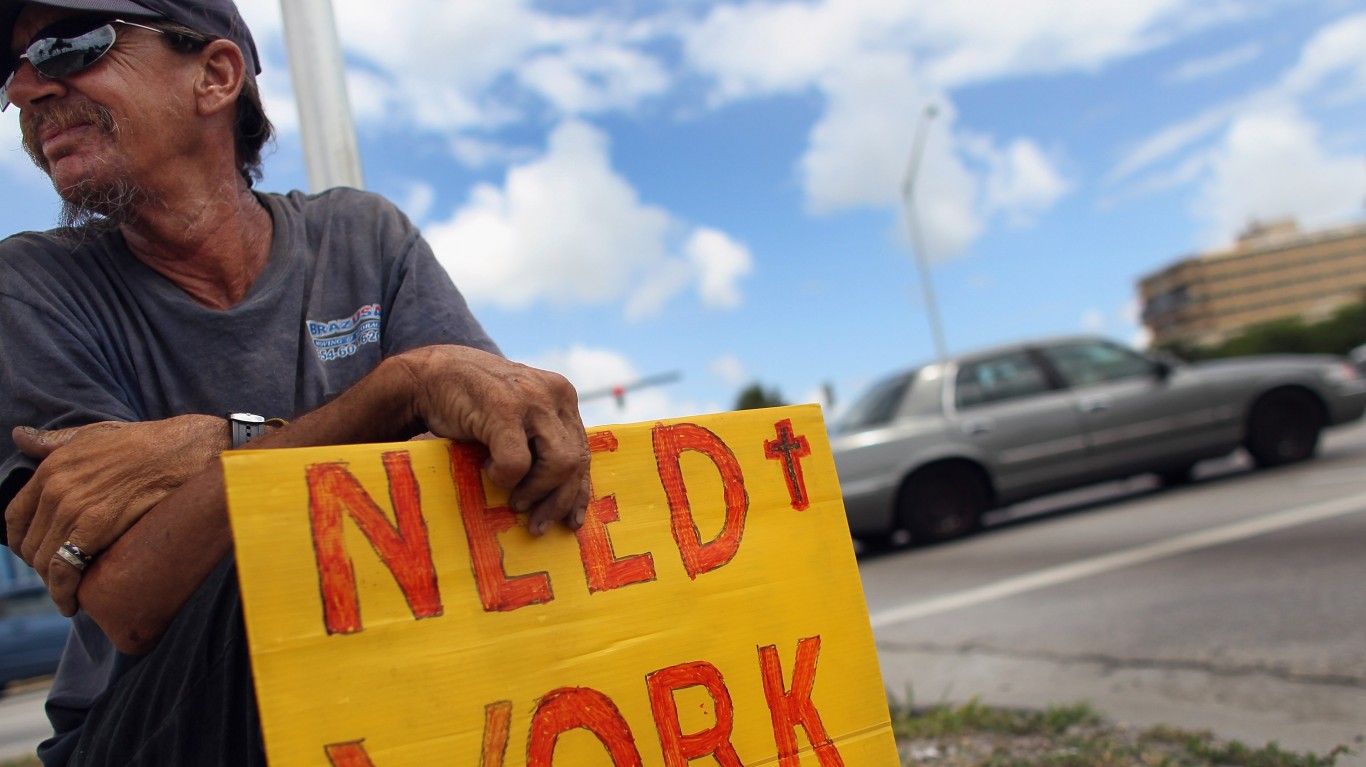
Not working (age 16 and older)
> Total group size: 92.2 million people
> Group members living below the poverty line: 19.3 million people
> Group poverty rate: 20.9%
There were nearly 92 million Americans age 16 and over who did not work in 2018. Without a steady income stream, this demographic is particularly susceptible to poverty. Slightly more than one in every five working-age Americans who did not work last year lived in poverty, nearly double the 11.8% national poverty rate.
Race and Ethnicity

White alone, not hispanic
> Total group size: 194.8 million people
> Group members living below the poverty line: 15.7 million people
> Group poverty rate: 8.1%
Americans who identify as white are the least likely racial group to live below the poverty line. Among the 194.8 million non-Hispanic whites living in the United States, 8.1% live in poverty, a considerably smaller share than the 11.8% national poverty rate.
[in-text-ad]

Asian alone
> Total group size: 19.8 million people
> Group members living below the poverty line: 2.0 million people
> Group poverty rate: 10.1%
Americans of Asian descent are less likely to live in poverty than the typical American but more likely to live in poverty than white Americans. Of the nearly 20 million Americans who identify as Asian, 10.1% live below the poverty line — below the 11.8% overall poverty rate but higher than the 8.1% rate among white Americans.
 24/7 Wall St.
Hispanic (any race)
> Total group size: 60.0 million people
> Group members living below the poverty line: 10.5 million people
> Group poverty rate: 17.6%
Hispanic Americans, or those who speak Spanish — often of Latin American descent — are far more likely than the typical American to live below the poverty line. Of the 60 million Americans who identify as Hispanic, 17.6% live in poverty, compared to 11.8% of all Americans.

Black alone
> Total group size: 42.8 million people
> Group members living below the poverty line: 8.9 million people
> Group poverty rate: 20.8%
Black Americans are more than twice as likely to live below the poverty line as white Americans. More than one in every five of the 42.8 million Americans who identify as black live below the poverty line, compared to less than one in every 10 white Americans.
In October 2019, the black unemployment rate hit a record low of 5.4%, which suggests the poverty rate among black Americans could soon fall as well. Still, black Americans are far more likely to be out of a job than other groups in the United States, as the national unemployment stands at 3.6%.
[in-text-ad-2]
Citizenship Status
People born in the US
> Total group size: 278.1 million people
> Group members living below the poverty line: 31.8 million people
> Group poverty rate: 11.4%
People who were born in the United States are slightly less likely to face serious financial hardship than those who live here but were born abroad. Some 11.4% of native-born Americans live below the poverty line, slightly below the 11.8% poverty rate overall.

All U.S. citizens
> Total group size: 300.3 million people
> Group members living below the poverty line: 34.0 million people
> Group poverty rate: 11.3%
One of the strongest predictors of poverty in the United States is citizenship. U.S. citizens — both foreign and native born — have access to a far wider range of employment opportunities than non-citizens. The poverty rate among American citizens is 11.3%, below the 11.8% poverty rate among everyone living in the United States.
[in-text-ad]

Foreign-born, naturalized citizen
> Total group size: 22.3 million people
> Group members living below the poverty line: 2.2 million people
> Group poverty rate: 9.9%
Overall, those who were born outside of the United States are slightly more likely to live in poverty than those born in the country. The one exception, however, is those who were born abroad and have naturalized as U.S. citizens. Of the 22.3 million Americans who fit that description, 9.9% live in poverty compared to the 11.4% poverty rate among native-born citizens. The requirements to become a naturalized citizen are extensive and may naturally favor those who are more likely to be financially secure.
Foreign-born, not a citizen
> Total group size: 23.5 million people
> Group members living below the poverty line: 4.1 million people
> Group poverty rate: 17.5%
The poverty rate among those born in a different country and are not U.S. citizens is a staggering 17.5%. Non-U.S. citizens living in the country are often forced to live and work in the shadows, and doing so often means working at very low paying jobs.
Methodology
Most Americans will fall into at least one of these categories, while some might fit several. And while some of these categories may not be intuitively associated with poverty, none are immune to poverty.
While college-educated Americans and adults working full-time are far less vulnerable to the prospect of poverty than other groups, millions of people in both of these categories faced poverty in 2018.
Out of the 118 million people working full-time year-round, 2.6 million. or about 2.2%, live in poverty. And of the 79.8 million Americans with a bachelor’s degree or higher, 3.5 million, or approximately 4.4%, earn incomes below the poverty level.
While suburban poverty is on the rise, populations earning low incomes remain relatively concentrated in city centers. The West and South have higher poverty rates, but there are pockets of extreme poverty in every U.S. region. Poverty is also highly concentrated in the South, Southwest, and Appalachian regions.
It is important to note that the official poverty rate is an imperfect measure of what people actually face — the threshold is the result of the 1963 cost of nutritionally adequate food for the year multiplied by three, and indexed to inflation. A household’s cash income before taxes is compared to that threshold to determine poverty status.
Sponsored: Want to Retire Early? Here’s a Great First Step
Want retirement to come a few years earlier than you’d planned? Or are you ready to retire now, but want an extra set of eyes on your finances?
Now you can speak with up to 3 financial experts in your area for FREE. By simply clicking here you can begin to match with financial professionals who can help you build your plan to retire early. And the best part? The first conversation with them is free.
Click here to match with up to 3 financial pros who would be excited to help you make financial decisions.