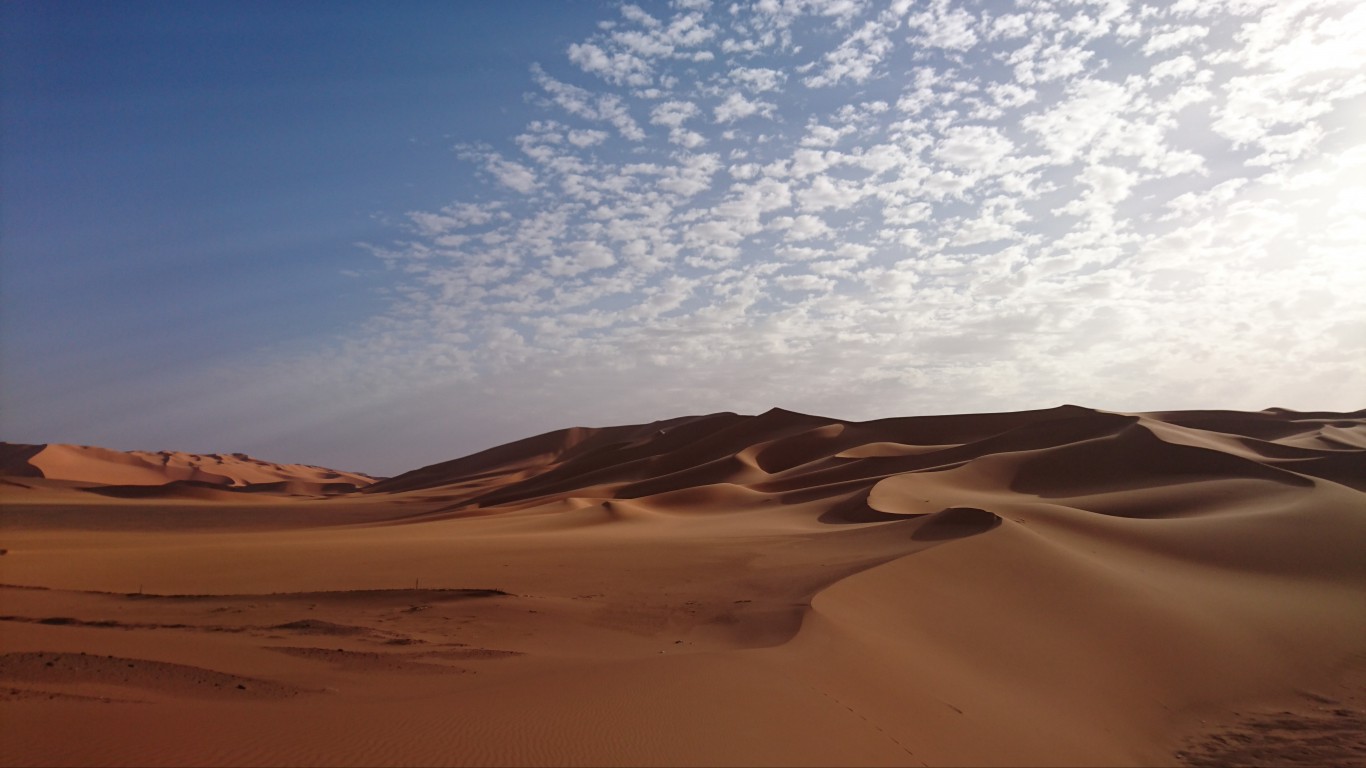
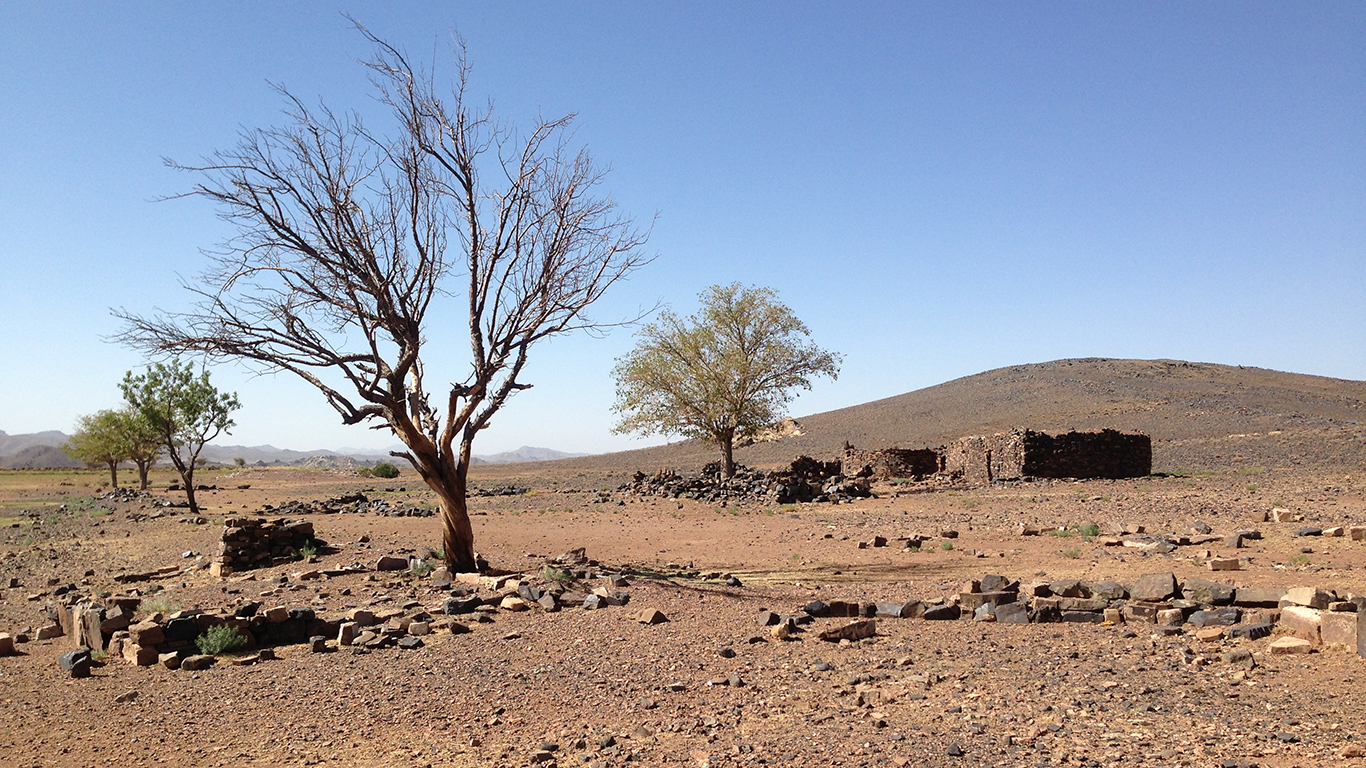
From the frigid terrains of Antarctica to the scorching deserts of Africa to the often drought-stricken regions of North and South America, areas that get little to no rainfall tend to have harsh environments.
While many such hostile regions of the planet are barren of life, others have been inhabited for millennia by humans driven to exist across the Earth’s most inhospitable landscapes.
To identify the driest places on Earth, 24/7 Wall St. reviewed average annual rainfall recorded by weather stations around the world and compiled by the Global Historical Climatology Network, a program of the U.S. National Centers for Environmental Information (NCEI).
We calculated the average annual rainfall from precipitation in the years 1997 through 2018. Weather stations that did not have at least five years of data available between 1997 and 2018 were not considered.
These places often have small populations that rely on water-related technologies to survive in their surroundings. These include the residents of many Saharan locations using time-tested irrigation techniques, as well as the research teams located in the deserts of Antarctica. These people’s approaches to life differ drastically from those living in the cities with the best weather.
Click here to see the driest places on Earth.
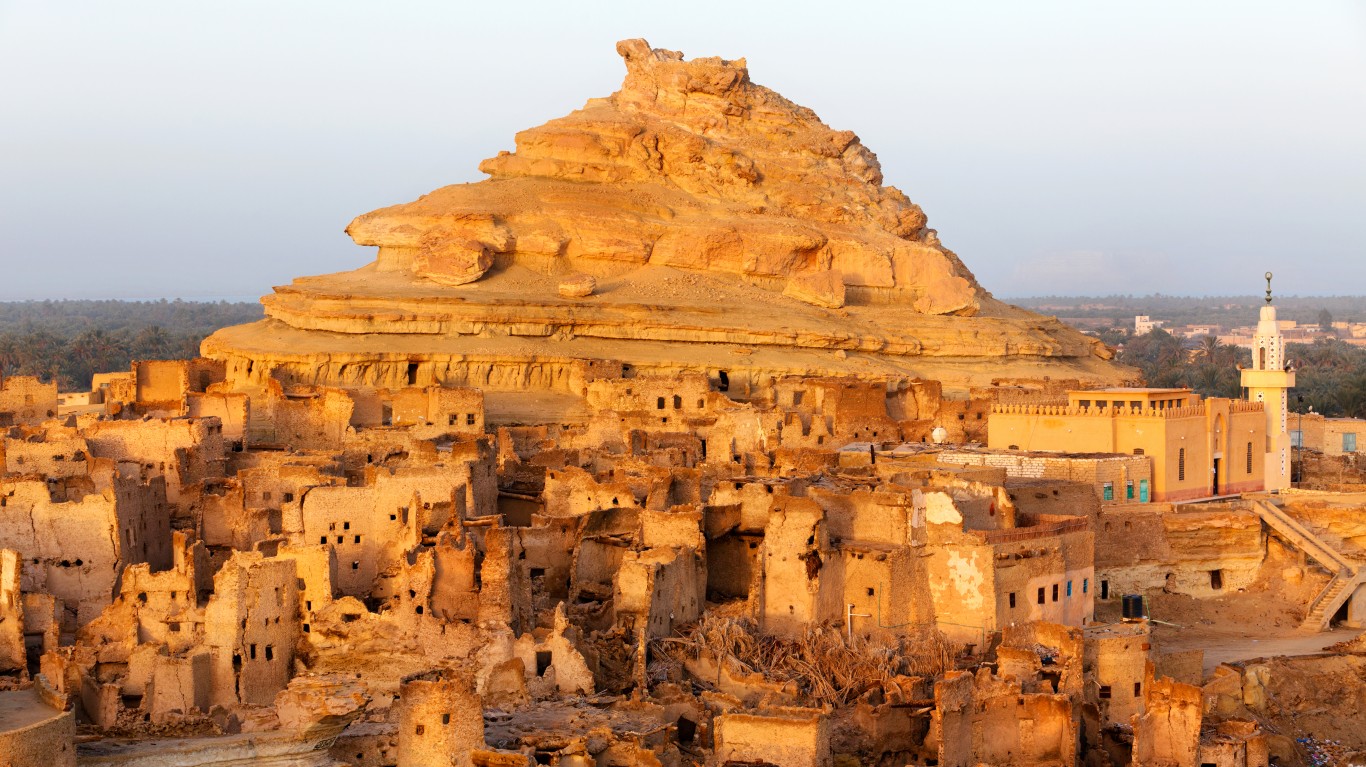
Source: Bertramz / Wikimedia Commons
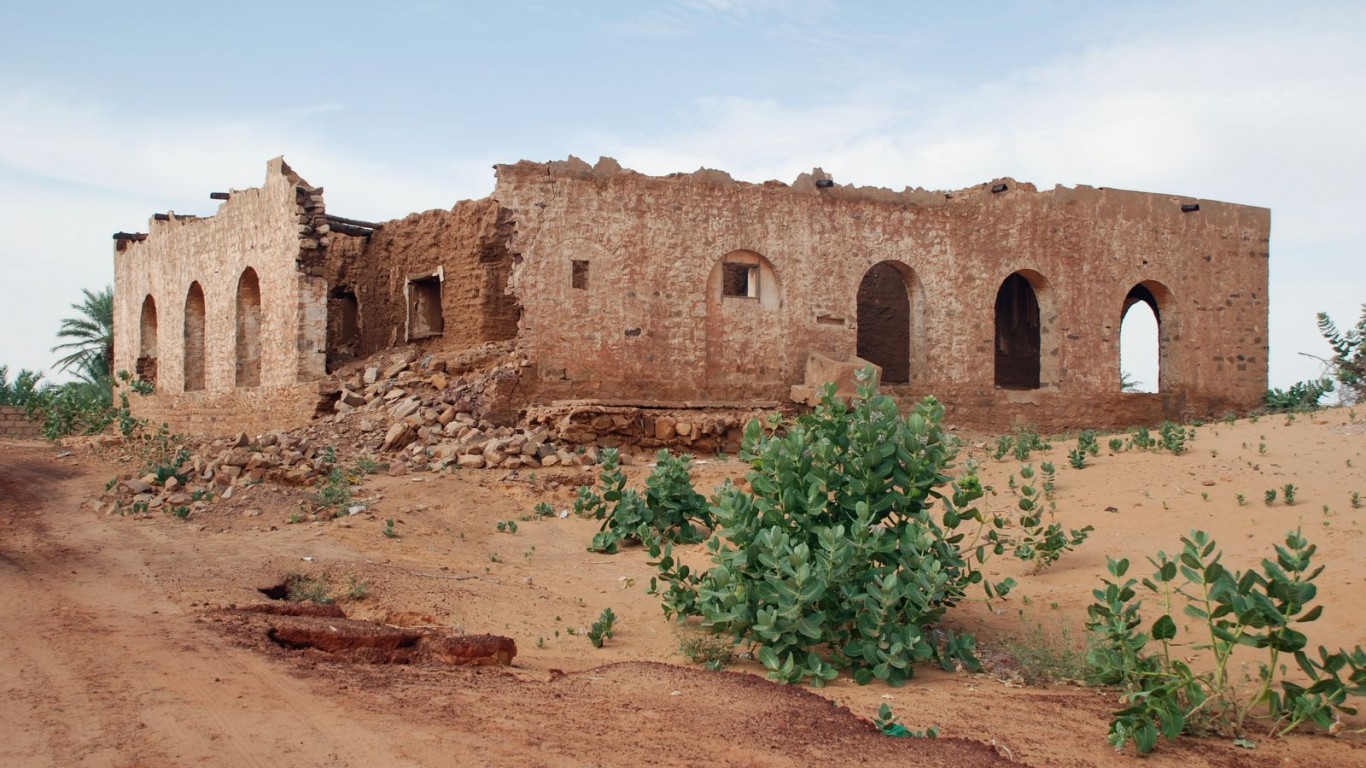
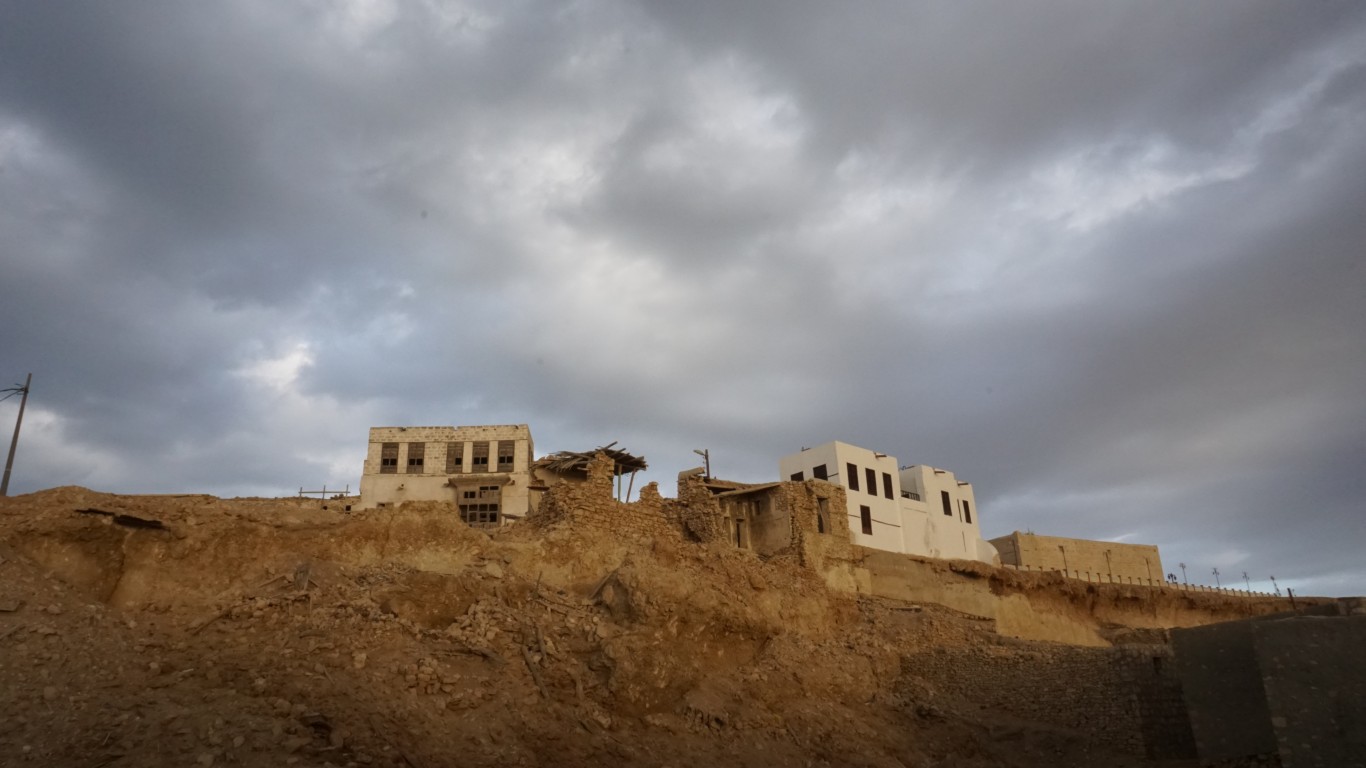
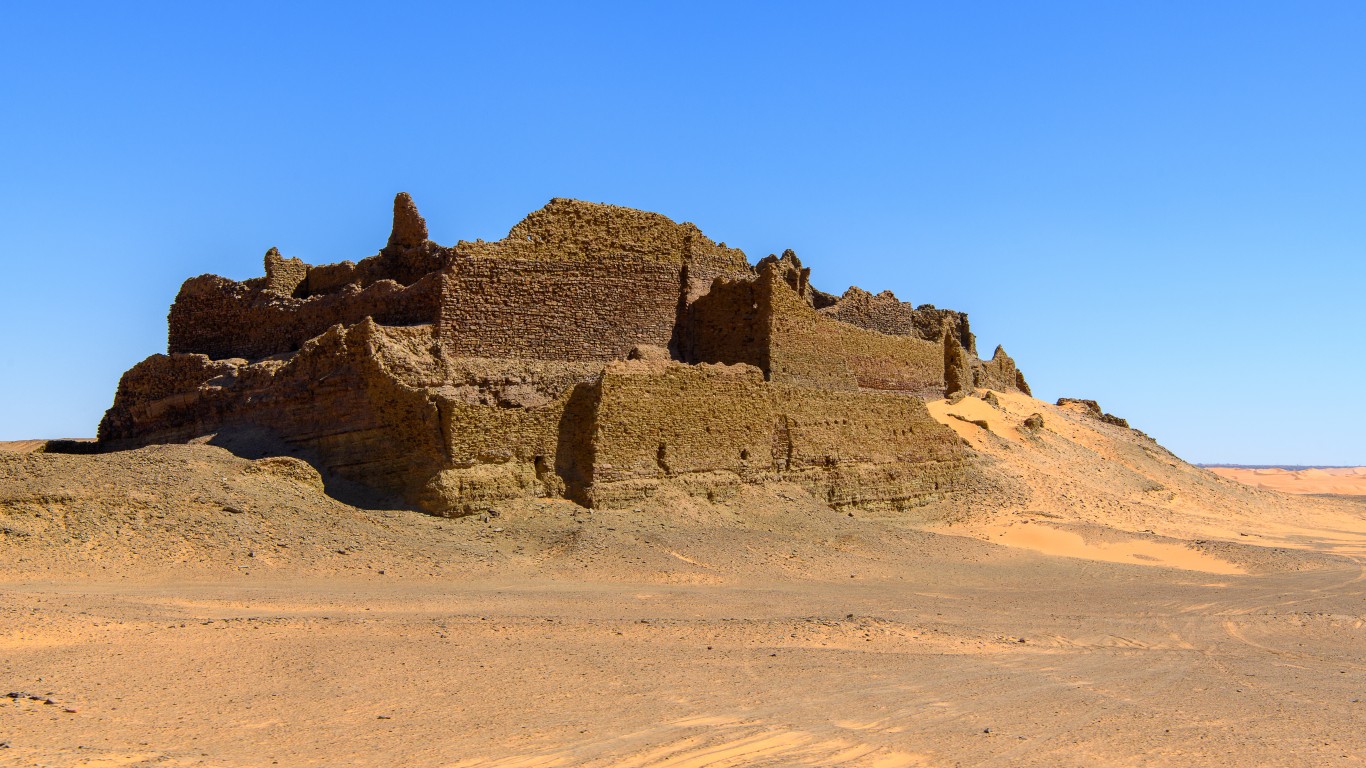
50. Tidjikja, Mauritania
> Annual average precipitation (16 years of data): 1.2 inches
> Wettest year in database: 2010, 4.6 inches
> Wettest month on average: August, 2.3 inches
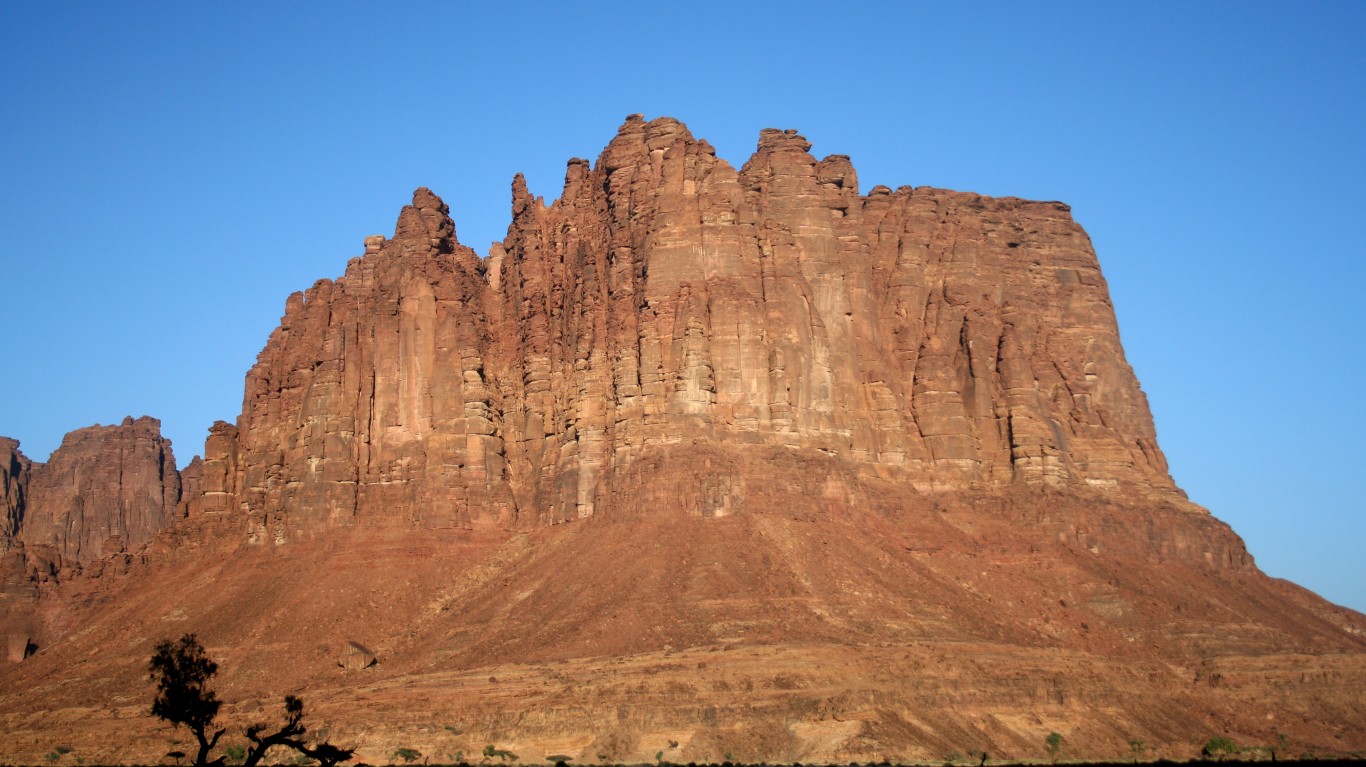
Tidjikja is a town in the central region of the northwest African nation of Mauritania. It has oppressively hot summers during which the average daily high temperature exceeds 100 °F.
[in-text-ad]
Source: Public Domain / Wikimedia Commons
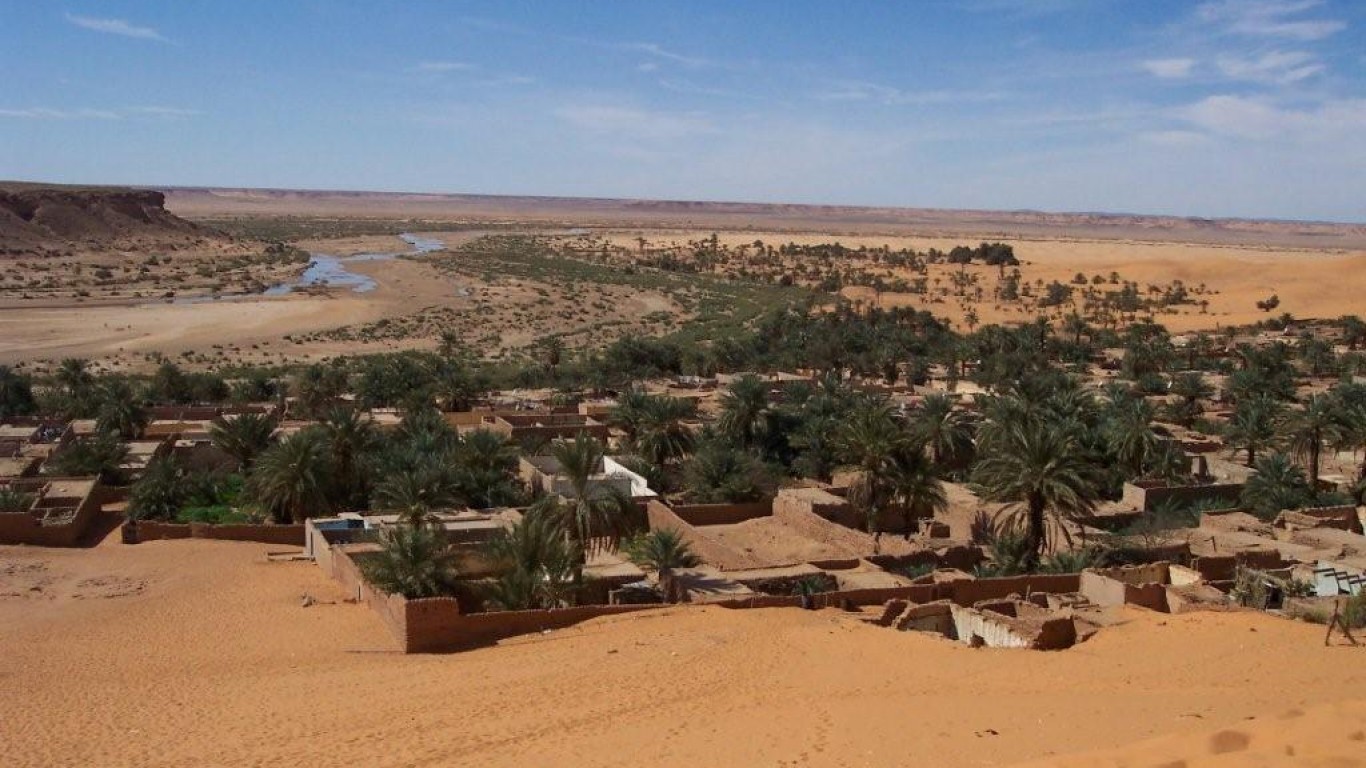
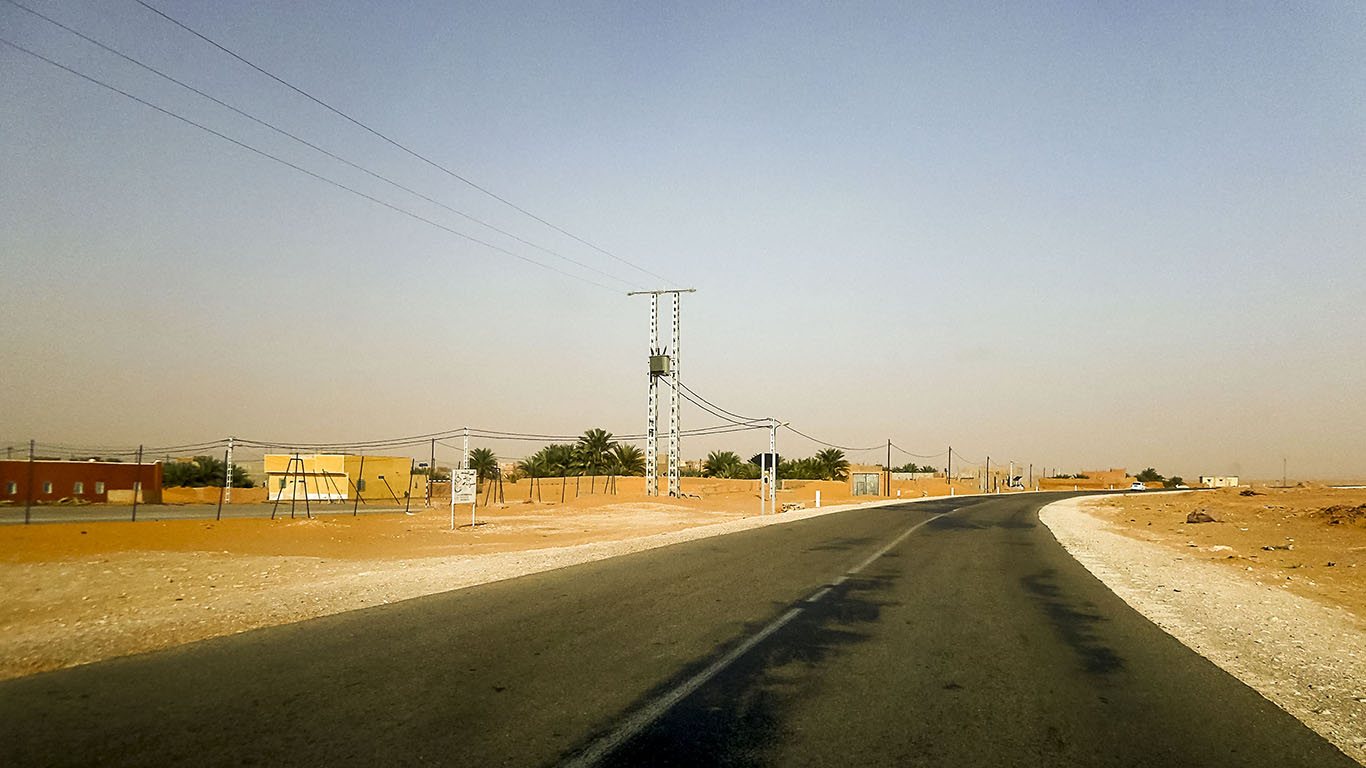
49. Béni Abbès, Algeria
> Annual average precipitation (16 years of data): 1.2 inches
> Wettest year in database: 2009, 4.1 inches
> Wettest month on average: October, 0.4 inches
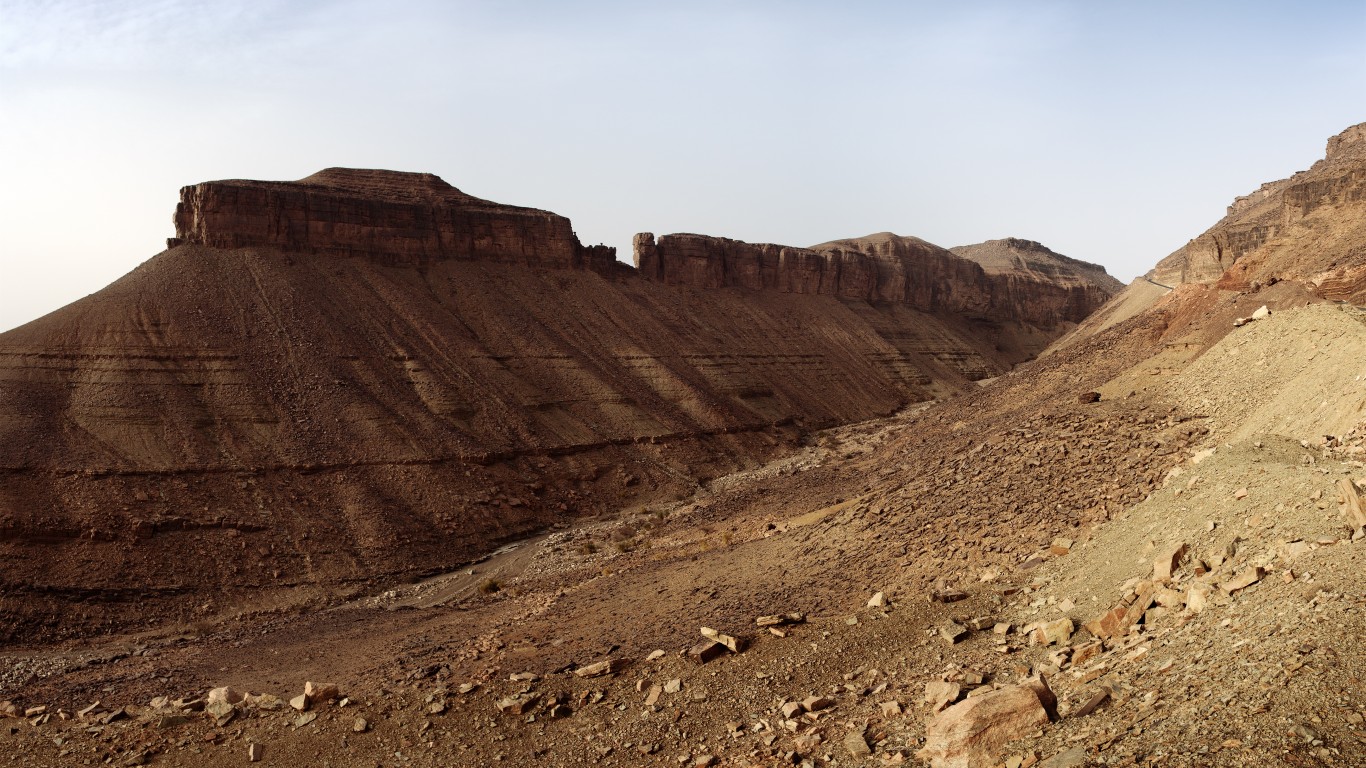
Located on the left bank of the Saoura Valley, Southwest Algeria’s Béni Abbès has an arid desert climate and receives an average of just 1.2 inches of precipitation per year. As is the case in all Saharan oasis towns, underground reserves are Béni Abbès’ primary water supply.
Source: gionnixxx / Getty Images
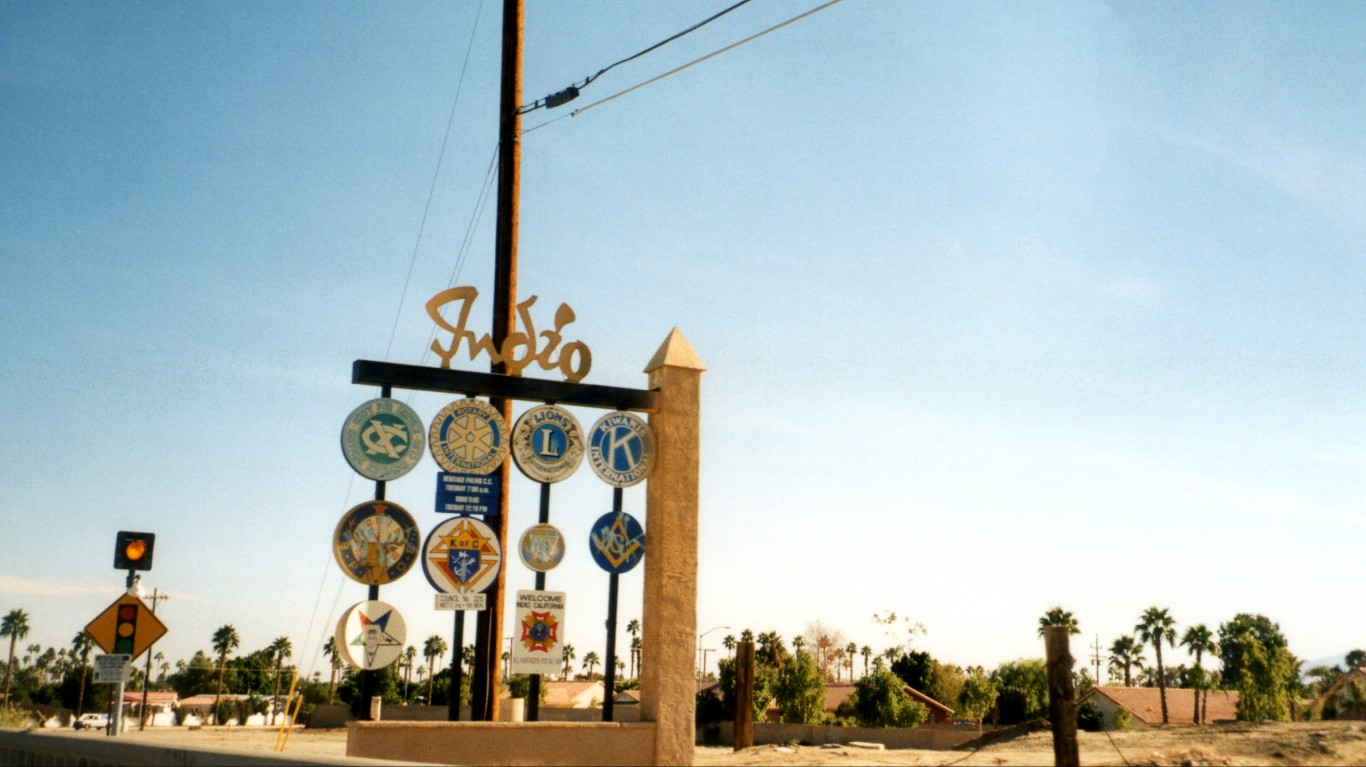
48. Indio, United States Of America
> Annual average precipitation (16 years of data): 1.2 inches
> Wettest year in database: 2004, 2.9 inches
> Wettest month on average: December, 0.3 inches
Southern California’s Indio is located in Coachella Valley. It has a warm and arid climate, though it was able to develop into an agricultural region thanks to the aqueduct All-American Canal that connects the town to the Colorado River.
Source: sasacvetkovic33 / Getty Images
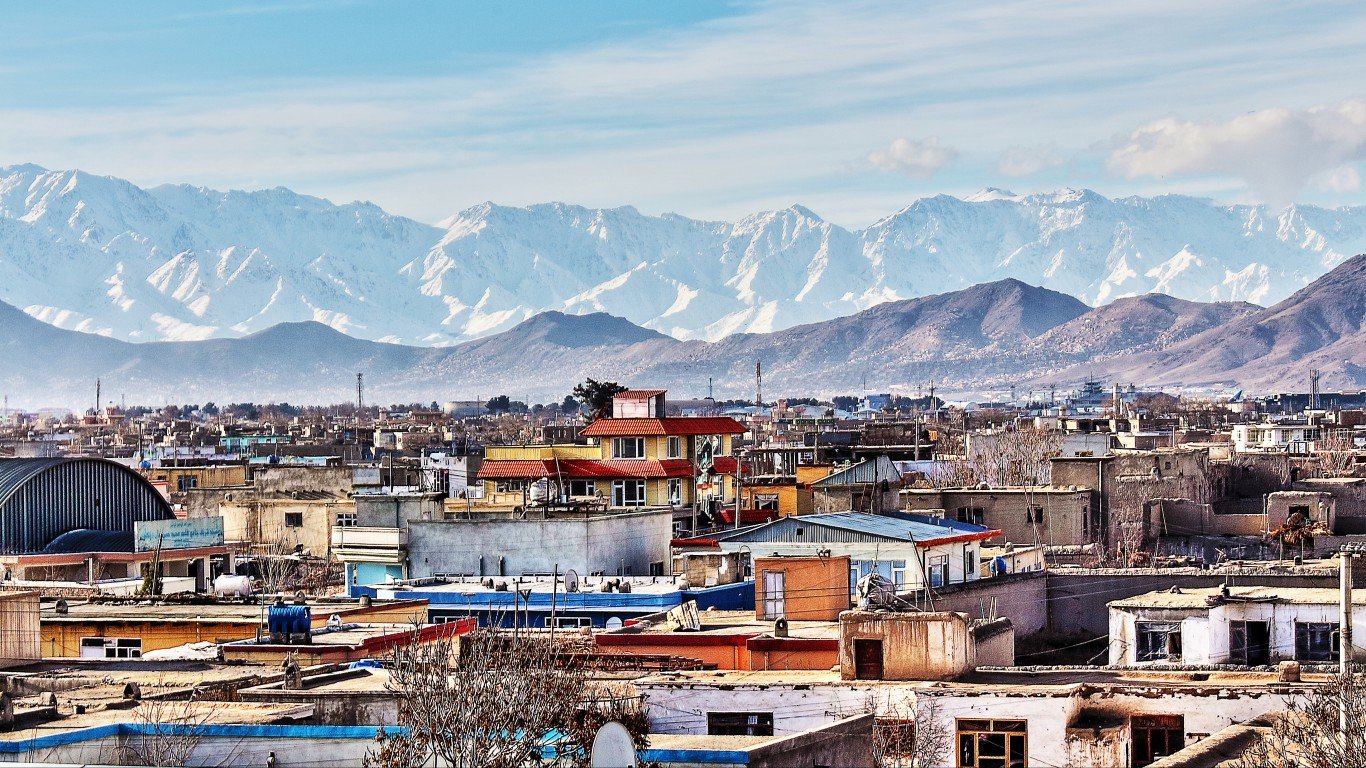
47. Pay Menar, Afghanistan
> Annual average precipitation (16 years of data): 1.1 inches
> Wettest year in database: 2016, 1.7 inches
> Wettest month on average: December, 0.8 inches
Pay Menar is a township on the outskirts of Afghanistan’s capital, Kabul. Especially warm weather in the area led to widespread droughts in 2019 — the worst in Afghanistan in a decade.
[in-text-ad-2]
Source: Erlaso / Getty Images
46. Al Wajh, Saudi Arabia
> Annual average precipitation (16 years of data): 1.1 inches
> Wettest year in database: 2013, 3.3 inches
> Wettest month on average: January, 0.4 inches
Al Wajh is warm year-round, with average highs never falling below 70 °F even during the coldest months. The summers in Al Wajh are extremely hot and dry. The city sits on the eastern shore of the Red Sea, a popular destination for swimming and easily accessible to Al Wajh residents.

45. Fallon, NV, USA
> Annual average precipitation (16 years of data): 1.0 inches
> Wettest year in database: 1997, 4.5 inches
> Wettest month on average: June, 1.2 inches
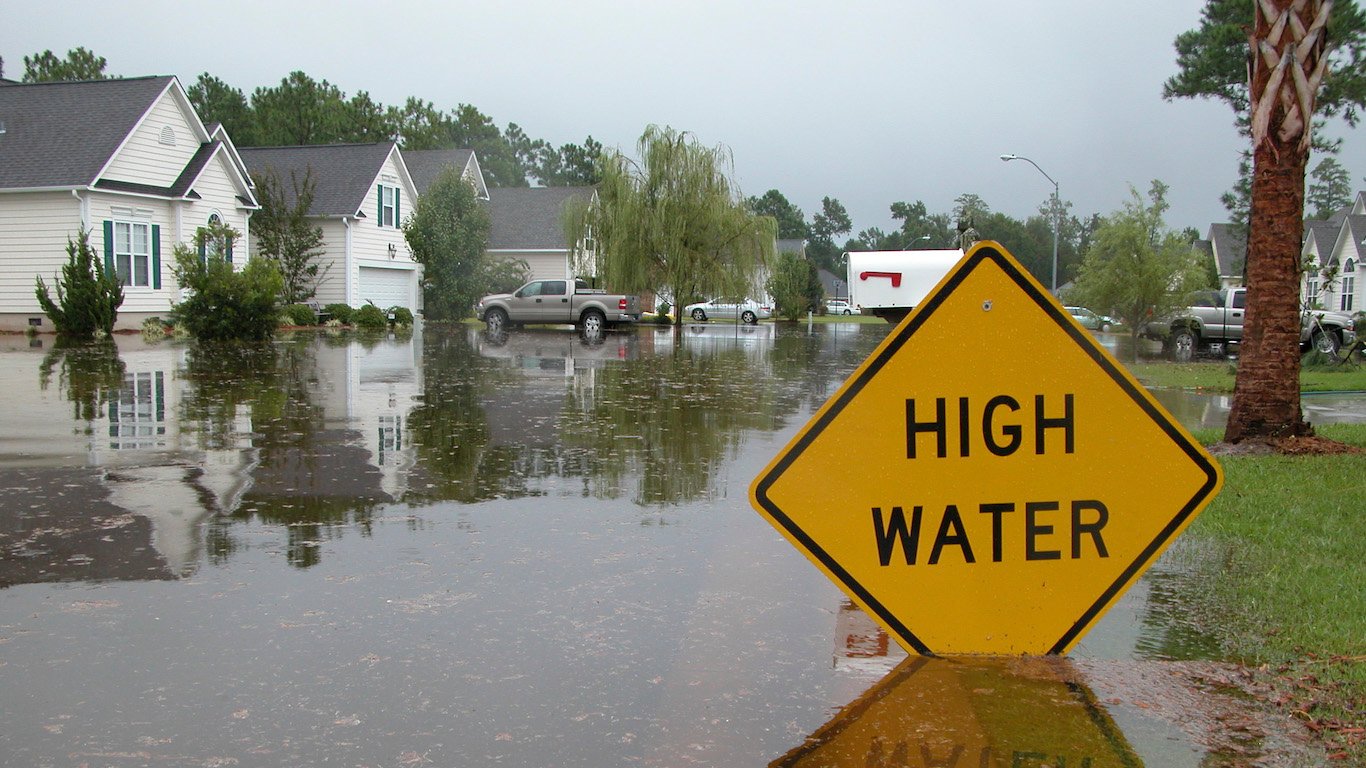
Fallon, Nevada, has a desert climate that delivers hot summers and cold winters. It is abnormally dry due to its location in the rain shadow of the Sierra Nevada, meaning that the mountains block most precipitation. Despite its relative lack of rain, Fallon is occasionally susceptible to flash floods.
[in-text-ad]
Source: Public Domain / Wikimedia Commons
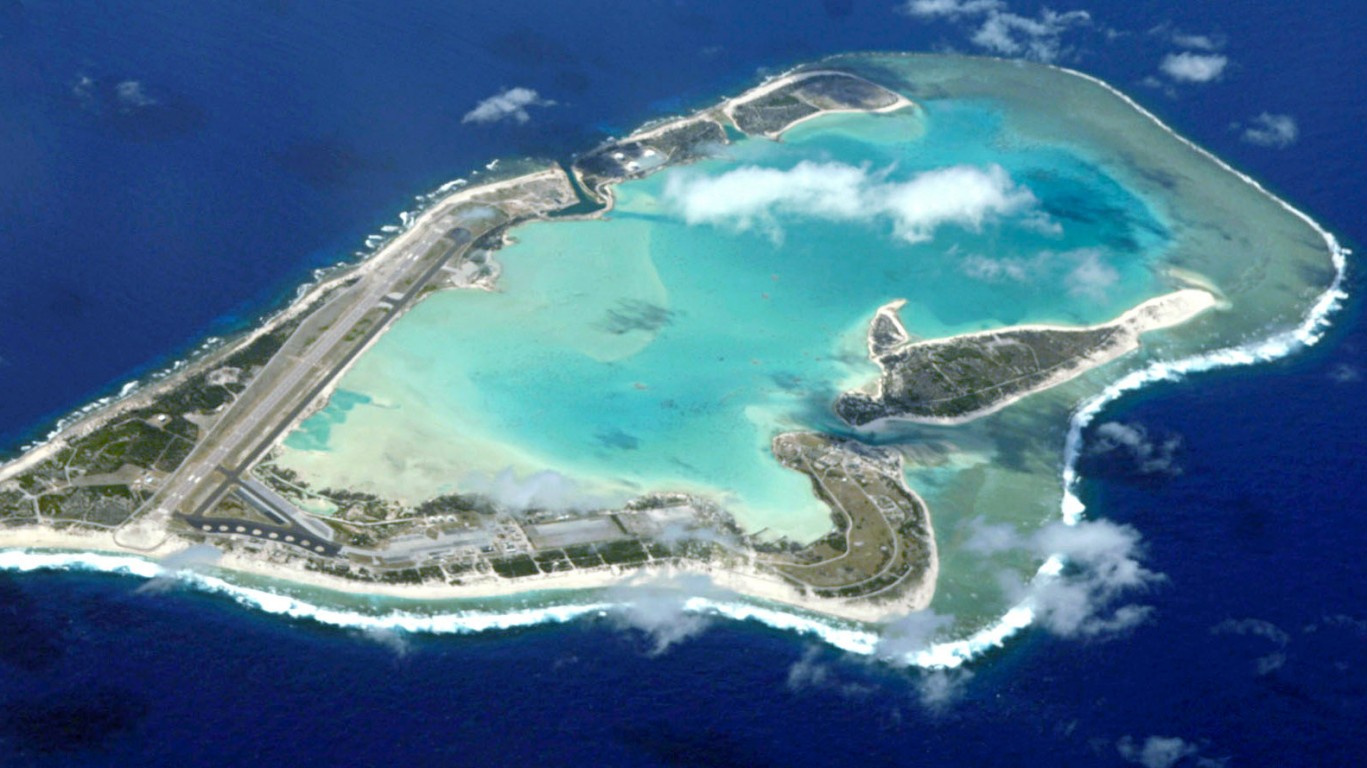
44. Wake Island, USA
> Annual average precipitation (16 years of data): 1.0 inches
> Wettest year in database: 1997, 6.2 inches
> Wettest month on average: May, 0.6 inches
Wake Island is an atoll and territory of the U.S. located nearly 2,500 miles from Hawaii in the Pacific Ocean. It was uninhabited when first discovered by explorers in the 16th century, though it is now home to about 100 residents. While rainfall is light, on average, the island is vulnerable to occasional tropical storms and typhoons.
Source: rweisswald / Getty Images
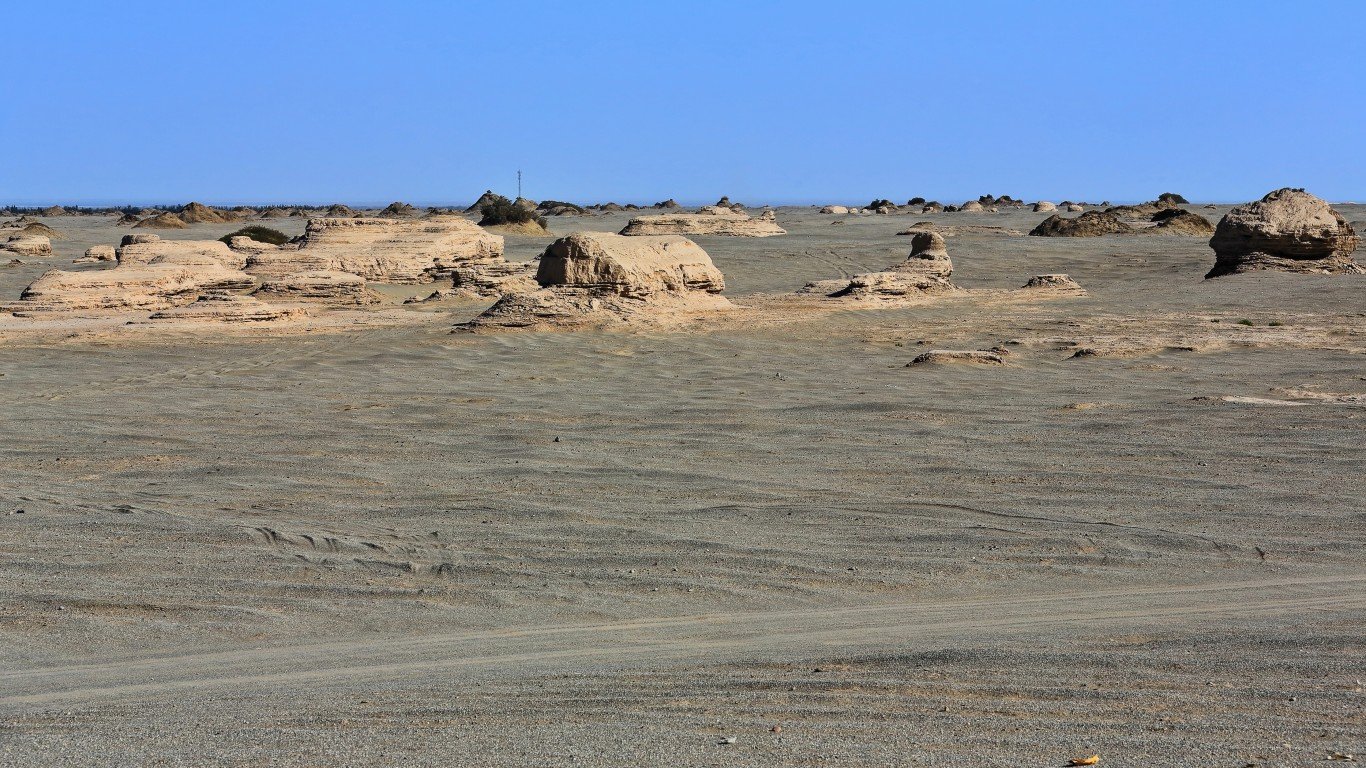
43. Ruoqiang, China
> Annual average precipitation (16 years of data): 0.9 inches
> Wettest year in database: 2003, 2.2 inches
> Wettest month on average: June, 0.4 inches
Ruoqiang is located near the southern edge of the Taklimakan Desert and has a cold desert climate. It is the driest place in China. The little rain it does receive generally falls during the summer months.
Source: frangarcia / Flickr
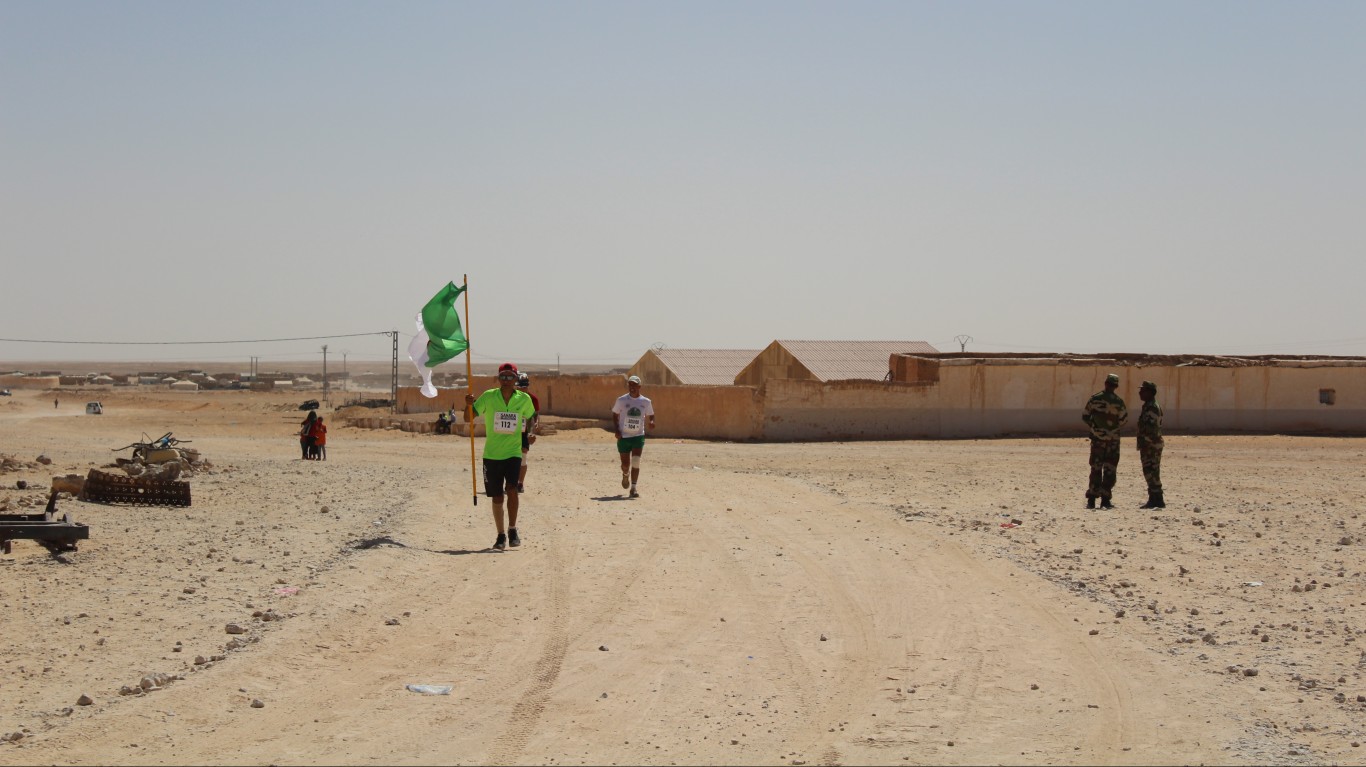
42. Tindouf, Algeria
> Annual average precipitation (16 years of data): 0.9 inches
> Wettest year in database: 2003, 3.2 inches
> Wettest month on average: October, 1.5 inches
Algeria’s Tindouf is located in the country’s westernmost region and borders Mauritania, the disputed territory Western Sahara, and Morocco. It has a subtropical hot desert climate and though it receives little rain throughout the year, it occasionally has rain-related flooding, including an event in 2015 that affected 25,000 people.
[in-text-ad-2]
Source: Adro_Hatxerre / Getty Images
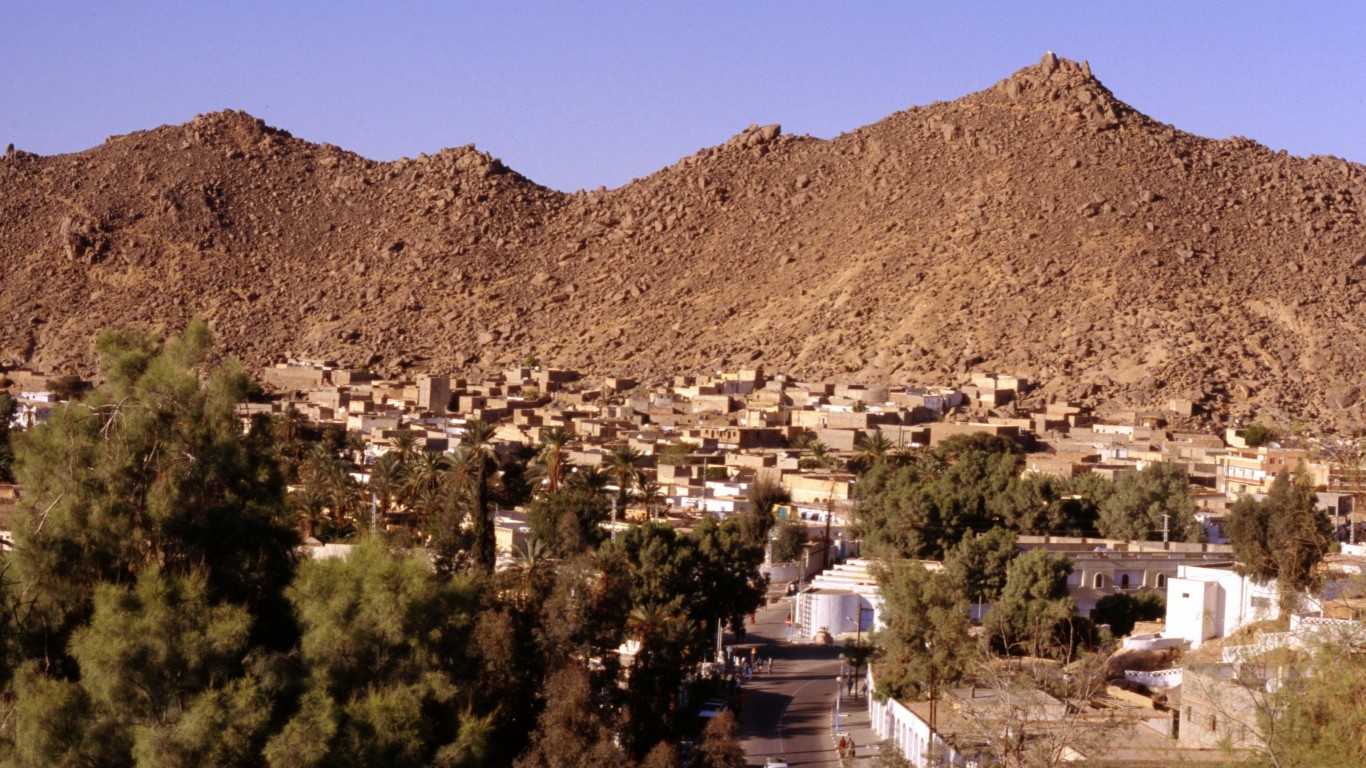
41. Atar, Mauritania
> Annual average precipitation (16 years of data): 0.9 inches
> Wettest year in database: 2008, 2.1 inches
> Wettest month on average: September, 1.3 inches
Atar is a town and an oasis located in Mauritania. Located in the Sahara Desert, it has a hot desert climate. Agriculture has suffered due to drought and water management problems in recent years.
Source: salem / Getty Images
40. Tabuk, Saudi Arabia
> Annual average precipitation (16 years of data): 0.9 inches
> Wettest year in database: 2015, 2.2 inches
> Wettest month on average: January, 0.4 inches
The oasis city of Tabuk is located in northwestern Saudi Arabia, slightly less than 300 miles from the Red Sea. It’s extremely hot, with highs reaching above 90 °F over nearly half the year.
[in-text-ad]

39. Copiapó, Chile
> Annual average precipitation (16 years of data): 0.9 inches
> Wettest year in database: 2004, 3.0 inches
> Wettest month on average: June, 0.5 inches
The arid city of Copiapó in Chile is located at the southern boundary of the Atacama Desert, about 35 miles inland from the Pacific Ocean. Though rain is rare, the occasional El niño-produced rains are followed by a field of wildflowers in northern Copiapó’s desert setting.
Source: Gruban / Patrick Gruban from Munich, Germany / Wikimedia Commons
38. Illizi, Algeria
> Annual average precipitation (16 years of data): 0.9 inches
> Wettest year in database: 2000, 2.4 inches
> Wettest month on average: October, 0.2 inches
Illizi is another exceedingly dry town found in the Sahara — the second largest desert on Earth after Antarctica. It has a hot desert climate, with long and oppressive summers and short, warm winters. The summers are the driest time of year, with nearly no rainfall.

37. Concordia Station, Antarctica
> Annual average precipitation (16 years of data): 0.9 inches
> Wettest year in database: 2018, 2.5 inches
> Wettest month on average: April, 0.1 inches
Concordia research station in Antarctica is extremely isolated and generally populated by fewer than 100 European researchers. The sun never fully sets during summer, and it doesn’t rise for months during the winter. The station is located in the world’s largest desert, where temperatures have been recorded at -112 ºF.
[in-text-ad-2]
Source: Leonid Andronov / Getty Images
36. Ouargla, Algeria
> Annual average precipitation (16 years of data): 0.9 inches
> Wettest year in database: 2000, 1.5 inches
> Wettest month on average: October, 0.3 inches
The Algerian desert city Ouargla may have reached a record-smashing (for Africa) temperature of 124.3 ºF in July, 2018, according to an unconfirmed report published in the Washington Post. The Saharan location is historically dry as well, with one report from 1893 claiming that the city had not had rain for two years.
Source: dr322 / Getty Images
35. Masirah (island), Oman
> Annual average precipitation (16 years of data): 0.8 inches
> Wettest year in database: 1997, 4.6 inches
> Wettest month on average: November, 0.2 inches
Masirah Island is located off Oman’s east coast. It has a hot desert climate, featuring long hot summers and shorter, warm winters. The island is only reachable by plane or ferry.
[in-text-ad]
Source: mdworschak / Getty Images
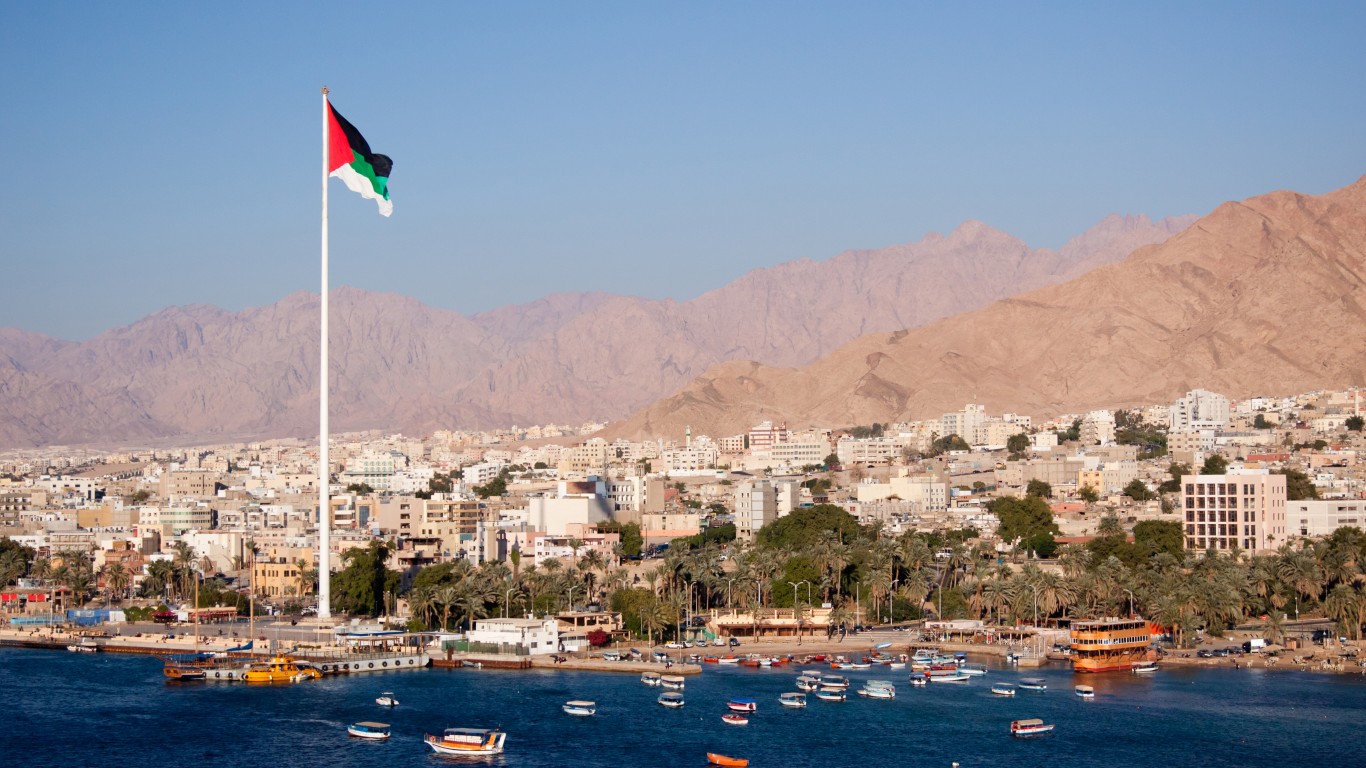
34. Aqaba, Jordan
> Annual average precipitation (16 years of data): 0.7 inches
> Wettest year in database: 2018, 1.7 inches
> Wettest month on average: February, 0.2 inches
Aqaba is located in southwestern Jordan, on the Red Sea’s Gulf of Aqaba. While Jordan is generally very dry, Aqaba is the driest part of the country.
 24/7 Wall St.
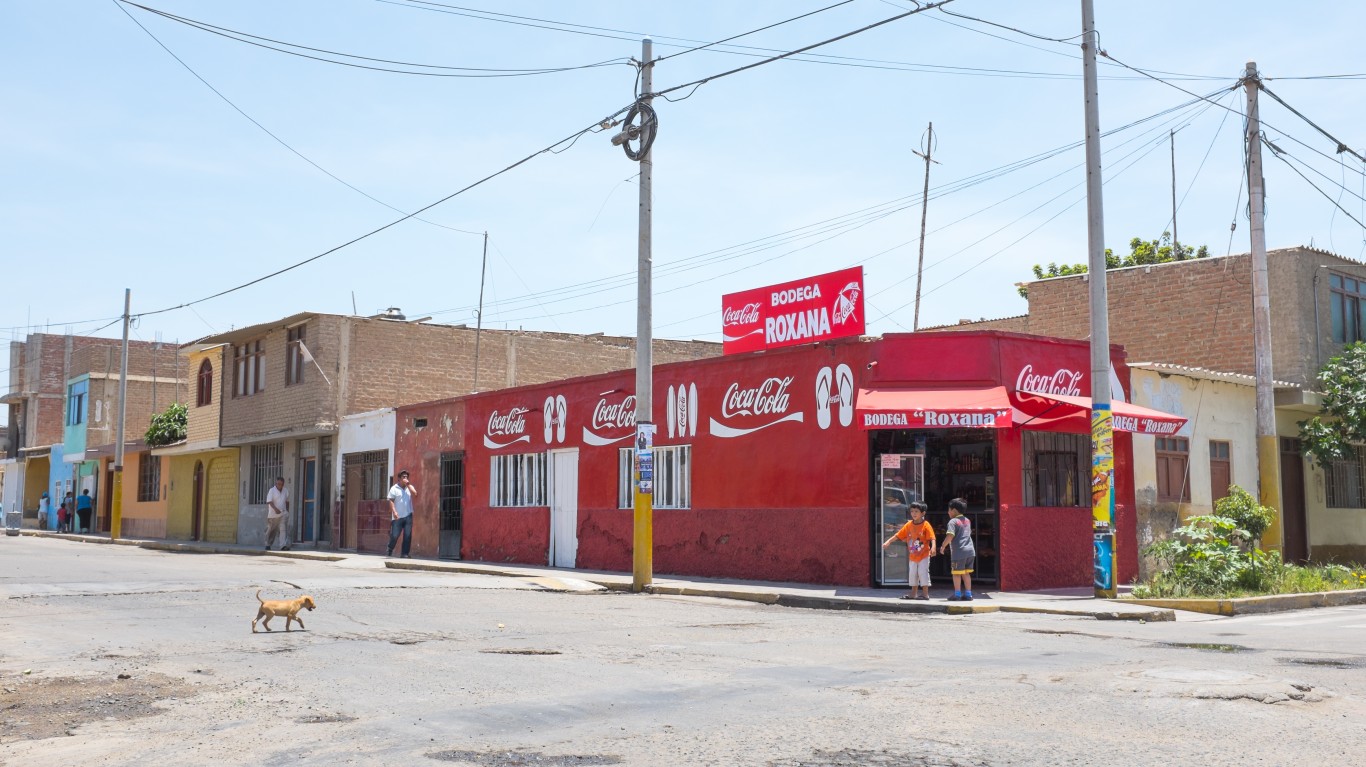
Source: Christopher Crouzet / Wikimedia Commons
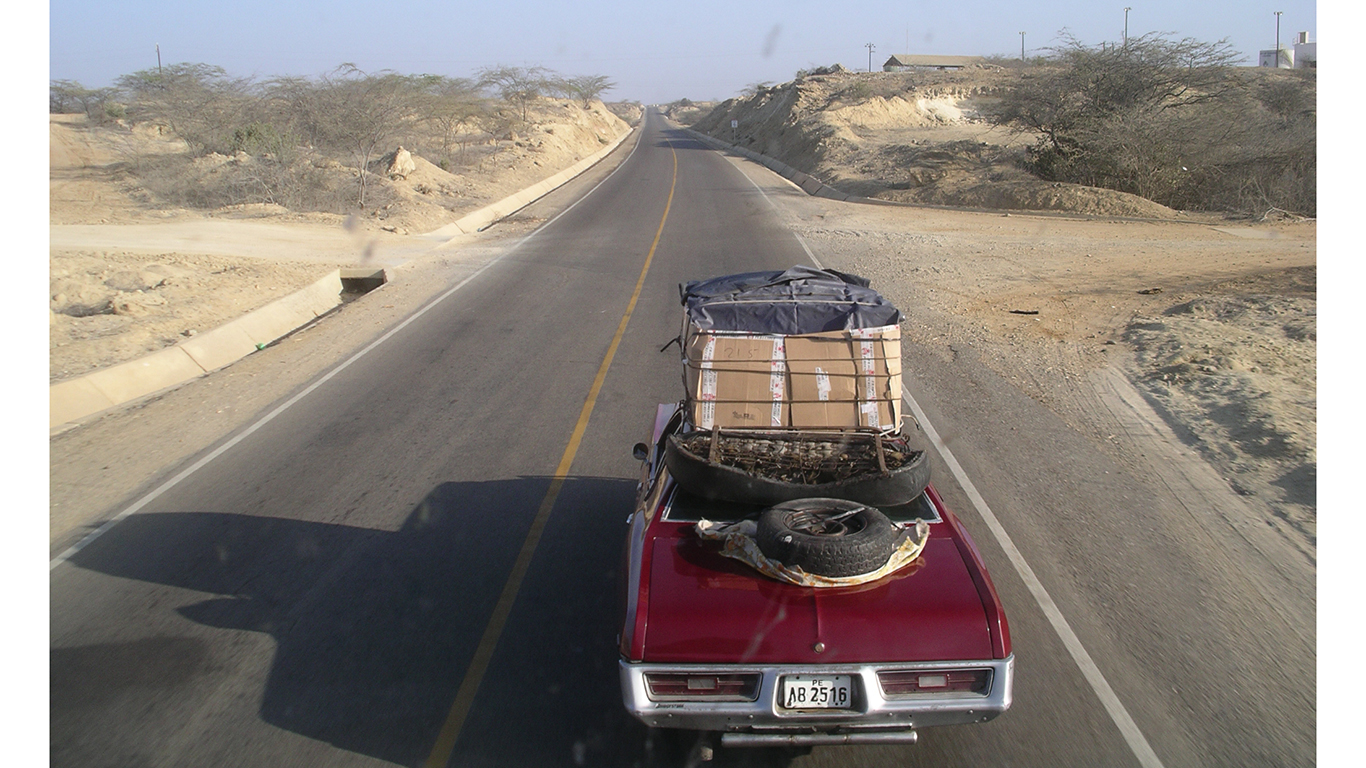
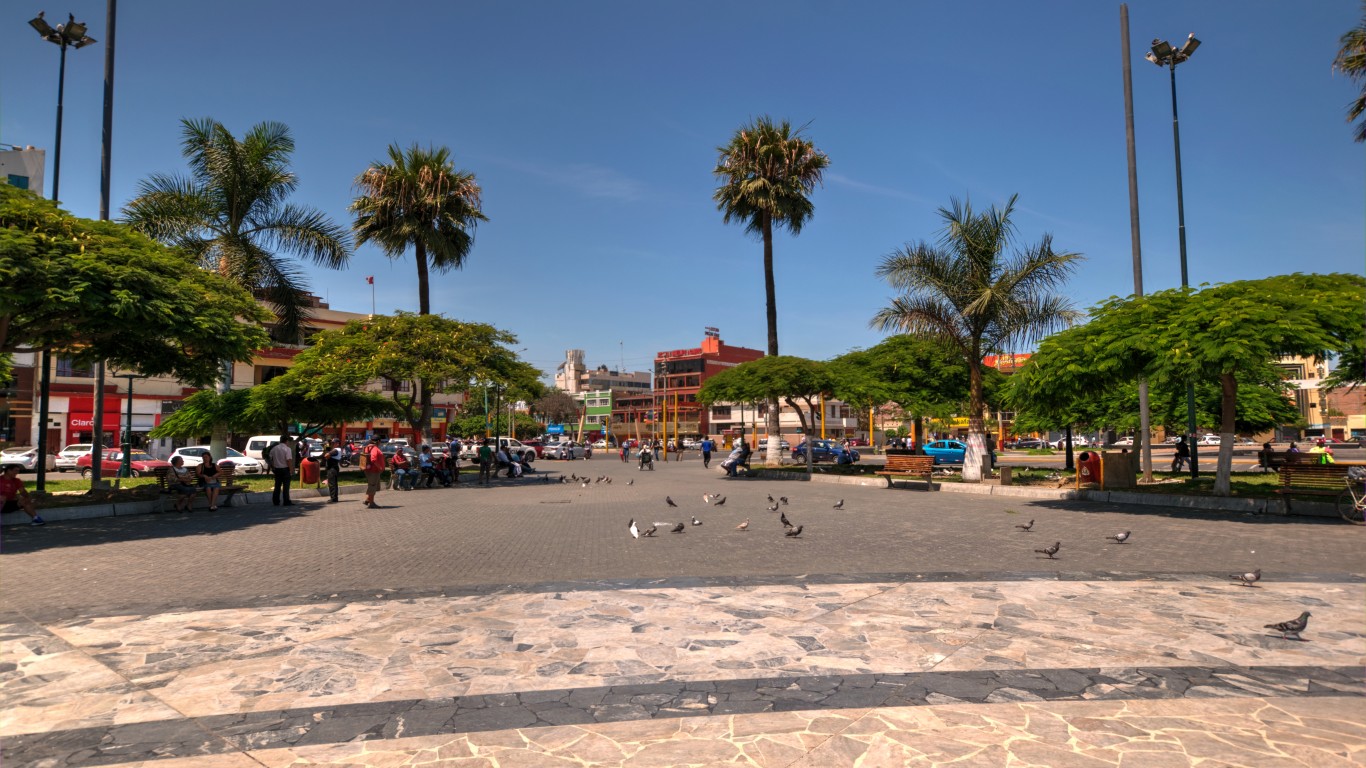
33. Chiclayo, Peru
> Annual average precipitation (16 years of data): 0.7 inches
> Wettest year in database: 2008, 2.1 inches
> Wettest month on average: March, 0.4 inches
Chiclayo is Peru’s fourth largest city. It is located slightly inland from the coast. It has a subtropical arid climate. While many cities located near the equator — as Chiclayo is — receive an above average amount of precipitation, the Peruvian city is arid due to the cold Humboldt current that runs along South America’s coast and cools the marine air.
Source: Jgremillot / Wikimedia Commons
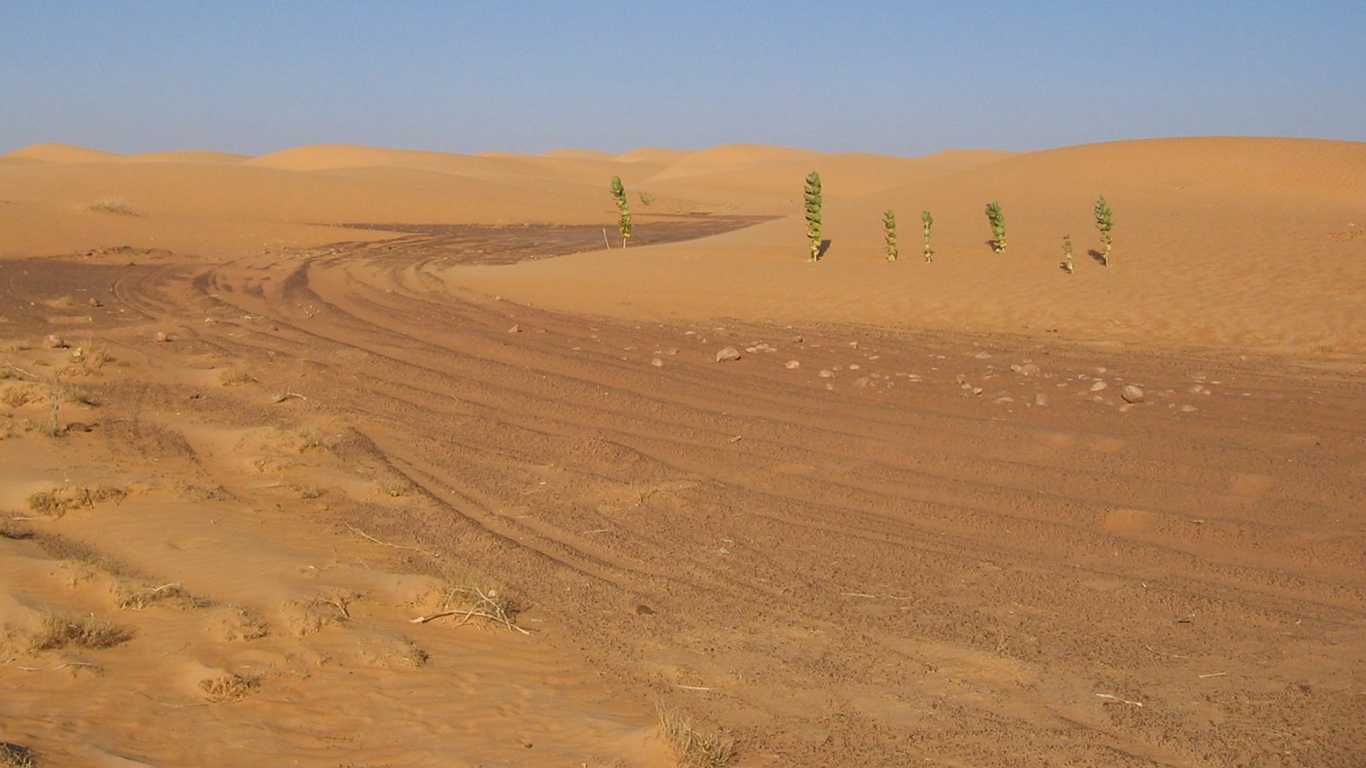
32. Bir Moghrein, Mauritania
> Annual average precipitation (16 years of data): 0.7 inches
> Wettest year in database: 2003, 2.2 inches
> Wettest month on average: October, 2.1 inches
Bir Moghrein is a town with around 3,000 residents located in northern Mauritania, near the Western Sahara border. The desert city receives very little rain throughout most of the year, though an average of 2.1 inches fell during the 16 years considered for this list.
[in-text-ad-2]
Source: Oussama MOKRANE / Getty Images
31. In Amenas, Algeria
> Annual average precipitation (16 years of data): 0.7 inches
> Wettest year in database: 2005, 3.0 inches
> Wettest month on average: October, 0.2 inches
In Amenas, which is located in eastern Algeria, along the Libyan border, became the subject of international news in 2013, when a local gas plant was attacked by Islamic militants. The town is located near the center of the exceedingly arid Sahara.
Source: ThCh / Getty Images
30. Dakhla, Western Sahara (Morocco)
> Annual average precipitation (16 years of data): 0.7 inches
> Wettest year in database: 2005, 2.3 inches
> Wettest month on average: September, 0.4 inches
Dakhla is located on a narrow peninsula protruding from Western Sahara’s west coast. It receives almost no precipitation, and residents must import their drinking water. Skies are generally sunny and clear year-round, though the town occasionally receives a rare rainfall.
[in-text-ad]
Source: Yasmine Issa / Getty Images
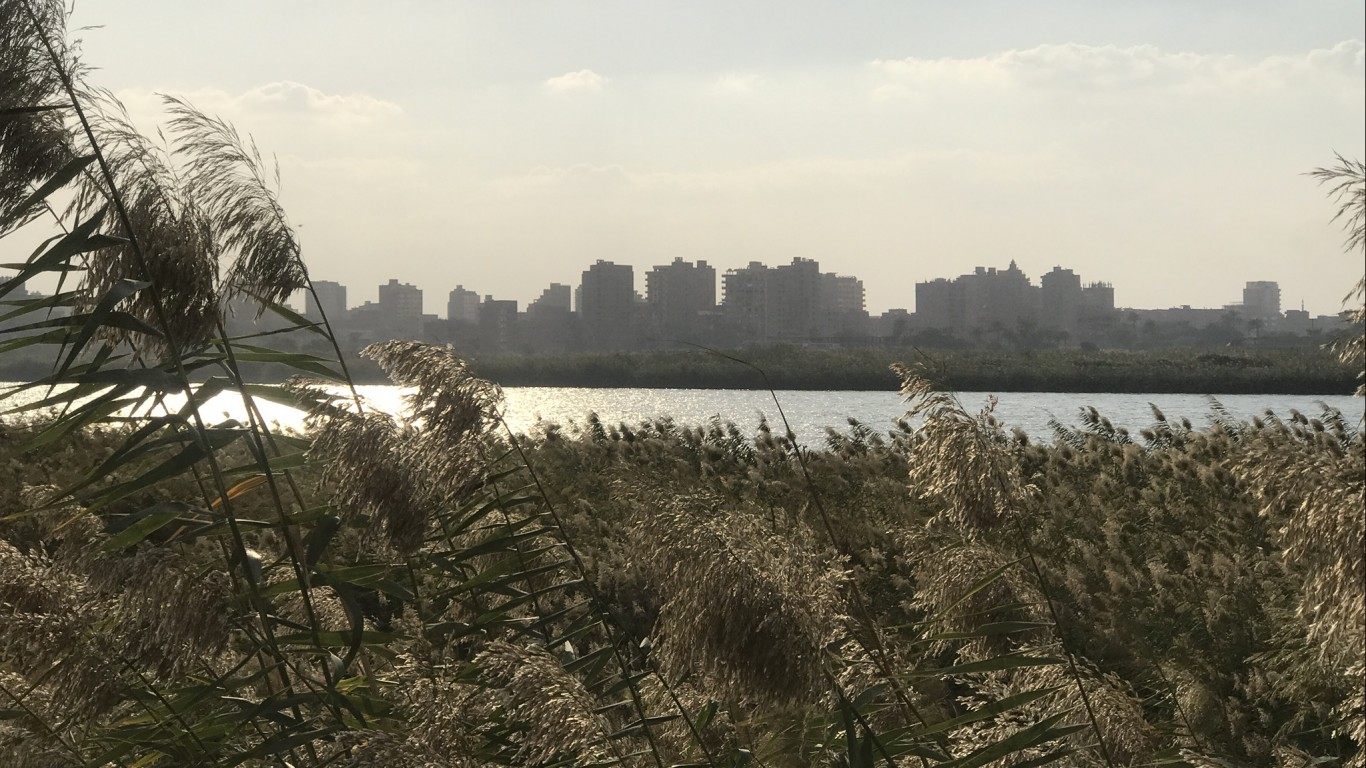
29. Helwan, Egypt
> Annual average precipitation (16 years of data): 0.7 inches
> Wettest year in database: 1998, 1.3 inches
> Wettest month on average: February, 0.2 inches
Helwan is an industrial suburb on the bank of the Nile River, south of Egypt’s capital Cairo. It has a hot desert climate and can receive its annual rainfall within one day.
 24/7 Wall St.
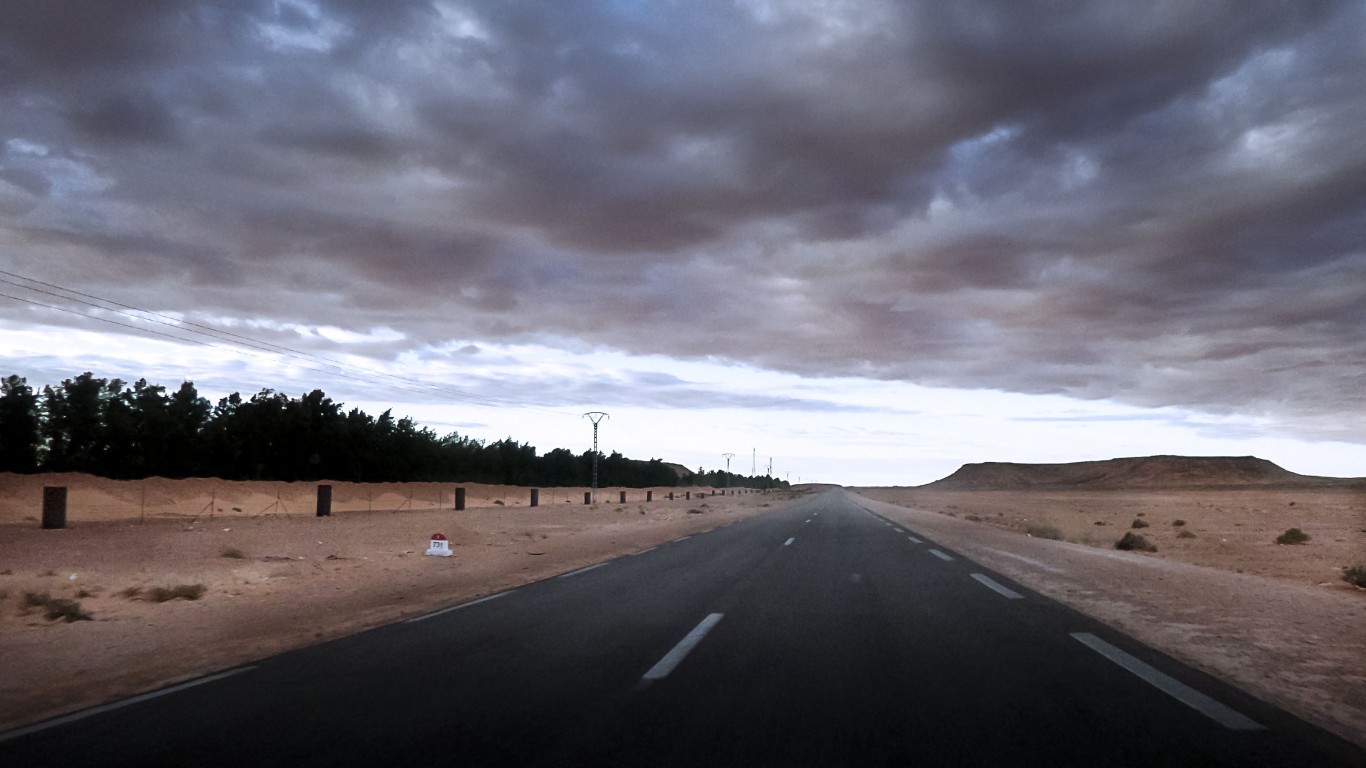
Source: habibkaki / Flickr
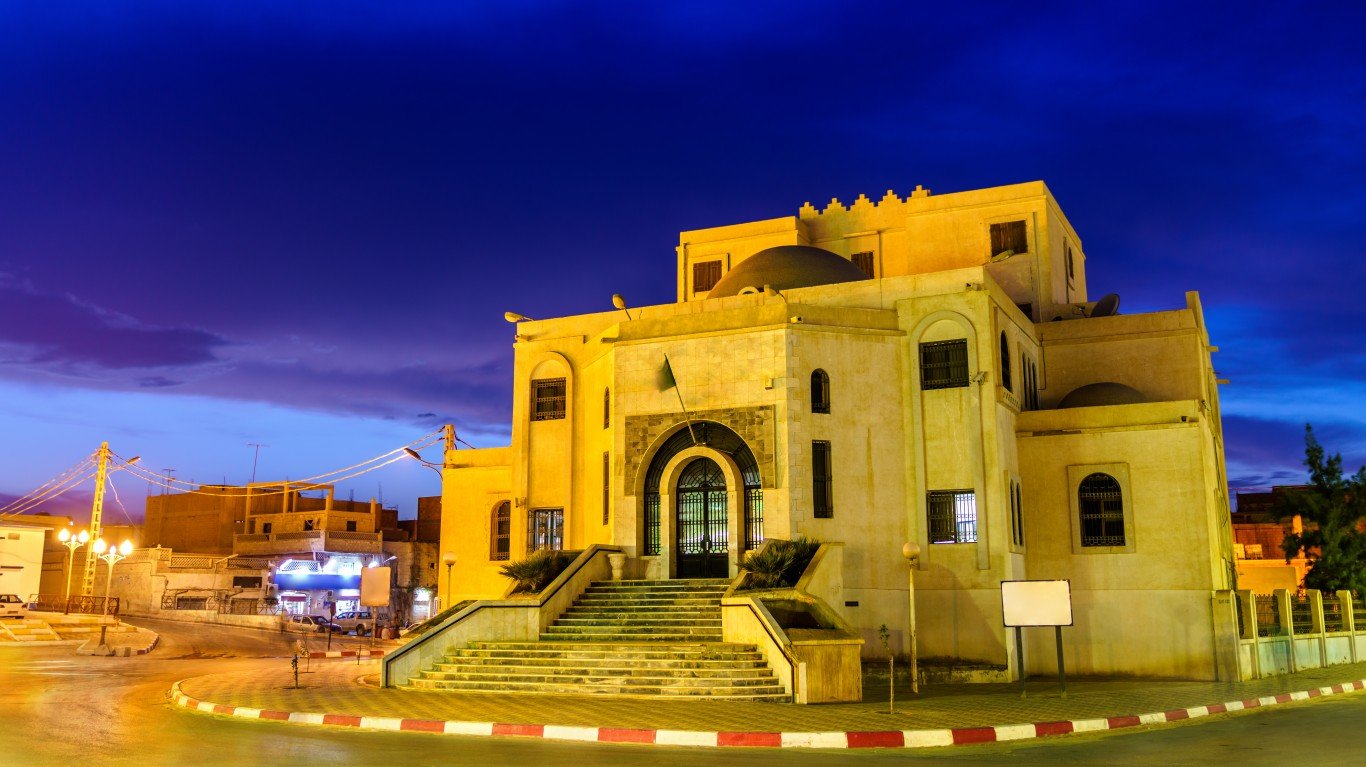
28. Hassi Fehal, Algeria
> Annual average precipitation (16 years of data): 0.7 inches
> Wettest year in database: 2003, 1.4 inches
> Wettest month on average: March, 0.2 inches
Hassi Fehal is a town located within Algeria’s Ghardaïa Province. It has a population of about 4,000. Residents see very little rain throughout the year. During its wettest month, March, an average of just 0.2 inches of rain falls throughout the month.

27. Merowe, Sudan
> Annual average precipitation (16 years of data): 0.6 inches
> Wettest year in database: 2007, 3.1 inches
> Wettest month on average: August, 0.4 inches
Merowe is a Sudanese town built along the Nile. It has a desert climate and receives only 0.6 inches of rain per year, though more than five times this amount of rain fell in 2007.
[in-text-ad-2]
Source: Siempreverde22 / Getty Images
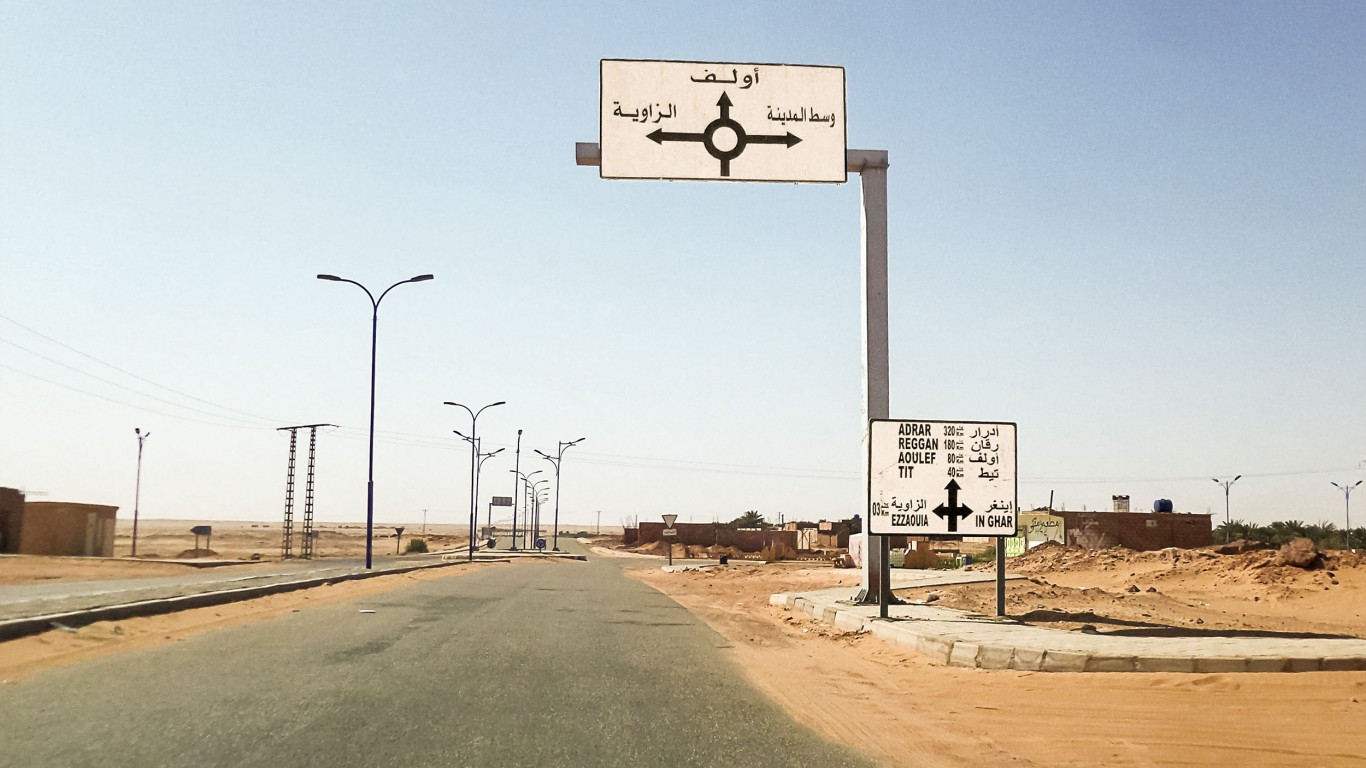
26. Adrar, Algeria
> Annual average precipitation (16 years of data): 0.5 inches
> Wettest year in database: 1999, 2.1 inches
> Wettest month on average: September, 0.1 inches
Formerly known as Timmi, Adrar is the largest settlement among Algeria’s Touat oasis group. It is surrounded by sand-covered plains. While the city only receives an average of 0.5 inches of rain per year, it is susceptible to rare heavy rains. According to the Algeria Press Service, about 20 buildings collapsed due to heavy rainfall in September 2018.
Source: chriss73 / Getty Images
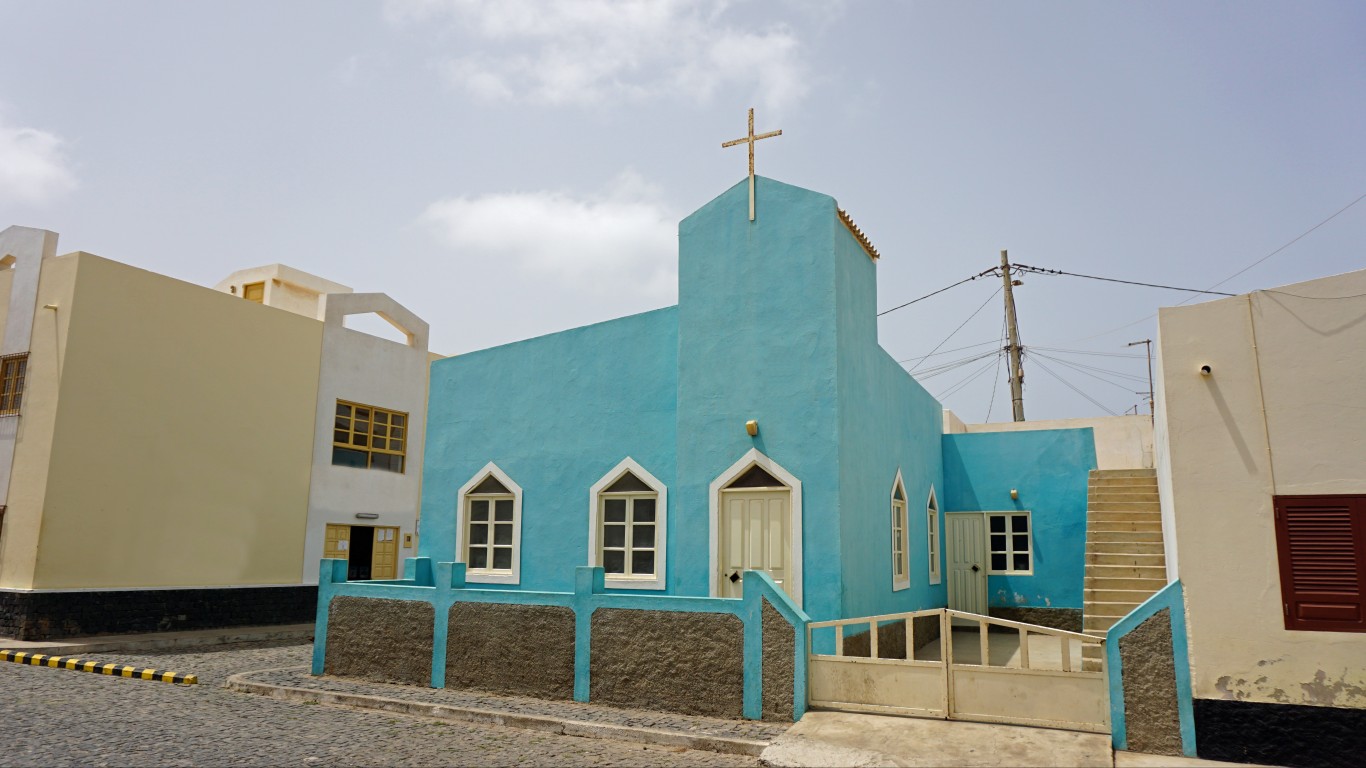
25. Palmeira, Cape Verde
> Annual average precipitation (16 years of data): 0.5 inches
> Wettest year in database: 2016, 4.6 inches
> Wettest month on average: September, 2.0 inches
Palmeira is a town on Cape Verde’s northernmost island, Sal. It is Sal’s main fishing and trading port, handling imports and exports. Sal is sandy and arid, with Palmeira receiving the least amount of precipitation in all of Cape Verde.
[in-text-ad]

24. Thumrait, Oman
> Annual average precipitation (16 years of data): 0.5 inches
> Wettest year in database: 2018, 3.6 inches
> Wettest month on average: May, 0.2 inches
Thumrait is located in southern Oman, approximately 50 miles from the coast. It has a hot desert climate and receives very little rain, though there is occasionally an uptick during the summer monsoon season.
Source: Hamdanmourad / Wikimedia Commons
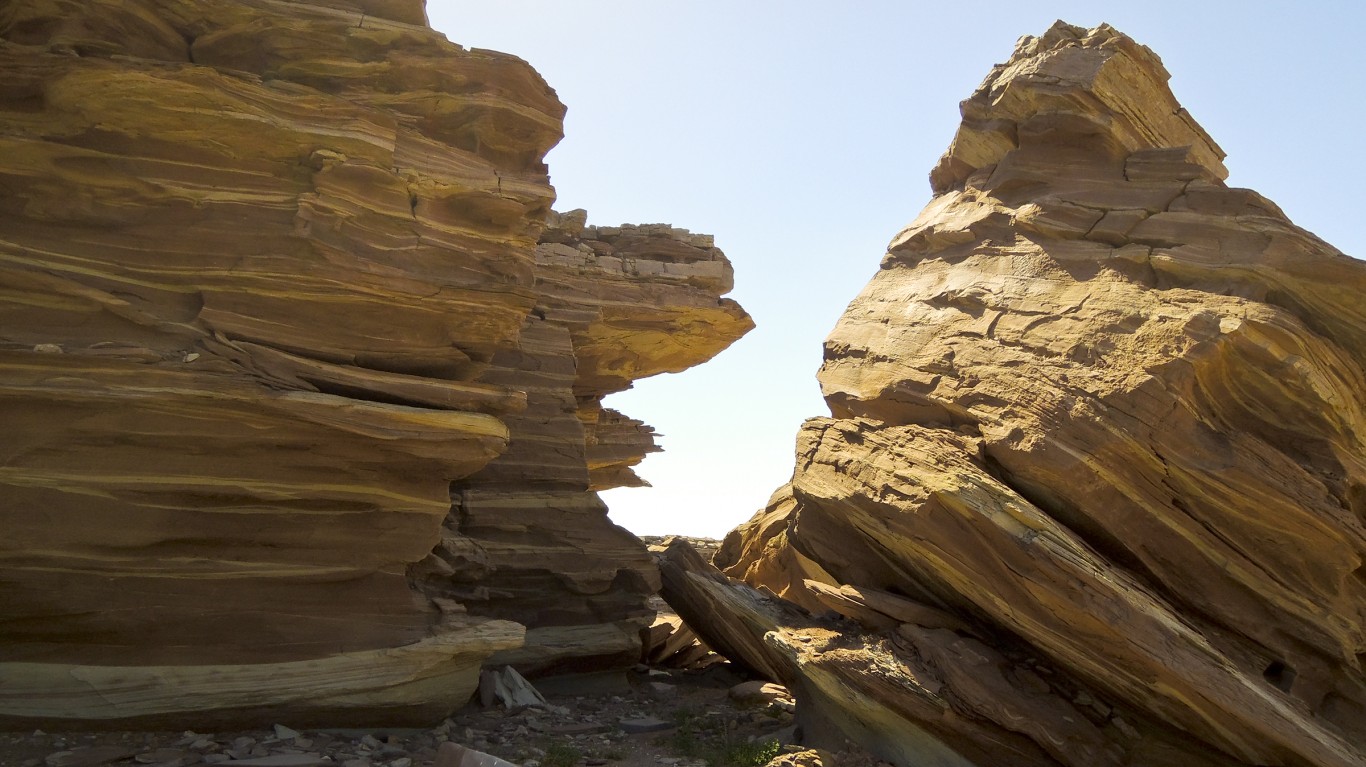
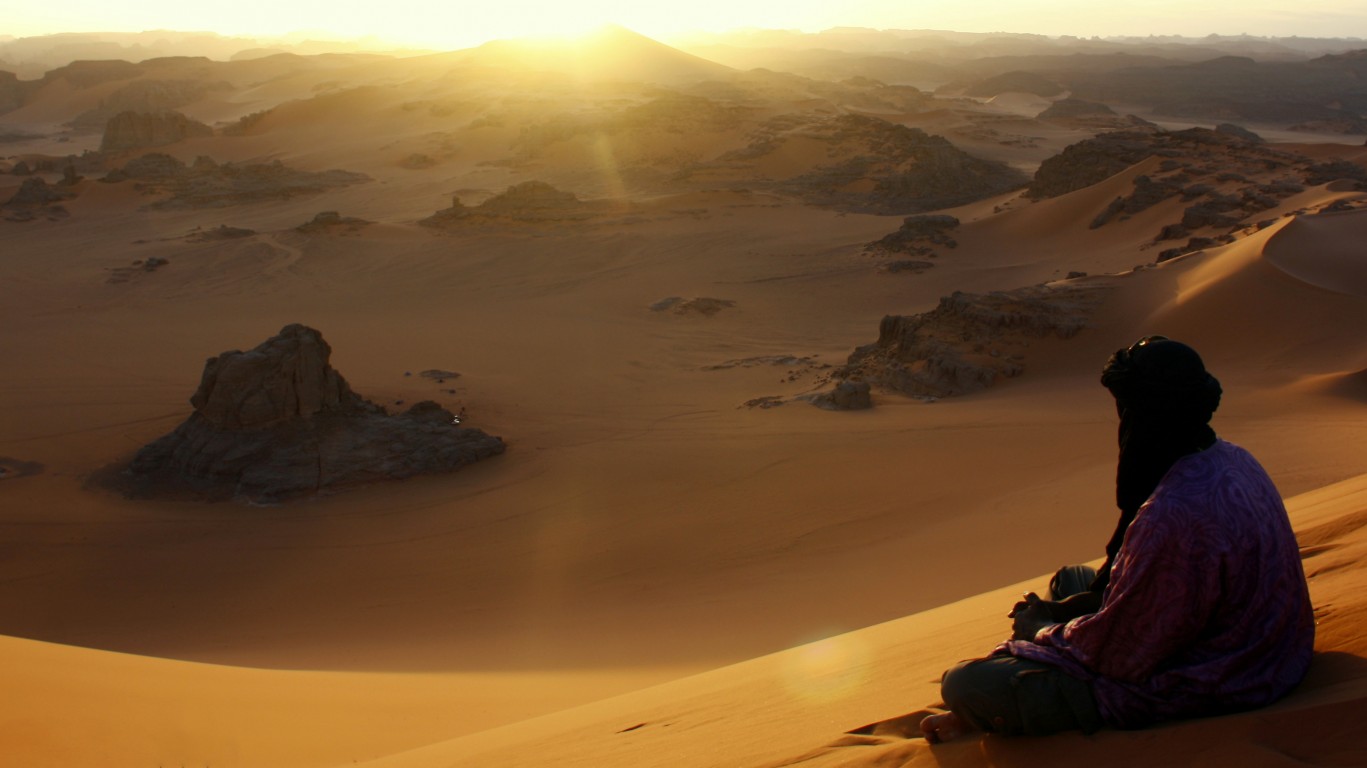
23. Djanet, Algeria
> Annual average precipitation (16 years of data): 0.5 inches
> Wettest year in database: 2005, 2.4 inches
> Wettest month on average: June, 0.1 inches
Djanet is a desert oasis located in the southeastern portion of Algeria, where the country borders Niger and Libya. The region is famous for its massive sand dunes and rocky canyons. On average, it only receives 0.1 inches of rain during June — its rainiest month.
Source: habib kaki / Wikimedia Commons
22. Azekkour, Algeria
> Annual average precipitation (16 years of data): 0.5 inches
> Wettest year in database: 2008, 1.4 inches
> Wettest month on average: October, 0.2 inches
Also located within Saharan Algeria is the town of Azekkour. Over the 16 years of rainfall data, Azekkour only received an average of 0.5 inches of rain a year. During 2008, an especially wet year for the region, 1.4 inches of precipitation fell.
[in-text-ad-2]
Source: Chapultepec at English Wikipedia / Wikimedia Commons
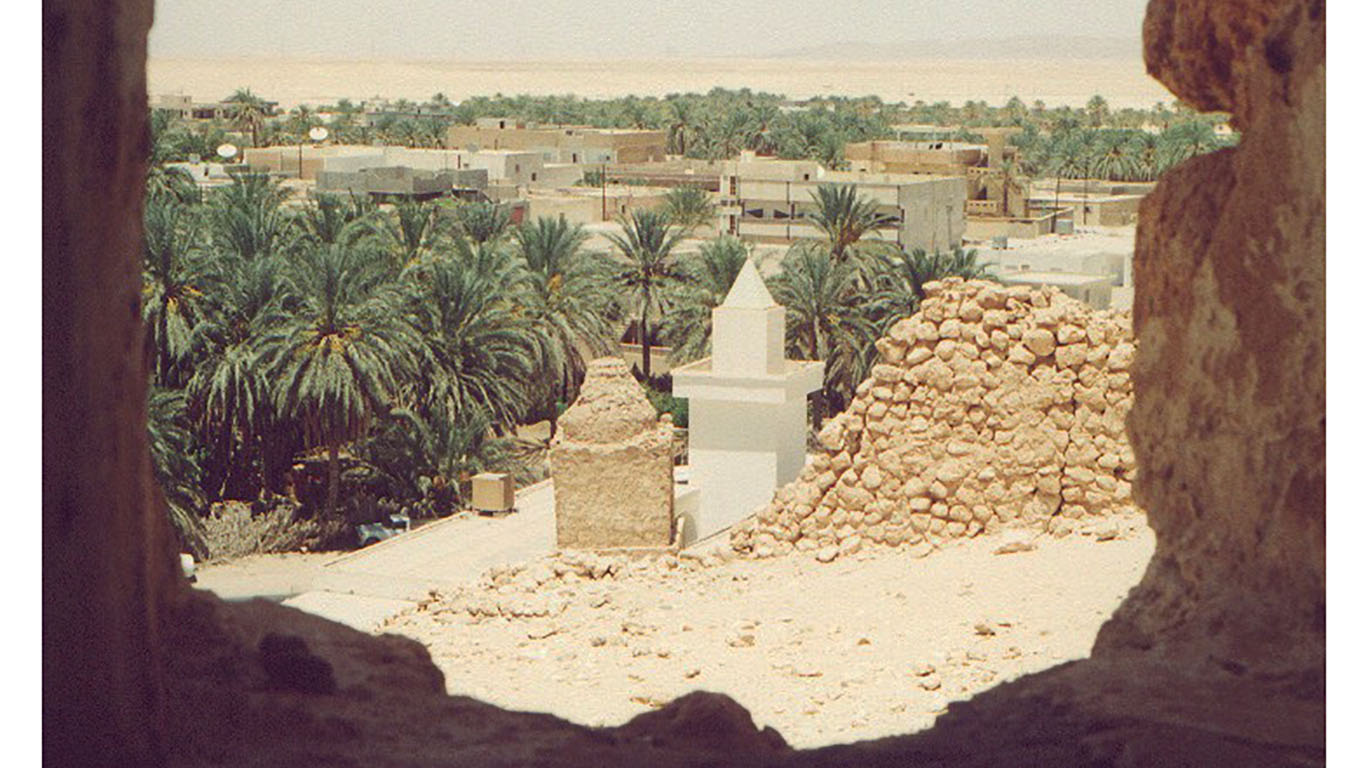
21. Waddan, Libya
> Annual average precipitation (16 years of data): 0.5 inches
> Wettest year in database: 2013, 1.6 inches
> Wettest month on average: April, 0.2 inches
Waddan is an oasis town in Libya’s Al-Jufra region. Libya is one of the world’s driest countries, and Waddan is among its driest towns — receiving an average of 0.5 inches of rain annually over 16 years of recent data.
Source: officek_ki / Getty Images
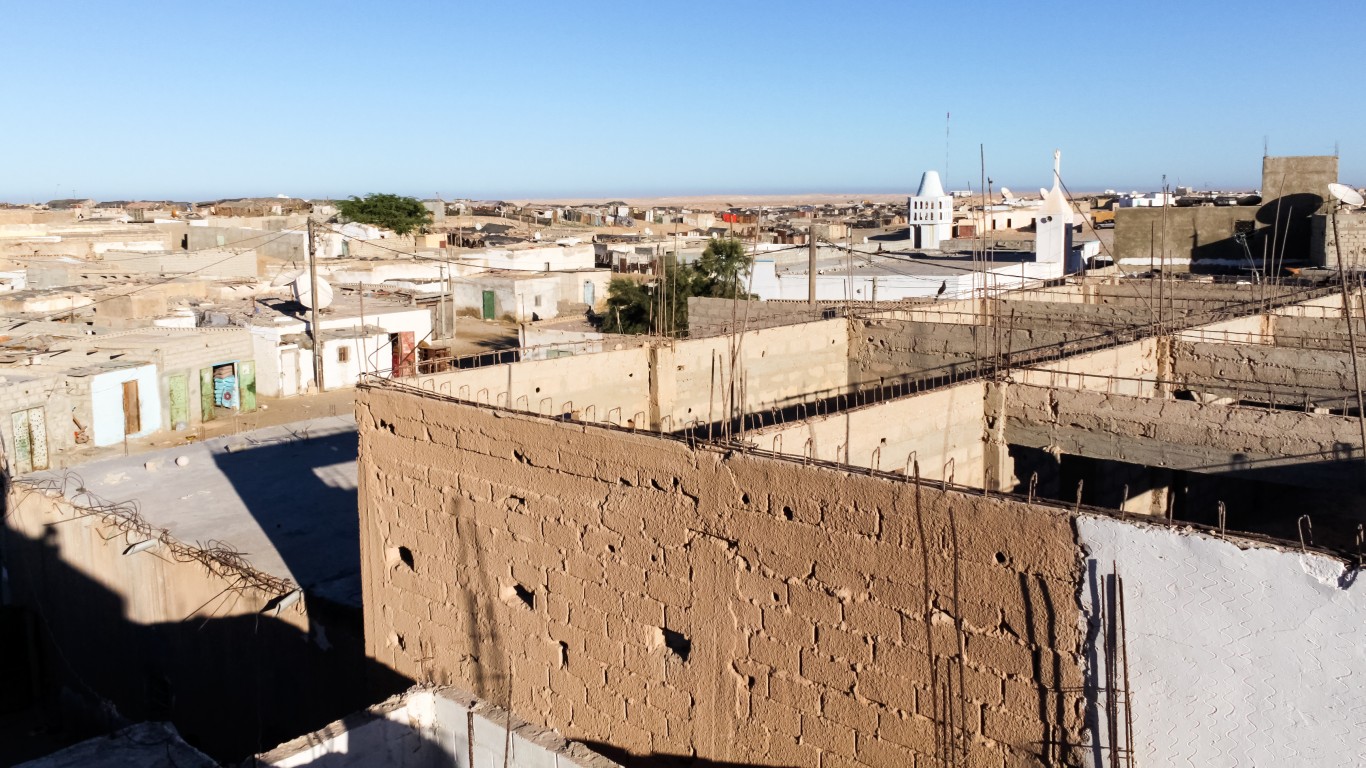
20. Nouadhibou, Mauritania
> Annual average precipitation (16 years of data): 0.4 inches
> Wettest year in database: 2010, 3.7 inches
> Wettest month on average: October, 0.4 inches
Formerly known as Port-Étienne, Nouadhibou is a town located on Mauritania’s Cape Nouadhibou peninsula. While morning mist and fog are not uncommon, rain is scarce due in part to cold currents flowing up the coast.
[in-text-ad]
Source: habibkaki / Flickr
19. Ain Salah, Algeria
> Annual average precipitation (16 years of data): 0.4 inches
> Wettest year in database: 1999, 1.3 inches
> Wettest month on average: January, 0.1 inches
Ain Salah is an oasis town in central Algeria, with an irrigation-driven agricultural history. It has a desert climate and is home to the highest recorded temperature in Algeria — 123 °F. It is one of the most arid regions on Earth, and surface water is especially scant.
 24/7 Wall St.
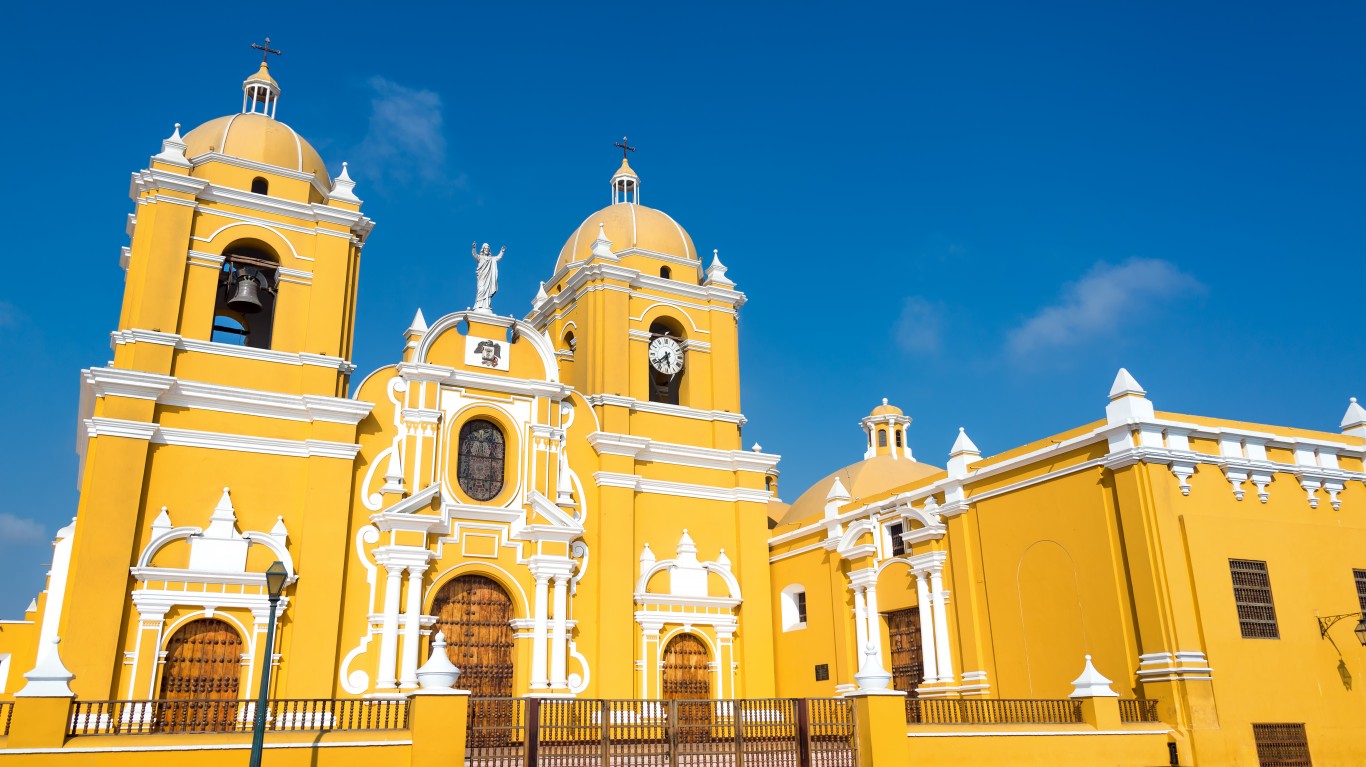
Source: DC_Colombia / Getty Images
18. Trujillo, Peru
> Annual average precipitation (16 years of data): 0.4 inches
> Wettest year in database: 2003, 1.2 inches
> Wettest month on average: February, 0.2 inches
Trujillo, a coastal desert city, is Peru’s third largest city by population. It has an extremely arid climate thanks to the Humboldt sea current. Trujillo sees very little rain, and when it does rain, it is only for a short period.
Source: Jupiterimages / Getty Images
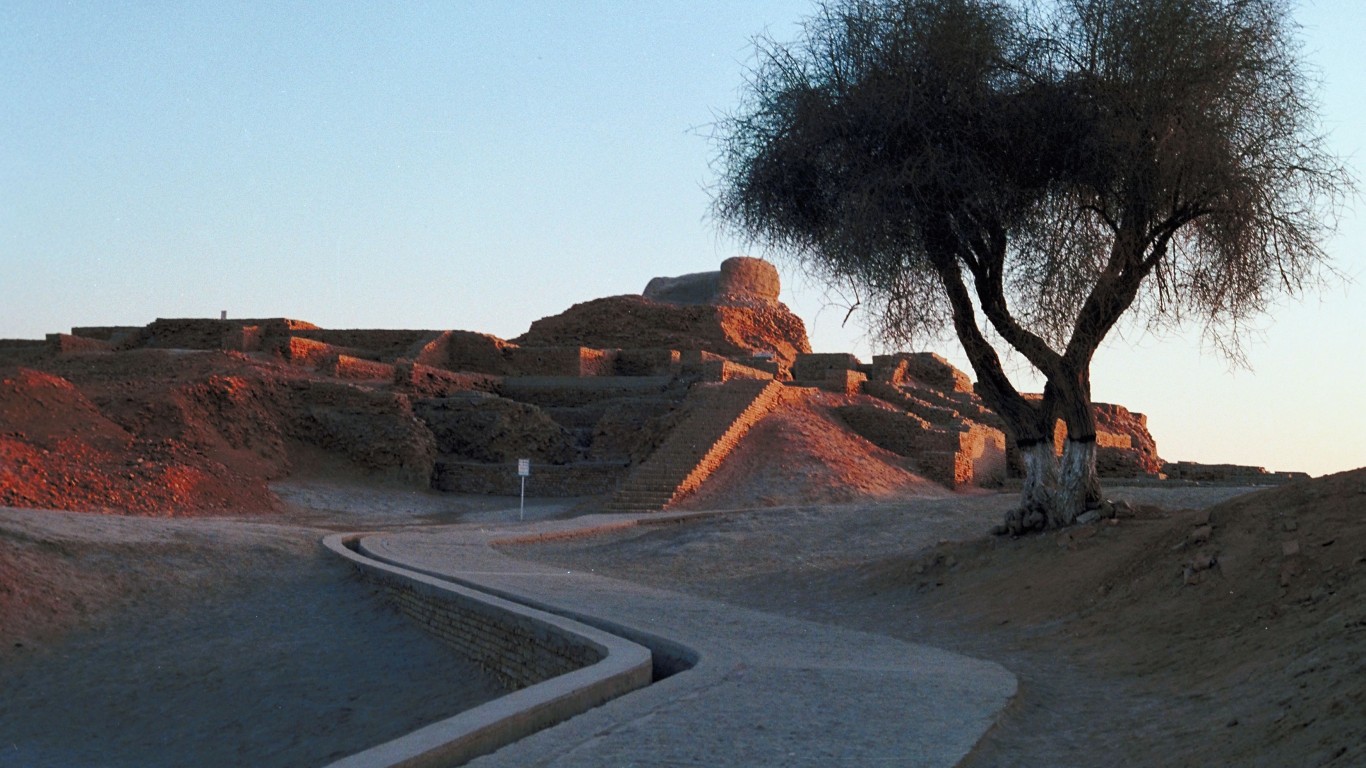
17. Nawabshah, Pakistan
> Annual average precipitation (16 years of data): 0.4 inches
> Wettest year in database: 2003, 1.6 inches
> Wettest month on average: August, 0.7 inches
The city of Nawabshah in southern Pakistan set a world record for April in 2018, with a temperature of 122.7 ºF. During 2003 — the wettest year of the 16 considered for this article — Nawabshah only received 1.6 inches of rainfall.
[in-text-ad-2]
Source: purecreatives / Getty Images
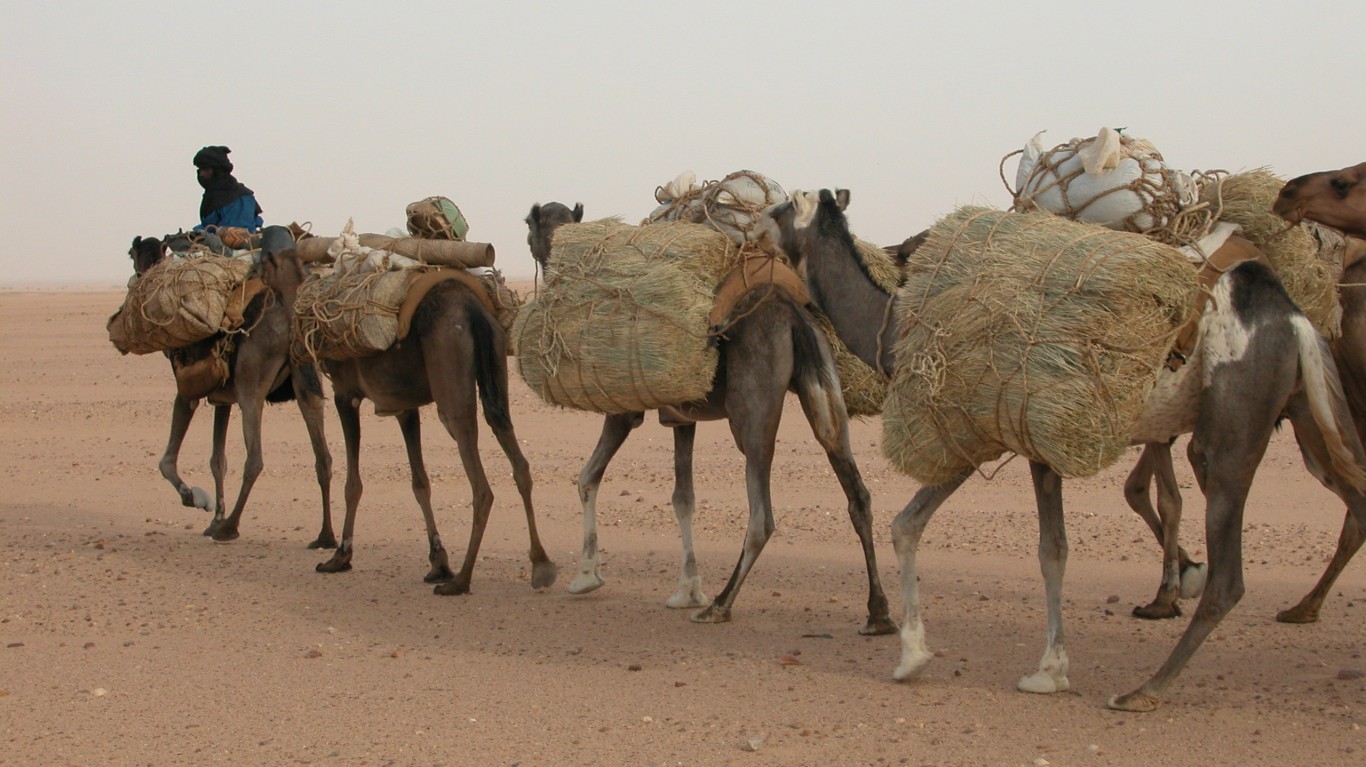
16. Bilma, Niger
> Annual average precipitation (16 years of data): 0.3 inches
> Wettest year in database: 2004, 1.2 inches
> Wettest month on average: August, 0.2 inches
Located in northeast Niger, in the heart of the Sahara, Bilma has a hot weather climate with high temperatures year-round. The town receives rare rains in summer, with August as its wettest month.
Source: David Haberlah at English Wikipedia / Wikimedia Commons
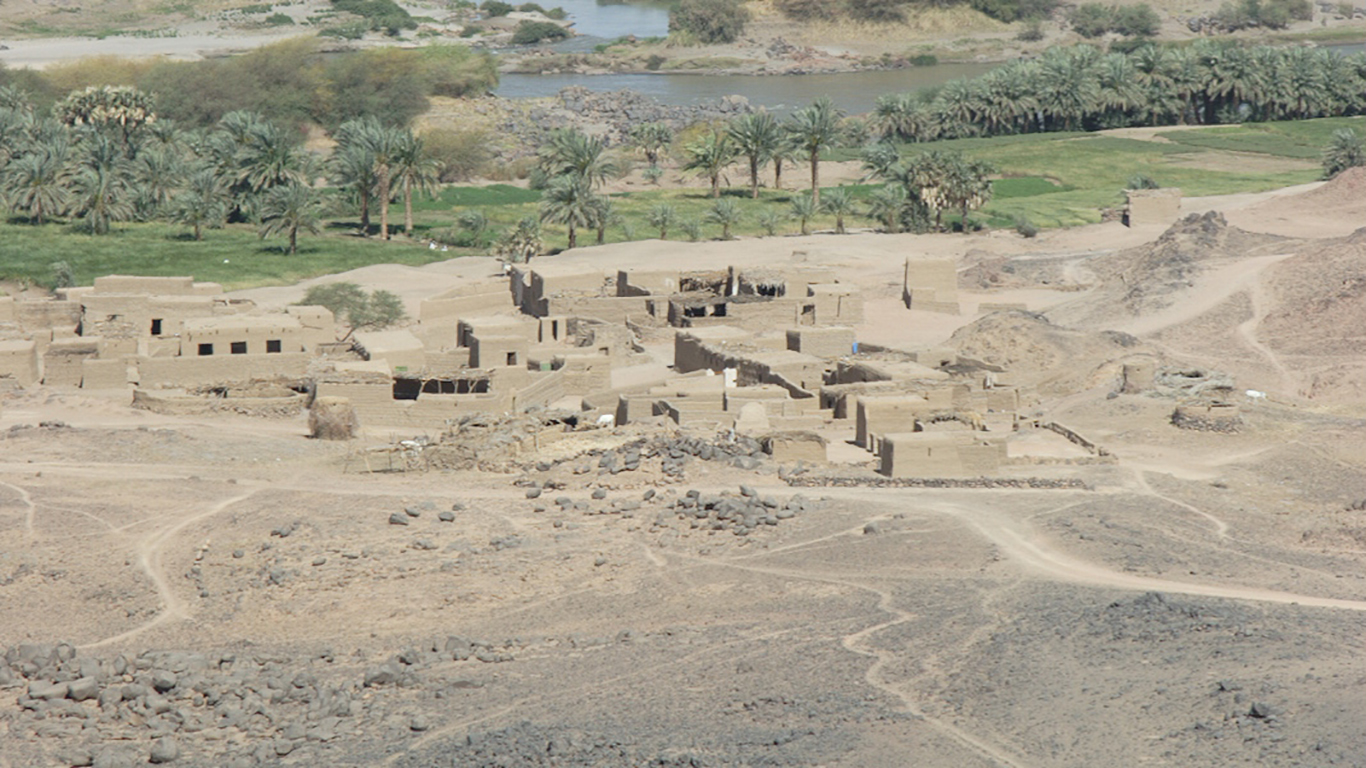
15. Abu Hamad, Sudan
> Annual average precipitation (16 years of data): 0.3 inches
> Wettest year in database: 2007, 1.5 inches
> Wettest month on average: August, 0.2 inches
Abu Hamad is a Sudanese town located on the Nile. It has a subtropical hot desert climate and receives an annual average precipitation of only 0.3 inches.
[in-text-ad]
Source: Maurice Chédel / Wikimedia Commons
14. Talara, Peru
> Annual average precipitation (16 years of data): 0.3 inches
> Wettest year in database: 1999, 0.8 inches
> Wettest month on average: March, 0.6 inches
Talara is a coastal city in northwestern Peru. It has an arid subtropical climate, featuring a hot season from January through April and a comparatively cool season that runs from June through November. The water off the coast of Talara is relatively cool due to the Humboldt Current that affects other Peruvian places on this list, though it can warm during El Niño years, resulting in increased precipitation.

13. Dongola, Sudan
> Annual average precipitation (16 years of data): 0.3 inches
> Wettest year in database: 2014, 1.3 inches
> Wettest month on average: July, 0.2 inches
Dongola is a town in northern Sudan along the west bank of the Nile. It is currently the site of the highest temperature recorded in Sudan (121.3 °F in 2010). It receives no rain throughout the majority of the year, save for a small amount in the summer months.
Source: abdussalam nattah / Flickr
12. Sabhā, Libya
> Annual average precipitation (16 years of data): 0.2 inches
> Wettest year in database: 2013, 0.7 inches
> Wettest month on average: January, 0.1 inches
Sabhā is a Saharan oasis town in southwestern Libya. Rains throughout the Libyan desert occur in rare, short downpours. They are always rare, and Sabhā is no exception. The town received less than 1 inch of rain during the rainiest year considered for this list.
[in-text-ad-2]
Source: EL GUILLE! / Flickr
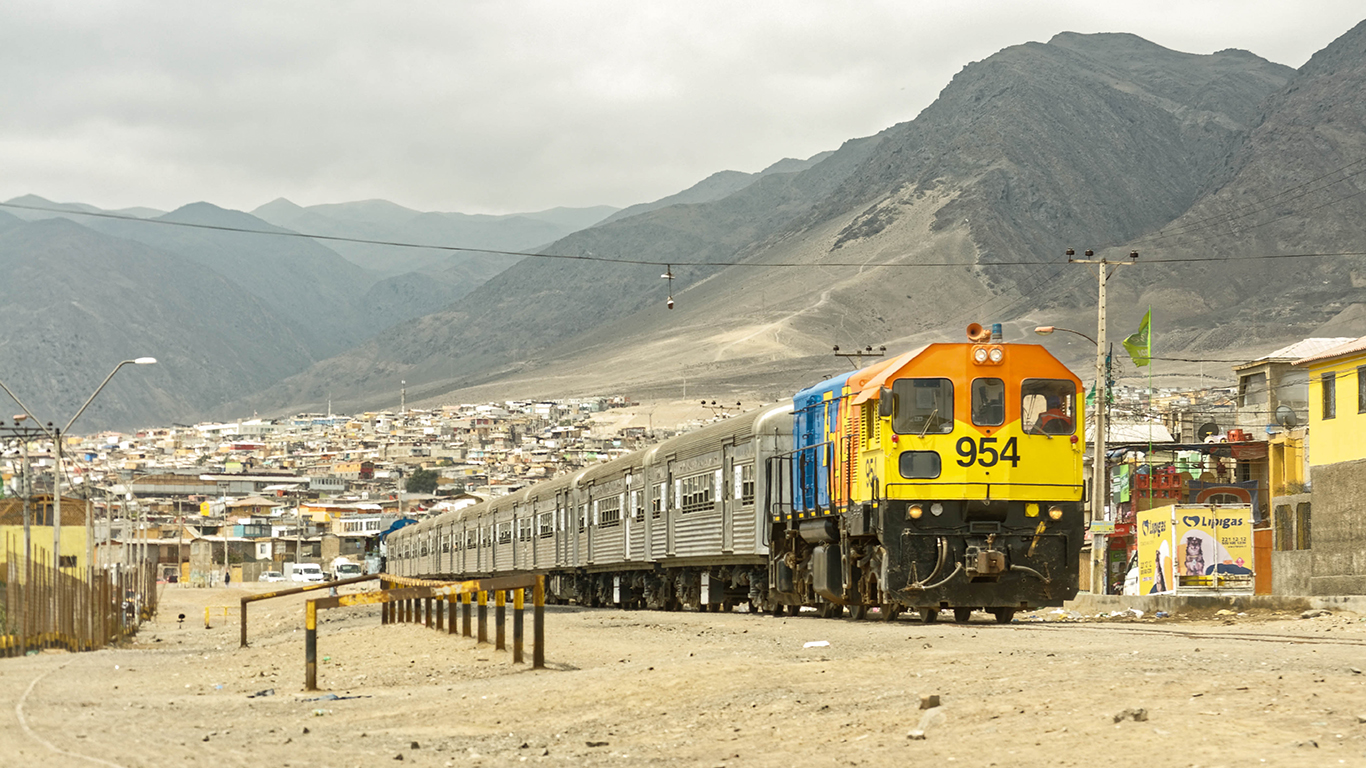
11. La Chimba, Chile
> Annual average precipitation (16 years of data): 0.2 inches
> Wettest year in database: 2017, 2.0 inches
> Wettest month on average: March, 0.1 inches
La Chimba is a sector of the Chilean coastal city of Antofagasta. The region has a desert climate and is extremely arid. Flash floods hit the area in March 2015, following 2 inches of rainfall over 24 hours.
Source: stevegeer / Getty Images
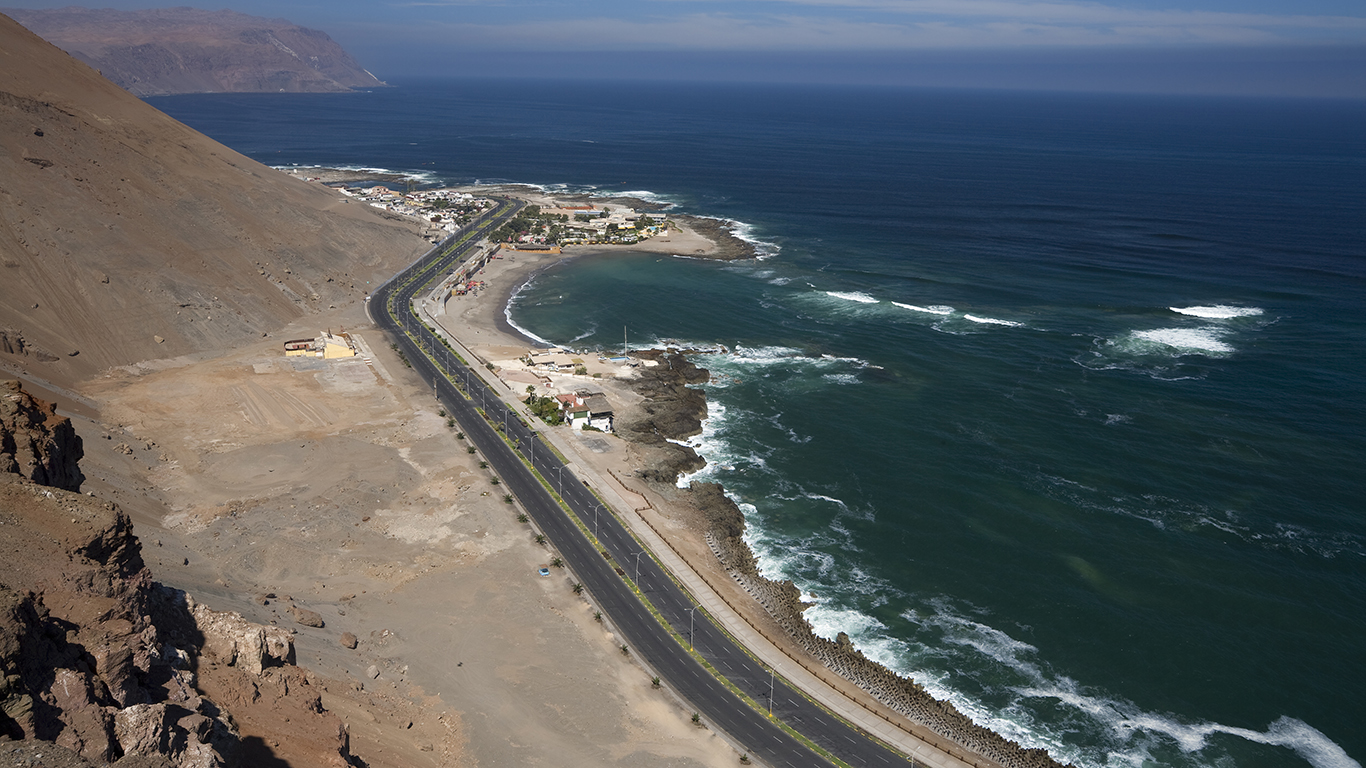
10. Altos del Mar, Chile
> Annual average precipitation (16 years of data): 0.1 inches
> Wettest year in database: 2017, 1.3 inches
> Wettest month on average: March, 0.1 inches
Altos del Mar is a section of the coastal city of Arica in northern Chile. According to one 1968 report from the U.S. Environmental Science Services Administration, Arica received no measurable precipitation for a 14-year period from October 1903 through January 1918. More recently, it has received an average 0.1 inches of precipitation annually.
[in-text-ad]
Source: Eesha Tariq / Wikimedia Commions
9. Nok Kundi, Pakistan
> Annual average precipitation (16 years of data): 0.1 inches
> Wettest year in database: 2003, 0.3 inches
> Wettest month on average: January, 0.2 inches
Nok Kundi is a township in Pakistan’s western Balochistan province. It has a desert climate with average monthly high temperatures exceeding 100 ºF five months of the year. The area received only 0.3 inches of rain during its wettest year of the 16 years reviewed by 24/7 Wall St.
 24/7 Wall St.
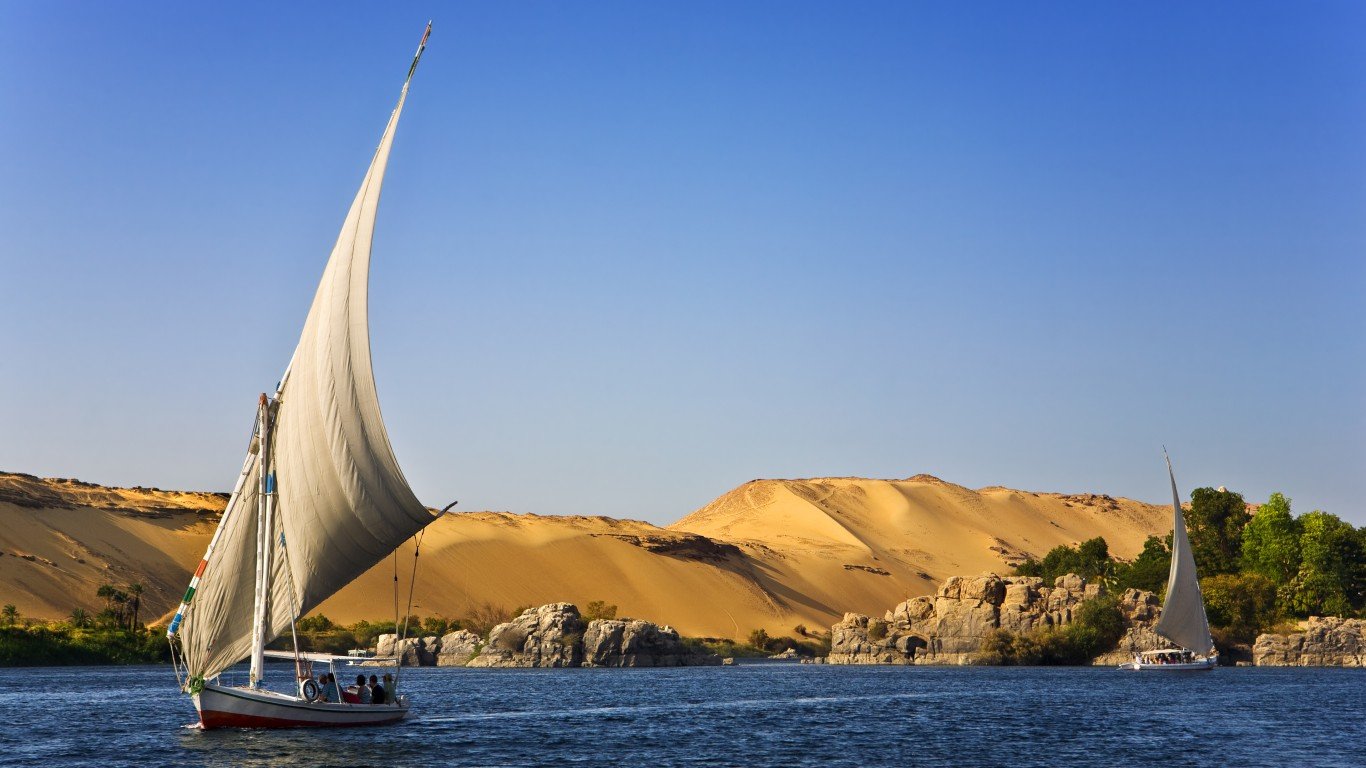
Source: WitR / Getty Images
8. Aswan, Egypt
> Annual average precipitation (16 years of data): 0.1 inches
> Wettest year in database: 2014, 0.7 inches
> Wettest month on average: March, <0.1 inches
The Egyptian city of Aswan, located on the east bank of the Nile River, has a population of around 250,000. It has a hot desert climate and receives less than 0.1 inches of rain on average during its wettest month of March.
Source: HomoCosmicos / Getty Images
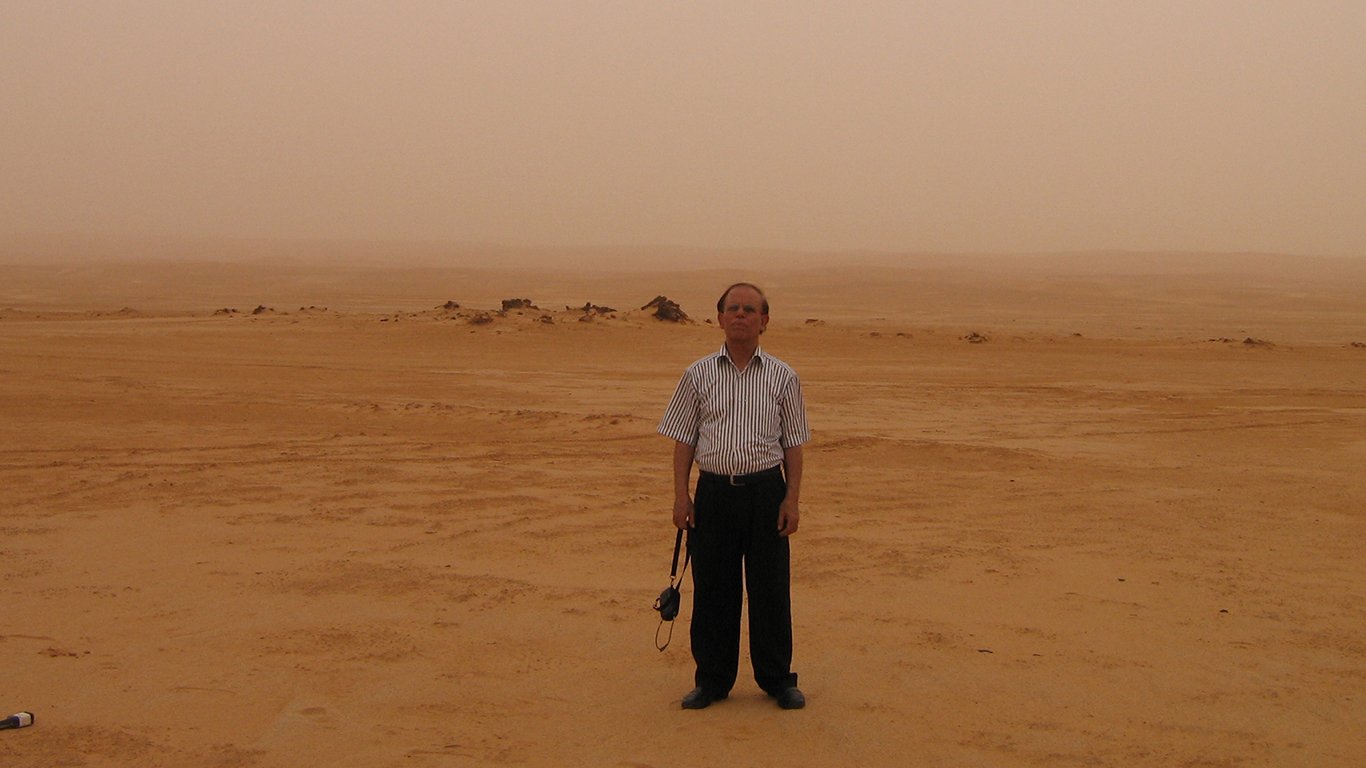
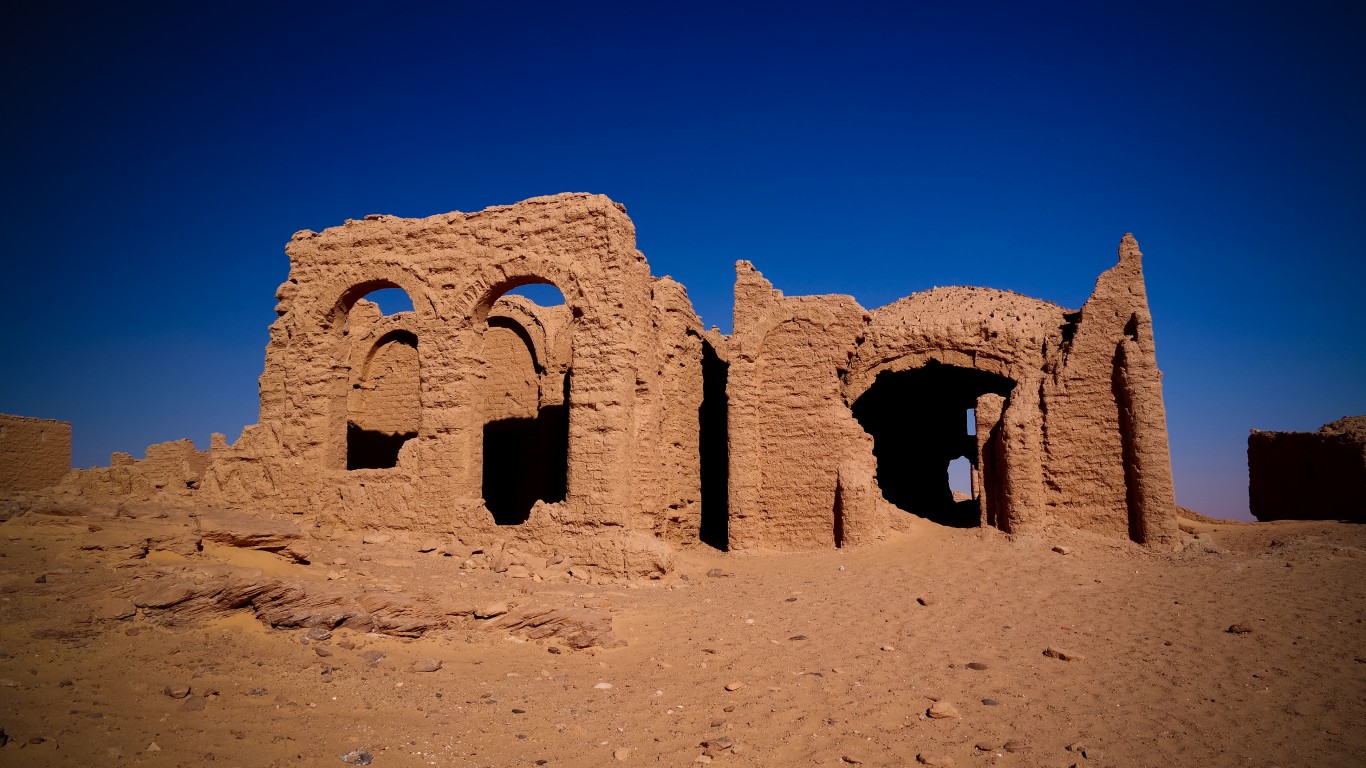
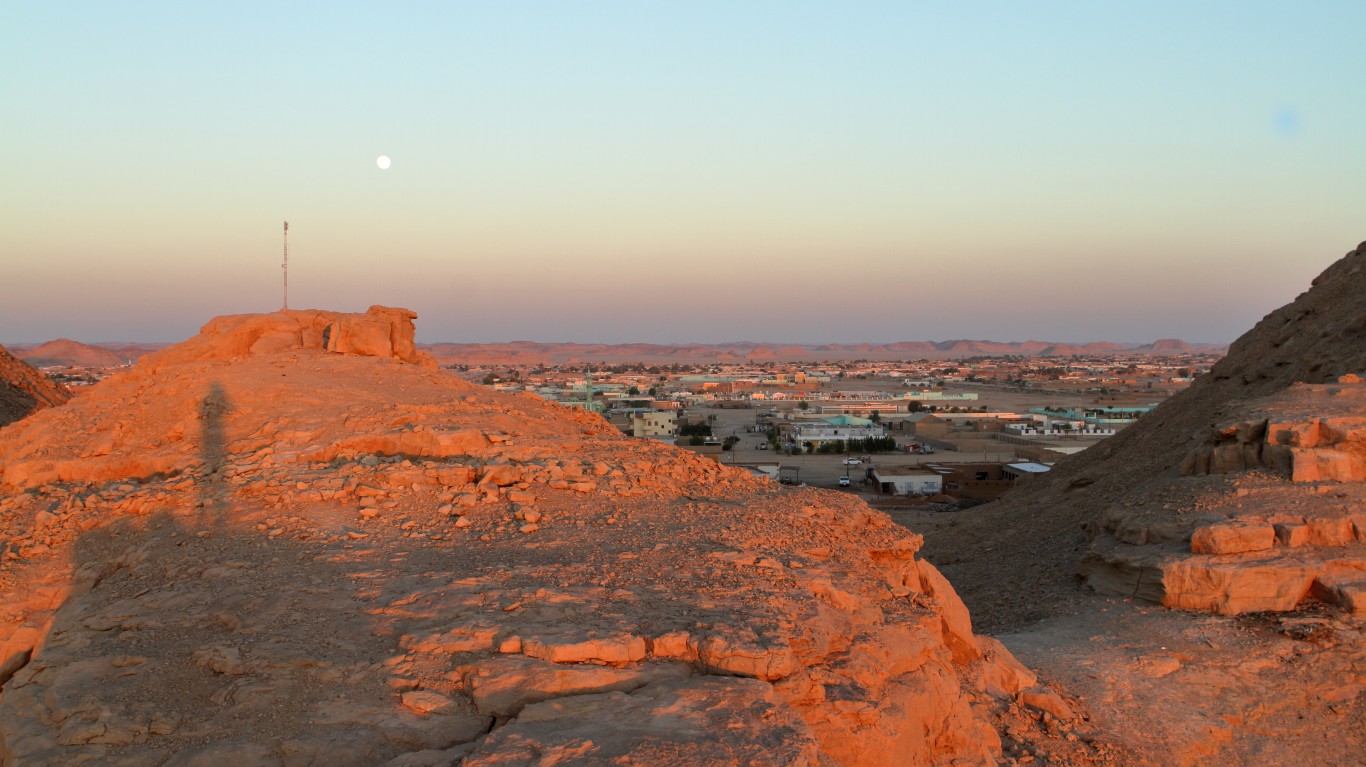
7. Kharga Oasis, Egypt
> Annual average precipitation (16 years of data): 0.1 inches
> Wettest year in database: 1999, 0.2 inches
> Wettest month on average: January, <0.1 inches
Kharga is an oasis found in south-central Egypt in the Libyan Desert, one of the driest, most unforgiving deserts on the planet. Kharga has been occupied since the Paleolithic Period and is currently home to approximately 70,000 people.
[in-text-ad-2]
Source: NickolayV / Getty Images
6. Siwa Oasis, Egypt
> Annual average precipitation (16 years of data): <0.1 inches
> Wettest year in database: 2001, 0.1 inches
> Wettest month on average: February, <0.1 inches
Northwest of Egypt’s Kharga Oasis is the similarly rain-free Siwa Oasis. It has a desert climate, as does much of Egypt, and, like Kharga, it averages less than 0.1 inches of rain during its wettest month.
Source: heckepics / Getty Images
5. Wadi Halfa, Sudan
> Annual average precipitation (16 years of data): <0.1 inches
> Wettest year in database: 2010, 0.2 inches
> Wettest month on average: August, <0.1 inches
Wadi Halfa is a town located along the Nile in northern Sudan, close to the Egyptian border. It’s extremely sunny year-round and hot in the summer, in addition to being one of the driest places on Earth. A heat wave in August, 2015, reportedly resulted in 13 deaths in Wadi Halfa.
[in-text-ad]

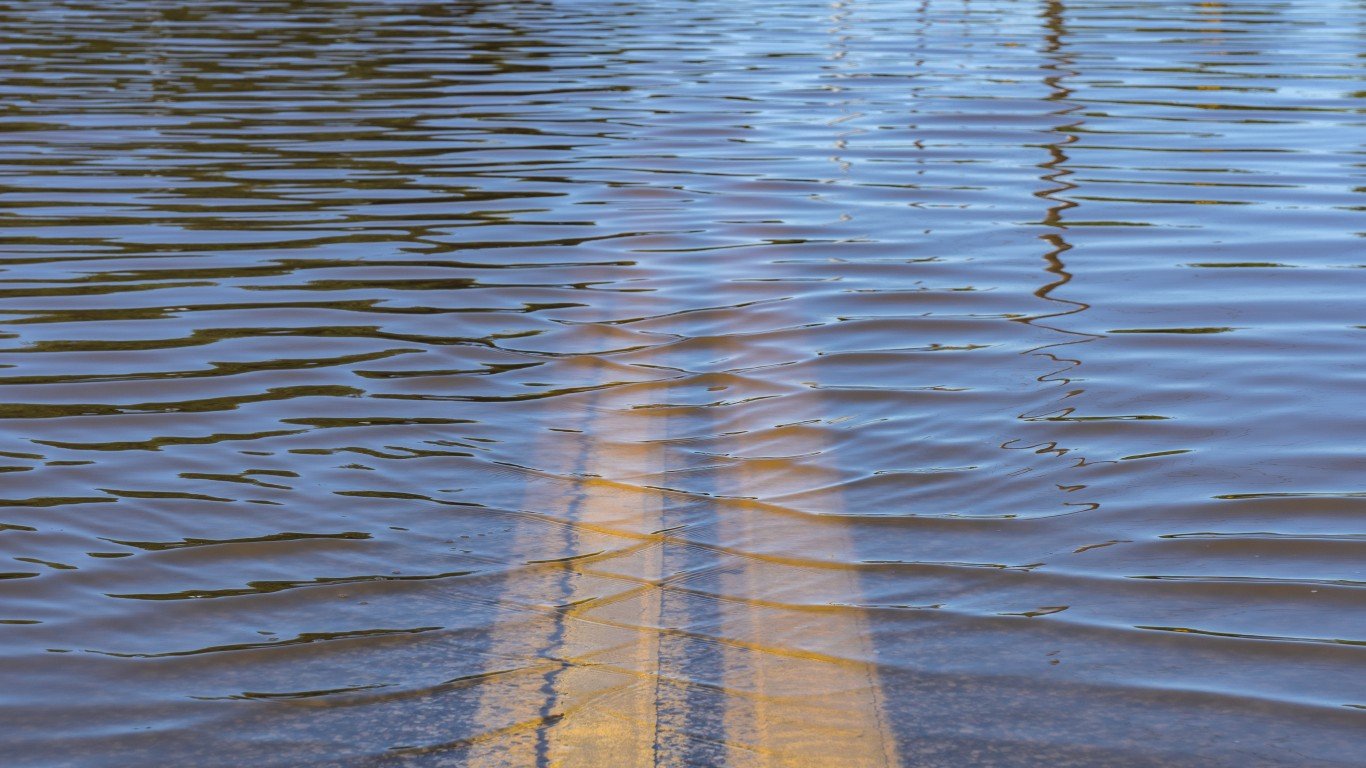
4. Pisco, Peru
> Annual average precipitation (16 years of data): <0.1 inches
> Wettest year in database: 2011, 0.1 inches
> Wettest month on average: January, <0.1 inches
The Peruvian coastal city of Pisco is classified as having a tropical and subtropical desert climate, which implies minimal precipitation despite moderate temperatures year-round. It is known in part for its brandy that is derived from muscat grapes, which thrive in the area climate’s lack of clouds and rain.
 24/7 Wall St.
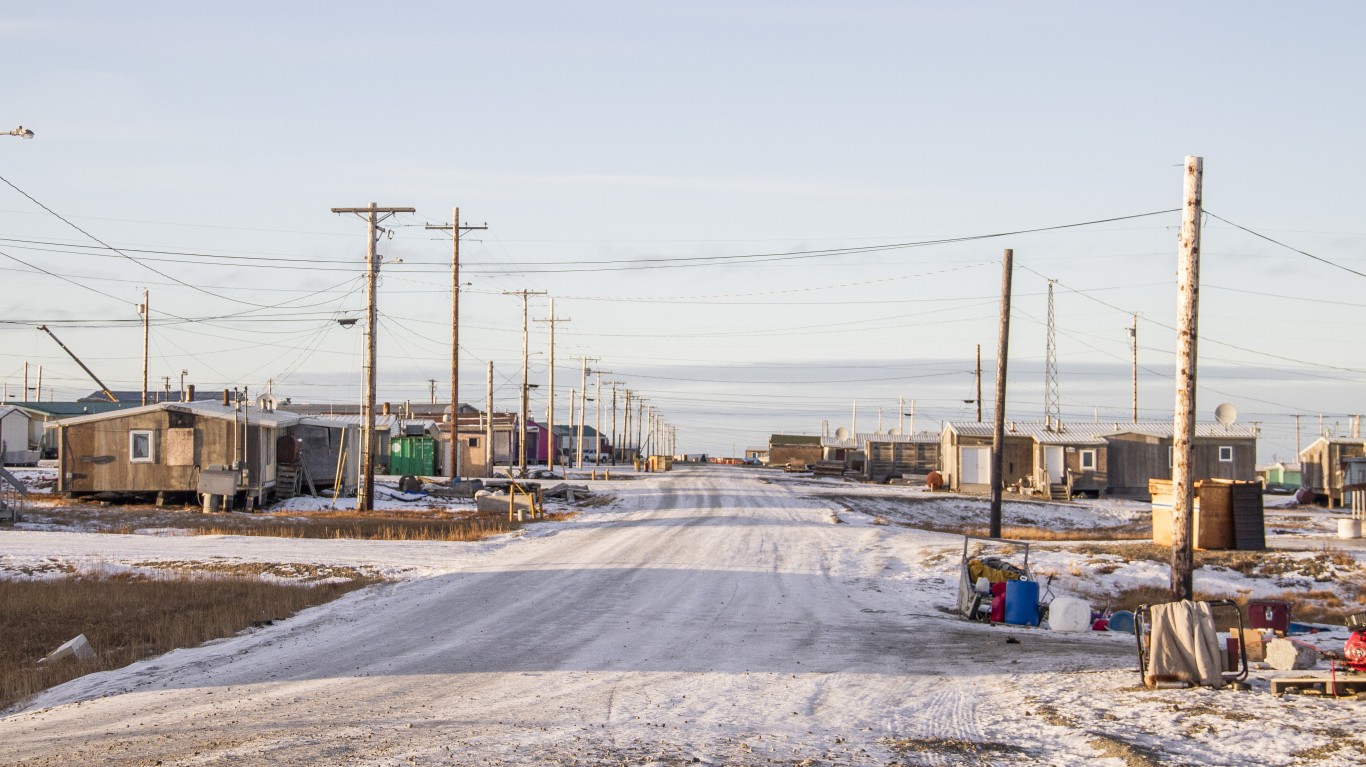
Source: DMartinez-Photo / Getty Images
3. Kaktovik, AK, USA
> Annual average precipitation (16 years of data): <0.1 inches
> Wettest year in database: 1998, <0.1 inches
> Wettest month on average: June, <0.1 inches
The small city of Kaktovik is found in northern Alaska on the edge of the Arctic National Wildlife Refuge, which covers approximately 20 million acres. As of 2015, there were 262 residents and an increasing number of polar bears, driven to land by decreasing Arctic sea ice. Kaktovik has a tundra climate and had less than 0.1 inch of precipitation in the wettest year in our database.
Source: ErithJohn / Getty Images
2. Chimbote, Peru
> Annual average precipitation (16 years of data): <0.1 inches
> Wettest year in database: 1997, <0.1 inches
> Wettest month on average: October, <0.1 inches
Chimbote is another coastal city in Peru, located 9 miles south of where the Santa River runs into the Pacific Ocean. While the city generally sees almost no rain during the year, a coastal mist is common outside of the summer months.
[in-text-ad-2]
Source: NASA / Wikimedia Commons
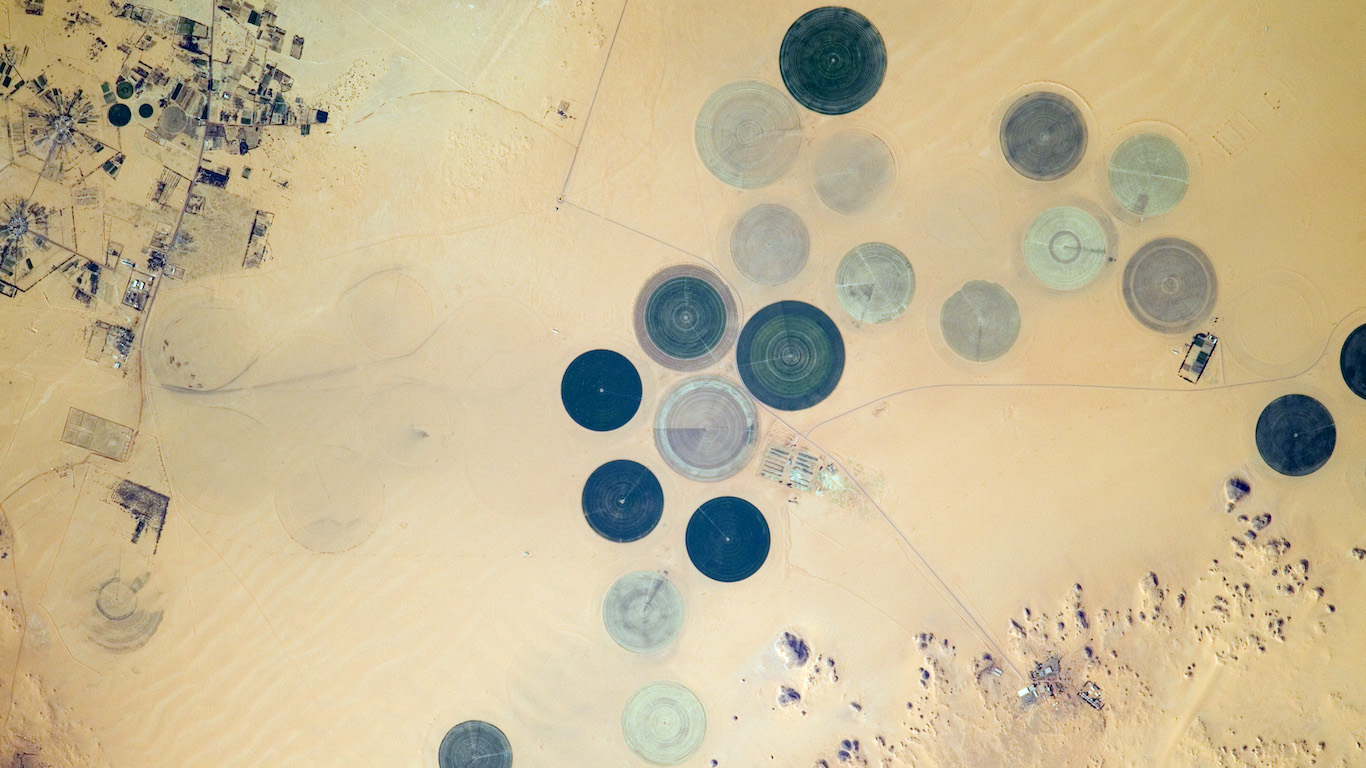
1. Al Jawf, Libya
> Annual average precipitation (16 years of data): <0.1 inches
> Wettest year in database: 1997, 0.1 inches
> Wettest month on average: October, <0.1 inches
Al Jawf is a town located in southeastern Libya’s Kufra district. It has a hot desert climate and received an annual average of 0.007 inches of rain based on the 16 years of data considered. It is one of the most isolated places in Africa, being located more than 560 miles from a major city in any direction, though it remains inhabited due to irrigation methods using underground water.
Sponsored: Attention Savvy Investors: Speak to 3 Financial Experts – FREE
Ever wanted an extra set of eyes on an investment you’re considering? Now you can speak with up to 3 financial experts in your area for FREE. By simply
clicking here you can begin to match with financial professionals who can help guide you through the financial decisions you’re making. And the best part? The first conversation with them is free.
Click here to match with up to 3 financial pros who would be excited to help you make financial decisions.
Thank you for reading! Have some feedback for us?
Contact the 24/7 Wall St. editorial team.
Editors' Picks