Special Report
The School District Where Students Are Least Likely to Succeed in Every State
Published:
Last Updated:
School district quality is one of the most important factors homebuyers consider when looking for a place to live — particularly for new or expecting parents. A good school district can greatly increase a child’s chances of future success.
Of course, the influences that can shape a child’s future are not strictly limited to the classroom. Conditions in the home and the broader community also have an effect.
Using data from the U.S. Census Bureau and the National Center for Education Statistics, 24/7 Wall St. developed an index of measures, including the child poverty rate, the teacher-to-student ratio, per-pupil spending, the share of adults with a college education, and the high school graduation rate to determine the school district where students are least likely to succeed in every state. In our analysis, we also reviewed a number of measures of district outcomes, including college entrance exam performance and subject proficiency tests from education and community data clearing house, Niche. While unfavorable rankings in these measures will not alone dash children’s chances for success through their school years and into adulthood, they can present considerable disadvantages.
One of the most important predictors of a child’s academic success is their poverty status. Children living below the poverty line are more likely to report poor physical health and have reduced ability to concentrate and retain information. Childhood poverty increases the likelihood of low test scores and reduces a student’s chances of completing high school. For this reason, the child poverty rate was selected as a component in the index. Here is a state-by-state look at the child poverty rate.
It is important to note that education policy is decided largely at the state level, and partially as a result, the difference in school district quality across a state can be lower than it is between states. A district that ranks as the worst in a given state will not necessarily compare unfavorably among districts in other states. Here is a list of the states with the best and worst schools.
Click here to see the school district where students are least likely to succeed in every state
Click here to see the school district where students are most likely to succeed in every state
Click here to read our methodology
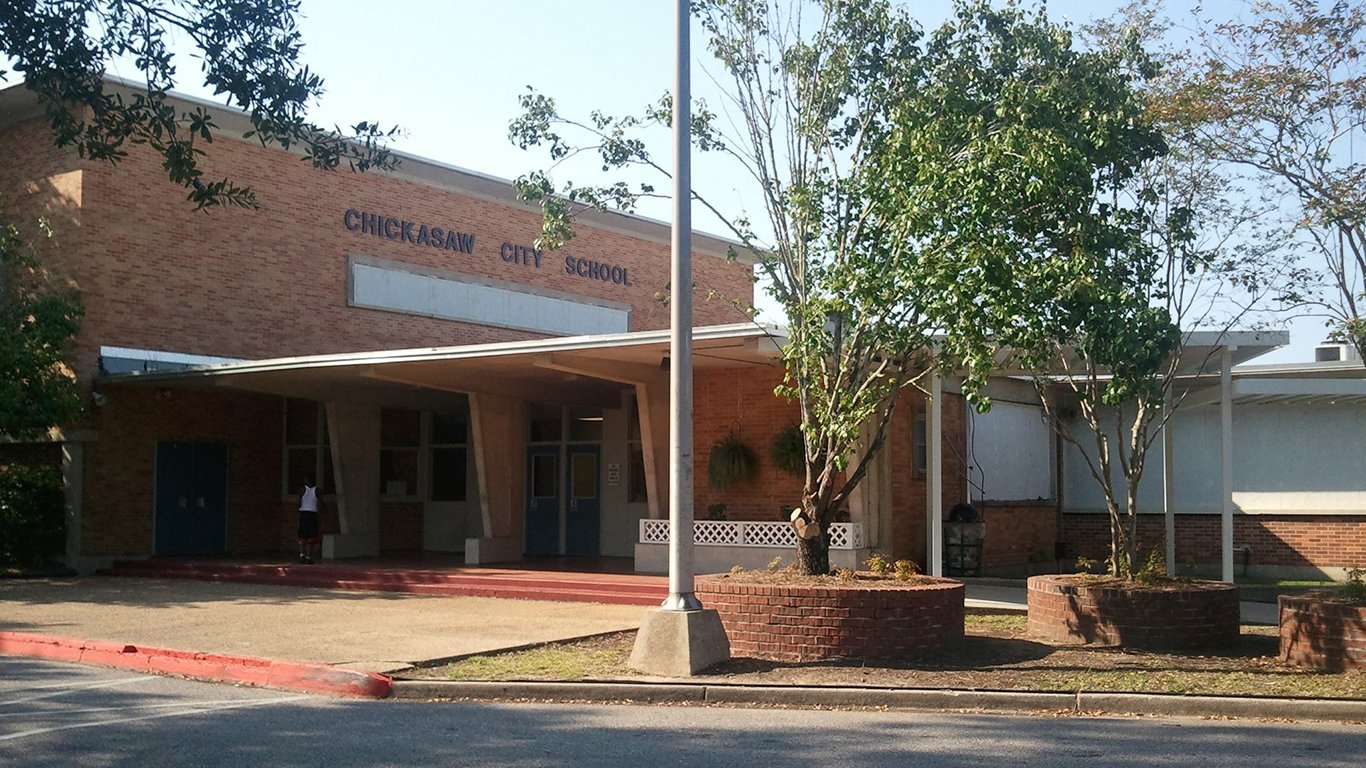
1. Alabama: Chickasaw City Schools
> Location: Mobile County
> Annual per student spending: $9,372
> Adults with a bachelor’s degree: 14.4%
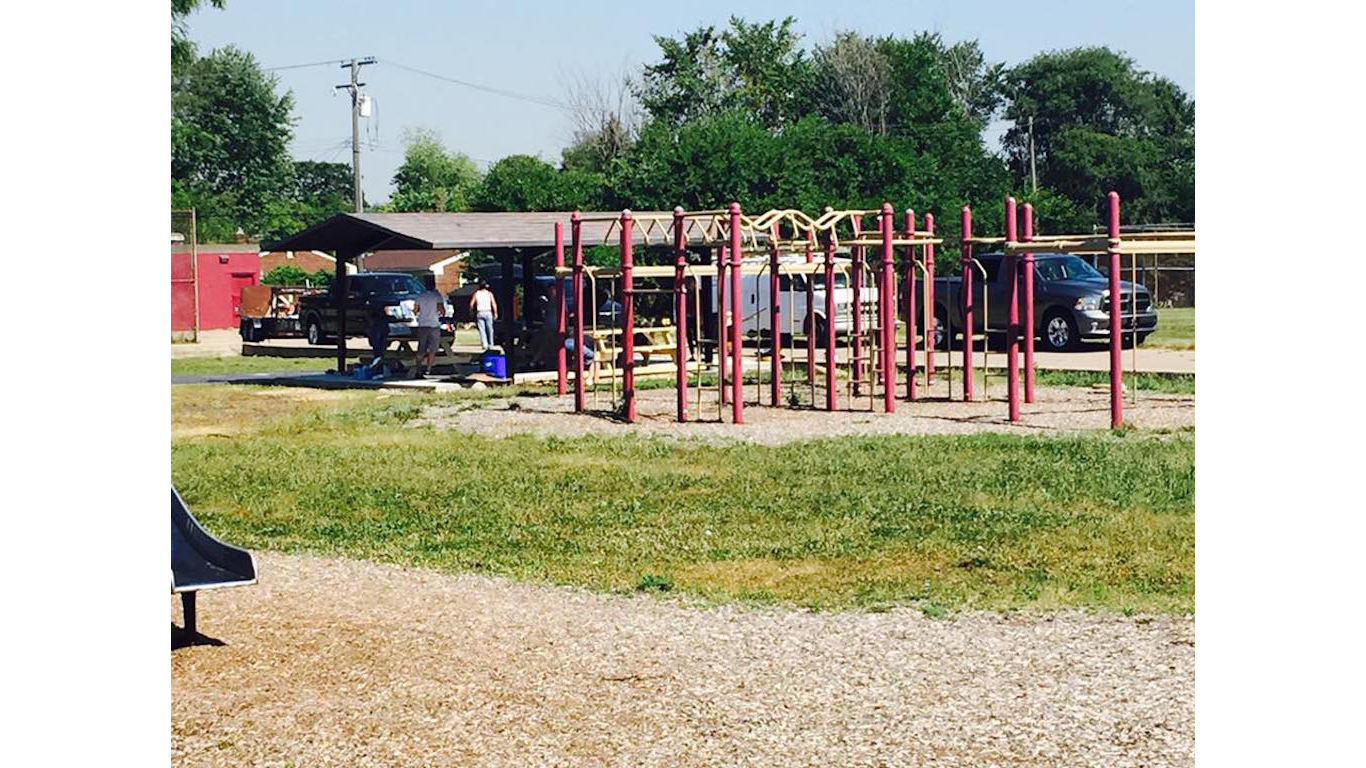
Smaller class sizes have been shown to in some cases have a positive effect on academic performance. In Alabama’s Chickasaw City Schools, a district that covers three schools enrolling about 1,000 students, there are 20.8 students for every teacher, compared to a state average student-to-teacher ratio of 17.8 to 1 state and a national ratio of 16.1 to 1.
Many area students likely face additional disadvantages outside of the classroom. Children growing up below the poverty line deal with unique hardships and stressors that can have a negative impact on academic performance. In the Chickasaw district, a staggering 41.3% of children age 5 to 17 live below the poverty line, well above the child poverty rate of 22.4% across Alabama.
[in-text-ad]

2. Alaska: Lower Kuskokwim School District
> Location: Bethel Census Area
> Annual per student spending: $32,652
> Adults with a bachelor’s degree: 13.2%
Like in much of the state, spending in Alaska’s Lower Lower Kuskokwim School District is very high, but that has not translated to good outcomes for students. Less than 10% of students test as proficient in math or reading, and less than half of high school students in the district graduate on time.
Children living in poverty often face challenges and stresses that can hinder academic success, and a staggering 37.5% of 5 to 17 year olds in the district live in poverty, about three times the state’s child poverty rate.
3. Arizona: Window Rock Unified School District 8
> Location: Apache County
> Annual per student spending: $14,746
> Adults with a bachelor’s degree: 11.3%
Children growing up in poverty face a host of unique challenges that, among other things, can undermine academic performance. In Arizona’s Window Rock Unified School District 8, located on the Navajo Nation reservation in the northeastern section of the state, a staggering 44.4% of children live in poverty, a far greater child poverty rate than the state rate of 18.8%.
Disadvantages for local students do not end there. Children raised by college-educated parents are more likely to succeed academically than those who were raised by parents without a postsecondary education. In Window Rock, however, just 11.3% of adults have a bachelor’s degree or higher, well below the 28.9% share of adults across the state.
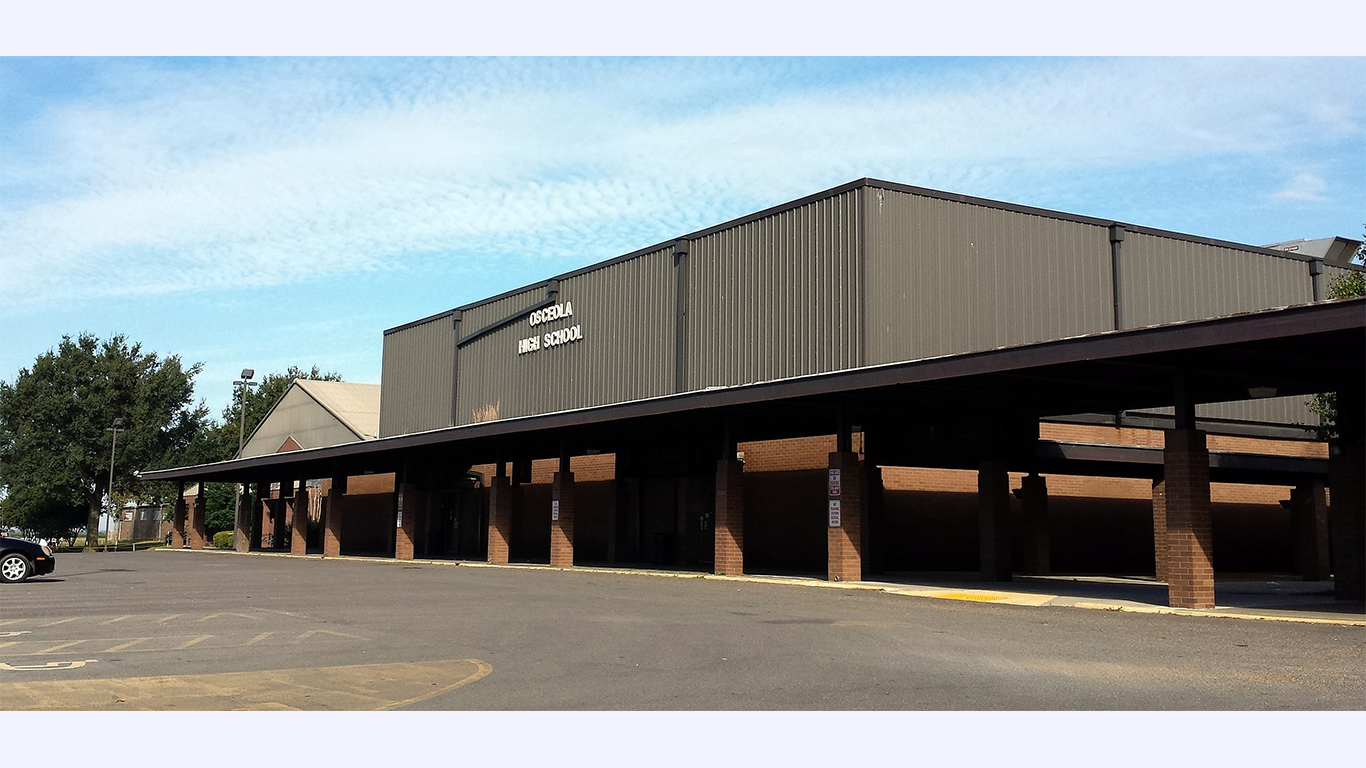
4. Arkansas: Osceola School District
> Location: Mississippi County
> Annual per student spending: $12,094
> Adults with a bachelor’s degree: 9.1%
The conditions associated with poverty can detract considerably from overall academic performance. In Arkansas’ Osceola School District 1, 40.1% of children age 5 to 17 live below the poverty line, nearly double the state’s child poverty rate of 21.5%.
Additionally, children raised by parents with a college education have a greater than average chance at academic success. In the district, just 9.1% of adults have a bachelor’s degree or higher, less than half the 22.6% statewide bachelor’s degree attainment rate.
[in-text-ad-2]

5. California: Mendota Unified School District
> Location: Fresno County
> Annual per student spending: $11,111
> Adults with a bachelor’s degree: 2.1%
While there is debate about the level of benefit of smaller class sizes on students, many studies have shown at least some academic benefits. The student to full-time teacher radio in the district is close to 26 to 1, one of the worst in the country; the nationwide average student-to-teacher ratio is 16.1 to 1. The average SAT score of students in the district is 950, and the average ACT score is 18, both well below the national average test scores.
Children whose parents have lower educational attainment are more likely to struggle in school, and in Mendota, just 2.1% of adults have a bachelor’s degree, the lowest share in the district and one of the five lowest out of any district in the United States.
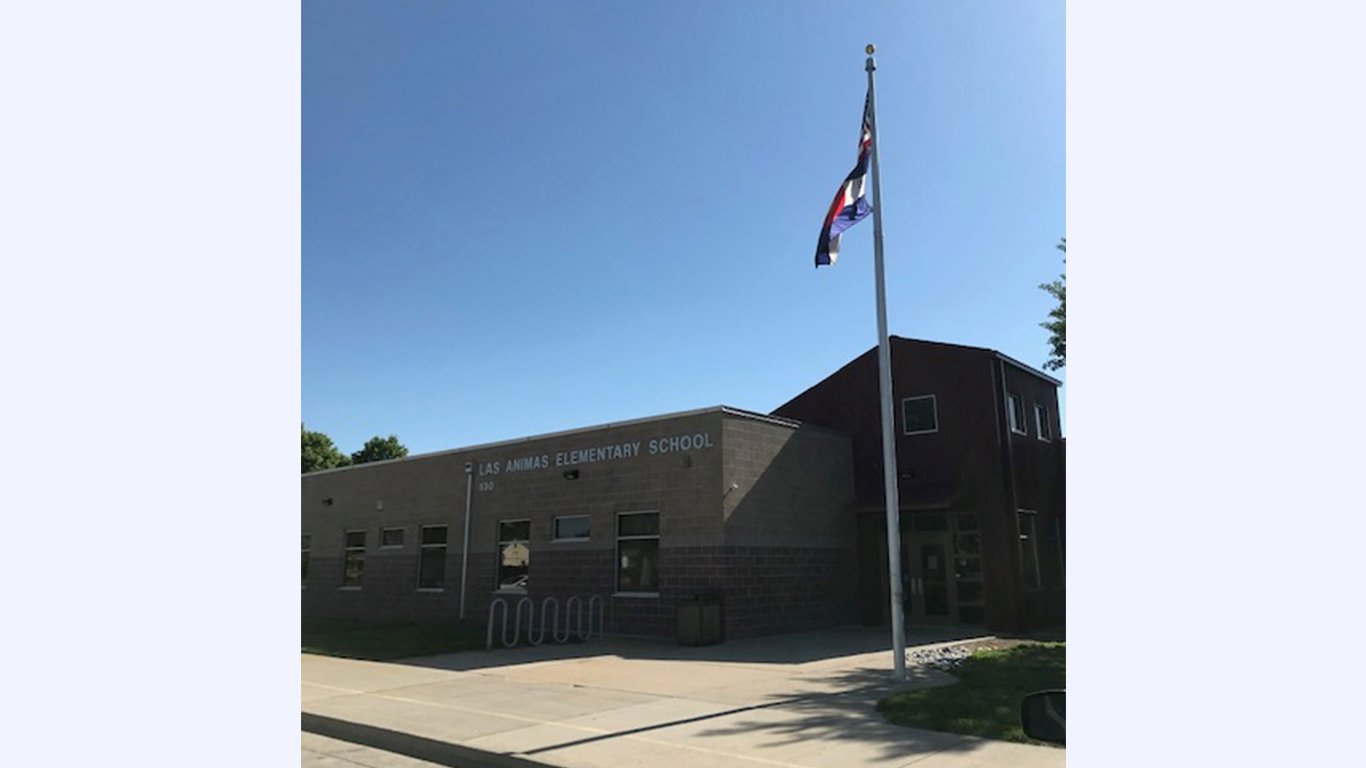
6. Colorado: Las Animas School District
> Location: Bent County
> Annual per student spending: $7,046
> Adults with a bachelor’s degree: 10.3%
Greater financial resources for a school district can provide students with advantages like a broader range of options related to elective course work and smaller class sizes. In Colorado’s Las Animas School District, located in the southeast section of the state, per pupil spending is just $7,046, well below the average expenditures of $9,809 statewide and $12,201 nationwide.
Perhaps due to the lower spending, class sizes are large in Las Animas. There are 40.3 students for every teacher in the district, well above the average student-to-teacher ratios of 17.4 to 1 statewide and 16.1 to 1 nationwide.
[in-text-ad]
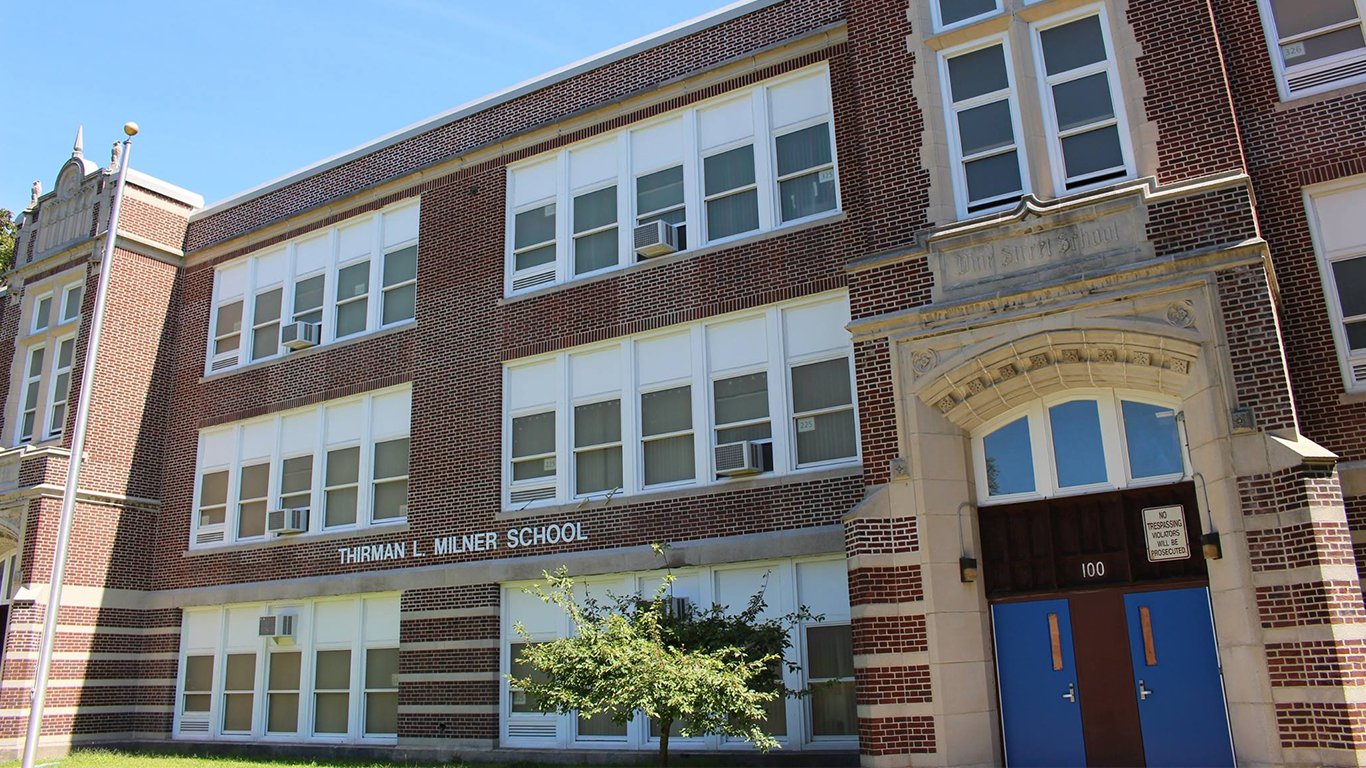
7. Connecticut: Hartford Public Schools
> Location: Hartford County
> Annual per student spending: $19,705
> Adults with a bachelor’s degree: 16.8%
Connecticut’s Hartford public school system reports per student spending of close to $20,000 per year, well above the national annual per pupil spending figure of $12,201 and slightly higher than the state figure of $19,322.
Despite the relatively high spending in the district, student achievement is relatively poor. Just 24% of students test as proficient in reading, and just 16% test as proficient in math. Less than 10% of high school students are enrolled in AP courses, one of the smallest shares of any district in the state.
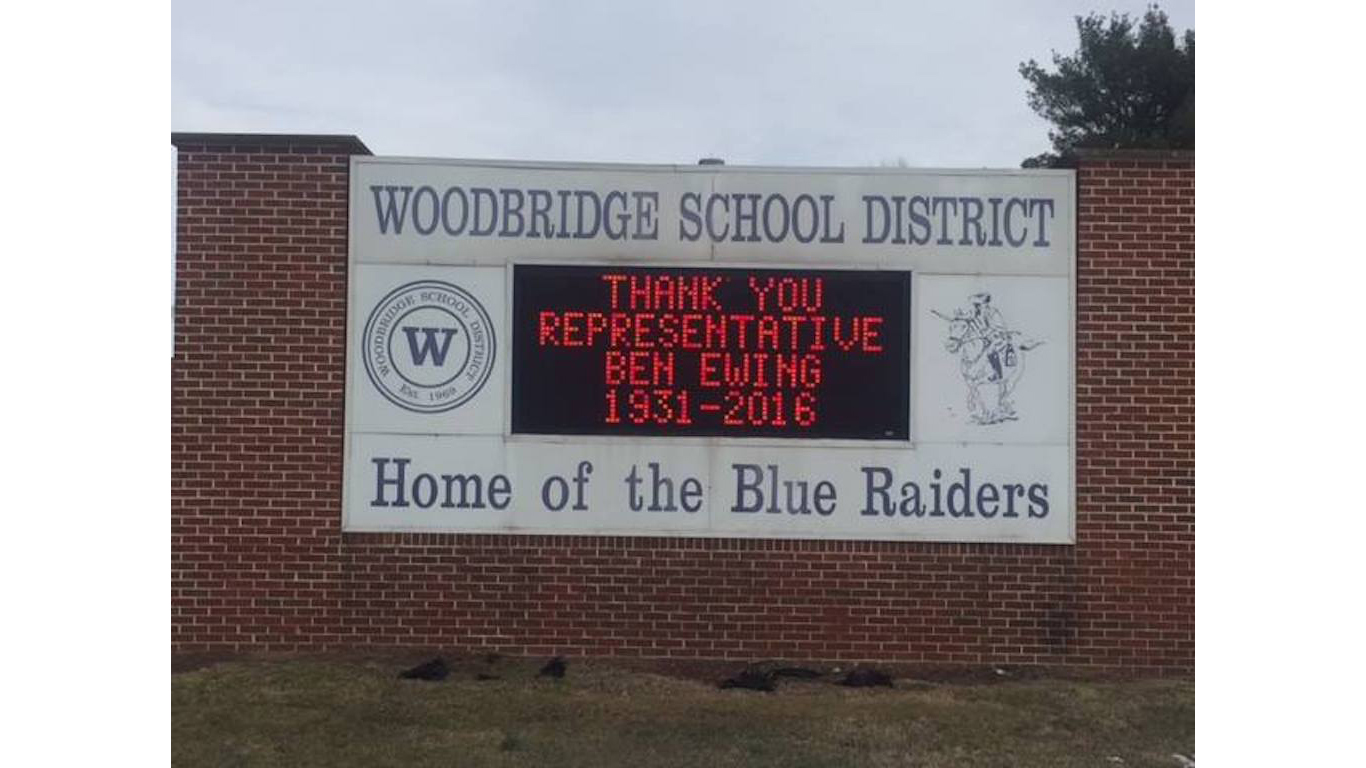
8. Delaware: Woodbridge School District
> Location: Sussex County
> Annual per student spending: $14,137
> Adults with a bachelor’s degree: 13.1%
Delaware’s Woodbridge School District covers four schools that enroll about 2,500 students in central Delaware. High school students in the district are less likely to take college level courses than most high schoolers in Delaware, and those who do are less likely to master the material. An estimated 13.7% of high schoolers in the district are enrolled in an AP class, and only 24.1% of them pass their exams — each well below the corresponding 18.8% and 49.9% statewide rates.
Outcomes such as these are likely attributable in part to certain conditions outside of the classroom. For example, children whose parents have lower educational attainment are more likely to struggle in school, and in Woodbridge, just 13.1% of adults have a bachelor’s degree — well below the 31.4% share across Delaware.
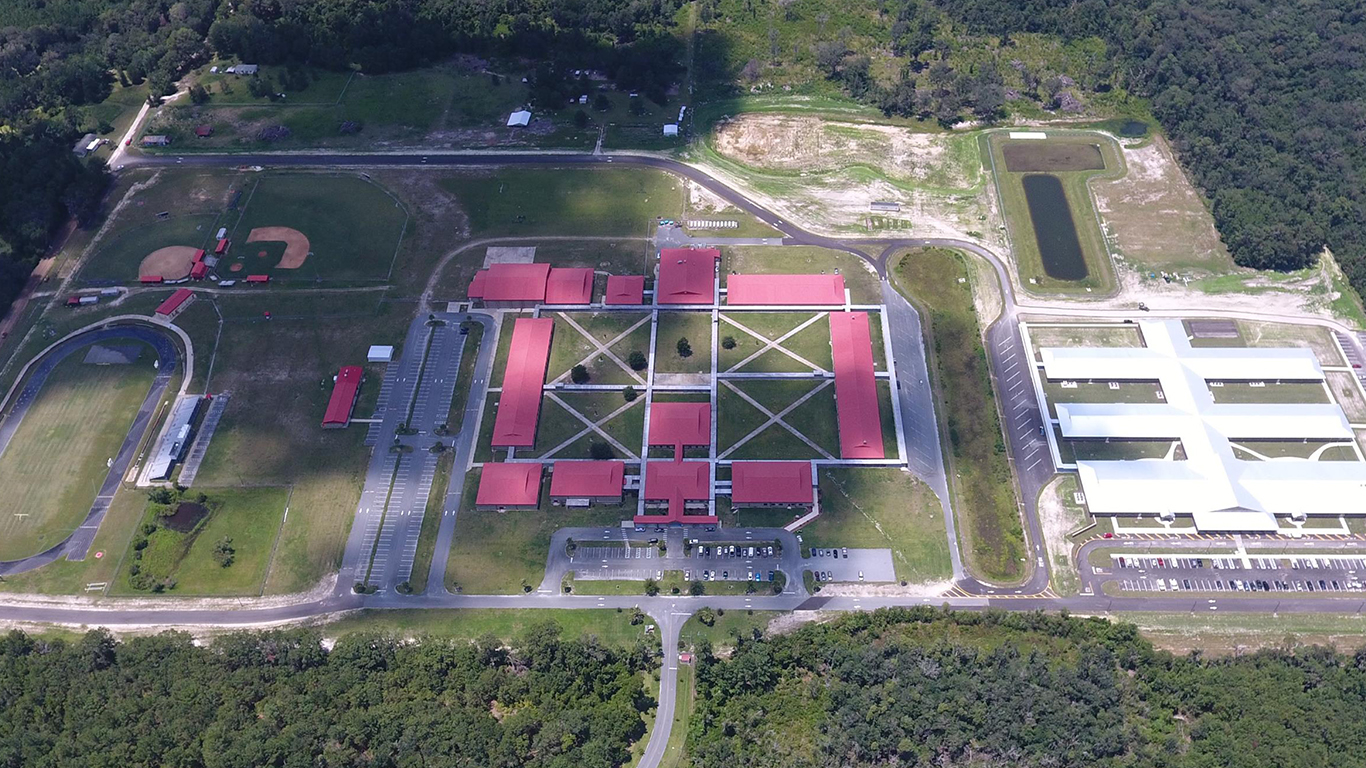
9. Florida: Hamilton County School District
> Location: Hamilton County
> Annual per student spending: $10,976
> Adults with a bachelor’s degree: 9.3%
Florida’s Hamilton County School District, located in the northern part of the state near the border with Georgia, ranks in our index as the school district where students have the lowest chances for success. A major reason for this ranking is the district’s very high child poverty rate of 34.3%, which is much higher than both the state and national rates of 18.4% and 17.0%, respectively.
Students who live in poor households are much less likely to succeed in school, as are those whose parents have a college education. In the district, just 9.3% of residents 25 or older have a bachelor’s degree, less than one-third of the national or state shares.
[in-text-ad-2]

10. Georgia: Stewart County School District
> Location: Stewart County
> Annual per student spending: $14,967
> Adults with a bachelor’s degree: 11.2%
Georgia’s Stewart County School District ranks as the district where students are most likely to struggle to find academic success. The relatively small district of about 500 students and three operational schools reports spending $14,967 per pupil per year, higher than both the national and state per pupil spending figures.
However, student achievement is relatively poor, despite higher spending in the district. Just 29% of students scored as proficient in math, and only 14% score as proficient in reading in the state. Less than 2% of high school students have enrolled in an AP course, one of the lower shares of any district in the state.
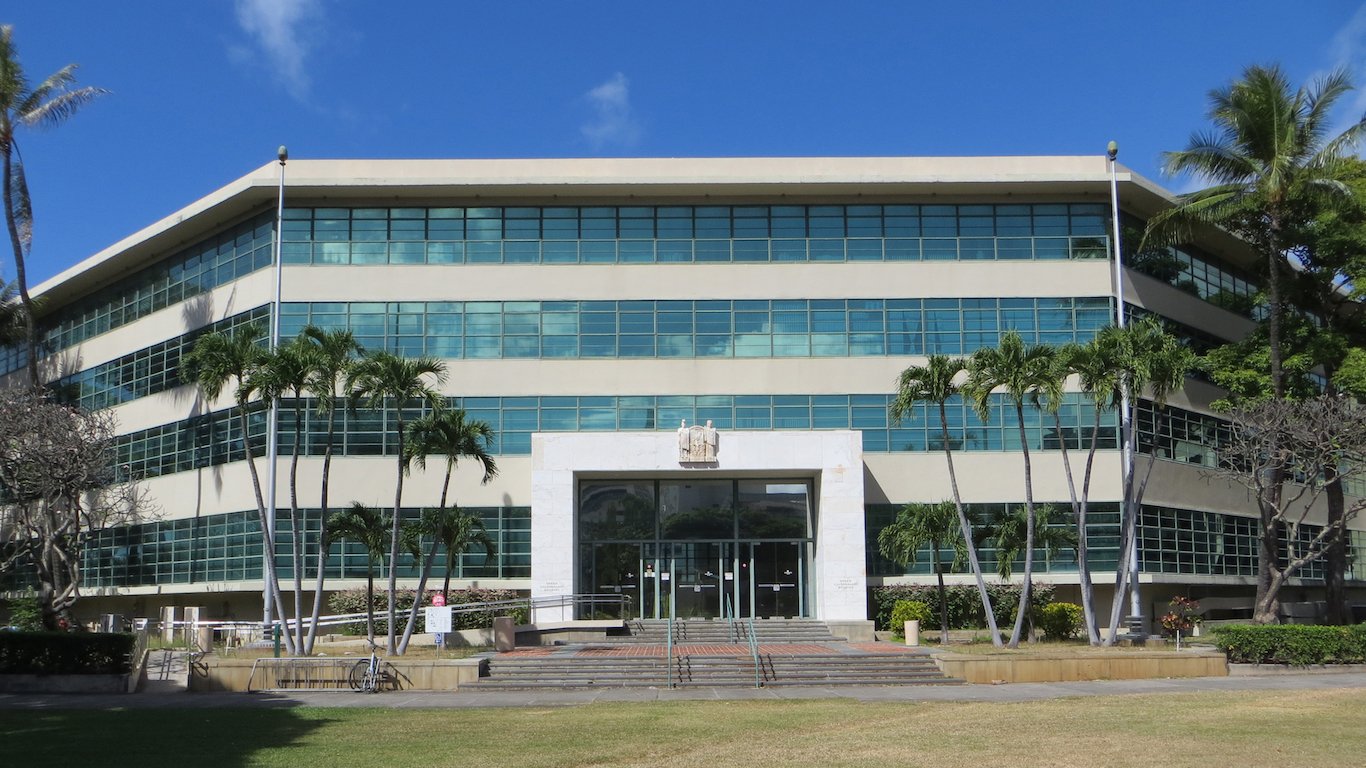
11. Hawaii: Hawaii Public Schools
> Location: Honolulu County
> Annual per student spending: $14,322
> Adults with a bachelor’s degree: 32.5%
Hawaii is the only state to have a single school district manage every public school. Therefore, the district’s ranking on this list is by default only. In fact, by several measures, public school students in Hawaii have some advantages over students nationwide. For example, annual per student spending in the state is $14,322 compared to the national average of $12,201. Higher-spending districts often have smaller class sizes, and in Hawaii, the average student-teacher ratio of 15 to 1 is slightly lower than the 16.1 to 1 national average.
[in-text-ad]

12. Idaho: Mountain View School District 244
> Location: Idaho County
> Annual per student spending: $10,075
> Adults with a bachelor’s degree: 19.6%
Idaho’s Mountain View School District 244 ranks as the district in the state where students are least likely to succeed academically due in large part to conditions outside of the classroom.
Students who live in poor households are much less likely than those who grow up in more affluent households to succeed in school, as are those whose parents have a college education. In the district, 15.8% of school-aged children live below the poverty line, compared to 12.5% of children statewide. Additionally, just 19.6% of adults in the district have a bachelor’s degree or higher, compared to 26.9% of adults across the state.
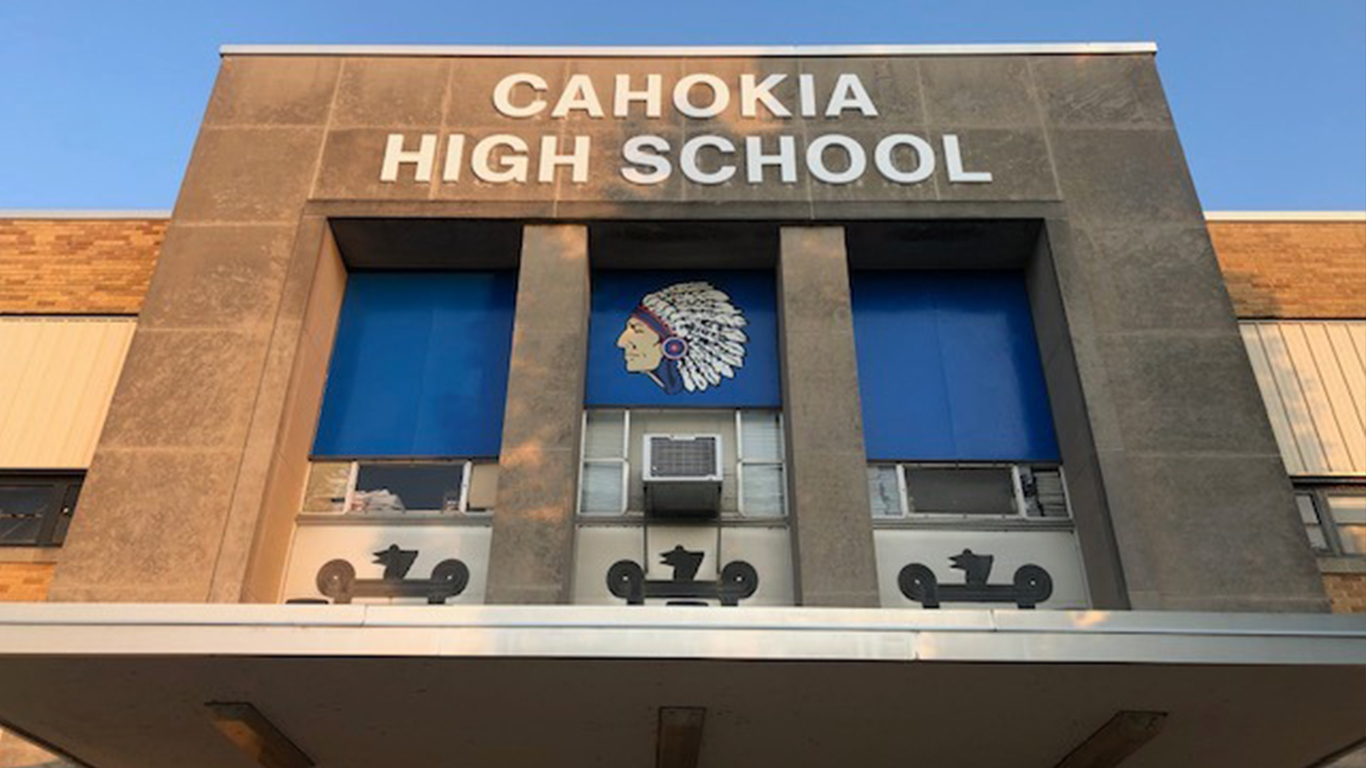
13. Illinois: Cahokia Unit School District 187
> Location: St. Clair County
> Annual per student spending: $17,132
> Adults with a bachelor’s degree: 7.3%
Illinois’ Cahokia Community Unit School District 187, located across the Mississippi River from St. Louis, Missouri, has very poor student outcomes, despite relatively high per pupil spending. The district’s high school graduation rate is less than 70%, and according to Niche just 6% of students score as proficient in math and just 5% in reading.
Students whose parents have graduated college are less likely to struggle academically, and the district’s 7.3% bachelor’s degree attainment rate among adults is the lowest in the state and one of the lowest in the country.
14. Indiana: Gary Community School Corporation
> Location: Lake County
> Annual per student spending: $11,195
> Adults with a bachelor’s degree: 13.7%
Gary, Indiana, is one of the poorest communities in the United States, which means that children in the Gary Community School Corporation district are among the most likely in the country to have their chances for academic success limited by poverty. The district’s 49.0% child poverty rate — compared to the state’s 15.7% rate and national 17.0% rate — is the highest in the state and one of the highest in the country.
Gary’s student-to-teacher ratio of 24.5 to 1 is well above the national average ratio of 16.1 to 1 and is one of the highest of any U.S. school district.
[in-text-ad-2]
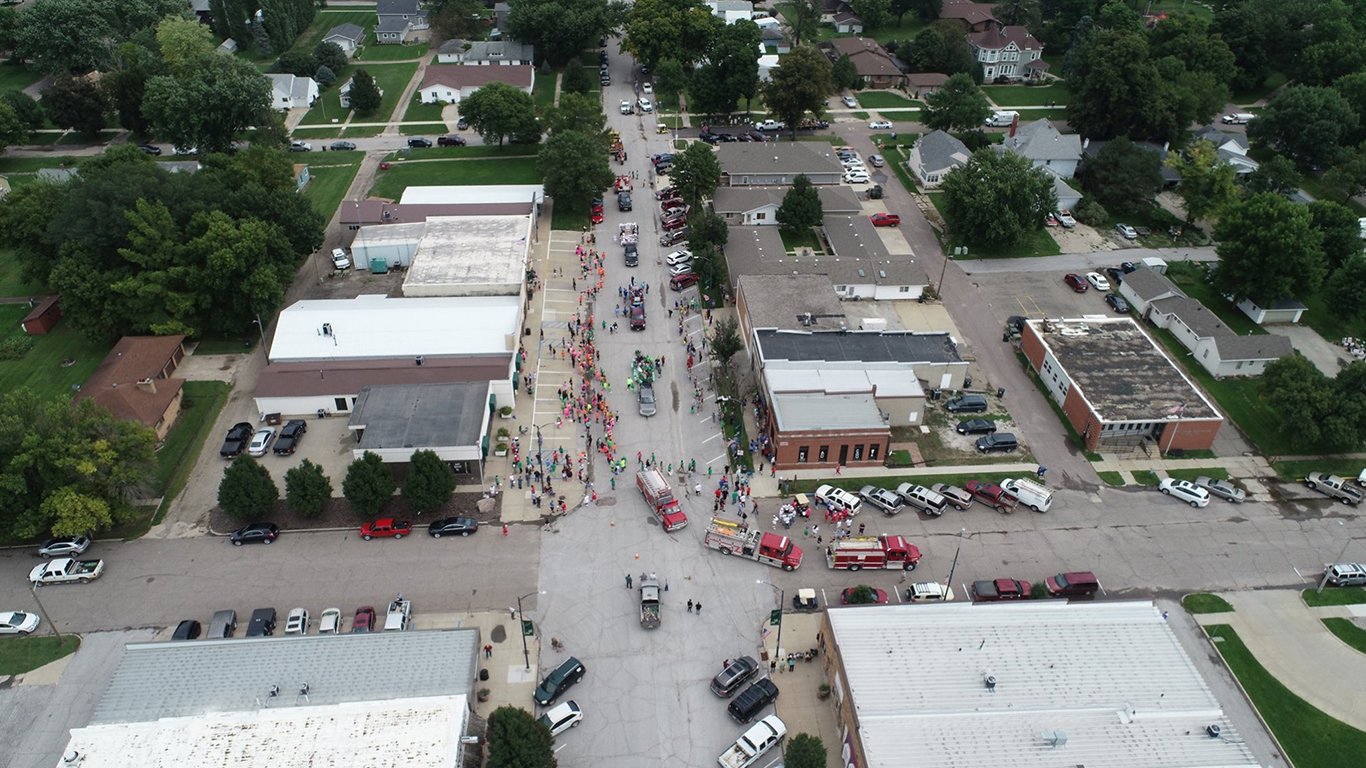
15. Iowa: Maple Valley-Anthon Oto Community School District
> Location: Monona County
> Annual per student spending: $11,044
> Adults with a bachelor’s degree: 16.5%
The Maple Valley-Anthon Oto Community School District, located in western Iowa, ranks as the worst school district in Iowa. Students in the district are far less likely than those in other parts of the state to enroll in college level courses while in high school. Just 1.0% of high schoolers in Maple Valley are in an Advanced Placement classes compared to 15.4% of high school students across Iowa.
Children of college-educated parents are more likely than most others to succeed academically, and in the Maple Valley district, just 16.5% of adults have a bachelor’s degree, well below the 28.2% share of adults statewide.

16. Kansas: Riverside Unified School District 114
> Location: Doniphan County
> Annual per student spending: $10,748
> Adults with a bachelor’s degree: 16.8%
Like most of the districts on this list, students in the Riverside Unified School District 114 are more likely to live in poor households with parents who have not received a college education than those in most districts statewide. An estimated 16.8% of adults in the district have a bachelor’s degree, which is about half the state and nationwide bachelor’s attainment rates.
[in-text-ad]
17. Kentucky: Harlan County Public Schools
> Location: Harlan County
> Annual per student spending: $9,647
> Adults with a bachelor’s degree: 10.5%
The Harlan County School District, located in southeastern Kentucky, ranks as the worst district in the state. The conditions associated with poverty can detract considerably from overall academic performance. In the Harlan County School District, a staggering 42.5% of children age 5 to 17 live below the poverty line, double the state’s 20.5% child poverty rate.
Students in the district may also be at a disadvantage from lower than average school spending. Per pupil spending in the district is just $9,647 a year, below both the state annual spending per students of $10,121 and the national average spending of $12,201.

18. Louisiana: East Carroll Parish School District
> Location: East Carroll Parish
> Annual per student spending: $11,888
> Adults with a bachelor’s degree: 8.5%
Louisiana’s East Carroll Parish School District, in the northeast corner of the state, ranks as the worst in the state in our index of student opportunity for success. The district, which is one of the state’s smallest with roughly 1,000 students, has one of the highest student-to-teacher ratios in the state, at 19.3 to 1, and has a high school graduation rate of less than 70%.
The district has one of the highest child poverty rates in the country — almost two-third of district children 5 to 17 live in a household in poverty, the highest child poverty rate in the state and the fifth highest of any district in the United States.
19. Maine: Regional School Unit 10
> Location: Oxford County
> Annual per student spending: $15,388
> Adults with a bachelor’s degree: 16.9%
Maine’s Regional School Unit 10 district ranks as the worst school district in Maine due in large part to conditions outside the classroom. Children living below the poverty line face a number of challenges that can have a negative impact on their academic performance. In Western Foothills, 29.8% of school-aged children live below the poverty line, the highest child poverty rate of any school district in the state.
Children in the district are also less likely than most in the state to be raised by college-educated parents. Just 16.9% of adults in Western Foothills have a bachelor’s degree or higher, well below the 30.9% bachelor’s degree attainment rate across the state.
[in-text-ad-2]
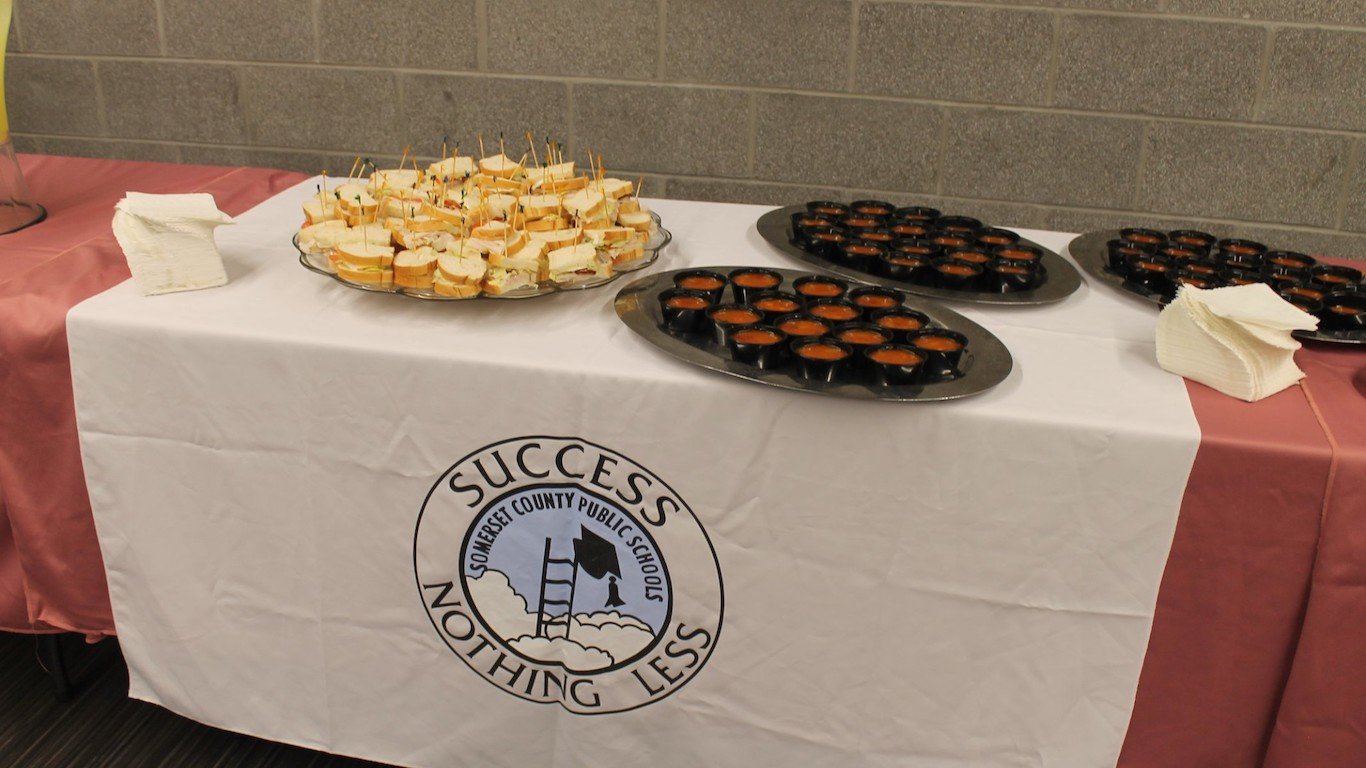
20. Maryland: Somerset County Public Schools
> Location: Somerset County
> Annual per student spending: $15,775
> Adults with a bachelor’s degree: 15.7%
In Maryland’s Somerset County Public Schools district, in the Southeast part of the state, less than a third of students tested as proficient in either math or reading.
The district also has one of the lowest high school graduation rates in the state. It is also the only district in the state with an adult bachelor’s degree attainment rate less than half the national rate of 31.5%. It has a child poverty rate of 30% — the highest in the state.
21. Massachusetts: Springfield Public Schools
> Location: Hampden County
> Annual per student spending: $15,838
> Adults with a bachelor’s degree: 18.6%
Public schools in Massachusetts are generally high performing compared to the average district nationwide, but the Springfield City district ranks as the worst in the state in terms of opportunity for success among students in the district. Part of the reason the district ranks so poorly is due to conditions outside the classroom. The stress associated with poverty has a significant negative impact on academic performance, and Springfield’s child poverty rate of 37.7% is the highest of any district in the state.
High school students in the district are less likely to take college level courses than most high schoolers in Massachusetts, and those who do are less likely to master the material. Some 13.0% of high schoolers in the district are enrolled in an AP class, and only 27.7% of them pass their exams — each well below the corresponding statewide rates of 20.1% and 69.6%.
[in-text-ad]
22. Michigan: River Rouge School District
> Location: Wayne County
> Annual per student spending: $11,862
> Adults with a bachelor’s degree: 8.3%
The River Rouge City School District is located in the southern part of the Detroit metropolitan area. High schoolers in the district are far less likely than students statewide to take Advanced Placement classes. Just 3.0% of high school students in the district are enrolled in an AP class, well below the 19.7% state average.
Students in the district are also far more likely than most to face hardships outside of the classroom that can negatively impact academic performance. For example, a staggering 47.4% of school-aged children in the area live below the poverty line, well above the 17.5% child poverty rate across Michigan.
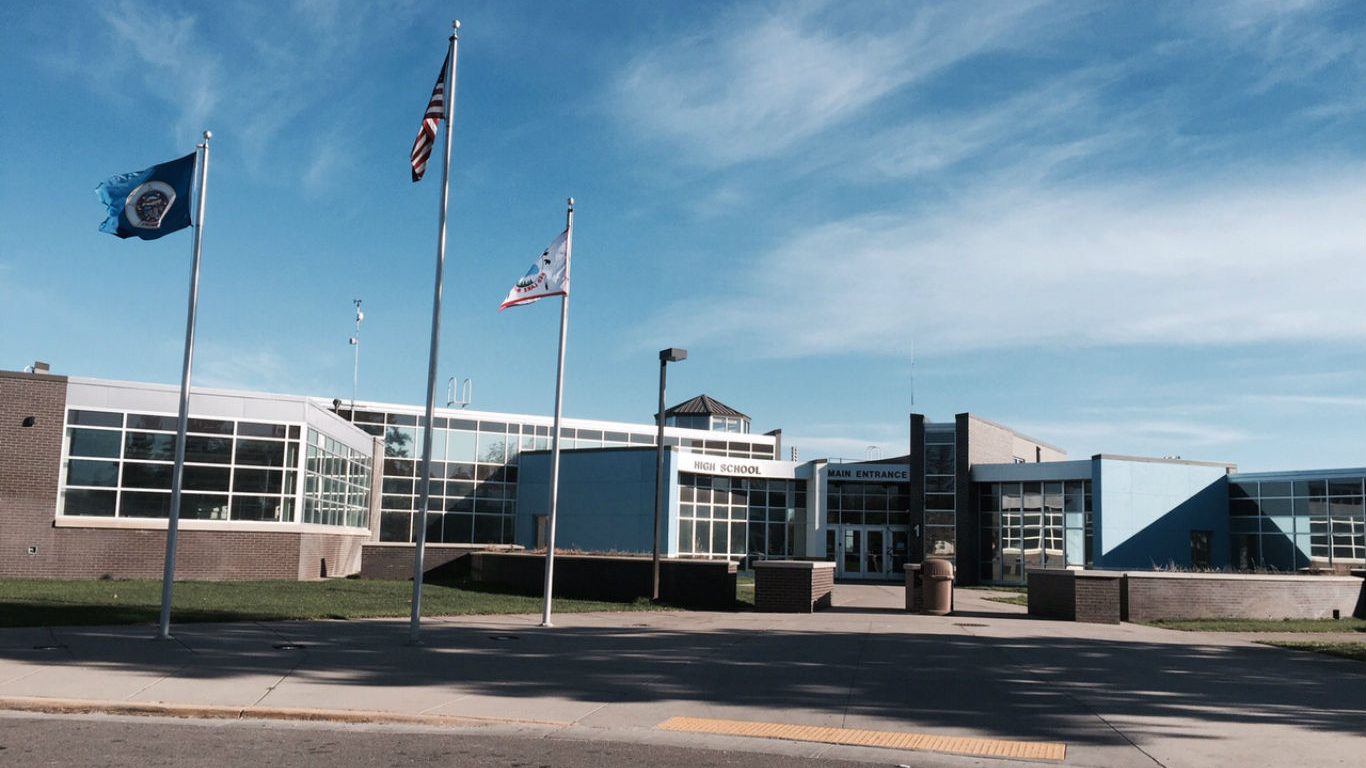
23. Minnesota: Red Lake Public Schools
> Location: Beltrami County
> Annual per student spending: $19,750
> Adults with a bachelor’s degree: 5.9%
K-12 spending in Minnesota’s Red Lake School District is relatively high, at nearly $20,000 per student, but students face a number of obstacles to academic success, despite the relatively high funding.
Just 5.9% of adults in the district have a bachelor’s degree, which is one of the lowest shares of any district in the state or the country. In Minnesota, 35.4% of adults have a bachelor’s degree.
24. Mississippi: Holmes County School District
> Location: Holmes County
> Annual per student spending: $8,439
> Adults with a bachelor’s degree: 10.3%
The Holmes County School District ranks as the worst in the state of Mississippi. Smaller class sizes have been shown to improve education outcomes in some cases, and in Holmes County, there are 17.3 students per teacher, higher than the 15.1 to 1 student-teacher ratio across Mississippi. Per pupil spending in the district is also slightly below average. According to Niche, only 15% of district students are proficient in reading, and just 9% are proficient in math.
[in-text-ad-2]
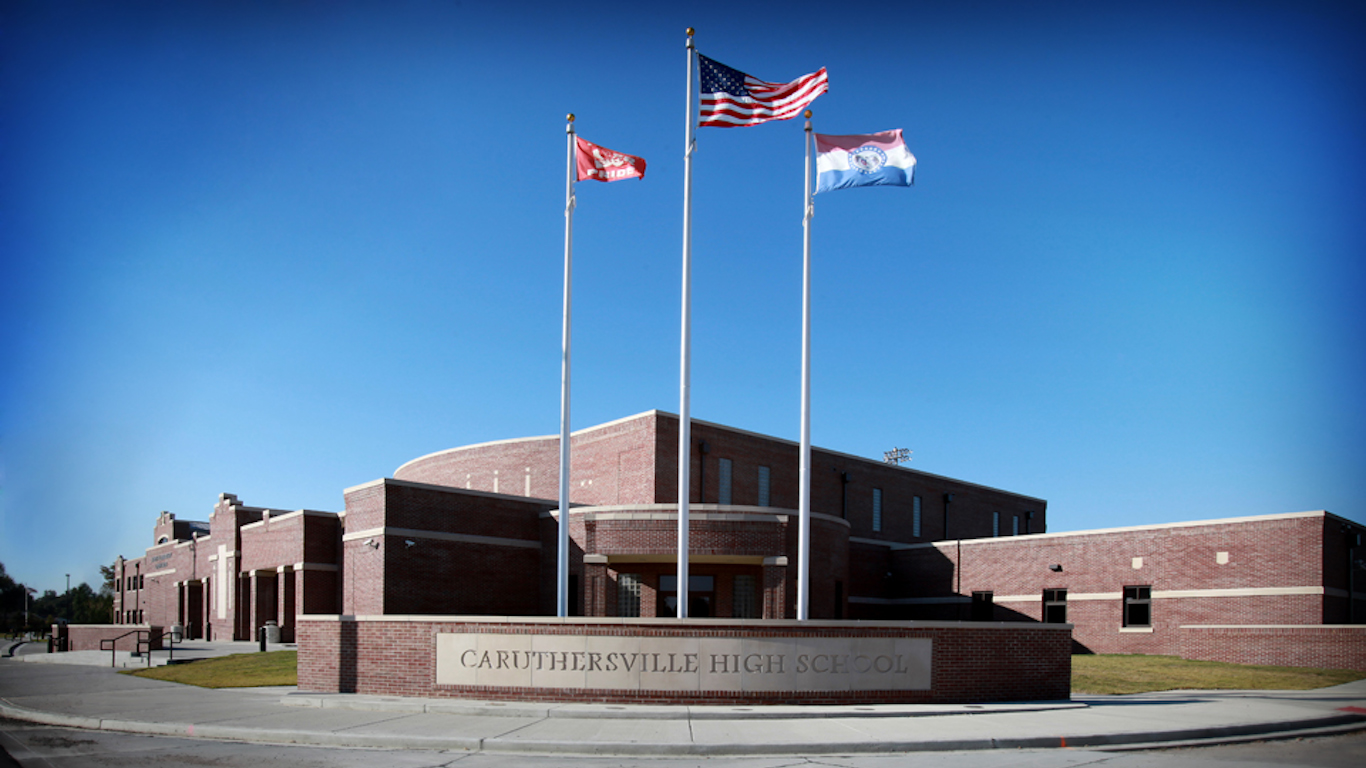
25. Missouri: Caruthersville School District 18
> Location: Pemiscot County
> Annual per student spending: $8,379
> Adults with a bachelor’s degree: 13.7%
In Missouri’s Caruthersville School District, annual per pupil spending is just $8,379, one of the lowest per pupil spending figures in both the state and the country. For context, per pupil spending nationwide is $12,201.
Growing up with parents who have a college education can improve chances for academic success. However, in the district, just 13.7% of adults have a bachelor’s degree, less than half the nationwide bachelor’s degree attainment rate.
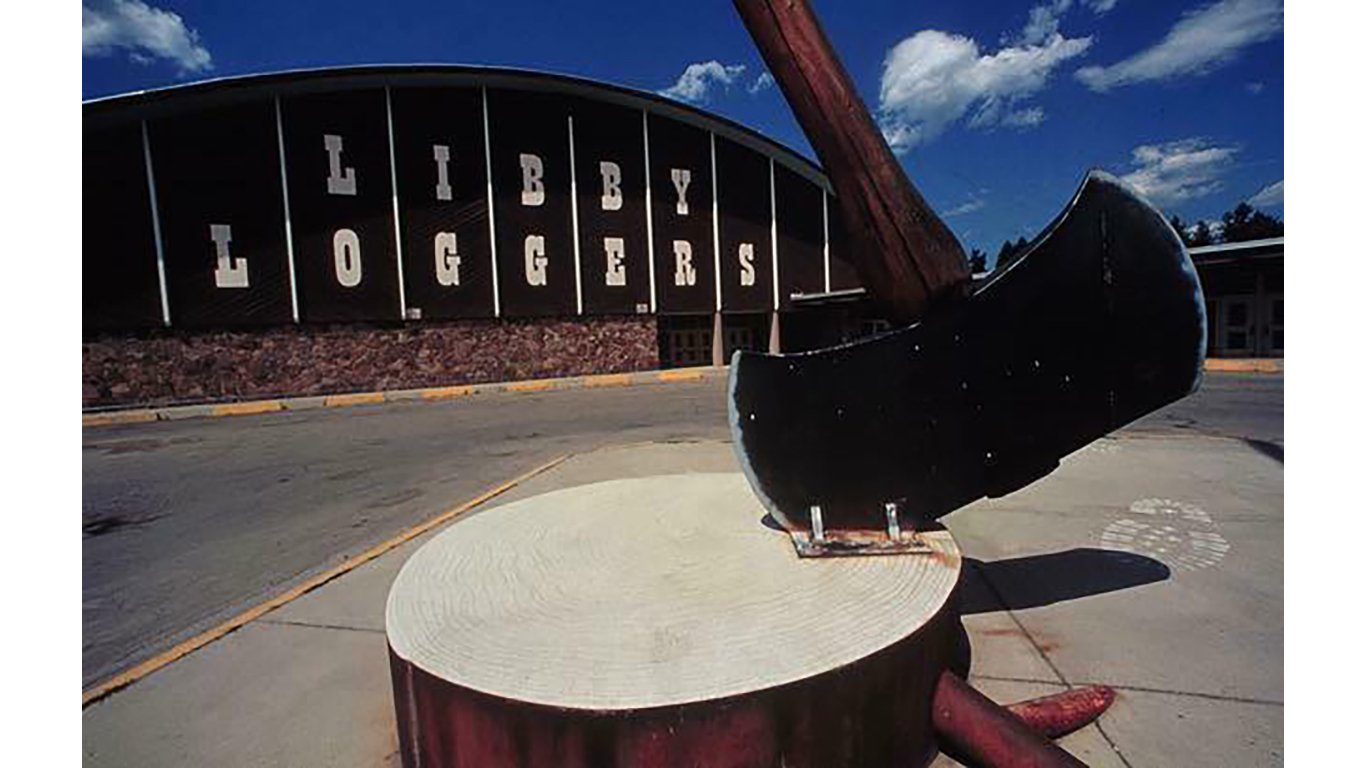
26. Montana: Libby Public Schools
> Location: Lincoln County
> Annual per student spending: $10,752
> Adults with a bachelor’s degree: 22.2%
Students in Montana’s Libby Public Schools district do not benefit from the same level of financial resources as many other students in the state. Per student spending in the district is just $10,752 annually, below both the comparable average spending across state school districts of $11,443 and the average nationwide of $12,201. Greater investment could reduce class sizes. Currently, there are 16.3 students per teacher, well above the state average student-to-teacher ratio of 14.2 to 1.
[in-text-ad]
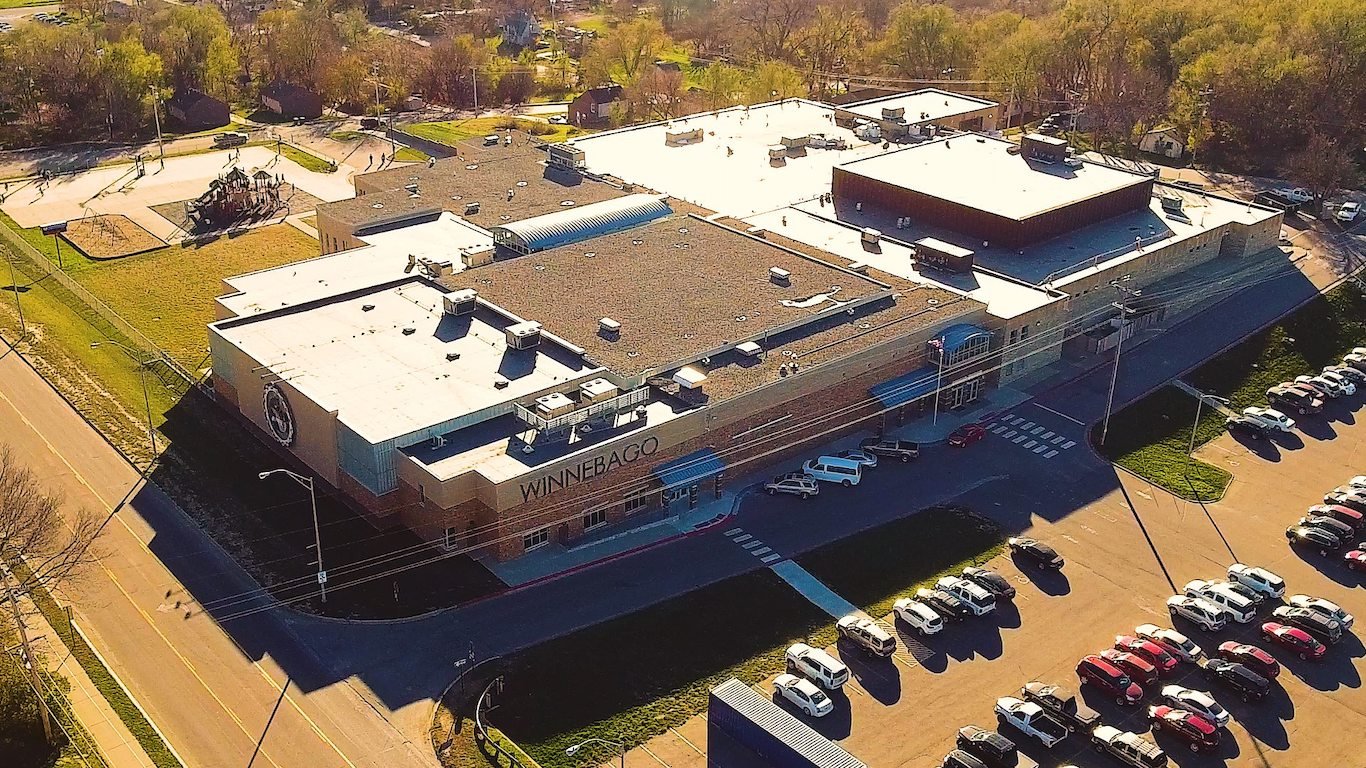
27. Nebraska: Winnebago Public Schools
> Location: Thurston County
> Annual per student spending: $22,636
> Adults with a bachelor’s degree: 14.3%
Nebraska’s Winnebago district is relatively small, comprising only two schools that enroll about 600 students. The district’s ranking on this list is due in large part to conditions outside the classroom.
Students who live in poor households are much less likely than those who grow up in more affluent households to succeed in school, as are those whose parents have a college education. In the district 29.5% of school-aged children live below the poverty line, compared to 11.2% of children statewide. Additionally, just 14.3% of adults in the district have a bachelor’s degree or higher, compared to 31.3% of adults across the state.
28. Nevada: Nye County School District
> Location: Nye County
> Annual per student spending: $12,077
> Adults with a bachelor’s degree: 11.5%
Students in Nevada’s Nye County School District are less likely than those across the state as a whole to enroll in advanced, college level courses before graduating from high school. Just 9.6% of the district’s high schoolers are in an AP course, a far smaller share than the 18.7% of students across Nevada as a whole.
While students in the district benefit from higher than average school spending, other important factors outside of the classroom put many children in the area at a disadvantage academically. For example, children of college-educated adults have been shown to perform better academically, and in the Nye County district, just 11.5% of adults have a bachelor’s degree, less than half the 24.2% share of adults across Nevada.

29. New Hampshire: Berlin Public Schools
> Location: Coos County
> Annual per student spending: $17,578
> Adults with a bachelor’s degree: 12.3%
Poverty can put enormous stress on school-age children, and that can have a negative effect on academic performance. In New Hampshire’s Berlin Public School district, 26.5% of school age children live below the poverty line, the largest share of any district in the state and well above the 8.8% child poverty rate across New Hampshire as a whole.
[in-text-ad-2]

30. New Jersey: Camden City School District
> Location: Camden County
> Annual per student spending: $23,996
> Adults with a bachelor’s degree: 9.1%
Smaller class sizes have been shown in some cases to have a positive effect on academic achievement. In New Jersey’s Camden City School District, there are 13.6 students per teacher, higher than the 12.2 to 1 statewide student-to-teacher ratio.
Students in the district are less likely than those across the state to enroll in advanced, college level courses before graduating from high school. Just 3.8% of the district’s high schoolers are in an AP course, a far smaller share than the 19.5% of high schoolers who are across New Jersey as a whole.
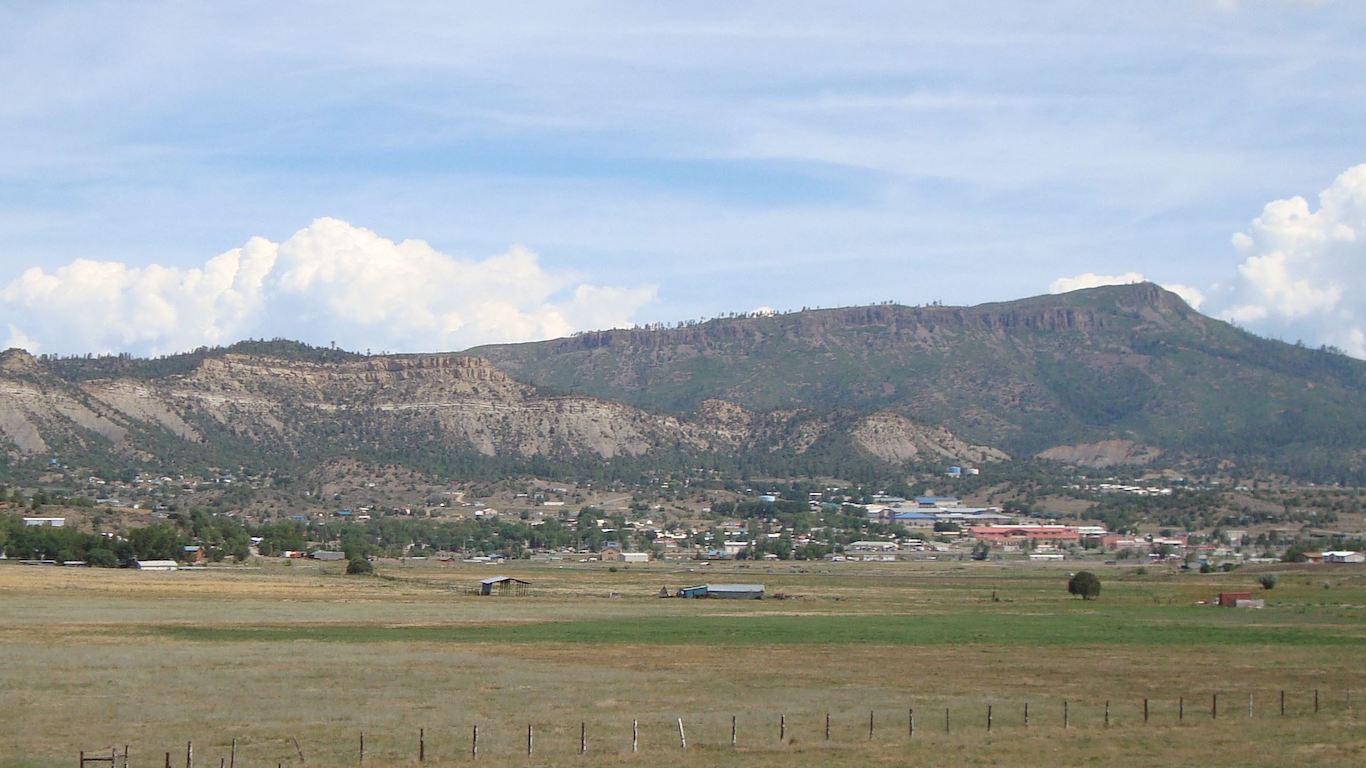
31. New Mexico: Dulce Independent Schools
> Location: Rio Arriba County
> Annual per student spending: $14,429
> Adults with a bachelor’s degree: 10.1%
New Mexico’s Dulce Independent School district has smaller than average class sizes and greater than average per student spending. However, some of the factors that can affect student performance the most are outside of the classroom — and these measures largely explain the district’s ranking on this list.
Students who live in poor households are much less likely than those who grow up in more affluent households to succeed in school, as are those whose parents have a college education. In the district 28.1% of school aged children live below the poverty line, compared to 23.3% of children statewide. Additionally, just 10.1% of adults in the district have a bachelor’s degree or higher, compared to 27.1% of adults across the state.
[in-text-ad]
32. New York: Rochester City School District
> Location: Monroe County
> Annual per student spending: $23,428
> Adults with a bachelor’s degree: 24.7%
Public schools in New York are generally high performing compared to schools nationwide, but the Rochester City School District ranks as the worst in the state. Students in the district are less likely than those across the state as a whole to enroll in advanced, college level courses before graduating from high school. Just 8.2% of the district’s high schoolers are in an AP course, a far smaller share than the 21.0% who are enrolled in AP classes across New York as a whole.
Poverty and the many challenges that come with it can have a negative impact on academic performance. In the Rochester district, 39.1% of school age children live below the poverty line, compared to 17.5% of children across the state as a whole.
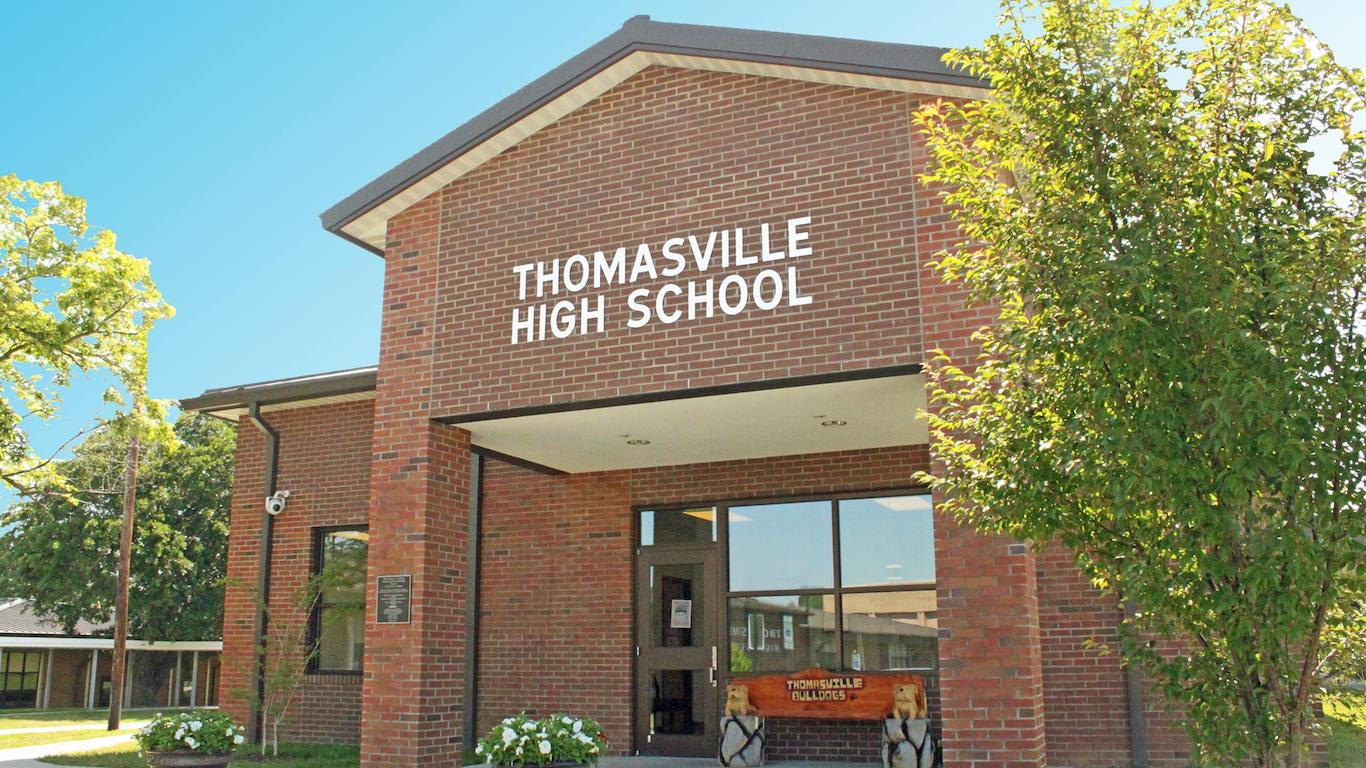
33. North Carolina: Thomasville City Schools
> Location: Davidson County
> Annual per student spending: $10,412
> Adults with a bachelor’s degree: 10.7%
Students In North Carolina’s Thomasville City Schools are more likely than those in most other districts in the state to face obstacles to their academic development based on their home environment. Just 10.7% of adults have a bachelor’s degree, one-third the national bachelor’s degree attainment rate. The child poverty rate in the district of 36.8% is well above the state child poverty rate of 18.6% and one of the highest of any school district in the country.

34. North Dakota: Belcourt School District 7
> Location: Rolette County
> Annual per student spending: $14,371
> Adults with a bachelor’s degree: 21.7%
North Dakota’s Belcourt School District 7 has one of the lower freshman graduation rates in the state, at about 70%.
The district is relatively low income — the typical household has an annual income of just $32,375, one of the lowest incomes both in the state and the country. An estimated 23.8% of children in the district live in poverty, well above the state’s 9.5% child poverty rate. Children growing up in poverty are more likely than their peers to struggle academically.
[in-text-ad-2]
35. Ohio: Cleveland Municipal School District
> Location: Cuyahoga County
> Annual per student spending: $17,059
> Adults with a bachelor’s degree: 16.5%
A large share of students in Ohio’s Cleveland Municipal School District face academic disadvantages tied to their socioeconomic background. Over 20% of adults in the district lack a high school diploma, one of the larger shares of any district in the country. Also, an estimated 44.3% of 5 to 17 year olds in the district live in poverty.
Student outcomes in the district are relatively poor. In both math and reading exams, less than 30% of students scored as proficient, according to Niche. The district also has a relatively low high school graduation rate.

36. Oklahoma: Crooked Oak Public Schools
> Location: Oklahoma County
> Annual per student spending: $8,367
> Adults with a bachelor’s degree: 2.8%
Socioeconomic conditions in Oklahoma’s Crooked Oak Public Schools district are likely to have a negative impact on student achievement. Just 2.8% of adults have a bachelor’s degree, which is not only the lowest share in the state but one of the 10 lowest shares out of more than 10,000 U.S. school districts. And only an estimated 68.5% of adults in the district have a high school diploma. Over 35% of children in the district live in poverty.
Academic outcomes are relatively poor in the district. According to Niche, just 21% of students in the district score as proficient in reading, and just 16% score as proficient in math.
[in-text-ad]

37. Oregon: Oakridge School District
> Location: Lane County
> Annual per student spending: $13,128
> Adults with a bachelor’s degree: 15.5%
Spending in Oregon’s Oakridge School District comes to $13,128 per student per year, which is higher than both the national and state per pupil spending figures. However, based on socioeconomic indicators of success and school outcomes, students in the district face substantial obstacles to academic achievement. Notably, the district has a child poverty rate of 56.2%, which is by far the highest in the state — the state’s child poverty rate is 13.9% — and is 10th highest in the country. The district also has a far lower than average high school graduation rate.
38. Pennsylvania: Farrell Area School District
> Location: Mercer County
> Annual per student spending: $26,975
> Adults with a bachelor’s degree: 13.0%
Pennsylvania’s Farrell Area School District is a small district of only two schools and about 700 students located in the northwestern section of the state. According to Niche, only about 16% of district students are proficient in math, and 31% are proficient in reading.
Though the district has higher than average per student spending and smaller than average class sizes, circumstances outside the classroom likely have a negative impact on academic performance. For example, poverty can put enormous stress on school-age children, and that can have a negative effect on academic performance. In the school district, 43.9% of school-age children live below the poverty line, more than double the 15.5% state child poverty rate.
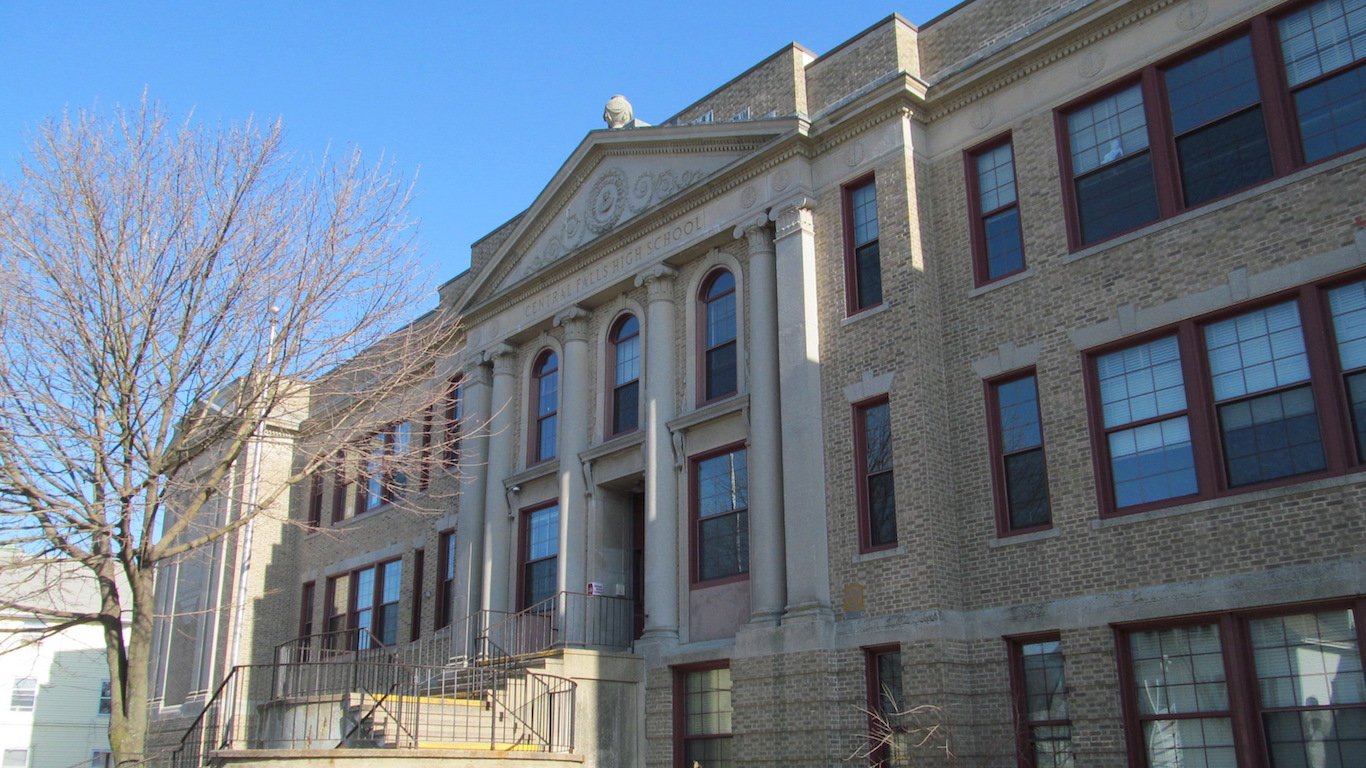
39. Rhode Island: Central Falls School District
> Location: Providence County
> Annual per student spending: $17,157
> Adults with a bachelor’s degree: 8.0%
The Central Falls School District, located just north of Providence, ranks as the worst school district in Rhode Island. Only 11% of district students are proficient in reading, and 9% are proficient in math. Poor academic performance is likely due in part to conditions outside of the classroom, as 34.2% of school age children in the district live below the poverty line, the largest share of any Rhode Island school district and more than double the state child poverty rate of 16.2%. Poverty can detract considerably from young student’s ability to perform academically.
[in-text-ad-2]
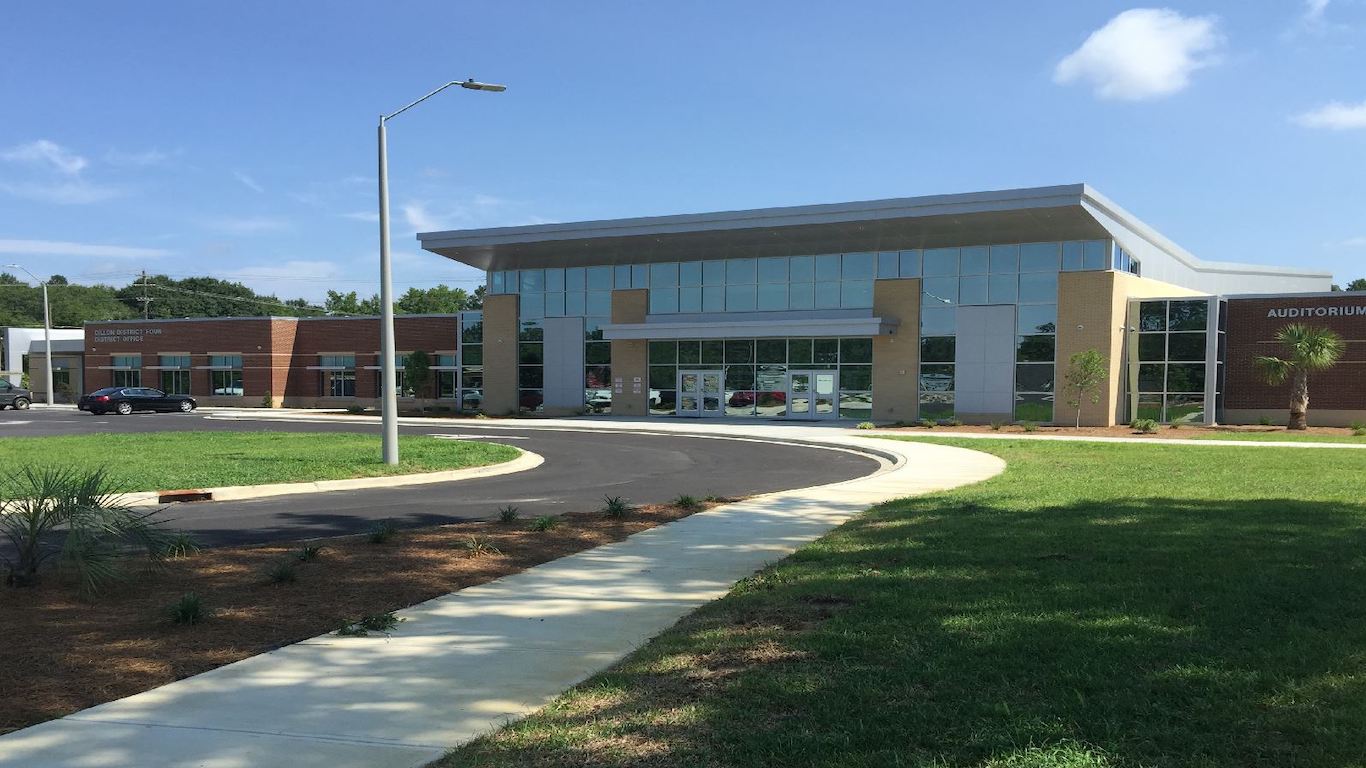
40. South Carolina: Dillon School District Four
> Location: Dillon County
> Annual per student spending: $9,387
> Adults with a bachelor’s degree: 10.6%
Dillon School District Four is located in northern South Carolina. Schools in the district lack the same financial resources as the average district statewide as per pupil spending in Dillon is $9,387 per year — below the $10,590 average across South Carolina. Additionally, smaller class sizes have been shown in some cases to improve academic outcomes, but in Dillon, the student-to-teacher ratio of 17.3 to 1 is well above the 14.8 to 1 average ratio statewide.
Older students in the Dillion district are less likely than those across the state as a whole to enroll in advanced, college level courses. Just 2.5% of district high schoolers are in an AP course, compared to 14.7% of high schoolers in South Carolina.
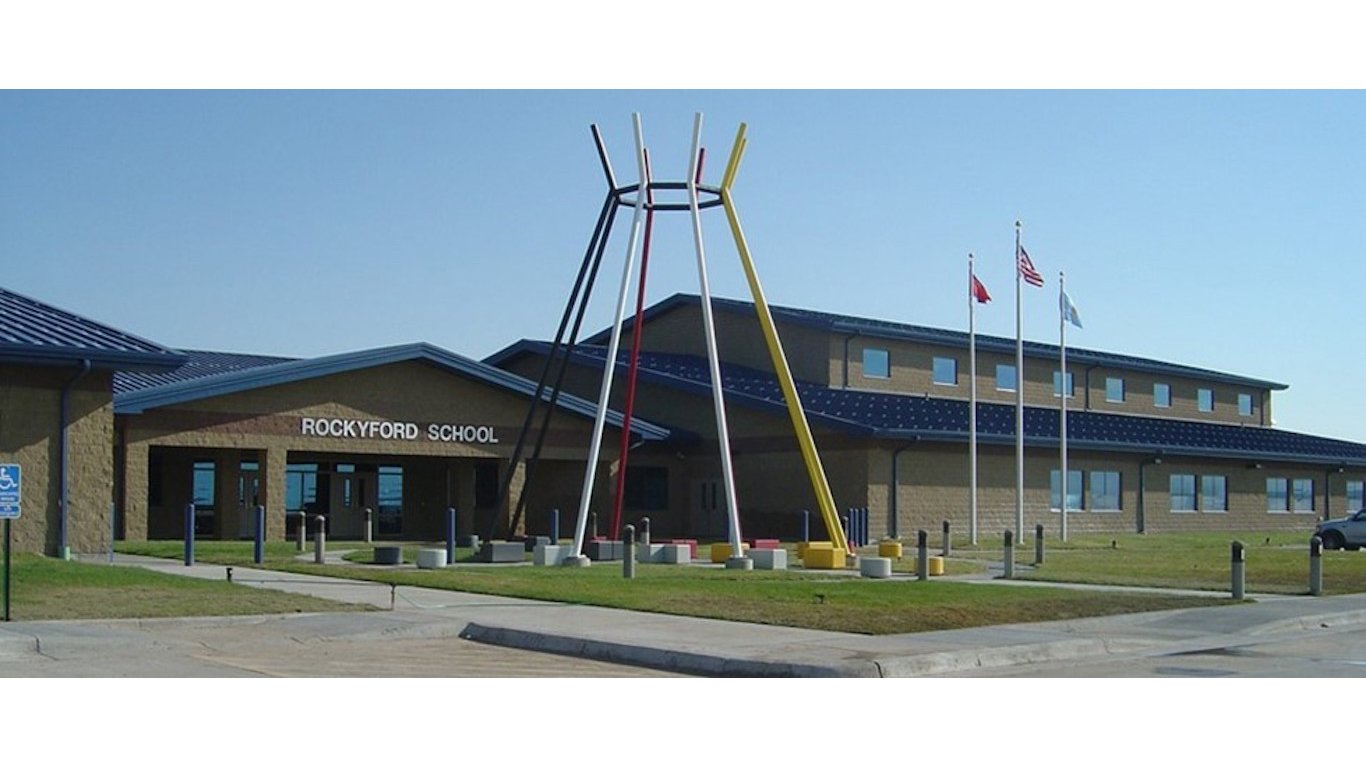
41. South Dakota: Oglala Lakota County School District
> Location: Oglala Lakota County
> Annual per student spending: $16,412
> Adults with a bachelor’s degree: 11.8%
Serious financial hardship can undermine a student’s ability to perform well academically, and the Oglala Lakota County School District is one of the poorest places in the United States. Over half of all children in the district live below the poverty line, compared to 14.3% of school-age children across South Dakota.
Disadvantages for local students do not end there. Children raised by college-educated parents are more likely to succeed academically than their peers. But in Oglala Lakota, just 11.8% of adults have a bachelor’s degree or higher, well below the 28.5% share of adults across the state.
[in-text-ad]

42. Tennessee: Fayetteville City Schools
> Location: Lincoln County
> Annual per student spending: $8,104
> Adults with a bachelor’s degree: 18.3%
In Tennessee’s Fayetteville City Schools district, located in the southern part of the state near the border with Alabama, annual spending comes to just $8,104 per student, about $1,000 less than the state’s already low per-pupil spending and approximately $4,000 less than the national per pupil spending figure.
Students in the district are more likely to face obstacles to their academic achievement based on their home environment. The adult bachelor’s degree attainment rate of 18.3% is well below both the state and national figures, and over one in four children in the district live in poverty.
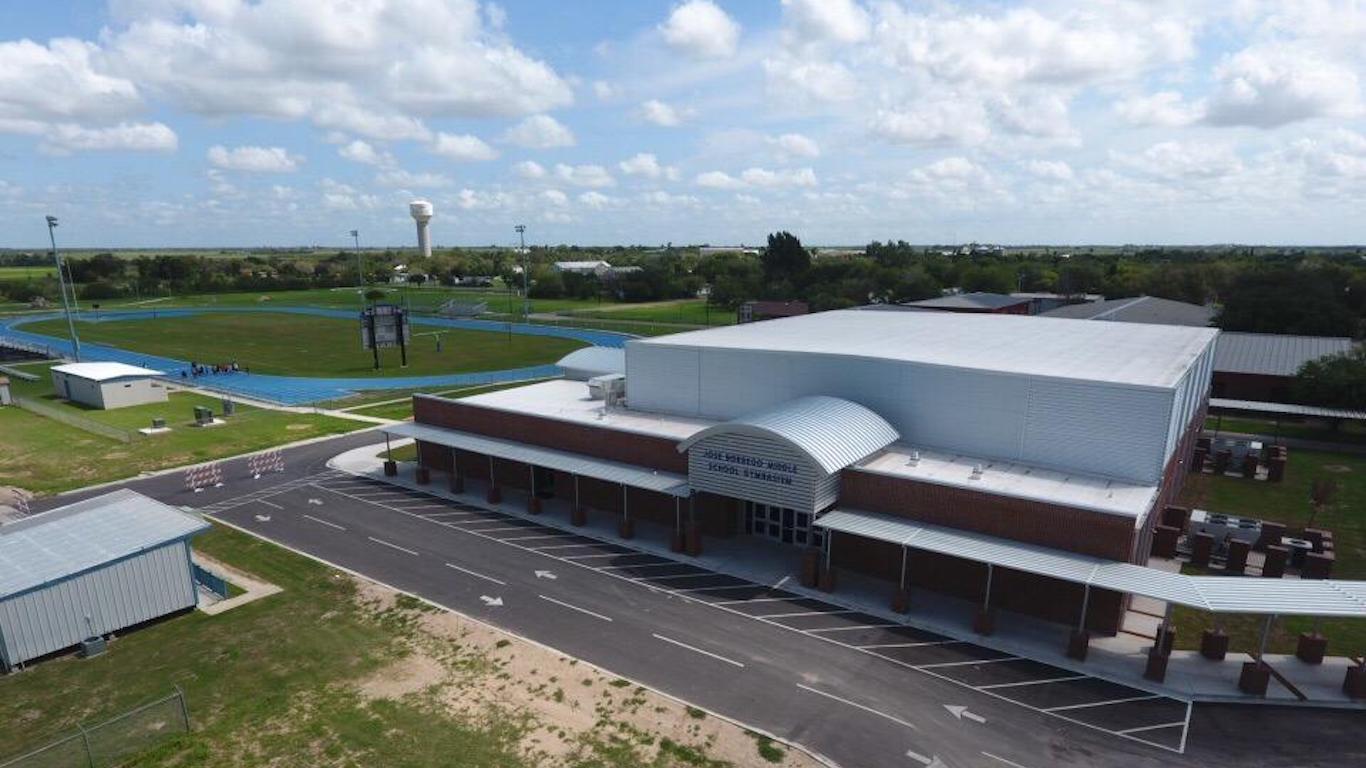
43. Texas: Monte Alto Independent School District
> Location: Hidalgo County
> Annual per student spending: $11,037
> Adults with a bachelor’s degree: 9.5%
Children raised by college-educated parents are more likely to succeed academically than their peers. But in Texas’s Monte Alto Independent School District, just 9.5% of adults have a bachelor’s degree or higher, well below the 29.3% share of adults across the state. Further adding to disadvantages outside of the classroom, over a third of all children in the district live below the poverty line, well above the state child poverty rate of 19.9%.
44. Utah: Ogden City School District
> Location: Weber County
> Annual per student spending: $8,419
> Adults with a bachelor’s degree: 20.1%
Utah’s Ogden City School District has a high school graduation rate of less than 70%, one of the few districts in the state where that is the case.
The district compares favorably to some others in the state in some measures of school quality and achievement, but students in the districts are more likely than students across the state to face academic difficulties based on their home environment. About 20% of adults in the district have a bachelor’s degree, well below the 31.5% share of adults statewide and 33.3% share of adults nationwide. The district’s 17.4% child poverty rate is nearly double the state’s 8.8% child poverty rate.
[in-text-ad-2]

45. Vermont: Springfield School District
> Location: Windsor County
> Annual per student spending: $19,602
> Adults with a bachelor’s degree: 15.9%
In Vermont’s Springfield School District, according to Niche, about a third of students test as proficient in reading, and just 18% test as proficient in math. AP enrollment, an indicator of student achievement, is extremely low in the district. An estimated 1 in 20 high school students have enrolled in at least one AP course, one of the lowest shares of any district in the state with available data and well below the 21.5% national share.
Another important indicator of student opportunity for success is the education level of their parents. In the district, 15.9% of adults have a bachelor’s degree, well below the state’s 37.3% share.
46. Virginia: Sussex County Public Schools
> Location: Sussex County
> Annual per student spending: $16,071
> Adults with a bachelor’s degree: 12.6%
The Sussex County Public School District is a relatively low-income district located in the southeastern section of Virginia. The conditions associated with poverty can have a negative impact on education outcomes, and in the Sussex County district, 28.3% of school-aged children live below the poverty line, compared to 12.5% of children across Virginia as a whole.
Students in the district are also less likely to take Advanced Placement classes. An estimated 4.4% of district high schoolers are enrolled, well below the estimated 23.6% enrollment across Virginia as a whole.
[in-text-ad]
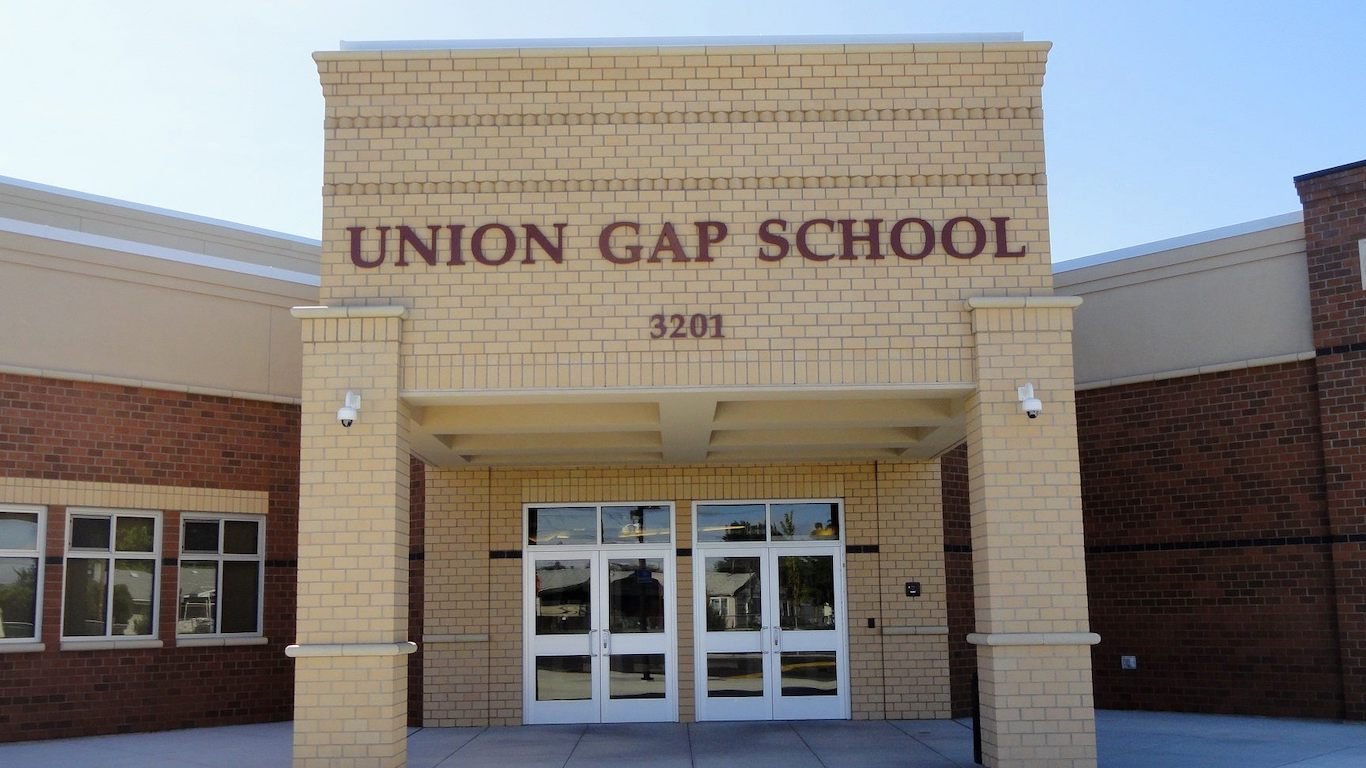
47. Washington: Union Gap School District
> Location: Yakima County
> Annual per student spending: $11,111
> Adults with a bachelor’s degree: 6.8%
Union Gap School District in Washington state, located south of Yakima, has just one school, Union Gap School, which serves students from preschool through eighth grade.
While the district cannot be compared to others based on college entrance test scores and high school graduation rates, it compares poorly to other districts in the state based on socioeconomic measures used to predict student opportunity for success. Just 6.8% of adults in the state have a bachelor’s degree, well below the statewide share of 35.3%. The district’s child poverty rate of 26.5% is much higher than the state rate of 11.5%.

48. West Virginia: McDowell County Schools
> Location: McDowell County
> Annual per student spending: $13,129
> Adults with a bachelor’s degree: 5.4%
In West Virginia’s McDowell County Schools, per pupil spending comes to over $13,000 a year, higher than the national spending of $12,201 and state spending of $11,544. Niche gives the district a D grade for the level of college preparation of its students.
McDowell is one of the poorest districts in the country — nearly 40% of 5 to 17 year olds in the district live in poverty, compared to West Virginia’s relatively high 21.1% child poverty rate. In addition, just 5.4% of adults in the district have a bachelor’s degree, and over one-third have not graduated from high school, both among the worst figures of any district in the country.
49. Wisconsin: Chequamegon School District
> Location: Price County
> Annual per student spending: $14,203
> Adults with a bachelor’s degree: 17.9%
The Chequamegon School District, located in northern Wisconsin, ranks as the worst in the state largely due to conditions outside of the classroom. Children living in poverty face unique challenges that typically hamper academic performance, and the child poverty rate across the district of 17.7% is greater than the 12.6% statewide child poverty rate.
According to Niche, just 40% of students in the district are proficient in reading, and 35% are proficient in math.
[in-text-ad-2]

50. Wyoming: Fremont County School District No. 21
> Location: Fremont County
> Annual per student spending: $28,058
> Adults with a bachelor’s degree: 10.3%
Wyoming’s Fremont County School District 21 is relatively small, with just three operational school buildings and only about 500 students total. In the district, which is located on the Wind River Indian Reservation, per pupil spending comes to over $28,000 per student — well above the state’s relatively high per pupil spending figure of $16,537.
The district has a child poverty rate of over 30%, the highest such figure in the state. Just 10% of adults in the district have a college education, the lowest share of any district in Wyoming.
Take the quiz below to get matched with a financial advisor today.
Each advisor has been vetted by SmartAsset and is held to a fiduciary standard to act in your best interests.
Here’s how it works:
1. Answer SmartAsset advisor match quiz
2. Review your pre-screened matches at your leisure. Check out the
advisors’ profiles.
3. Speak with advisors at no cost to you. Have an introductory call on the phone or introduction in person and choose whom to work with in the future
Take the retirement quiz right here.
Thank you for reading! Have some feedback for us?
Contact the 24/7 Wall St. editorial team.


 24/7 Wall St.
 24/7 Wall St.
 24/7 Wall St.
 24/7 Wall St.