One silver lining to the many measures taken to slow the spread of the new coronavirus has been the elimination of traffic congestion in the country’s biggest cities. Travel speeds have increased nearly across the board in urban centers. It was not long ago that residents in these cities were used to deal with heavy traffic on a near daily basis.
It has been a few weeks now that most Americans have been urged or ordered to stay home, limit nonessential travel, and avoid large gatherings and crowded places. Many are now working from home and use delivery to get groceries and other provisions. All these measures have led to the decline in congestion, according to transportation data company INRIX.
24/7 Wall St. has reviewed the change in vehicle miles traveled (VMT) — as well as the increase in speeds at which people are traveling — amid the COVID-19 pandemic in the 25 most populous U.S. cities using data from INRIX.
Some of the cities earliest to adopt stay at home measures — including Seattle, San Francisco, and New York City — had the earliest increases in average traffic speeds. However, it was Chicago, Los Angeles, Boston, and Washington D.C. that saw the largest increases in speeds by March 13, at which time each city had undergone increases of more than 30%.
By Friday, March 20, automotive speed had increased dramatically enough to qualify as free-flow in America’s 25 largest metropolitan areas. The change was most dramatic in Los Angeles, where traffic speeds increased by 75% compared to a typical day at 5:30 p.m. Chicago was not far behind, with an increased speed of 74%. This change is surely a relief for residents who continue to use the roads, especially in the latter city, which is normally among the cities with the absolute worst traffic in the world.
Congestion is now essentially nonexistent across the nation, and the average vehicle miles traveled in the biggest cities is a fraction of what it typically is. In 13 of the country’s 25 biggest cities, VMT was less than half of their normal VMT during March 28 through April 3, reflecting an extreme decrease in the movement of people and goods. While a voluntary curbing of nonessential travel is part of the reason for this change, each of the cities on the list has been under stay-at-home orders from city, county, or state governments.
Click here to see the impact of COVID-19 on traffic in America’s largest cities.
24/7 Wall St. reviewed vehicle miles traveled (VMT) for the 25 largest metropolitan areas in the U.S. for the period spanning March 28 through April 3 as provided by transportation data company INRIX. VMT measures the total number of miles traveled by all vehicles in a geographic region over a given period of time.
We also reviewed the percentage increase in travel speeds amid the COVID-19 pandemic vs. a non-pandemic typical day. We reviewed travel speeds for two dates — March 13 and March 20 — at 8 a.m. and 5:30 p.m. This data was similarly provided by INRIX.
Finally, we included the total number of COVID-19 cases for each metropolitan area using data from the New York Times.
Source: peeterv / iStock via Getty Images
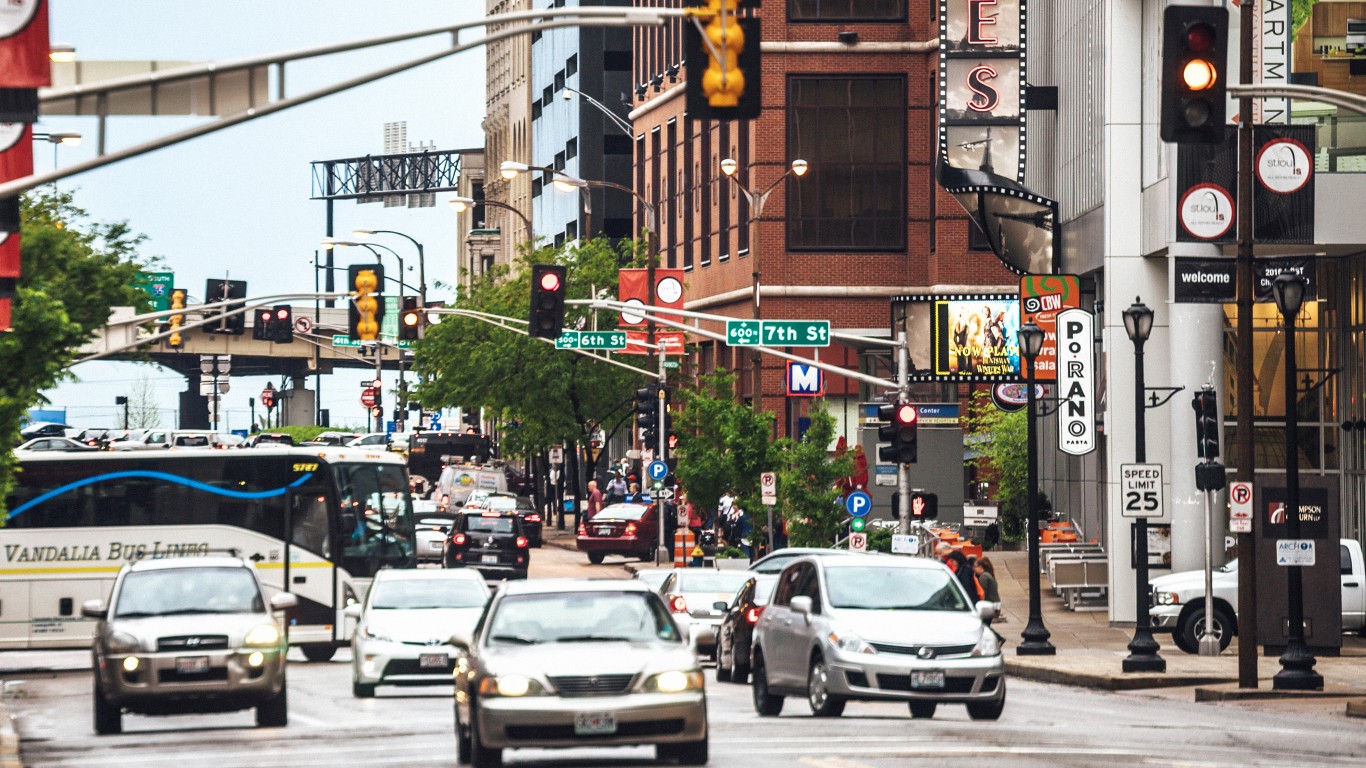
25. St. Louis
> Vehicle miles traveled March 28 – April 3: 58% of normal
> Increase in travel speeds during AM and PM rush hours as of 3/13: 18%, 22%
> Increase in travel speeds during AM and PM rush hours as of 3/20: 0%, 57%
> Confirmed COVID-19 cases as of Apr. 8, 2020: 87.35 per 100,000 — 11th highest (total: 2,450)
[in-text-ad]
Source: SeanPavonePhoto / iStock via Getty Images
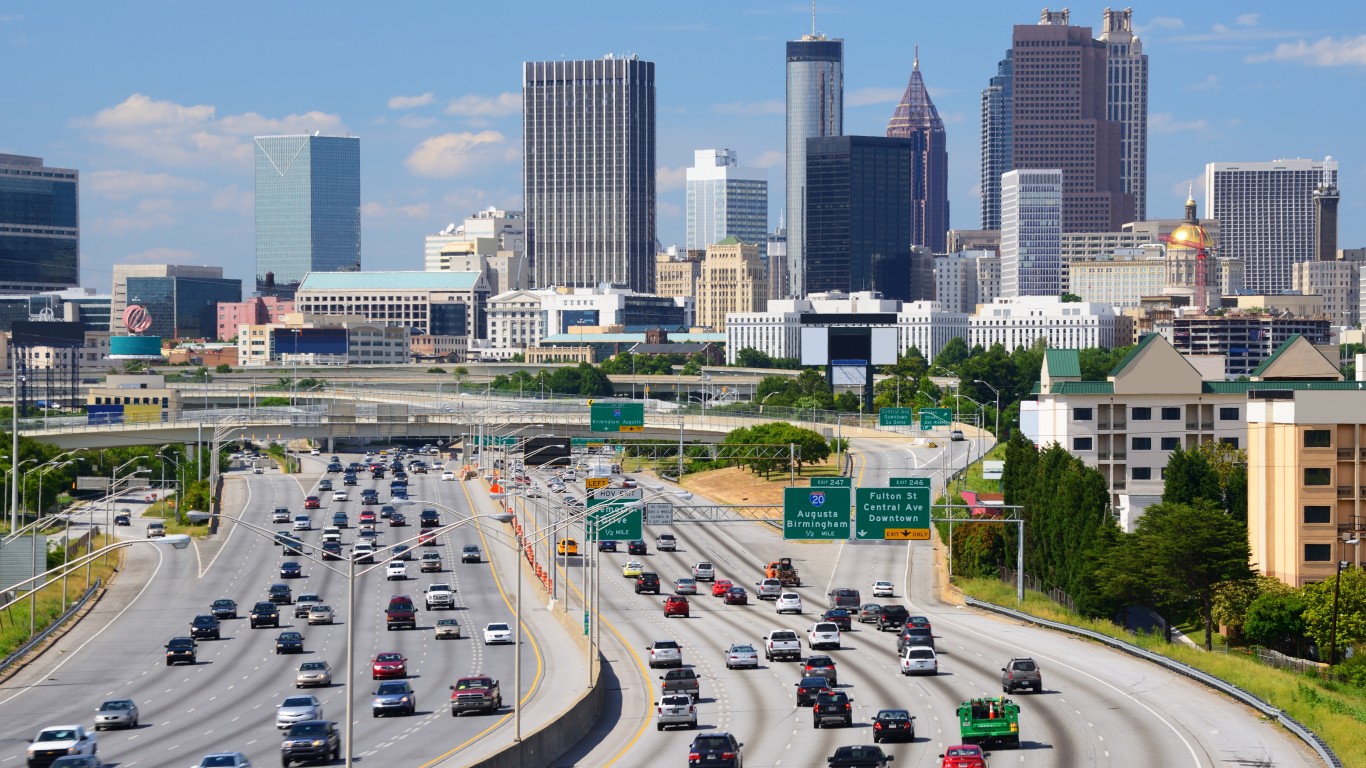
24. Atlanta
> Vehicle miles traveled March 28 – April 3: 57% of normal
> Increase in travel speeds during AM and PM rush hours as of 3/13: 11%, 20%
> Increase in travel speeds during AM and PM rush hours as of 3/20: 16%, 40%
> Confirmed COVID-19 cases as of Apr. 8, 2020: 85.77 per 100,000 — 12th highest (total: 5,104)
 24/7 Wall St.
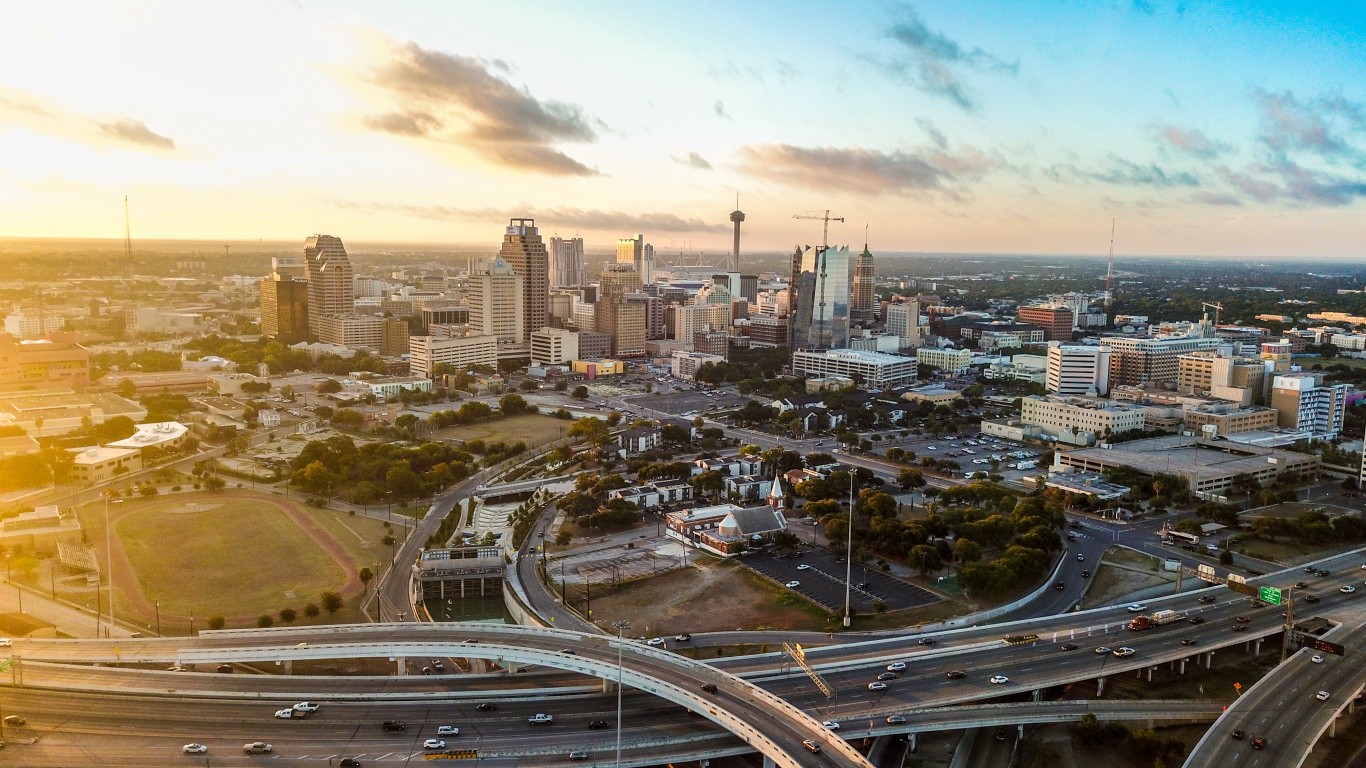
Source: Rut Mehta / iStock via Getty Images
23. San Antonio
> Vehicle miles traveled March 28 – April 3: 56% of normal
> Increase in travel speeds during AM and PM rush hours as of 3/13: 6%, 14%
> Increase in travel speeds during AM and PM rush hours as of 3/20: 11%, 31%
> Confirmed COVID-19 cases as of Apr. 8, 2020: 24.46 per 100,000 — 2nd lowest (total: 616)
Source: f11photo / iStock via Getty Images
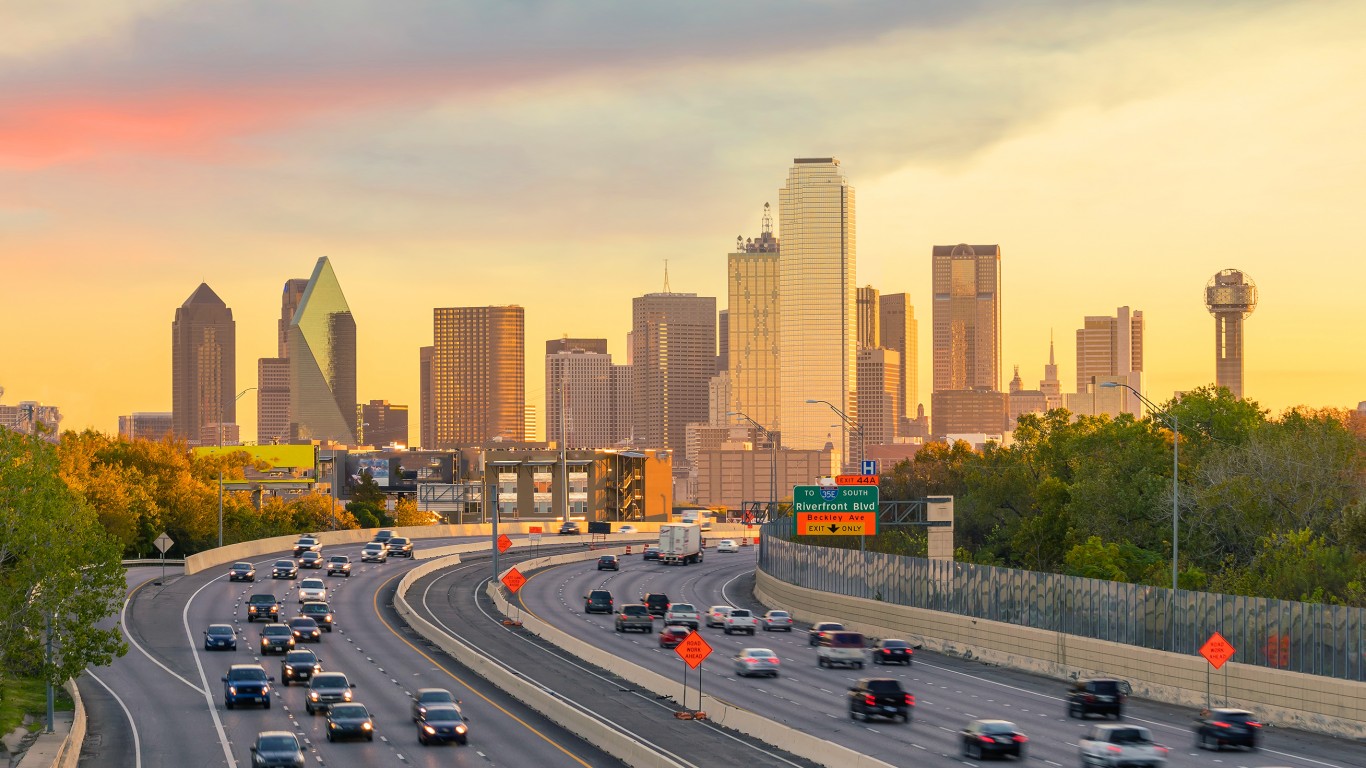
22. Dallas
> Vehicle miles traveled March 28 – April 3: 55% of normal
> Increase in travel speeds during AM and PM rush hours as of 3/13: 0%, 20%
> Increase in travel speeds during AM and PM rush hours as of 3/20: 13%, 38%
> Confirmed COVID-19 cases as of Apr. 8, 2020: 37.39 per 100,000 — 5th lowest (total: 2,819)
[in-text-ad-2]
Source: Evening_T / iStock via Getty Images
21. Houston
> Vehicle miles traveled March 28 – April 3: 55% of normal
> Increase in travel speeds during AM and PM rush hours as of 3/13: 12%, 24%
> Increase in travel speeds during AM and PM rush hours as of 3/20: 21%, 30%
> Confirmed COVID-19 cases as of Apr. 8, 2020: 49.72 per 100,000 — 8th lowest (total: 3,479)
Source: digidreamgrafix / iStock via Getty Images
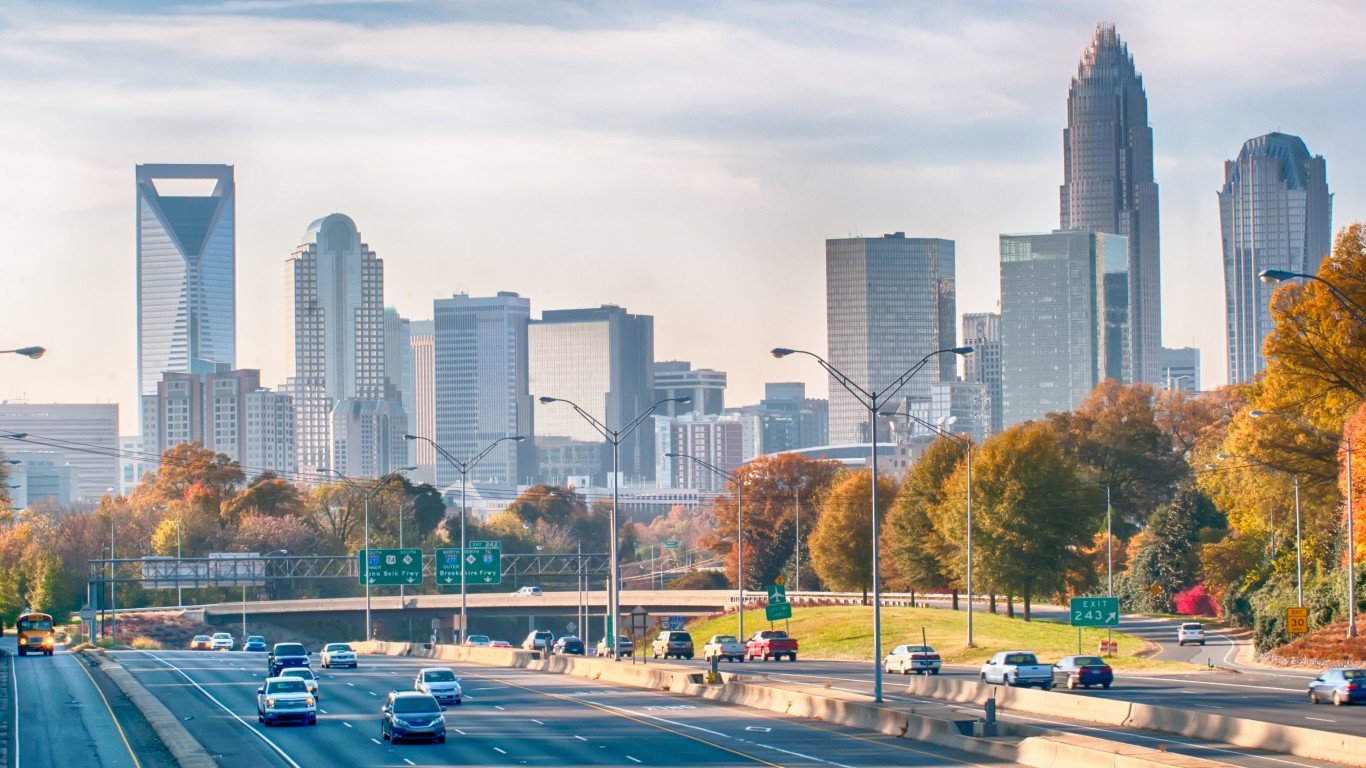
20. Charlotte
> Vehicle miles traveled March 28 – April 3: 54% of normal
> Increase in travel speeds during AM and PM rush hours as of 3/13: 9%, 26%
> Increase in travel speeds during AM and PM rush hours as of 3/20: 16%, 42%
> Confirmed COVID-19 cases as of Apr. 8, 2020: 53.56 per 100,000 — 9th lowest (total: 1,376)
[in-text-ad]
Source: Art Wager / E+ via Getty Images
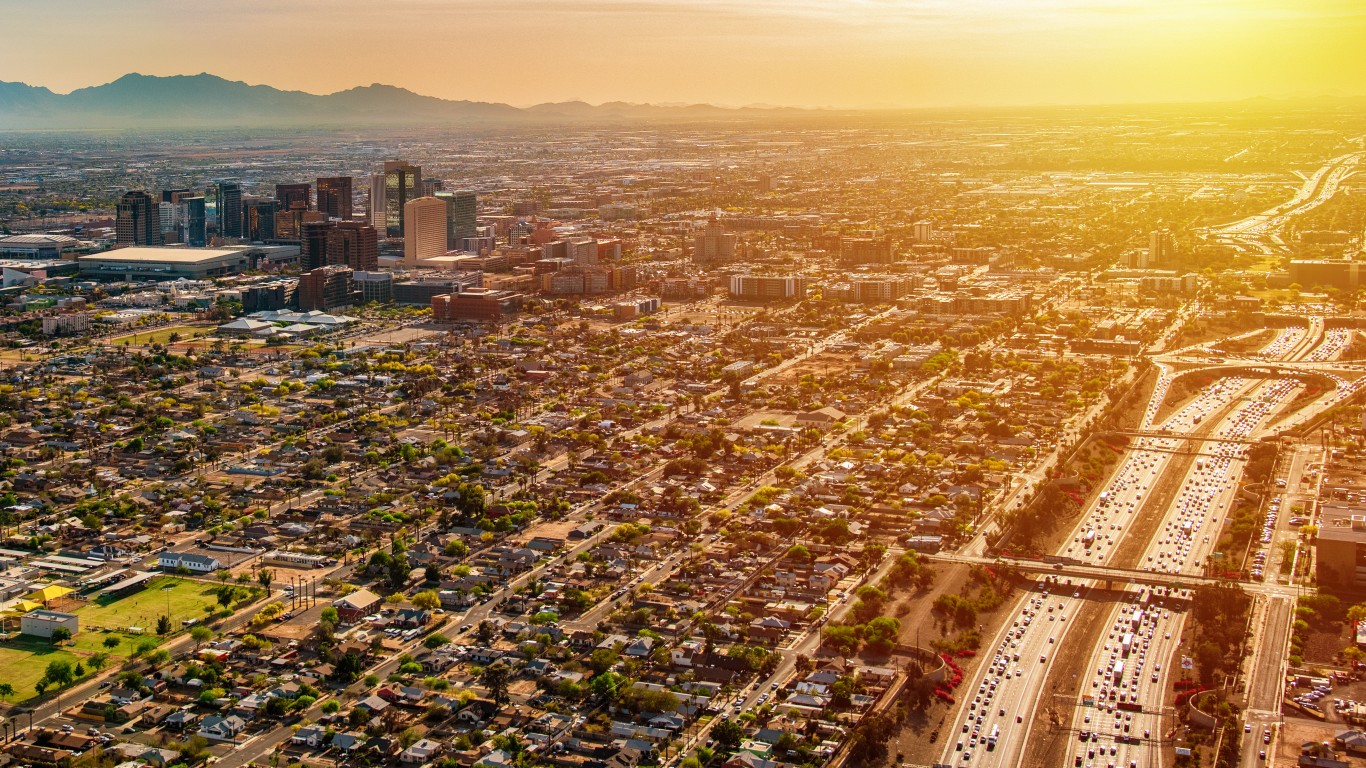
19. Phoenix
> Vehicle miles traveled March 28 – April 3: 53% of normal
> Increase in travel speeds during AM and PM rush hours as of 3/13: 20%, 21%
> Increase in travel speeds during AM and PM rush hours as of 3/20: 19%, 60%
> Confirmed COVID-19 cases as of Apr. 8, 2020: 34.64 per 100,000 — 4th lowest (total: 1,683)
 24/7 Wall St.
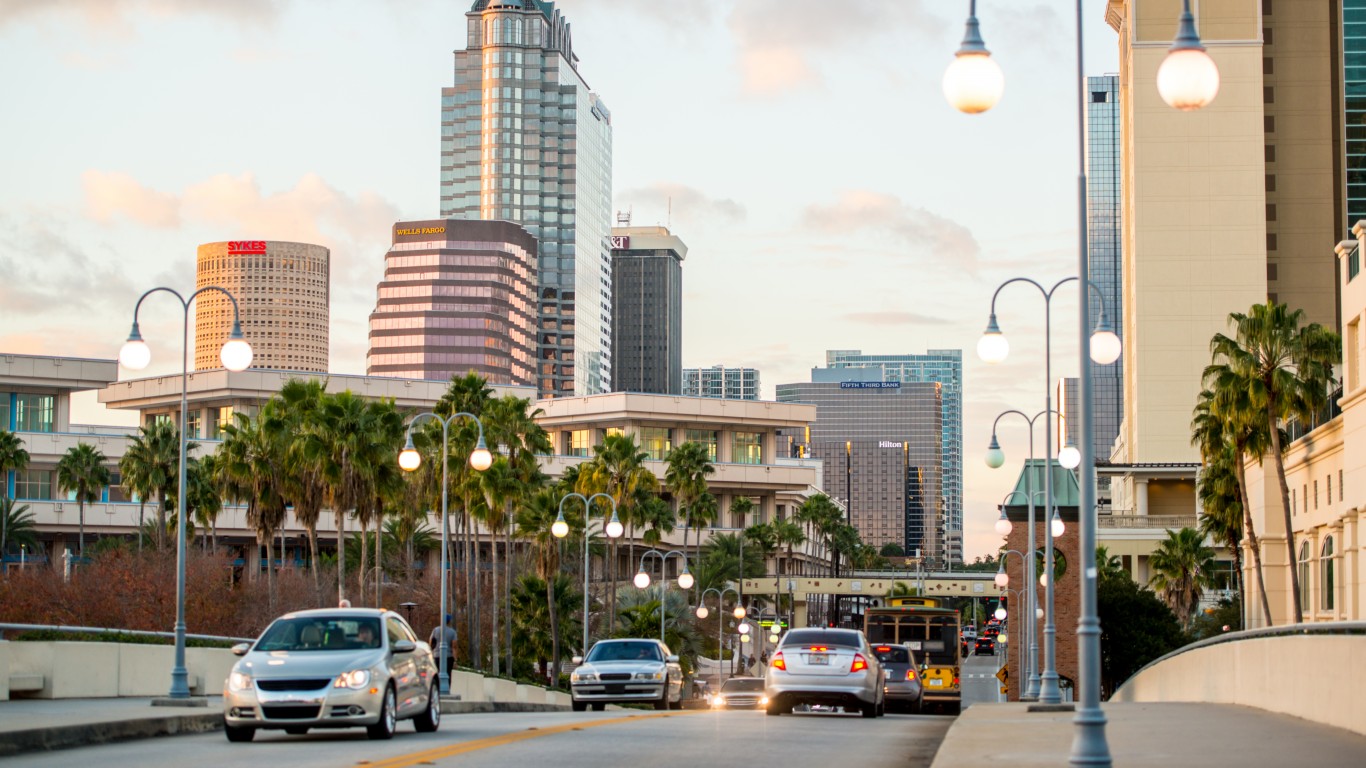
Source: anouchka / iStock via Getty Images
18. Tampa/St. Petersburg
> Vehicle miles traveled March 28 – April 3: 53% of normal
> Increase in travel speeds during AM and PM rush hours as of 3/13: 10%, 20%
> Increase in travel speeds during AM and PM rush hours as of 3/20: 24%, 52%
> Confirmed COVID-19 cases as of Apr. 8, 2020: 38.50 per 100,000 — 6th lowest (total: 1,210)
Source: photoquest7 / iStock via Getty Images
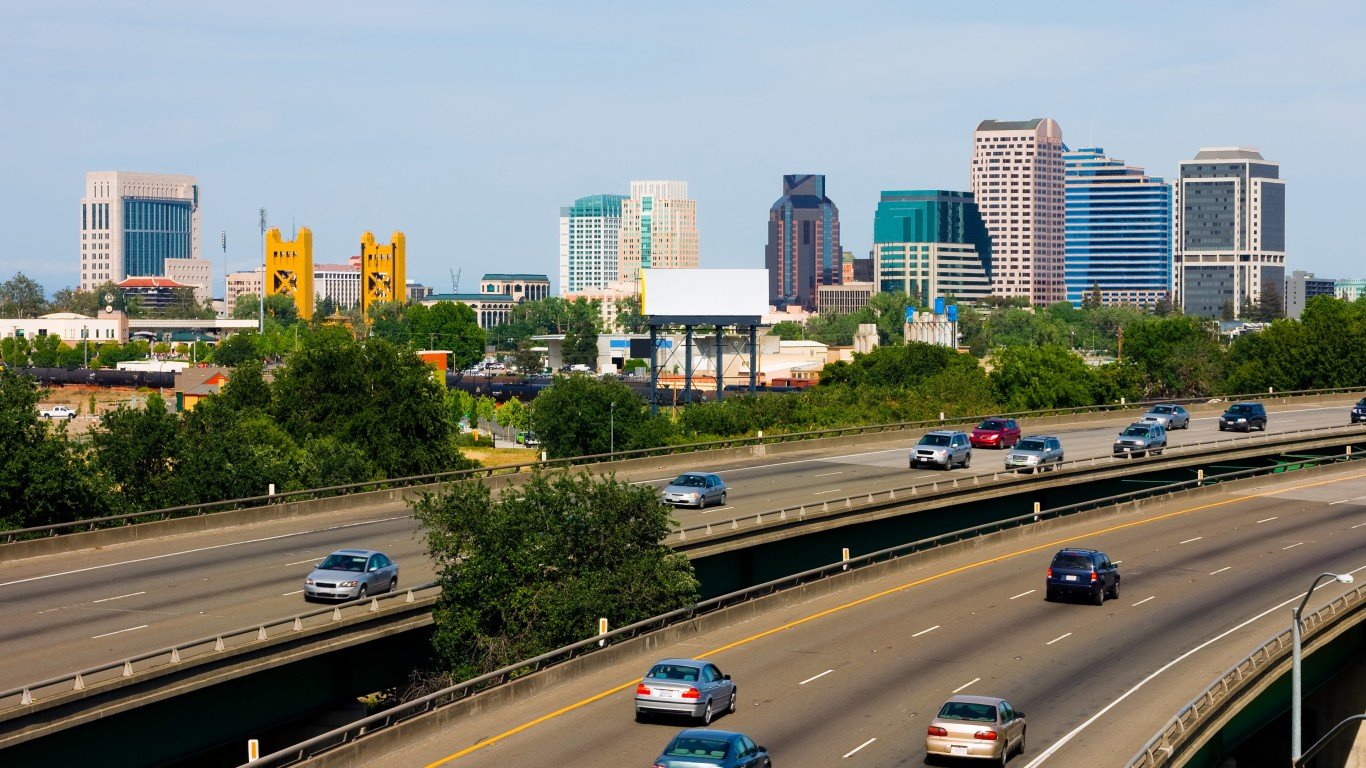
17. Sacramento
> Vehicle miles traveled March 28 – April 3: 52% of normal
> Increase in travel speeds during AM and PM rush hours as of 3/13: 10%, 22%
> Increase in travel speeds during AM and PM rush hours as of 3/20: 21%, 55%
> Confirmed COVID-19 cases as of Apr. 8, 2020: 33.77 per 100,000 — 3rd lowest (total: 792)
[in-text-ad-2]
Source: chrisp0 / E+ via Getty Images
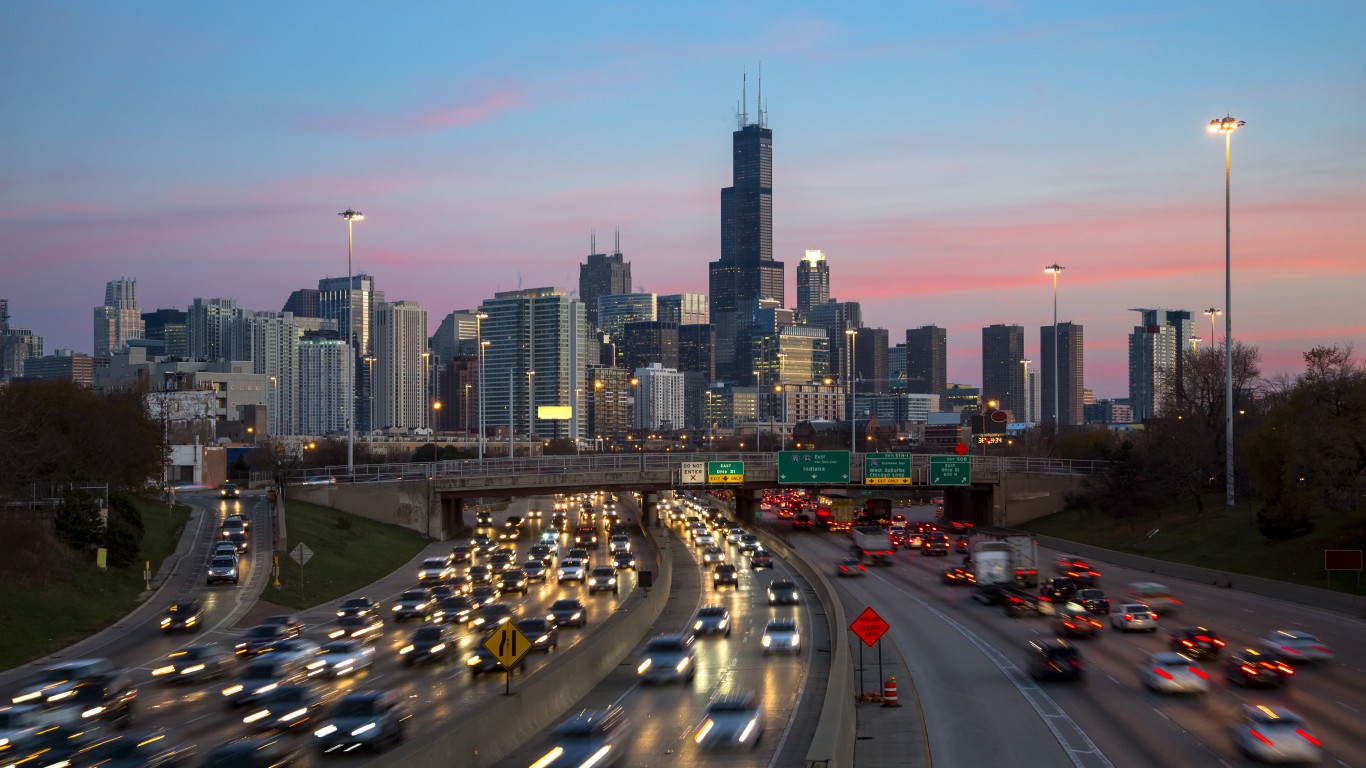
16. Chicago
> Vehicle miles traveled March 28 – April 3: 52% of normal
> Increase in travel speeds during AM and PM rush hours as of 3/13: 8%, 35%
> Increase in travel speeds during AM and PM rush hours as of 3/20: 44%, 74%
> Confirmed COVID-19 cases as of Apr. 8, 2020: 154.18 per 100,000 — 6th highest (total: 14,644)
Source: YinYang / E+ via Getty Images
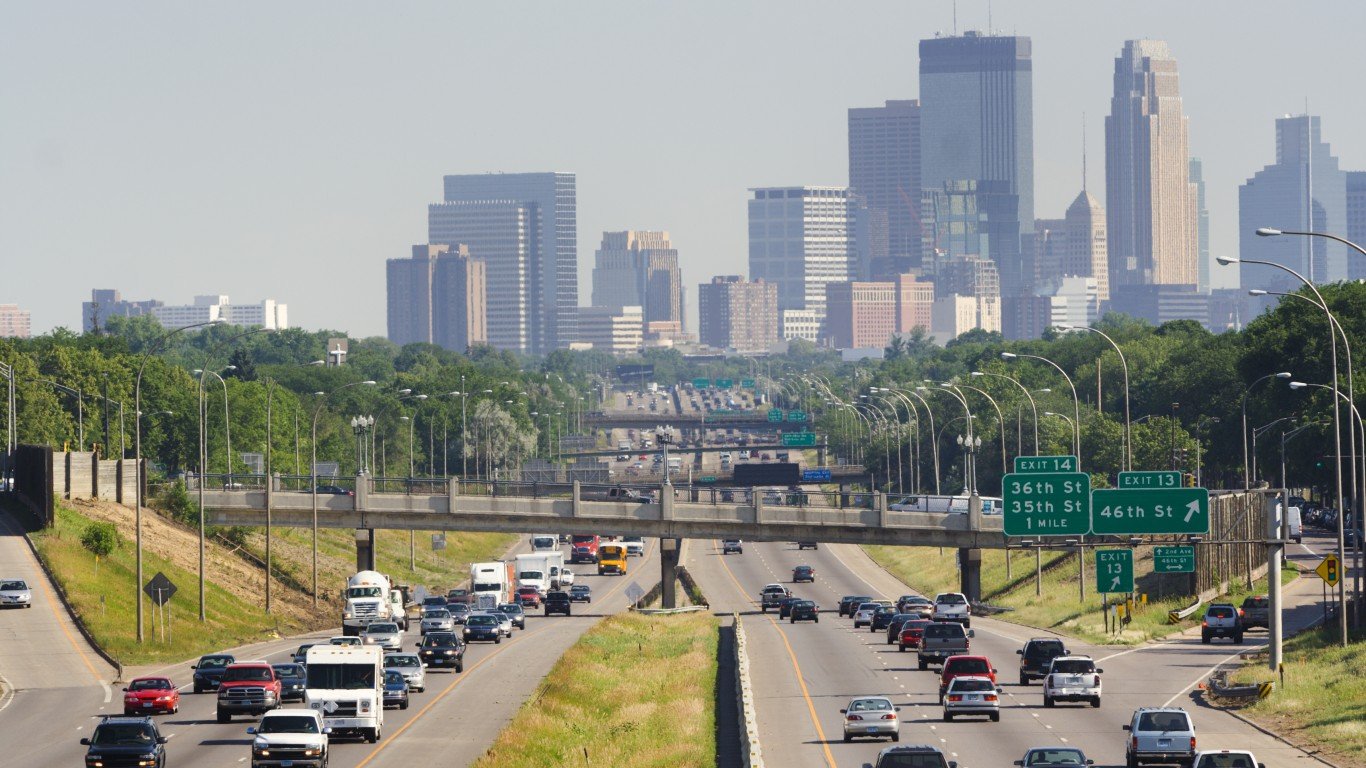
15. Minneapolis
> Vehicle miles traveled March 28 – April 3: 51% of normal
> Increase in travel speeds during AM and PM rush hours as of 3/13: 7%, 17%
> Increase in travel speeds during AM and PM rush hours as of 3/20: 14%, 38%
> Confirmed COVID-19 cases as of Apr. 8, 2020: 20.36 per 100,000 — the lowest (total: 739)
[in-text-ad]
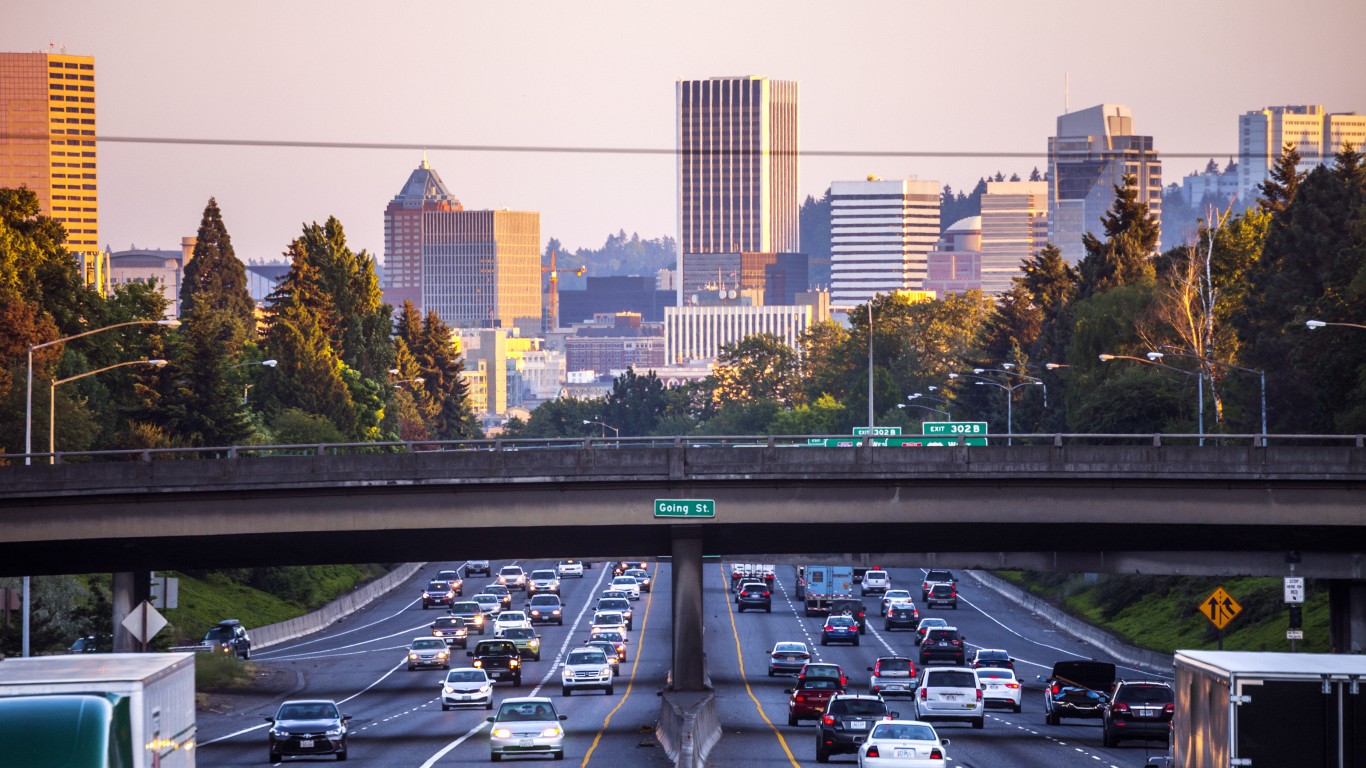
Source: peeterv / iStock via Getty Images
14. Portland
> Vehicle miles traveled March 28 – April 3: 50% of normal
> Increase in travel speeds during AM and PM rush hours as of 3/13: 11%, 30%
> Increase in travel speeds during AM and PM rush hours as of 3/20: 19%, 52%
> Confirmed COVID-19 cases as of Apr. 8, 2020: 73.96 per 100,000 — 13th lowest (total: 396)
Source: Curimedia / Wikimedia Commons
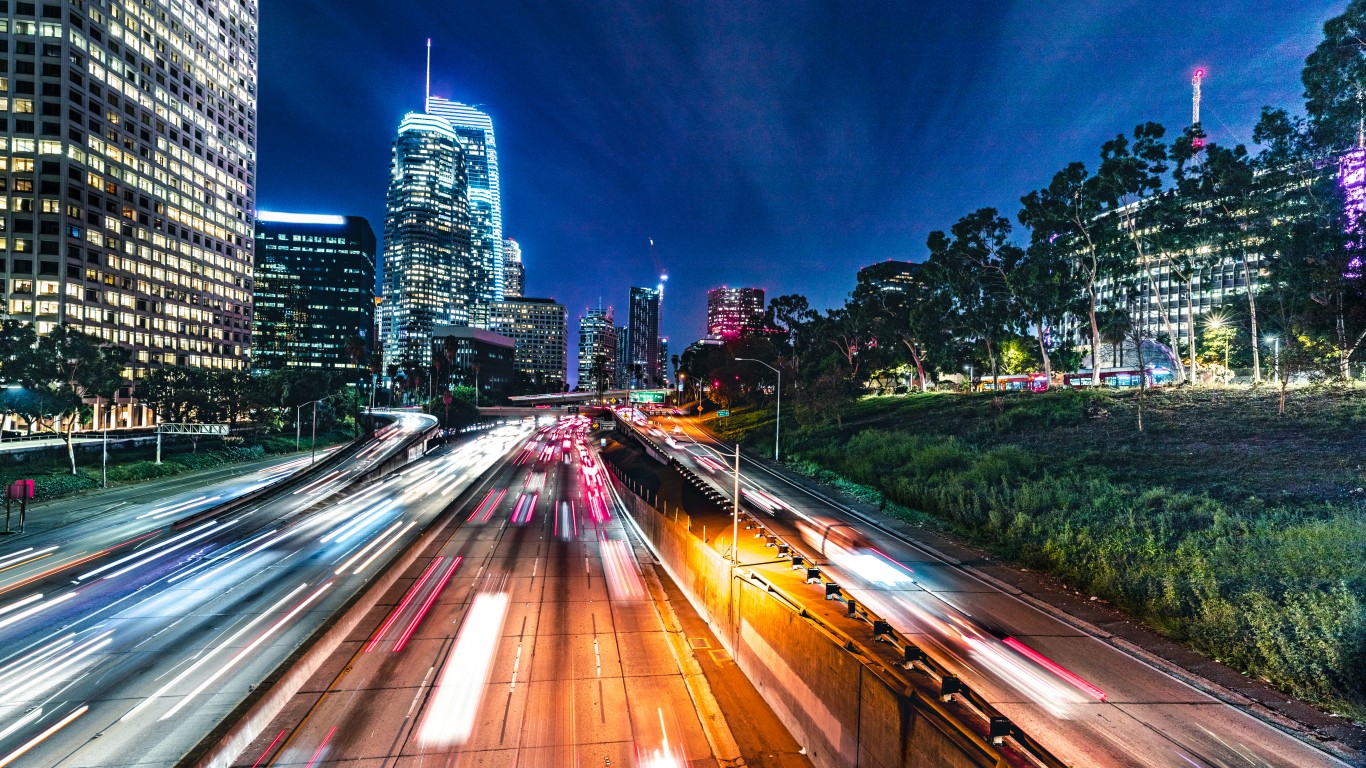
13. Los Angeles
> Vehicle miles traveled March 28 – April 3: 47% of normal
> Increase in travel speeds during AM and PM rush hours as of 3/13: 9%, 38%
> Increase in travel speeds during AM and PM rush hours as of 3/20: 43%, 75%
> Confirmed COVID-19 cases as of Apr. 8, 2020: 64.30 per 100,000 — 12th lowest (total: 8,546)
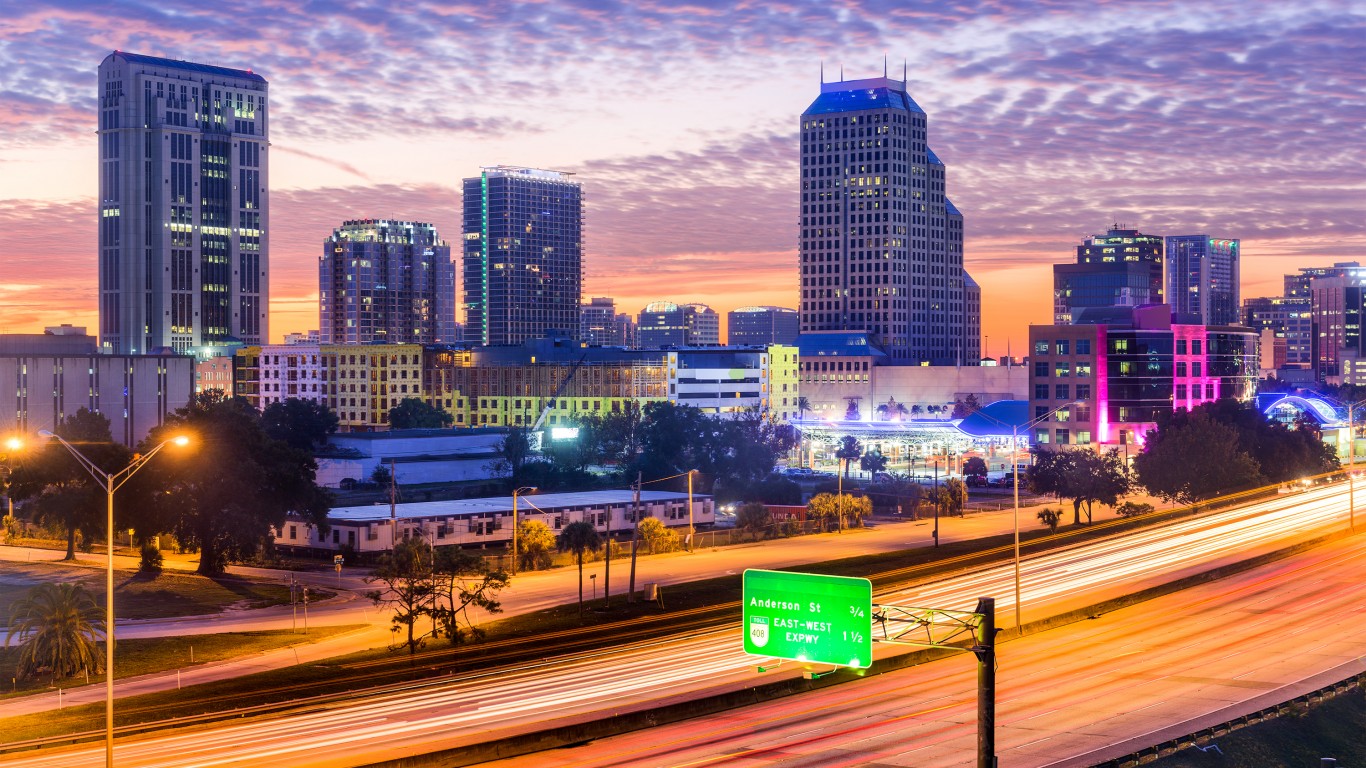
Source: SeanPavonePhoto / iStock via Getty Images
12. Orlando
> Vehicle miles traveled March 28 – April 3: 46% of normal
> Increase in travel speeds during AM and PM rush hours as of 3/13: 8%, 17%
> Increase in travel speeds during AM and PM rush hours as of 3/20: 20%, 34%
> Confirmed COVID-19 cases as of Apr. 8, 2020: 56.63 per 100,000 — 11th lowest (total: 1,457)
[in-text-ad-2]
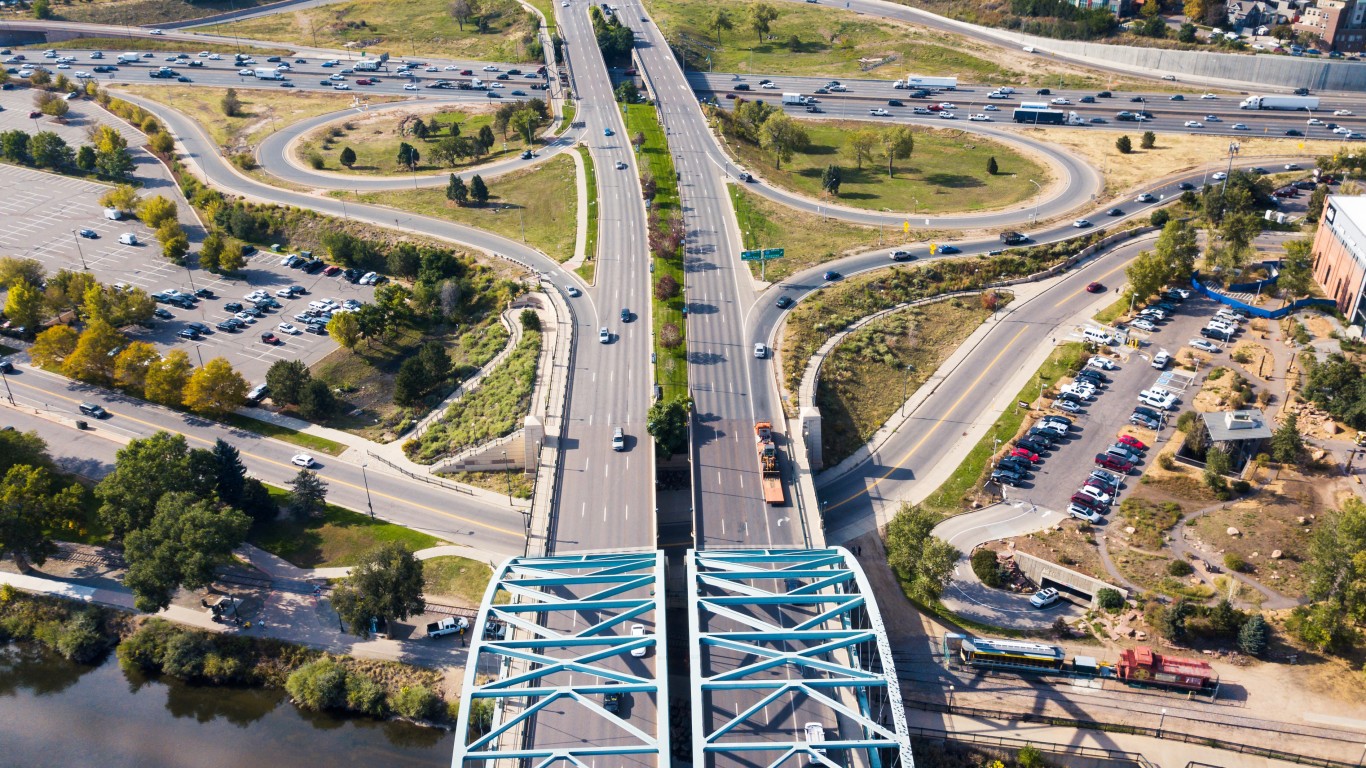
Source: Creative-Family / iStock via Getty Images
11. Denver
> Vehicle miles traveled March 28 – April 3: 46% of normal
> Increase in travel speeds during AM and PM rush hours as of 3/13: 10%, 25%
> Increase in travel speeds during AM and PM rush hours as of 3/20: 14%, 43%
> Confirmed COVID-19 cases as of Apr. 8, 2020: 103.53 per 100,000 — 8th highest (total: 3,036)
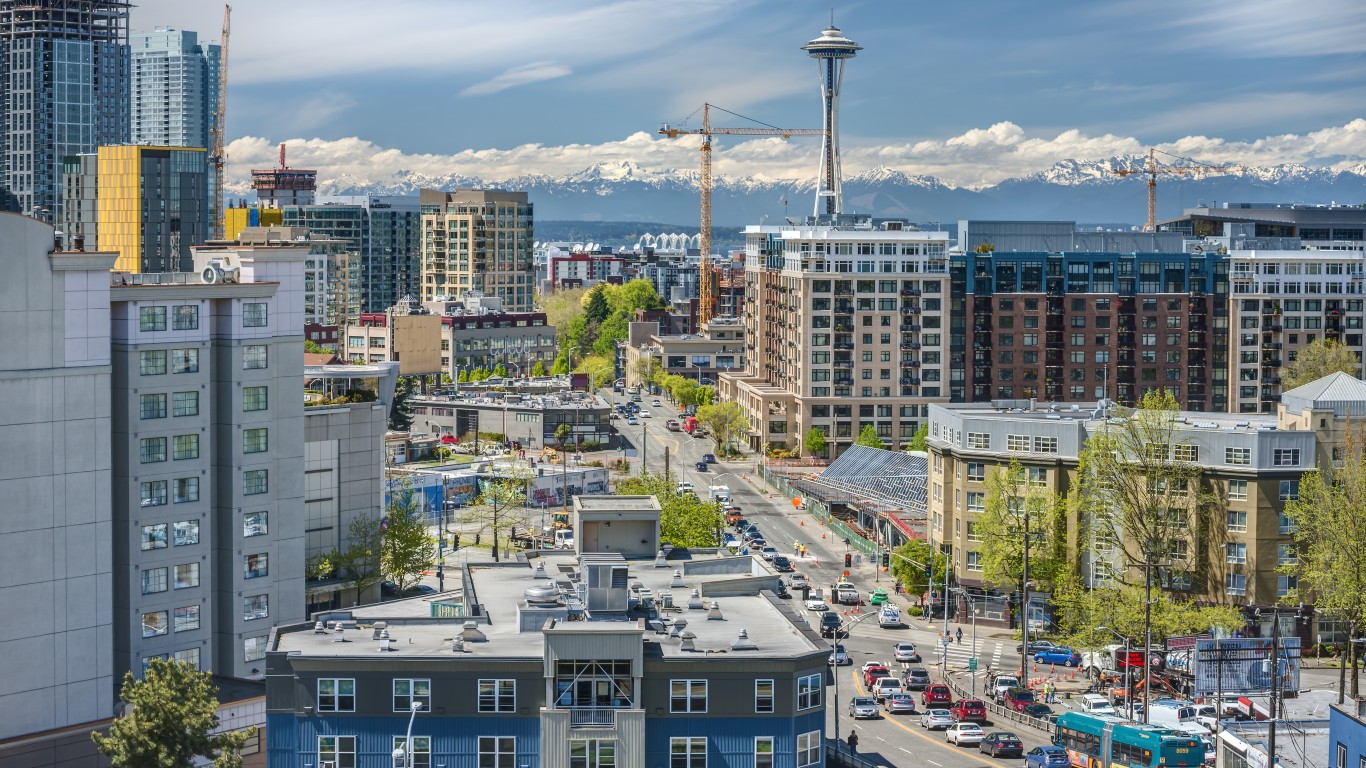
Source: RyanCSlimakPhoto / iStock via Getty Images
10. Seattle
> Vehicle miles traveled March 28 – April 3: 46% of normal
> Increase in travel speeds during AM and PM rush hours as of 3/13: 15%, 16%
> Increase in travel speeds during AM and PM rush hours as of 3/20: 23%, 38%
> Confirmed COVID-19 cases as of Apr. 8, 2020: 157.01 per 100,000 — 5th highest (total: 6,185)
[in-text-ad]
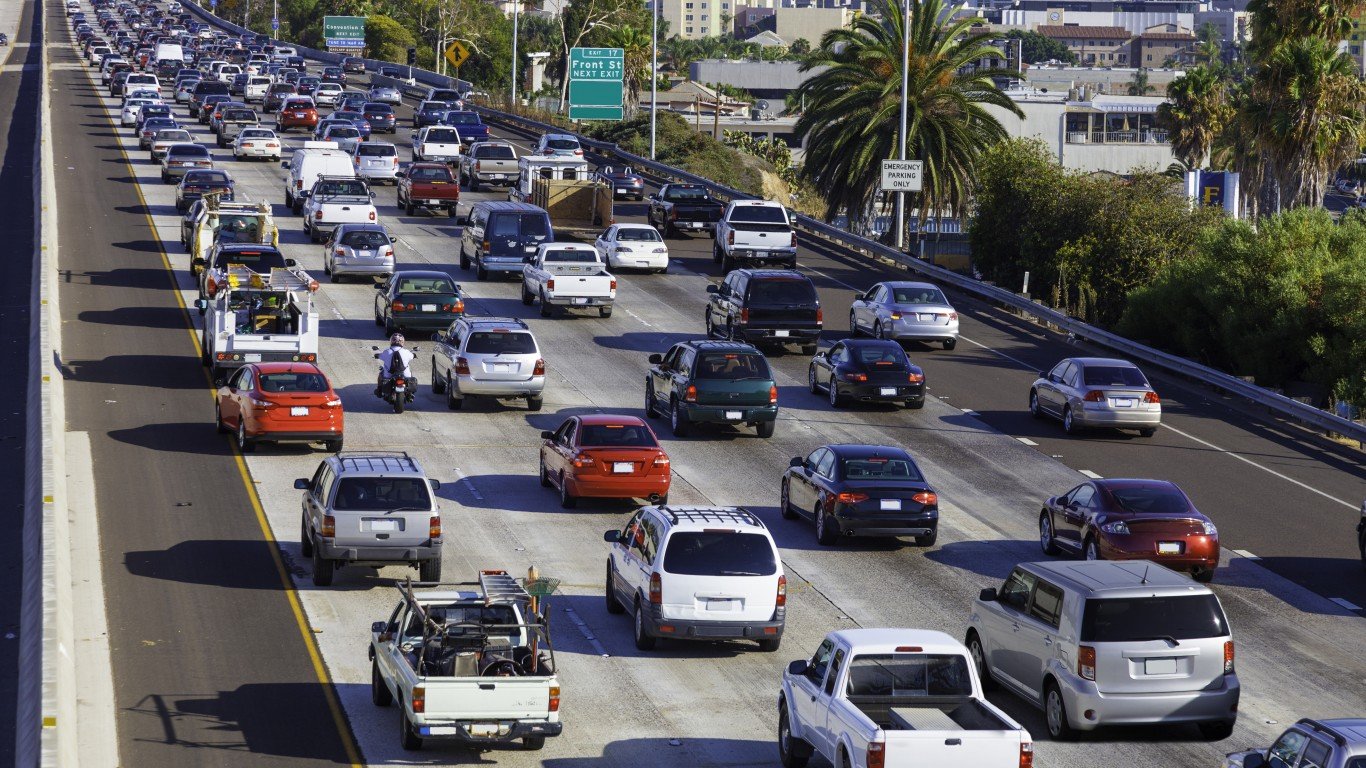
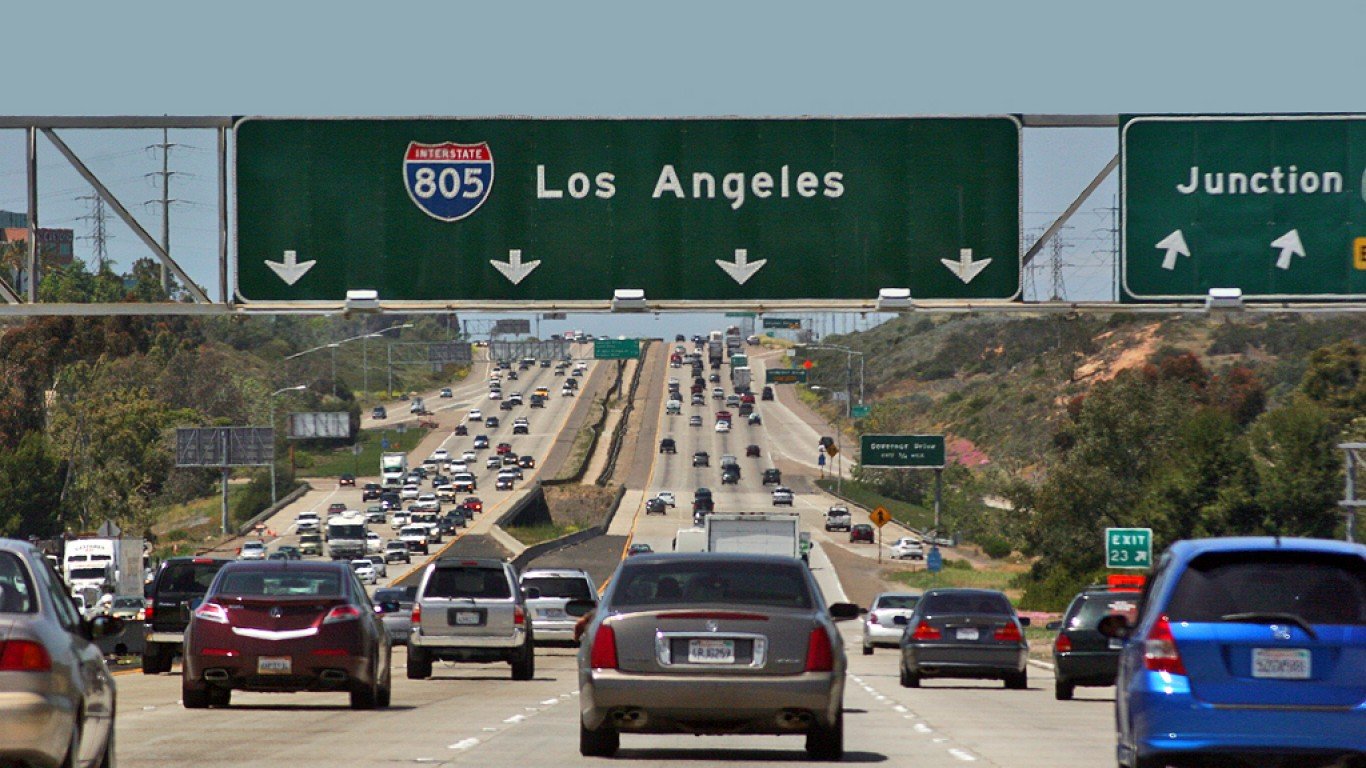
Source: Ron and Patty Thomas / iStock via Getty Images
9. San Diego
> Vehicle miles traveled March 28 – April 3: 44% of normal
> Increase in travel speeds during AM and PM rush hours as of 3/13: 0%, 7%
> Increase in travel speeds during AM and PM rush hours as of 3/20: 21%, 36%
> Confirmed COVID-19 cases as of Apr. 8, 2020: 45.76 per 100,000 — 7th lowest (total: 1,530)
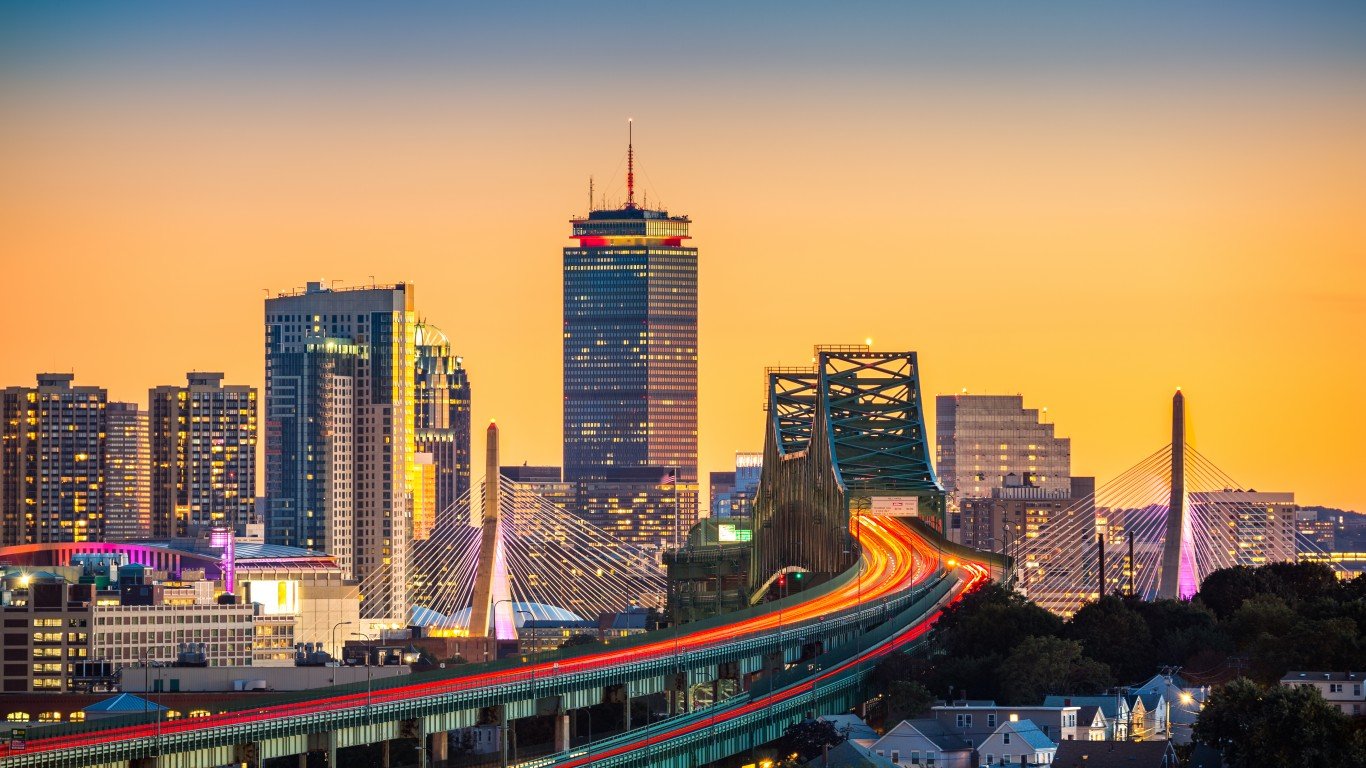
Source: MIHAI ANDRITOIU / iStock via Getty Images
8. Boston
> Vehicle miles traveled March 28 – April 3: 44% of normal
> Increase in travel speeds during AM and PM rush hours as of 3/13: 10%, 32%
> Increase in travel speeds during AM and PM rush hours as of 3/20: 25%, 57%
> Confirmed COVID-19 cases as of Apr. 8, 2020: 259.86 per 100,000 — 3rd highest (total: 12,669)
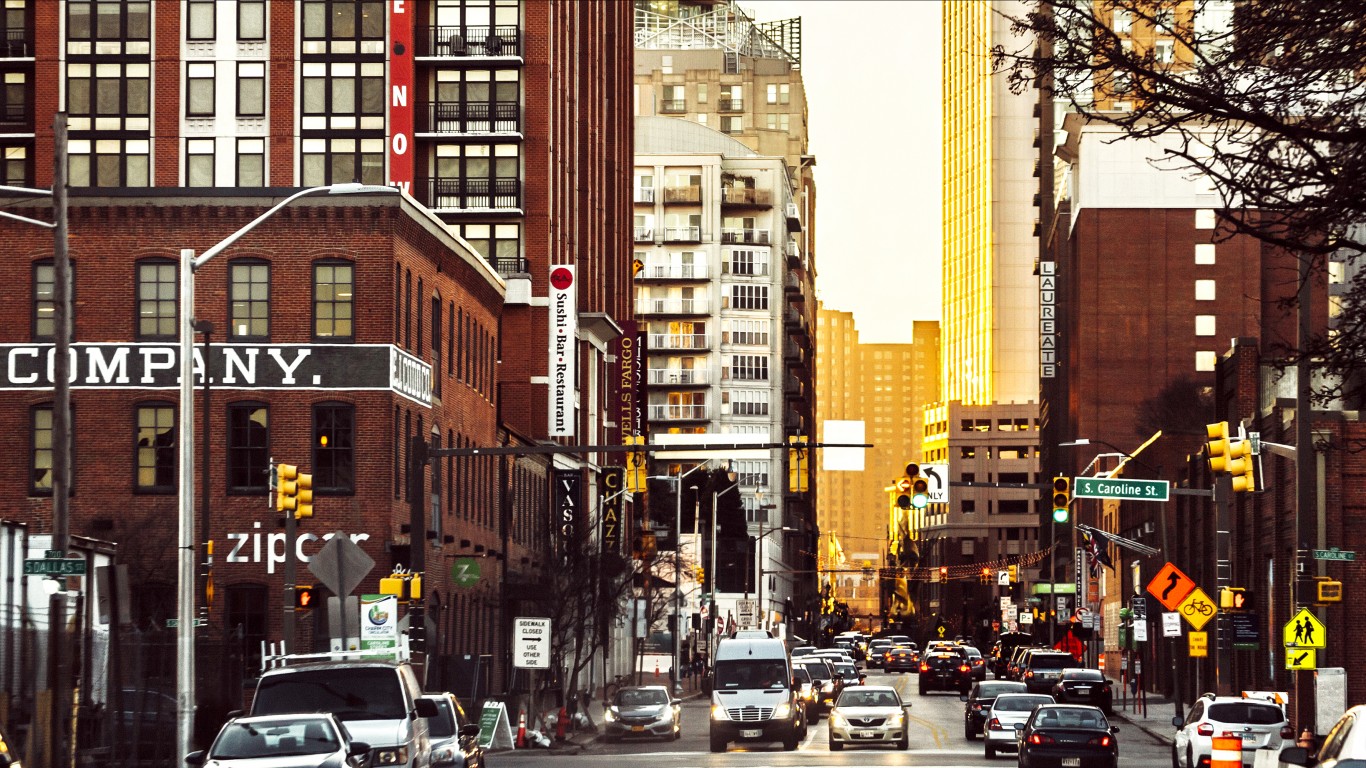
Source: Peeter Viisimaa / iStock via Getty Images
7. Baltimore
> Vehicle miles traveled March 28 – April 3: 42% of normal
> Increase in travel speeds during AM and PM rush hours as of 3/13: 5%, 20%
> Increase in travel speeds during AM and PM rush hours as of 3/20: 17%, 35%
> Confirmed COVID-19 cases as of Apr. 8, 2020: 87.95 per 100,000 — 10th highest (total: 2,465)
[in-text-ad-2]
Source: CHUYN / iStock via Getty Images
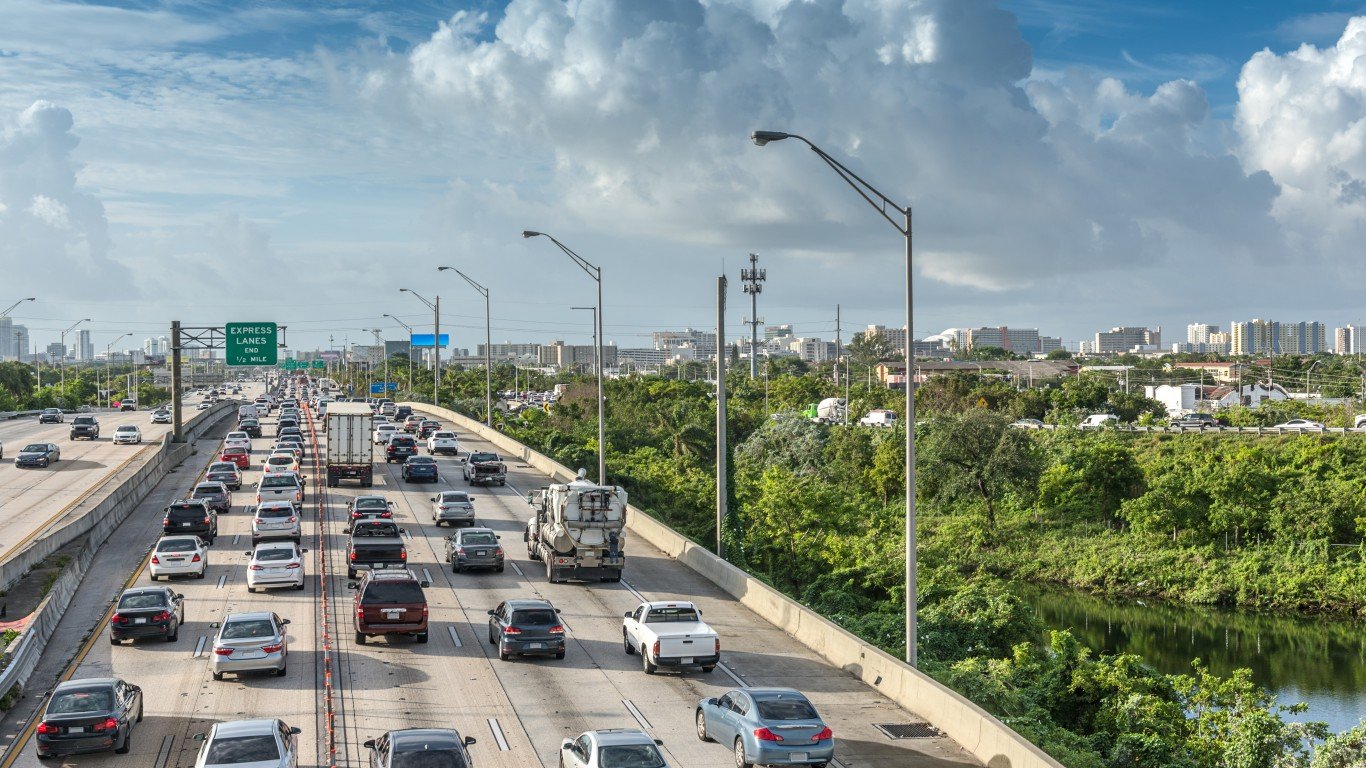
6. Miami
> Vehicle miles traveled March 28 – April 3: 42% of normal
> Increase in travel speeds during AM and PM rush hours as of 3/13: 11%, 27%
> Increase in travel speeds during AM and PM rush hours as of 3/20: 25%, 57%
> Confirmed COVID-19 cases as of Apr. 8, 2020: 145.95 per 100,000 — 7th highest (total: 9,047)
Source: peeterv / iStock via Getty Images
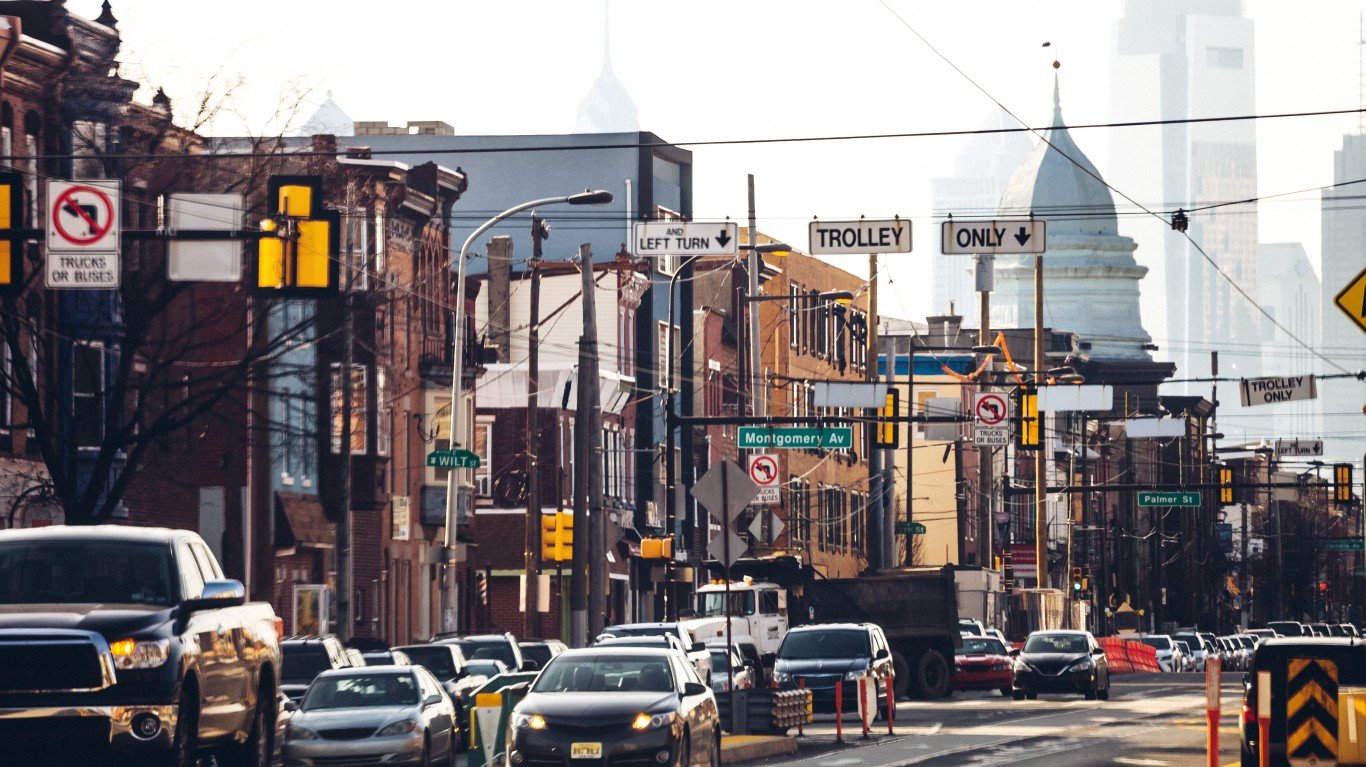
5. Philadelphia
> Vehicle miles traveled March 28 – April 3: 42% of normal
> Increase in travel speeds during AM and PM rush hours as of 3/13: 7%, 24%
> Increase in travel speeds during AM and PM rush hours as of 3/20: 24%, 38%
> Confirmed COVID-19 cases as of Apr. 8, 2020: 180.68 per 100,000 — 4th highest (total: 11,015)
[in-text-ad]
Source: Sean Pavone / iStock via Getty Images
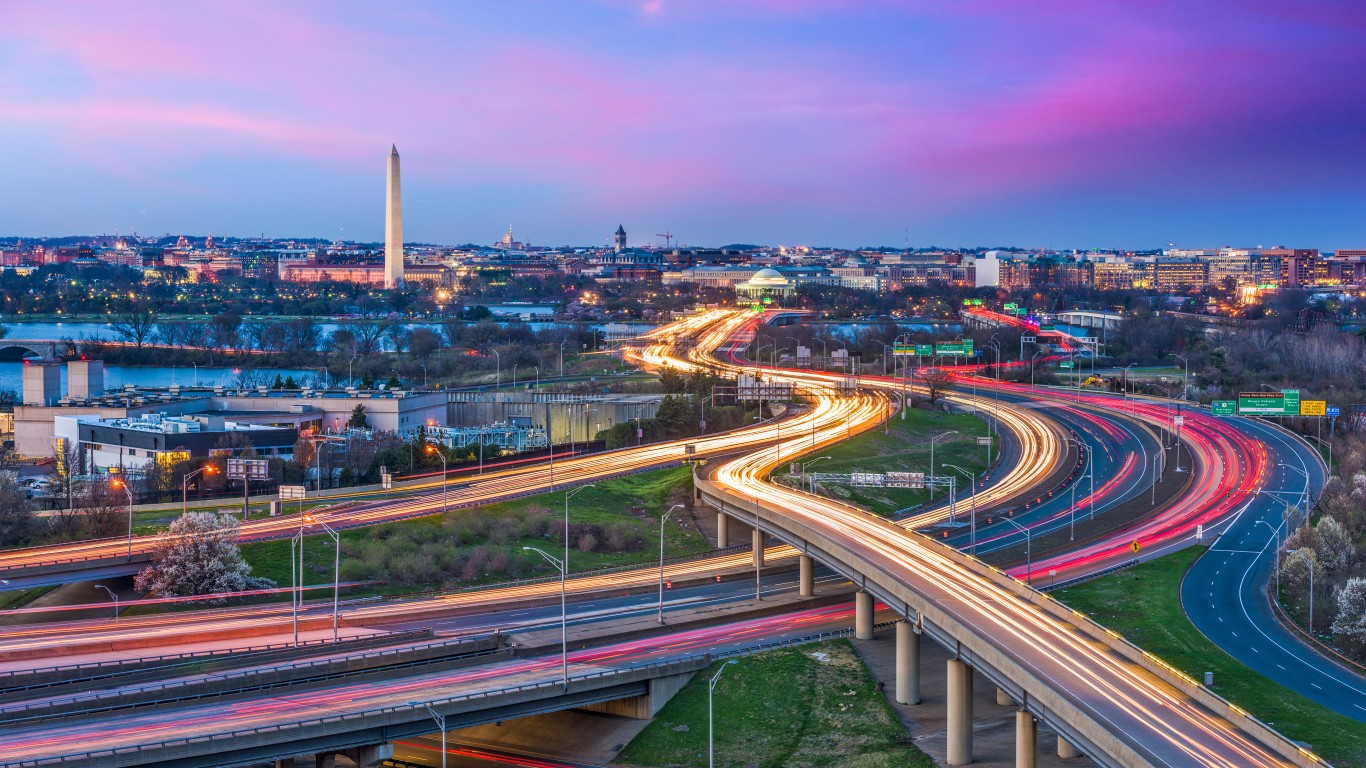
4. Washington DC
> Vehicle miles traveled March 28 – April 3: 41% of normal
> Increase in travel speeds during AM and PM rush hours as of 3/13: 6%, 32%
> Increase in travel speeds during AM and PM rush hours as of 3/20: 22%, 54%
> Confirmed COVID-19 cases as of Apr. 8, 2020: 94.64 per 100,000 — 9th highest (total: 5,916)
Source: MasaoTaira / iStock via Getty Images
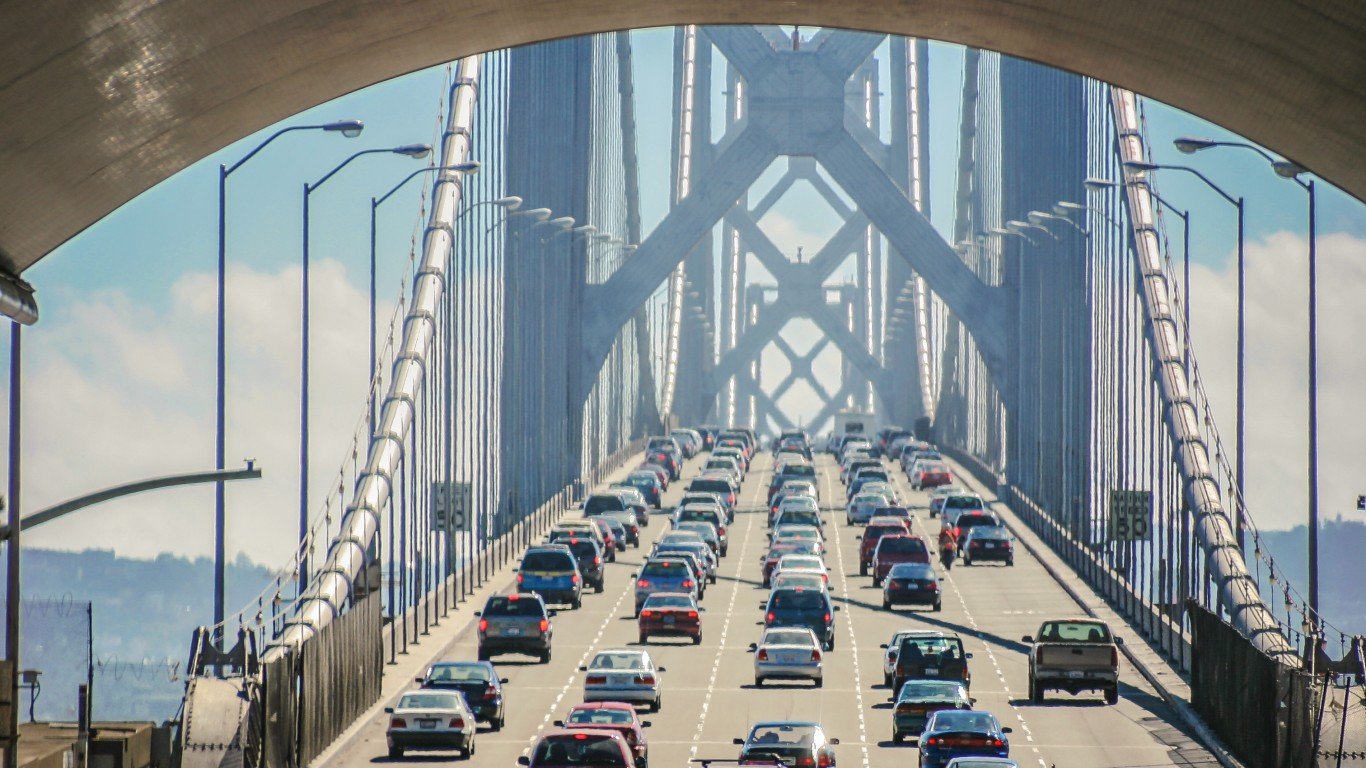
3. San Francisco
> Vehicle miles traveled March 28 – April 3: 39% of normal
> Increase in travel speeds during AM and PM rush hours as of 3/13: 17%, 29%
> Increase in travel speeds during AM and PM rush hours as of 3/20: 27%, 55%
> Confirmed COVID-19 cases as of Apr. 8, 2020: 55.02 per 100,000 — 10th lowest (total: 2,602)
Source: peeterv / iStock via Getty Images
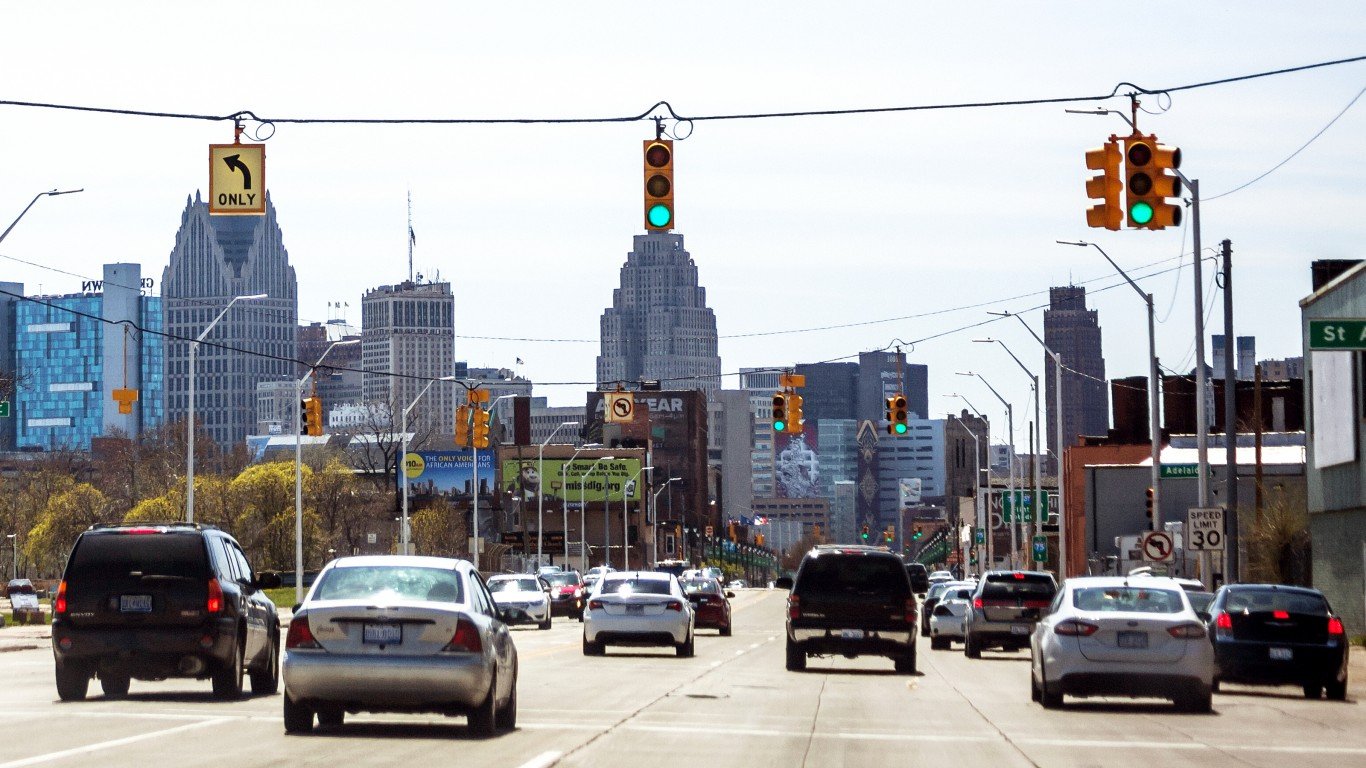
2. Detroit
> Vehicle miles traveled March 28 – April 3: 39% of normal
> Increase in travel speeds during AM and PM rush hours as of 3/13: 11%, 10%
> Increase in travel speeds during AM and PM rush hours as of 3/20: 18%, 23%
> Confirmed COVID-19 cases as of Apr. 8, 2020: 384.54 per 100,000 — 2nd highest (total: 16,637)
[in-text-ad-2]
Source: peeterv / iStock via Getty Images
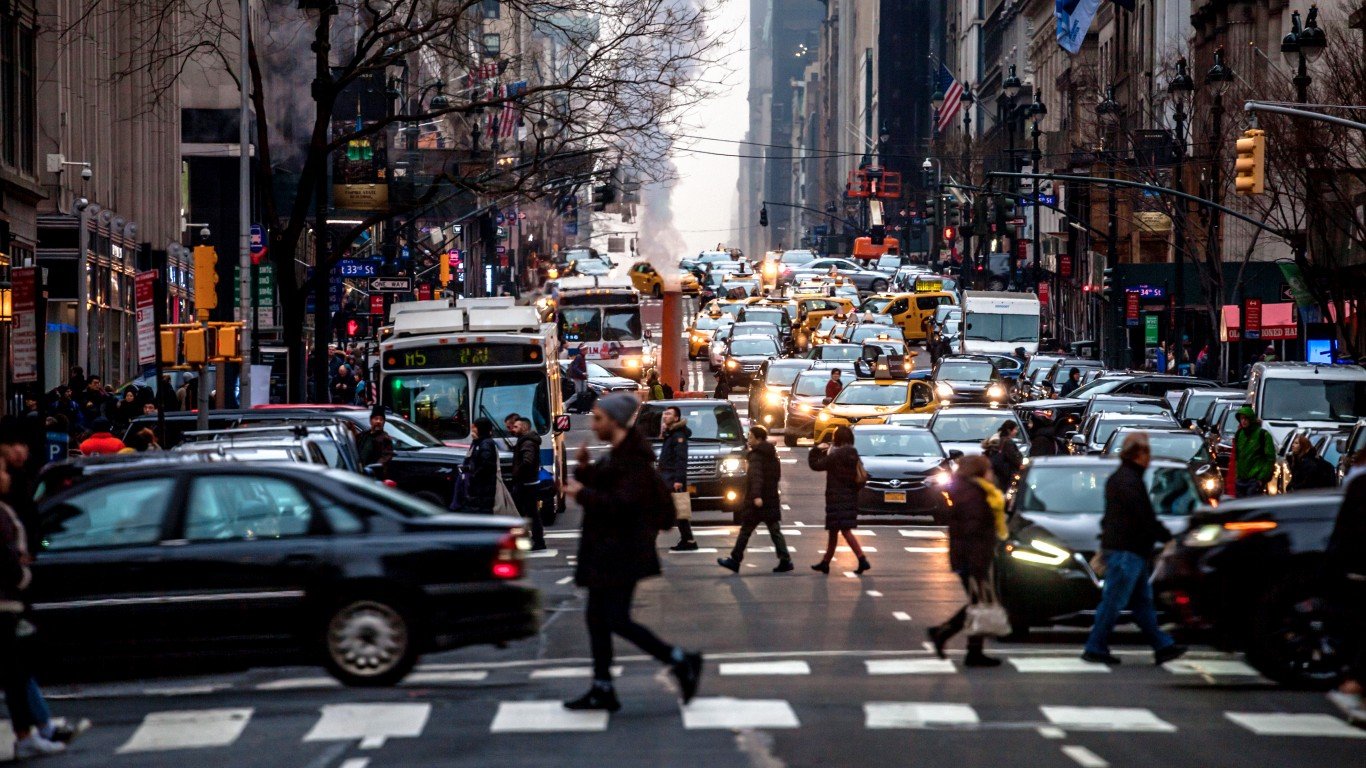
1. New York
> Vehicle miles traveled March 28 – April 3: 36% of normal
> Increase in travel speeds during AM and PM rush hours as of 3/13: 6%, 27%
> Increase in travel speeds during AM and PM rush hours as of 3/20: 39%, 54%
> Confirmed COVID-19 cases as of Apr. 8, 2020: 525.21 per 100,000 — the highest (total: 104,934)
Essential Tips for Investing: Sponsored
A financial advisor can help you understand the advantages and disadvantages of investment properties. Finding a qualified financial advisor doesn’t have to be hard. SmartAsset’s free tool matches you with up to three financial advisors who serve your area, and you can interview your advisor matches at no cost to decide which one is right for you. If you’re ready to find an advisor who can help you achieve your financial goals, get started now.
Investing in real estate can diversify your portfolio. But expanding your horizons may add additional costs. If you’re an investor looking to minimize expenses, consider checking out online brokerages. They often offer low investment fees, helping you maximize your profit.
Thank you for reading! Have some feedback for us?
Contact the 24/7 Wall St. editorial team.
Editors' Picks