
Over 700,000 cars were stolen in the United States in 2018, or 229 motor vehicle thefts for every 100,000 Americans. Those thefts disproportionately occurred in the nation’s urban areas. In some cities, the motor vehicle theft rate is well over 1,000 per 100,000 residents, and in nearly every state, there is at least one city with a higher rate than the national average.
24/7 Wall St. reviewed property crime data from the FBI’s 2018 Uniform Crime Report to identify the American cities with the highest motor vehicle theft rate — the number of car thefts per 100,000 residents — in every state. We considered all cities, towns, villages, and Census designated places home to at least 20,000 people in our analysis. Up-to-date crime data is not available at the municipality level in Iowa. The most stolen vehicle in the state came from data compiled by insurance analytics group, the National Insurance Crime Bureau, and is also for 2018.
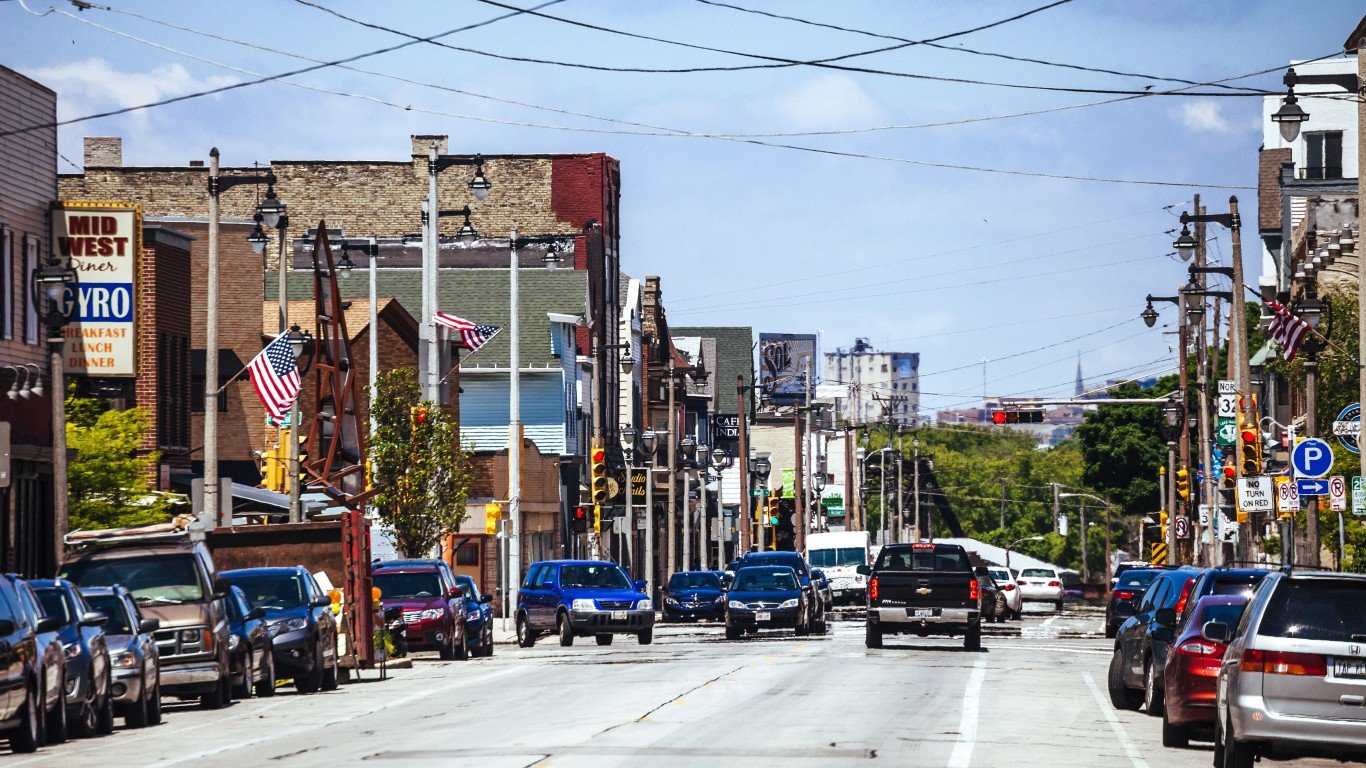
In general, the cities on this list with the highest motor vehicle theft rates — not just in their state, but nationwide — are in states with high auto theft rates. There are exceptions, though. Wisconsin has one of the lowest motor vehicle theft rates of any state at 149 thefts per 100,000 residents, but Milwaukee has over 770 motor vehicle thefts per 100,000 residents, one of the highest figures of any large city in the country.
To give more perspective on how much of a vehicle theft hot spot some of the cities on this list are, 12 cities accounted for more than 25% of the motor vehicle theft in their state for 2018, and five of the cities on this list accounted for more than half the auto theft in their respective states.
Motor vehicle theft, along with burglary and larceny, make up the broader property crime category as measured by law enforcement agencies and compiled by the FBI. Motor vehicle theft is the least common of the three. Still, many of the cities on this list also rank as having among the highest property crime rates in their state. These are the cities with the most property crime in every state.
Click here to see where you car is most likely to be stolen in every state
Source: Davel5957 / iStock via Getty Images
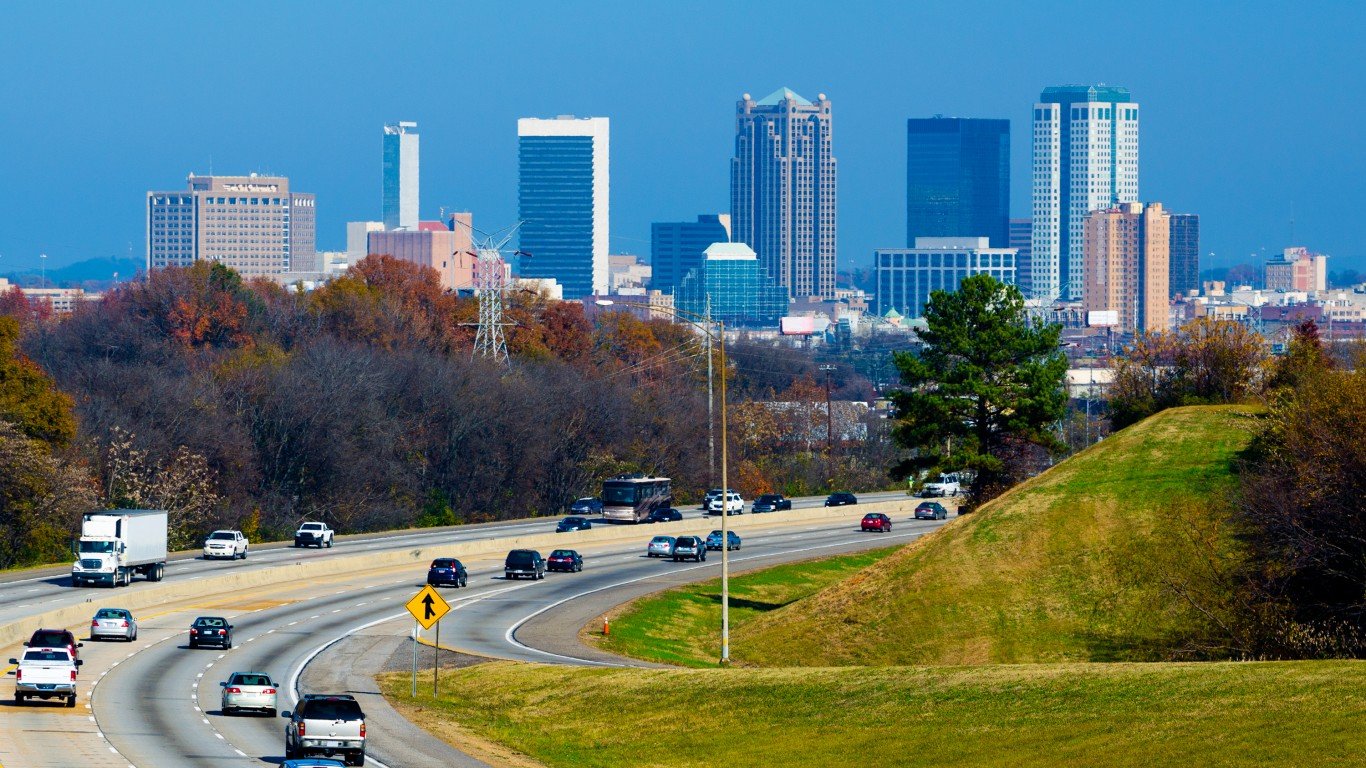
Alabama: Birmingham
> Vehicle theft rate, Birmingham (2018): 832 per 100,000 residents
> Vehicle theft rate, Alabama (2018): 268 per 100,000 residents
> Total vehicles stolen, Birmingham (2018): 1,752
> Total vehicles stolen, Alabama (2018): 13,112
> Property crime rate, Birmingham (2018): 6,314 per 100,000 residents
> Property crime rate, Alabama (2018): 2,817 per 100,000 residents
> Most stolen vehicle, Alabama (2018): Chevrolet Pickup
[in-text-ad]
Source: carterdayne / iStock Unreleased via Getty Images
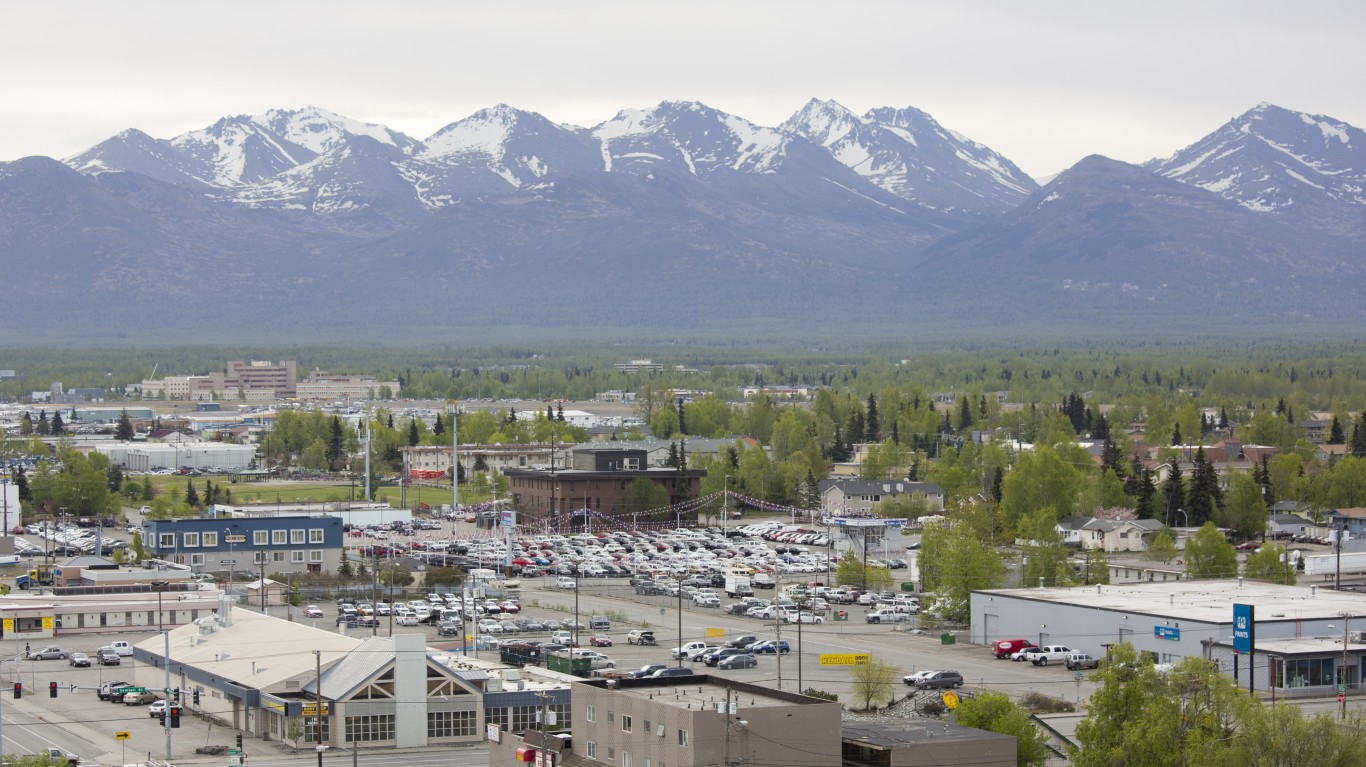
Alaska: Anchorage
> Vehicle theft rate, Anchorage (2018): 967 per 100,000 residents
> Vehicle theft rate, Alaska (2018): 542 per 100,000 residents
> Total vehicles stolen, Anchorage (2018): 2,823
> Total vehicles stolen, Alaska (2018): 3,996
> Property crime rate, Anchorage (2018): 4,928 per 100,000 residents
> Property crime rate, Alaska (2018): 3,301 per 100,000 residents
> Most stolen vehicle, Alaska (2018): Chevrolet Pickup

Source: dszc / E+ via Getty Images
Arizona: Tucson
> Vehicle theft rate, Tucson (2018): 478 per 100,000 residents
> Vehicle theft rate, Arizona (2018): 267 per 100,000 residents
> Total vehicles stolen, Tucson (2018): 2,568
> Total vehicles stolen, Arizona (2018): 19,139
> Property crime rate, Tucson (2018): 4,954 per 100,000 residents
> Property crime rate, Arizona (2018): 2,677 per 100,000 residents
> Most stolen vehicle, Arizona (2018): Chevrolet Pickup
Source: csfotoimages / iStock Editorial via Getty Images
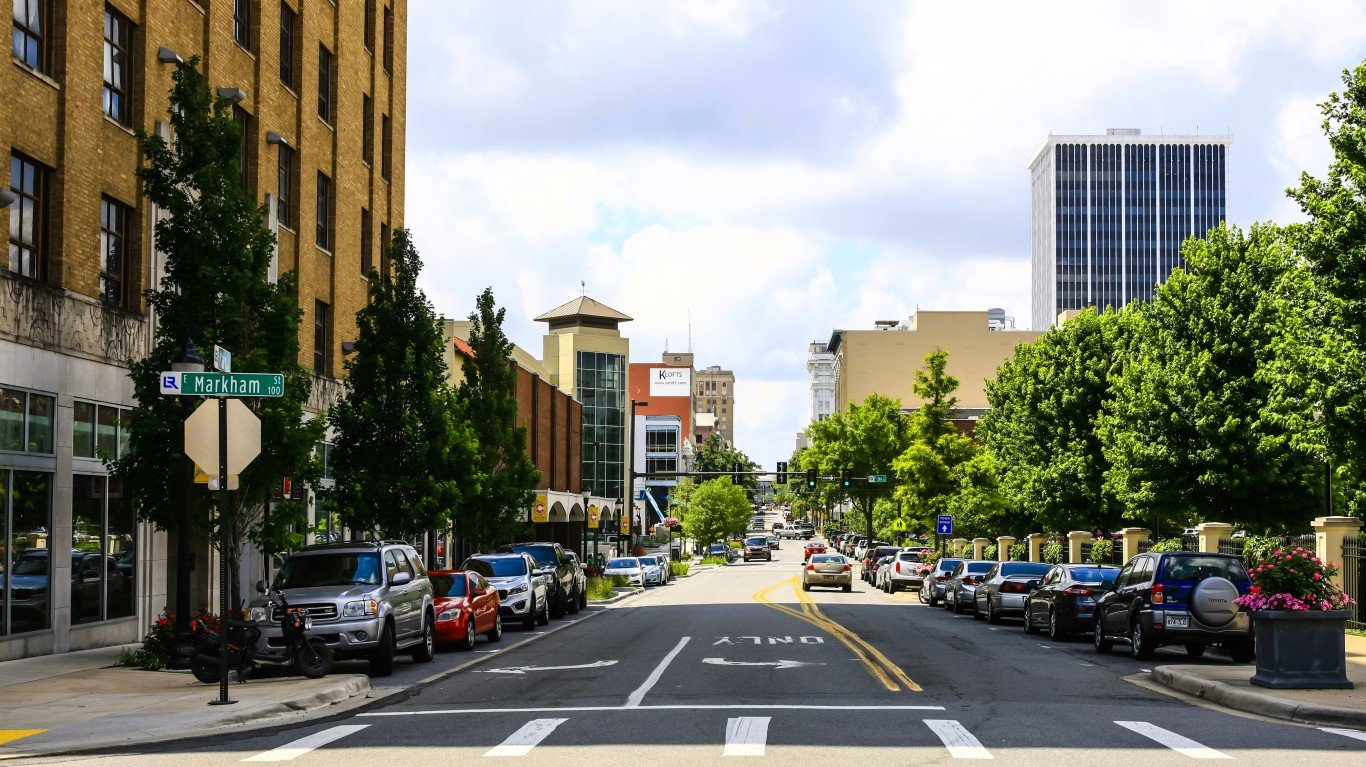
Arkansas: Little Rock
> Vehicle theft rate, Little Rock (2018): 562 per 100,000 residents
> Vehicle theft rate, Arkansas (2018): 236 per 100,000 residents
> Total vehicles stolen, Little Rock (2018): 1,120
> Total vehicles stolen, Arkansas (2018): 7,113
> Property crime rate, Little Rock (2018): 6,548 per 100,000 residents
> Property crime rate, Arkansas (2018): 2,913 per 100,000 residents
> Most stolen vehicle, Arkansas (2018): Chevrolet Pickup
[in-text-ad-2]
Source: Andrei Stanescu / iStock Editorial via Getty Images
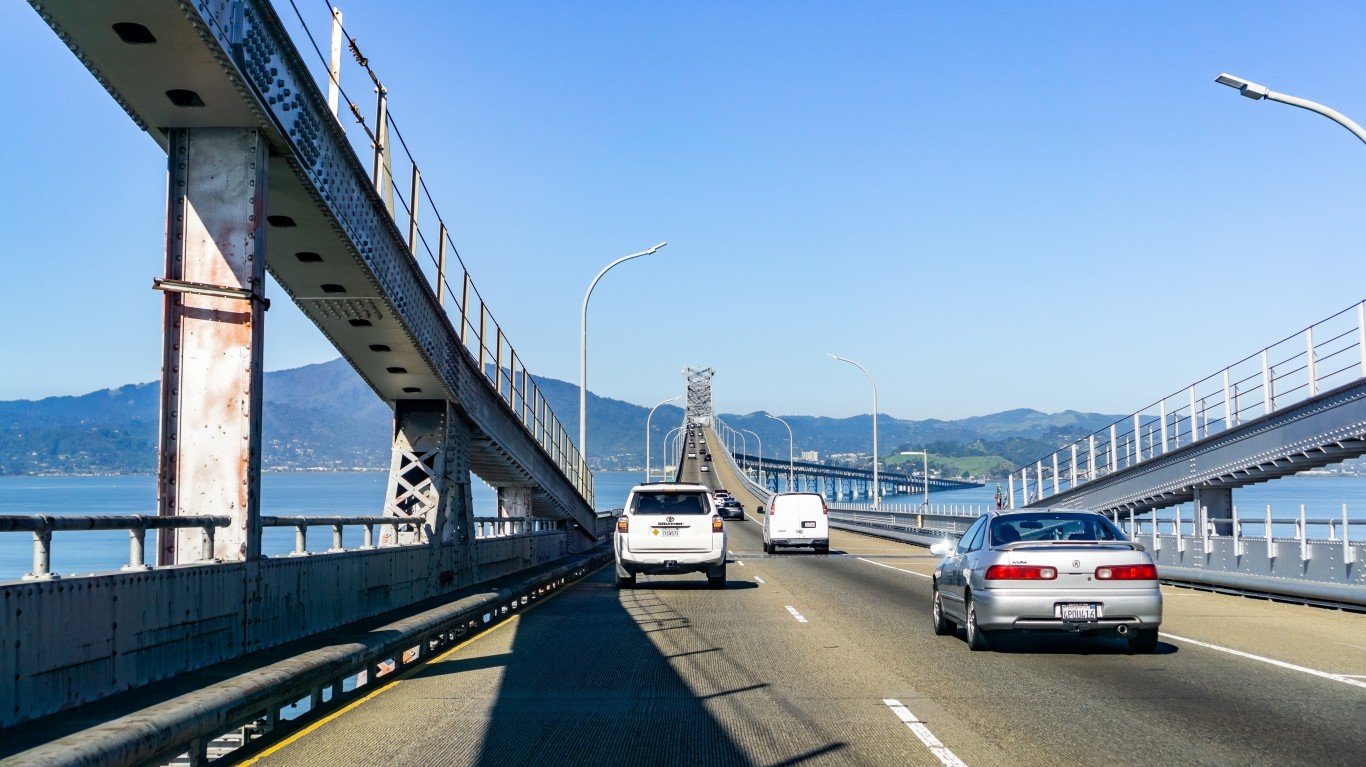
California: Richmond
> Vehicle theft rate, Richmond (2018): 1,518 per 100,000 residents
> Vehicle theft rate, California (2018): 392 per 100,000 residents
> Total vehicles stolen, Richmond (2018): 1,685
> Total vehicles stolen, California (2018): 155,211
> Property crime rate, Richmond (2018): 3,922 per 100,000 residents
> Property crime rate, California (2018): 2,380 per 100,000 residents
> Most stolen vehicle, California (2018): Honda Civic
Source: raksyBH / iStock Editorial via Getty Images
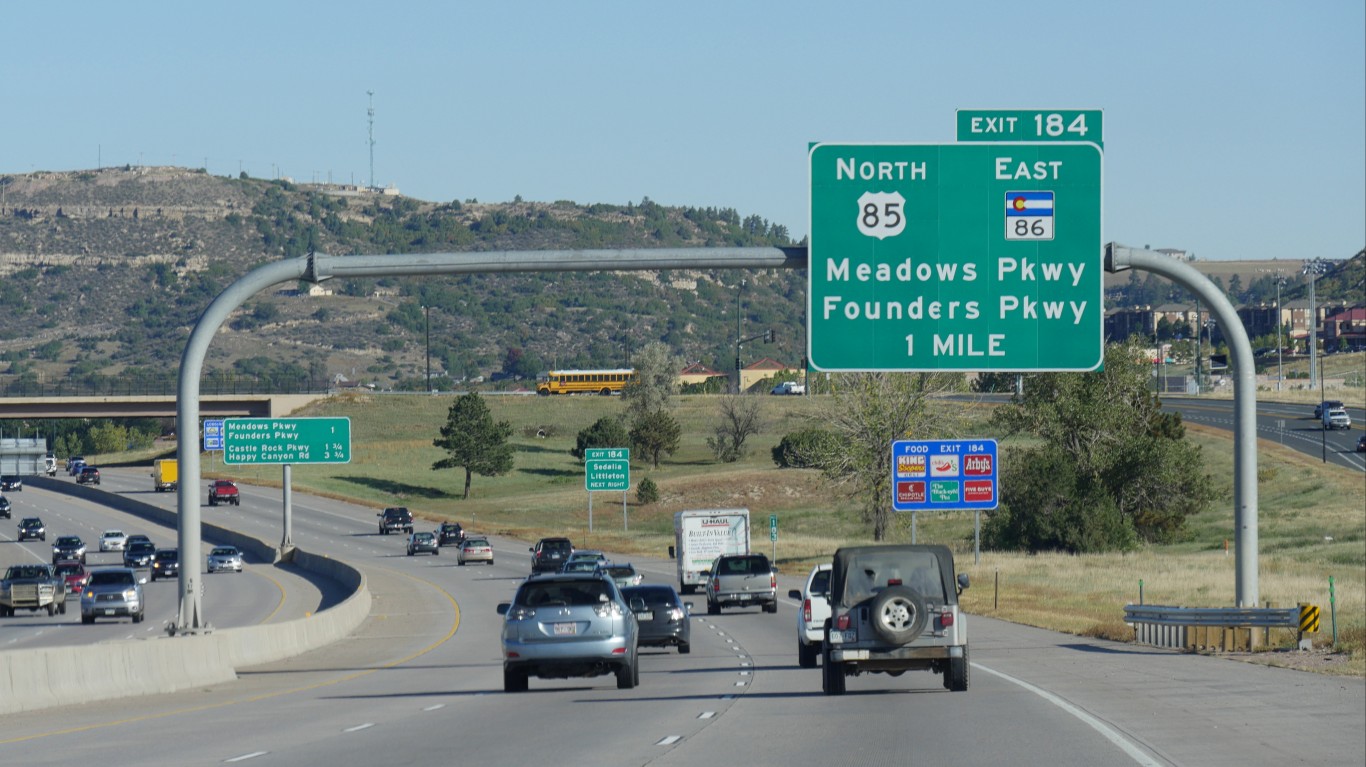
Colorado: Pueblo
> Vehicle theft rate, Pueblo (2018): 948 per 100,000 residents
> Vehicle theft rate, Colorado (2018): 381 per 100,000 residents
> Total vehicles stolen, Pueblo (2018): 1,060
> Total vehicles stolen, Colorado (2018): 21,673
> Property crime rate, Pueblo (2018): 5,576 per 100,000 residents
> Property crime rate, Colorado (2018): 2,672 per 100,000 residents
> Most stolen vehicle, Colorado (2018): Ford Pickup
[in-text-ad]

Connecticut: Waterbury
> Vehicle theft rate, Waterbury (2018): 773 per 100,000 residents
> Vehicle theft rate, Connecticut (2018): 207 per 100,000 residents
> Total vehicles stolen, Waterbury (2018): 838
> Total vehicles stolen, Connecticut (2018): 7,383
> Property crime rate, Waterbury (2018): 3,923 per 100,000 residents
> Property crime rate, Connecticut (2018): 1,681 per 100,000 residents
> Most stolen vehicle, Connecticut (2018): Honda Civic
 24/7 Wall St.
Delaware: Wilmington
> Vehicle theft rate, Wilmington (2018): 635 per 100,000 residents
> Vehicle theft rate, Delaware (2018): 153 per 100,000 residents
> Total vehicles stolen, Wilmington (2018): 452
> Total vehicles stolen, Delaware (2018): 1,476
> Property crime rate, Wilmington (2018): 4,922 per 100,000 residents
> Property crime rate, Delaware (2018): 2,324 per 100,000 residents
> Most stolen vehicle, Delaware (2018): Honda Accord

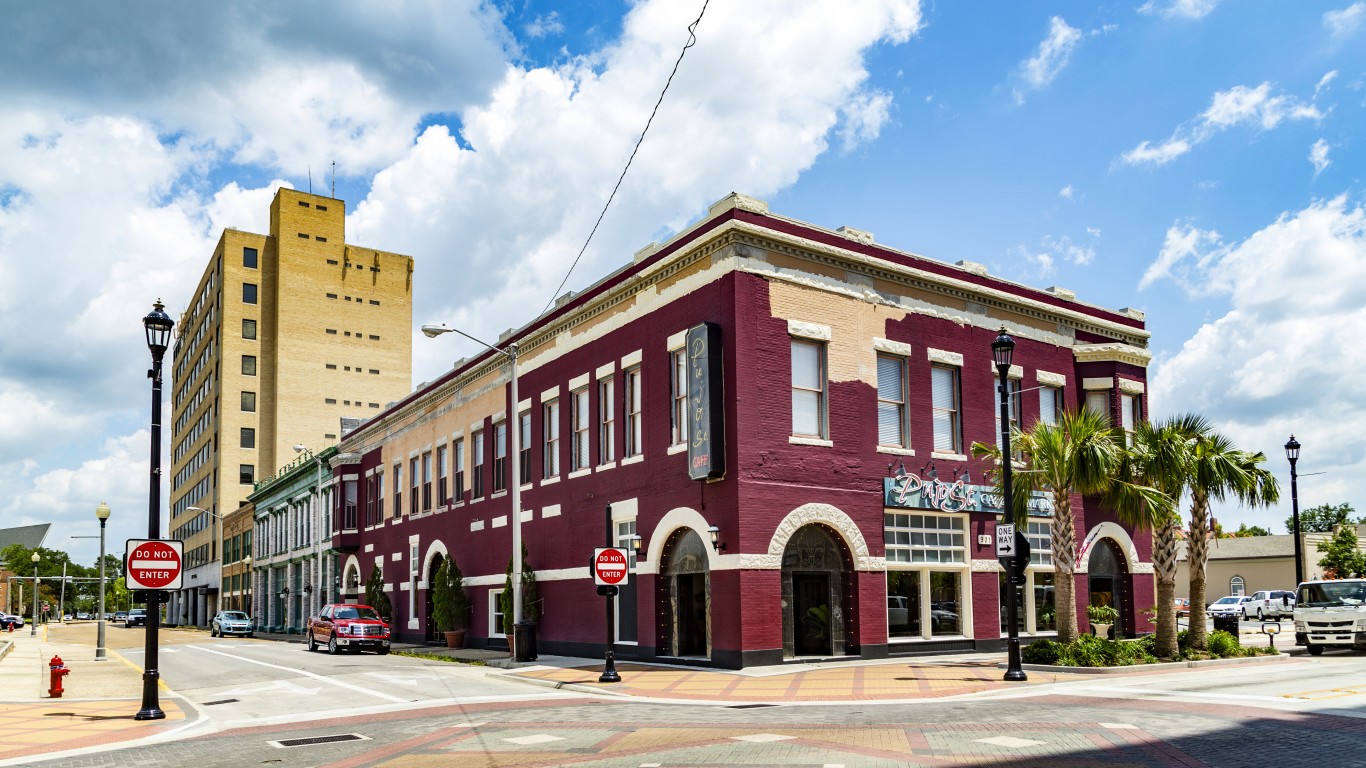
Florida: Panama City
> Vehicle theft rate, Panama City (2018): 697 per 100,000 residents
> Vehicle theft rate, Florida (2018): 193 per 100,000 residents
> Total vehicles stolen, Panama City (2018): 260
> Total vehicles stolen, Florida (2018): 41,165
> Property crime rate, Panama City (2018): 5,761 per 100,000 residents
> Property crime rate, Florida (2018): 2,282 per 100,000 residents
> Most stolen vehicle, Florida (2018): Ford Pickup
[in-text-ad-2]
Source: Meinzahn / iStock Editorial via Getty Images
Georgia: East Point
> Vehicle theft rate, East Point (2018): 1,646 per 100,000 residents
> Vehicle theft rate, Georgia (2018): 235 per 100,000 residents
> Total vehicles stolen, East Point (2018): 584
> Total vehicles stolen, Georgia (2018): 24,760
> Property crime rate, East Point (2018): 12,005 per 100,000 residents
> Property crime rate, Georgia (2018): 2,574 per 100,000 residents
> Most stolen vehicle, Georgia (2018): Ford Pickup

Source: Art Wager / E+ via Getty Images
Hawaii: Honolulu
> Vehicle theft rate, Honolulu (2018): 427 per 100,000 residents
> Vehicle theft rate, Hawaii (2018): 398 per 100,000 residents
> Total vehicles stolen, Honolulu (2018): 4,191
> Total vehicles stolen, Hawaii (2018): 5,649
> Property crime rate, Honolulu (2018): 2,941 per 100,000 residents
> Property crime rate, Hawaii (2018): 2,870 per 100,000 residents
> Most stolen vehicle, Hawaii (2018): Honda Civic
[in-text-ad]
Source: library_of_congress / Flickr
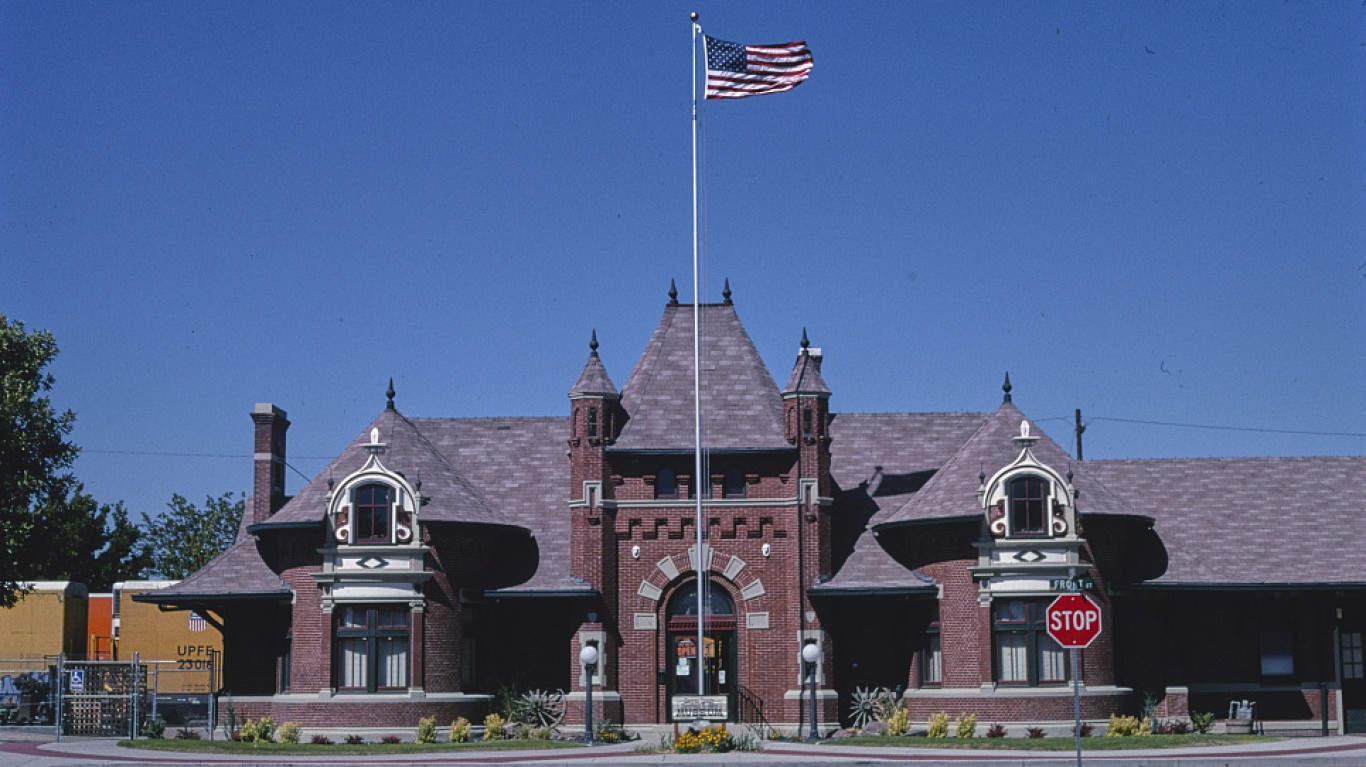
Idaho: Nampa
> Vehicle theft rate, Nampa (2018): 267 per 100,000 residents
> Vehicle theft rate, Idaho (2018): 112 per 100,000 residents
> Total vehicles stolen, Nampa (2018): 255
> Total vehicles stolen, Idaho (2018): 1,964
> Property crime rate, Nampa (2018): 2,541 per 100,000 residents
> Property crime rate, Idaho (2018): 1,461 per 100,000 residents
> Most stolen vehicle, Idaho (2018): Ford Pickup
Source: stevegeer / iStock Unreleased via Getty Images
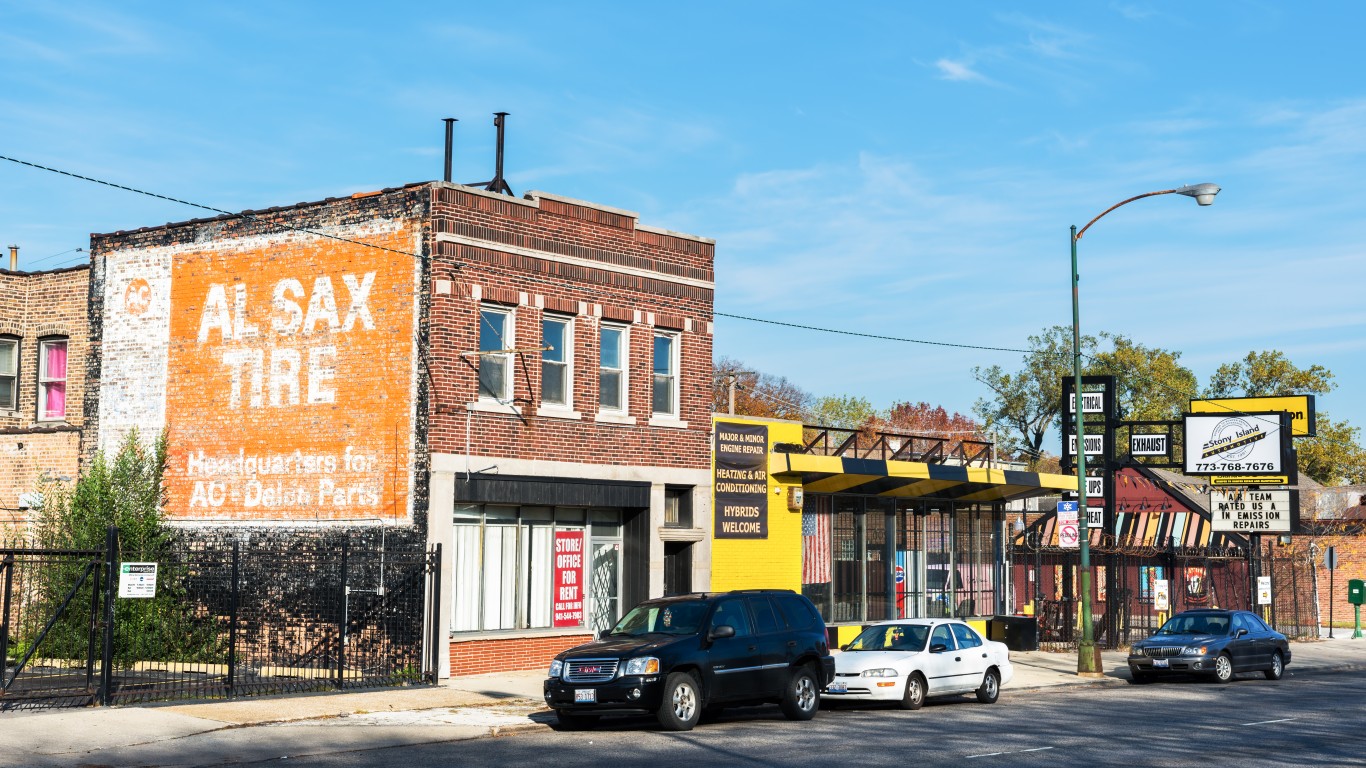
Illinois: Calumet City
> Vehicle theft rate, Calumet City (2018): 517 per 100,000 residents
> Vehicle theft rate, Illinois (2018): 154 per 100,000 residents
> Total vehicles stolen, Calumet City (2018): 189
> Total vehicles stolen, Illinois (2018): 19,593
> Property crime rate, Calumet City (2018): 2,681 per 100,000 residents
> Property crime rate, Illinois (2018): 1,933 per 100,000 residents
> Most stolen vehicle, Illinois (2018): Chevrolet Impala

Indiana: Muncie
> Vehicle theft rate, Muncie (2018): 643 per 100,000 residents
> Vehicle theft rate, Indiana (2018): 229 per 100,000 residents
> Total vehicles stolen, Muncie (2018): 440
> Total vehicles stolen, Indiana (2018): 15,328
> Property crime rate, Muncie (2018): 3,335 per 100,000 residents
> Property crime rate, Indiana (2018): 2,179 per 100,000 residents
> Most stolen vehicle, Indiana (2018): Ford Pickup
[in-text-ad-2]
Source: Davel5957 / iStock via Getty Images
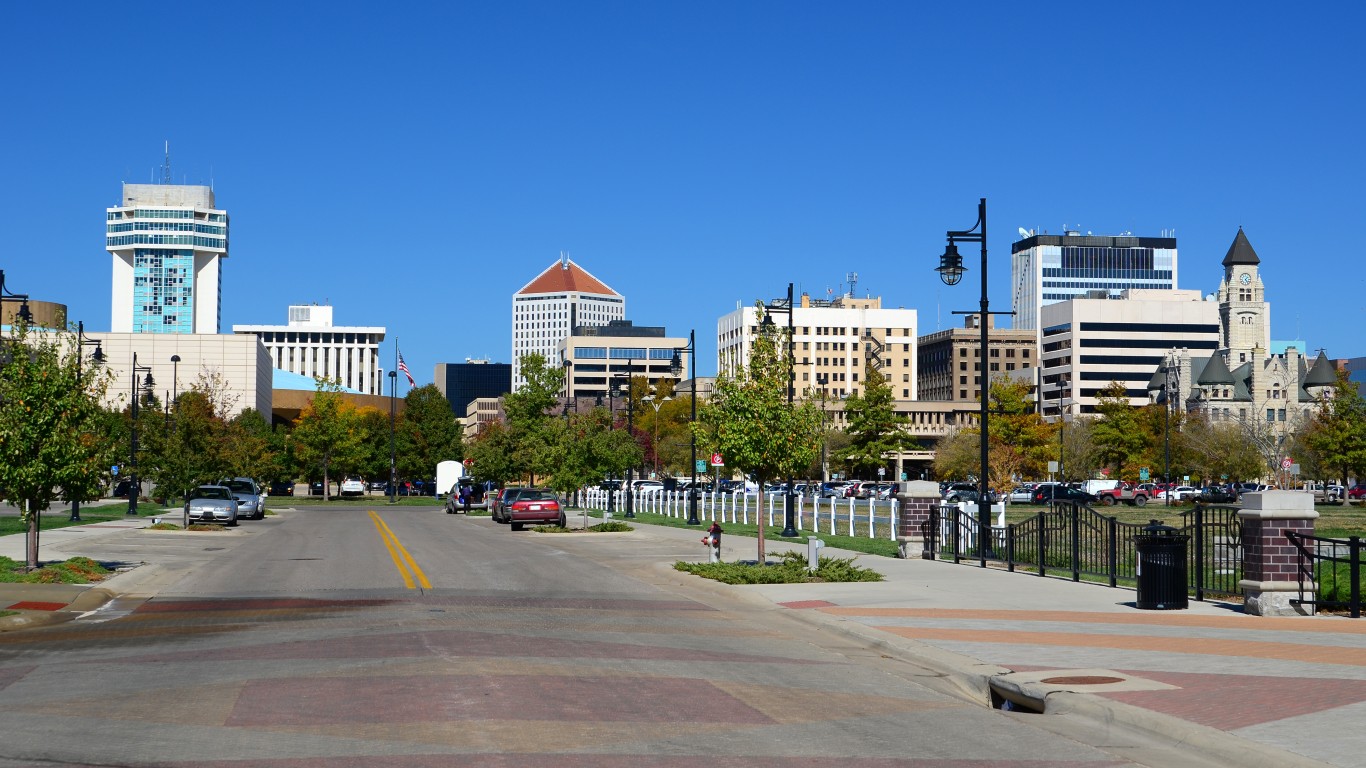
Kansas: Wichita
> Vehicle theft rate, Wichita (2018): 708 per 100,000 residents
> Vehicle theft rate, Kansas (2018): 269 per 100,000 residents
> Total vehicles stolen, Wichita (2018): 2,773
> Total vehicles stolen, Kansas (2018): 7,844
> Property crime rate, Wichita (2018): 5,619 per 100,000 residents
> Property crime rate, Kansas (2018): 2,634 per 100,000 residents
> Most stolen vehicle, Kansas (2018): Ford Pickup

Kentucky: Owensboro
> Vehicle theft rate, Owensboro (2018): 402 per 100,000 residents
> Vehicle theft rate, Kentucky (2018): 230 per 100,000 residents
> Total vehicles stolen, Owensboro (2018): 240
> Total vehicles stolen, Kentucky (2018): 10,261
> Property crime rate, Owensboro (2018): 4,420 per 100,000 residents
> Property crime rate, Kentucky (2018): 1,963 per 100,000 residents
> Most stolen vehicle, Kentucky (2018): Chevrolet Pickup
[in-text-ad]

Source: Photoservice / iStock Editorial via Getty Images
Louisiana: New Orleans
> Vehicle theft rate, New Orleans (2018): 755 per 100,000 residents
> Vehicle theft rate, Louisiana (2018): 248 per 100,000 residents
> Total vehicles stolen, New Orleans (2018): 2,994
> Total vehicles stolen, Louisiana (2018): 11,536
> Property crime rate, New Orleans (2018): 4,557 per 100,000 residents
> Property crime rate, Louisiana (2018): 3,276 per 100,000 residents
> Most stolen vehicle, Louisiana (2018): Ford Pickup
Source: traveler1116 / iStock Unreleased via Getty Images
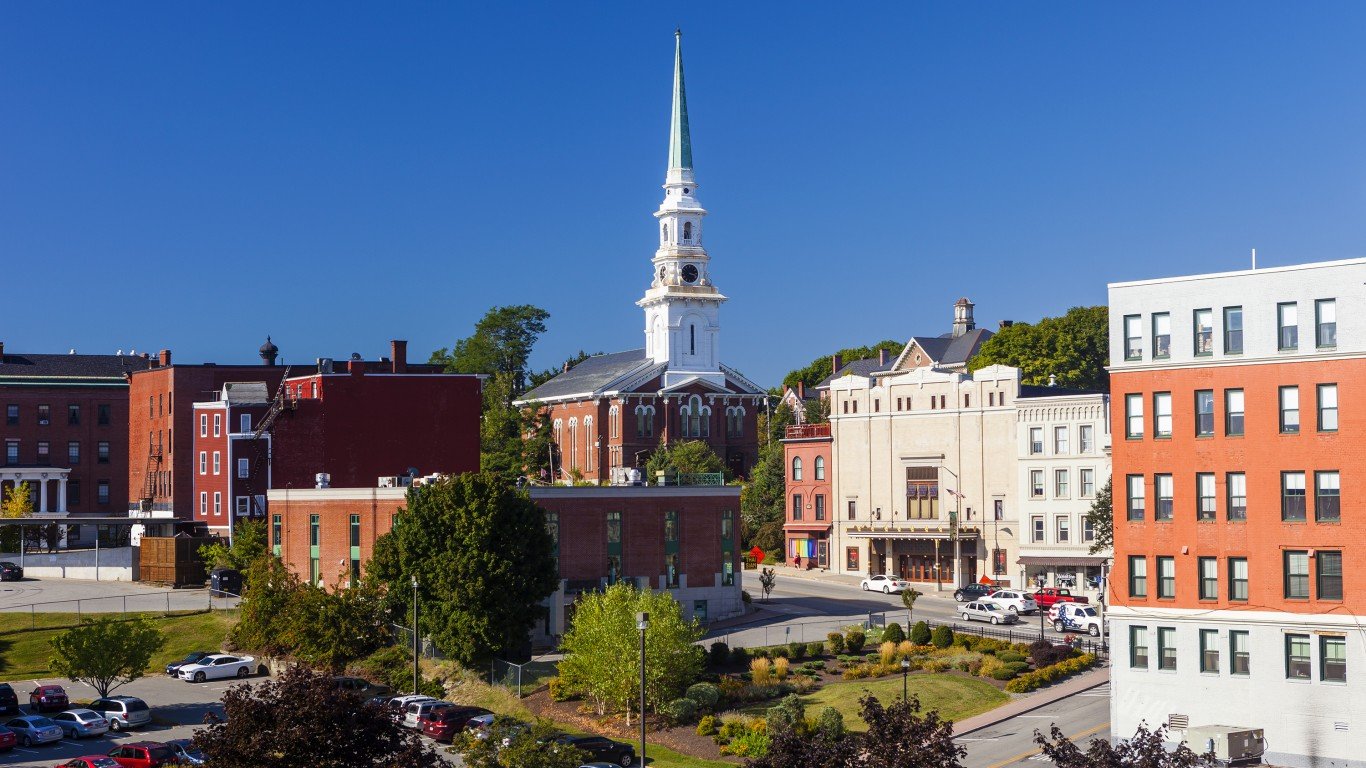
Maine: Bangor
> Vehicle theft rate, Bangor (2018): 189 per 100,000 residents
> Vehicle theft rate, Maine (2018): 58 per 100,000 residents
> Total vehicles stolen, Bangor (2018): 60
> Total vehicles stolen, Maine (2018): 777
> Property crime rate, Bangor (2018): 4,095 per 100,000 residents
> Property crime rate, Maine (2018): 1,358 per 100,000 residents
> Most stolen vehicle, Maine (2018): Chevrolet Pickup

Source: peeterv / iStock via Getty Images
Maryland: Baltimore
> Vehicle theft rate, Baltimore (2018): 723 per 100,000 residents
> Vehicle theft rate, Maryland (2018): 201 per 100,000 residents
> Total vehicles stolen, Baltimore (2018): 4,375
> Total vehicles stolen, Maryland (2018): 12,137
> Property crime rate, Baltimore (2018): 4,495 per 100,000 residents
> Property crime rate, Maryland (2018): 2,033 per 100,000 residents
> Most stolen vehicle, Maryland (2018): Honda Accord
[in-text-ad-2]
Source: DenisTangneyJr / iStock Unreleased via Getty Images
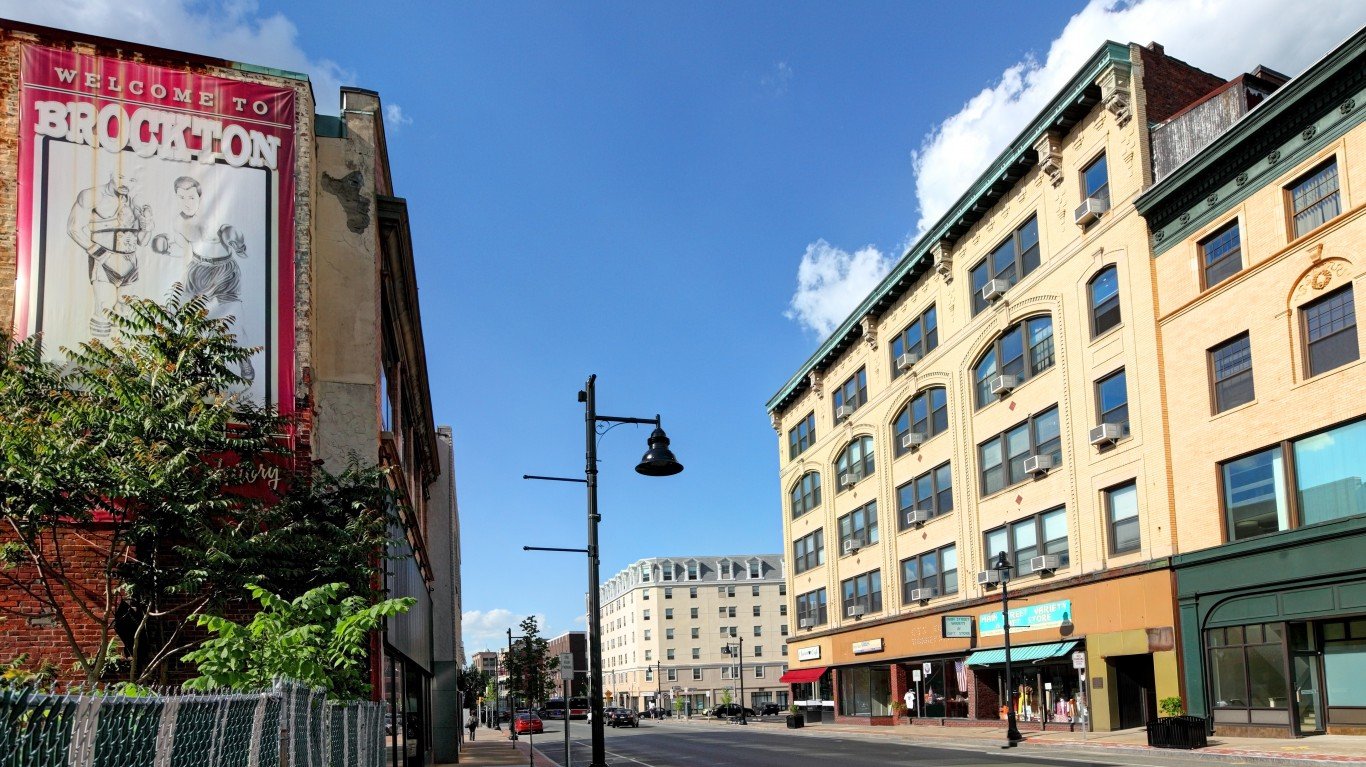
Massachusetts: Brockton
> Vehicle theft rate, Brockton (2018): 321 per 100,000 residents
> Vehicle theft rate, Massachusetts (2018): 96 per 100,000 residents
> Total vehicles stolen, Brockton (2018): 308
> Total vehicles stolen, Massachusetts (2018): 6,606
> Property crime rate, Brockton (2018): 2,159 per 100,000 residents
> Property crime rate, Massachusetts (2018): 1,263 per 100,000 residents
> Most stolen vehicle, Massachusetts (2018): Honda Accord

Source: Steven_Kriemadis / iStock via Getty Images
Michigan: Detroit
> Vehicle theft rate, Detroit (2018): 961 per 100,000 residents
> Vehicle theft rate, Michigan (2018): 175 per 100,000 residents
> Total vehicles stolen, Detroit (2018): 6,454
> Total vehicles stolen, Michigan (2018): 17,451
> Property crime rate, Detroit (2018): 4,305 per 100,000 residents
> Property crime rate, Michigan (2018): 1,654 per 100,000 residents
> Most stolen vehicle, Michigan (2018): Chevrolet Impala
[in-text-ad]

Source: Davel5957 / iStock via Getty Images
Minnesota: St. Paul
> Vehicle theft rate, St. Paul (2018): 741 per 100,000 residents
> Vehicle theft rate, Minnesota (2018): 181 per 100,000 residents
> Total vehicles stolen, St. Paul (2018): 2,296
> Total vehicles stolen, Minnesota (2018): 10,128
> Property crime rate, St. Paul (2018): 3,255 per 100,000 residents
> Property crime rate, Minnesota (2018): 1,994 per 100,000 residents
> Most stolen vehicle, Minnesota (2018): Honda Civic
 24/7 Wall St.
Source: graphiknation / iStock via Getty Images
Mississippi: Jackson
> Vehicle theft rate, Jackson (2018): 636 per 100,000 residents
> Vehicle theft rate, Mississippi (2018): 144 per 100,000 residents
> Total vehicles stolen, Jackson (2018): 1,056
> Total vehicles stolen, Mississippi (2018): 4,300
> Property crime rate, Jackson (2018): 4,731 per 100,000 residents
> Property crime rate, Mississippi (2018): 2,403 per 100,000 residents
> Most stolen vehicle, Mississippi (2018): Ford Pickup

Missouri: Independence
> Vehicle theft rate, Independence (2018): 1,029 per 100,000 residents
> Vehicle theft rate, Missouri (2018): 323 per 100,000 residents
> Total vehicles stolen, Independence (2018): 1,208
> Total vehicles stolen, Missouri (2018): 19,815
> Property crime rate, Independence (2018): 5,210 per 100,000 residents
> Property crime rate, Missouri (2018): 2,647 per 100,000 residents
> Most stolen vehicle, Missouri (2018): Ford Pickup
[in-text-ad-2]
Source: peeterv / iStock via Getty Images
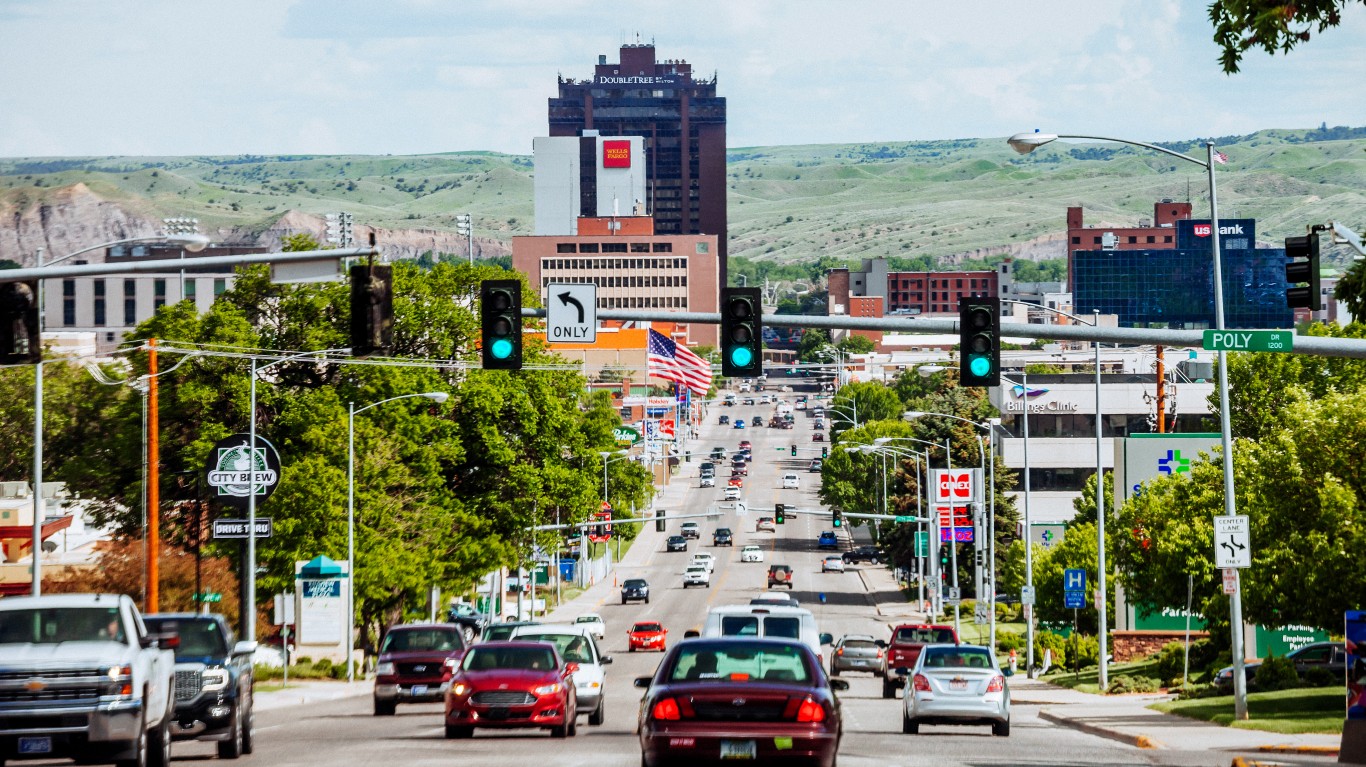
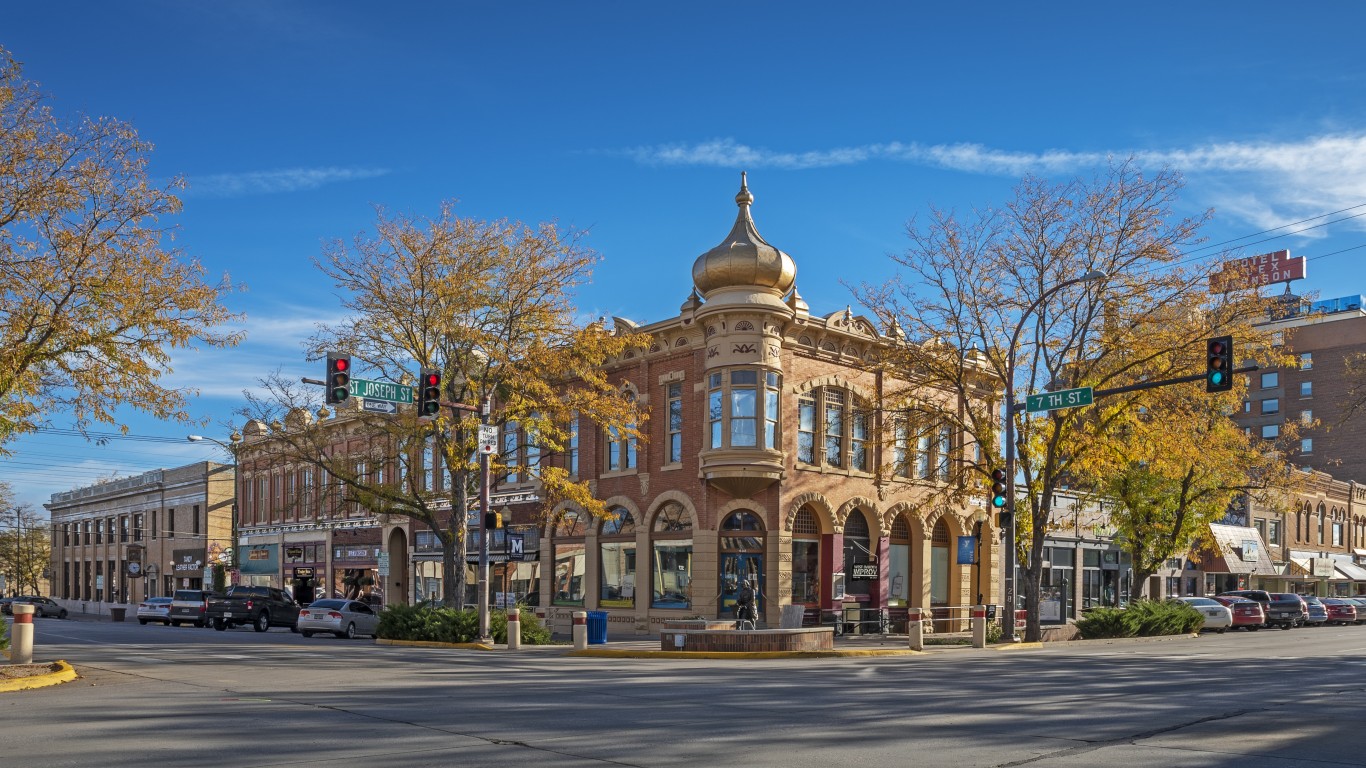
Montana: Billings
> Vehicle theft rate, Billings (2018): 720 per 100,000 residents
> Vehicle theft rate, Montana (2018): 263 per 100,000 residents
> Total vehicles stolen, Billings (2018): 795
> Total vehicles stolen, Montana (2018): 2,796
> Property crime rate, Billings (2018): 4,779 per 100,000 residents
> Property crime rate, Montana (2018): 2,496 per 100,000 residents
> Most stolen vehicle, Montana (2018): Ford Pickup

Source: Matt Bills / iStock via Getty Images
Nebraska: Omaha
> Vehicle theft rate, Omaha (2018): 665 per 100,000 residents
> Vehicle theft rate, Nebraska (2018): 253 per 100,000 residents
> Total vehicles stolen, Omaha (2018): 3,123
> Total vehicles stolen, Nebraska (2018): 4,874
> Property crime rate, Omaha (2018): 3,476 per 100,000 residents
> Property crime rate, Nebraska (2018): 2,080 per 100,000 residents
> Most stolen vehicle, Nebraska (2018): Chevrolet Pickup
[in-text-ad]

Source: EFA2015 / iStock via Getty Images
Nevada: North Las Vegas
> Vehicle theft rate, North Las Vegas (2018): 486 per 100,000 residents
> Vehicle theft rate, Nevada (2018): 392 per 100,000 residents
> Total vehicles stolen, North Las Vegas (2018): 1,199
> Total vehicles stolen, Nevada (2018): 11,904
> Property crime rate, North Las Vegas (2018): 2,106 per 100,000 residents
> Property crime rate, Nevada (2018): 2,438 per 100,000 residents
> Most stolen vehicle, Nevada (2018): Honda Civic
 24/7 Wall St.
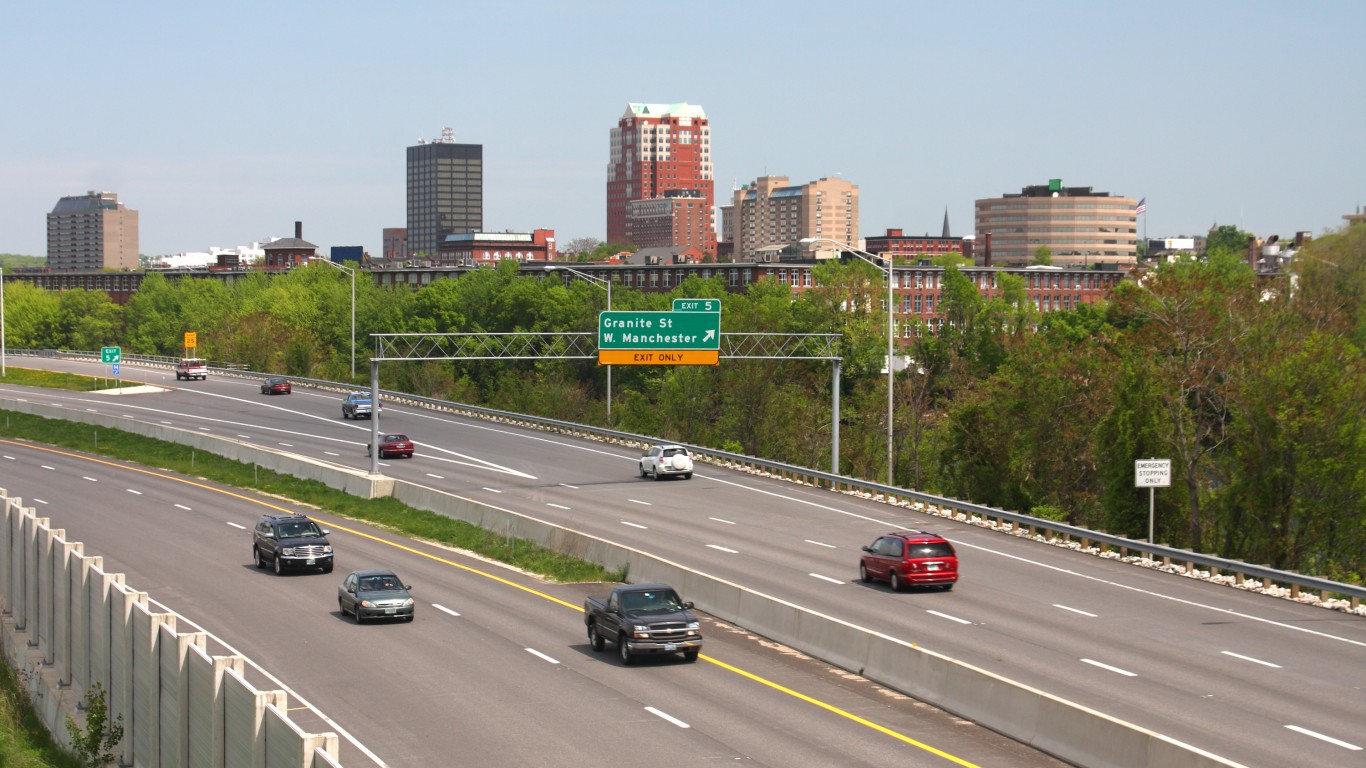
Source: DenisTangneyJr / iStock via Getty Images
New Hampshire: Manchester
> Vehicle theft rate, Manchester (2018): 146 per 100,000 residents
> Vehicle theft rate, New Hampshire (2018): 64 per 100,000 residents
> Total vehicles stolen, Manchester (2018): 163
> Total vehicles stolen, New Hampshire (2018): 869
> Property crime rate, Manchester (2018): 2,583 per 100,000 residents
> Property crime rate, New Hampshire (2018): 1,249 per 100,000 residents
> Most stolen vehicle, New Hampshire (2018): Honda Civic
Source: johnemac72 / iStock via Getty Images
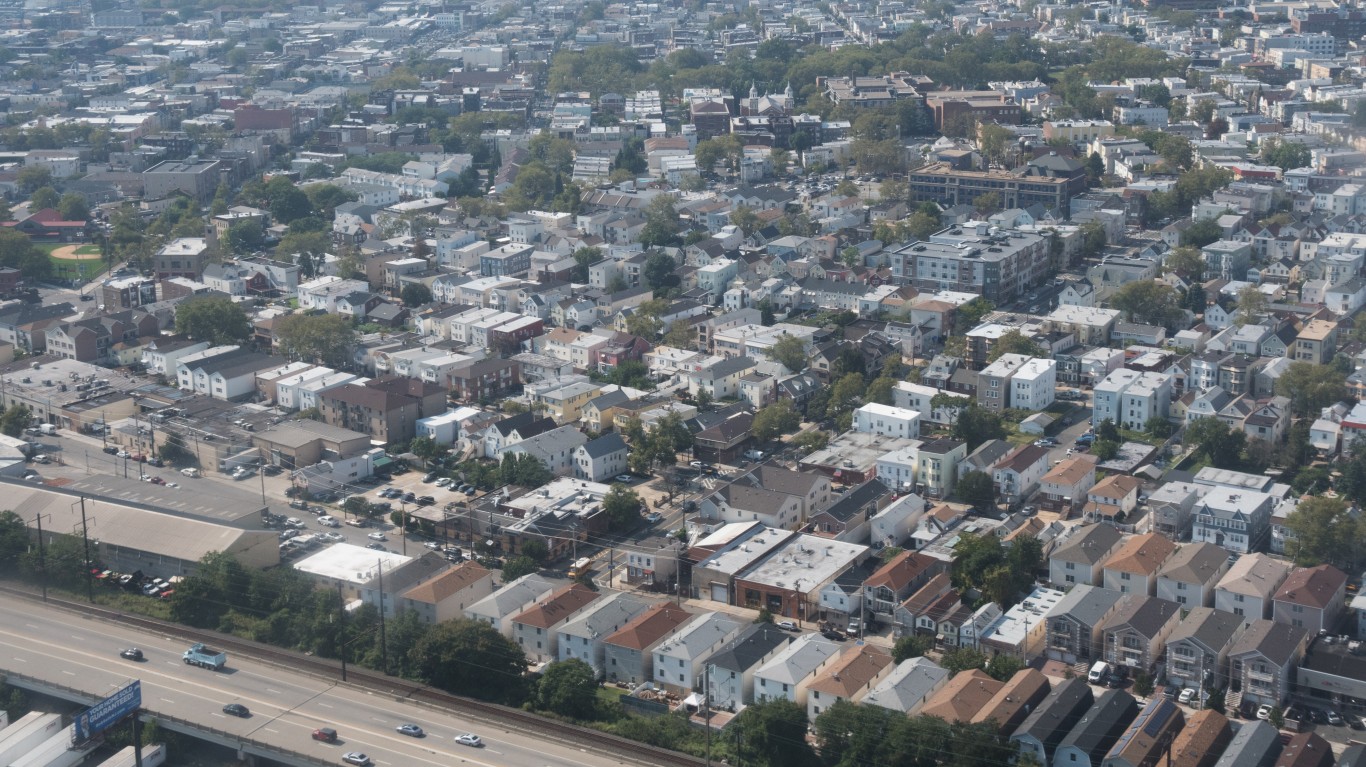
New Jersey: Irvington
> Vehicle theft rate, Irvington (2018): 723 per 100,000 residents
> Vehicle theft rate, New Jersey (2018): 124 per 100,000 residents
> Total vehicles stolen, Irvington (2018): 392
> Total vehicles stolen, New Jersey (2018): 11,037
> Property crime rate, Irvington (2018): 2,355 per 100,000 residents
> Property crime rate, New Jersey (2018): 1,405 per 100,000 residents
> Most stolen vehicle, New Jersey (2018): Honda Accord
[in-text-ad-2]
Source: ivanastar / iStock Unreleased via Getty Images
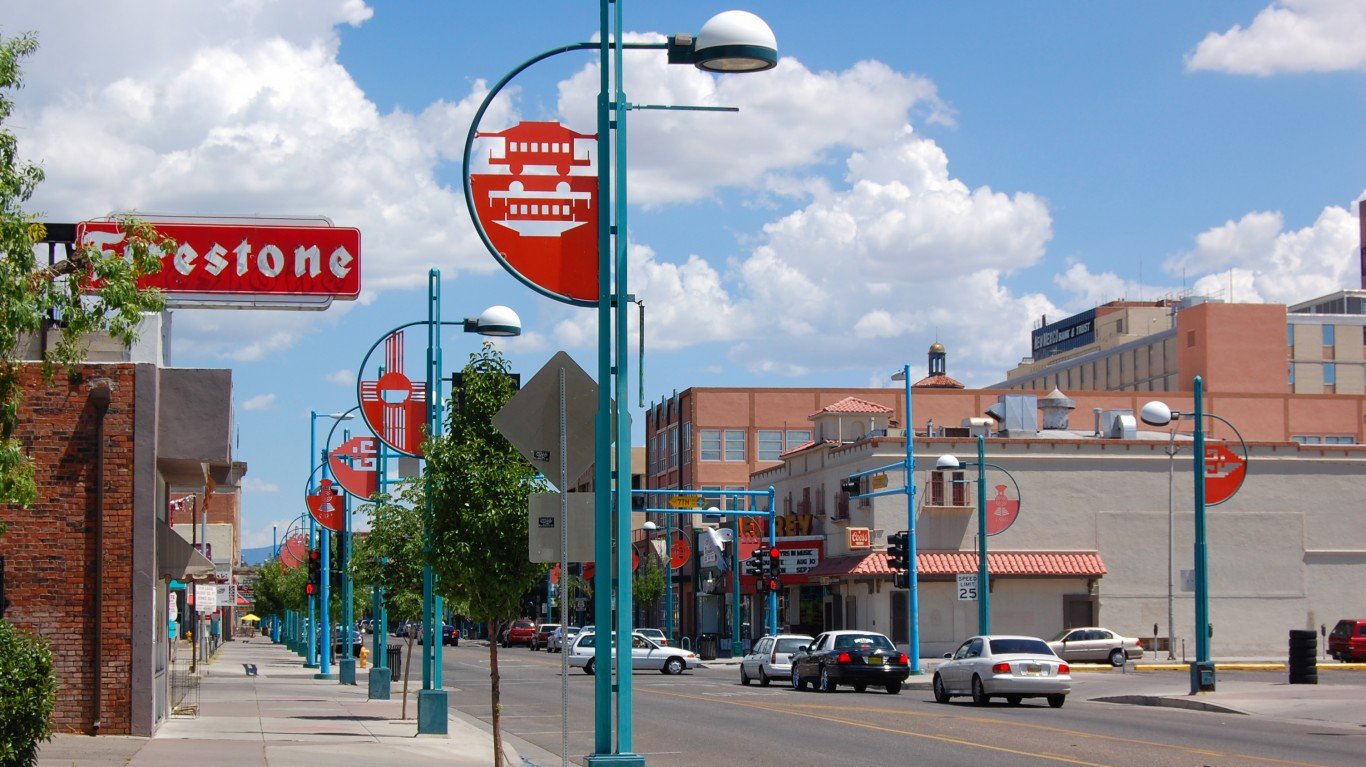
New Mexico: Albuquerque
> Vehicle theft rate, Albuquerque (2018): 1,181 per 100,000 residents
> Vehicle theft rate, New Mexico (2018): 486 per 100,000 residents
> Total vehicles stolen, Albuquerque (2018): 6,616
> Total vehicles stolen, New Mexico (2018): 10,179
> Property crime rate, Albuquerque (2018): 6,179 per 100,000 residents
> Property crime rate, New Mexico (2018): 3,420 per 100,000 residents
> Most stolen vehicle, New Mexico (2018): Chevrolet Pickup

New York: Syracuse
> Vehicle theft rate, Syracuse (2018): 354 per 100,000 residents
> Vehicle theft rate, New York (2018): 67 per 100,000 residents
> Total vehicles stolen, Syracuse (2018): 506
> Total vehicles stolen, New York (2018): 13,137
> Property crime rate, Syracuse (2018): 3,088 per 100,000 residents
> Property crime rate, New York (2018): 1,441 per 100,000 residents
> Most stolen vehicle, New York (2018): Honda Accord
[in-text-ad]
Source: Jeff Yount / iStock via Getty Images
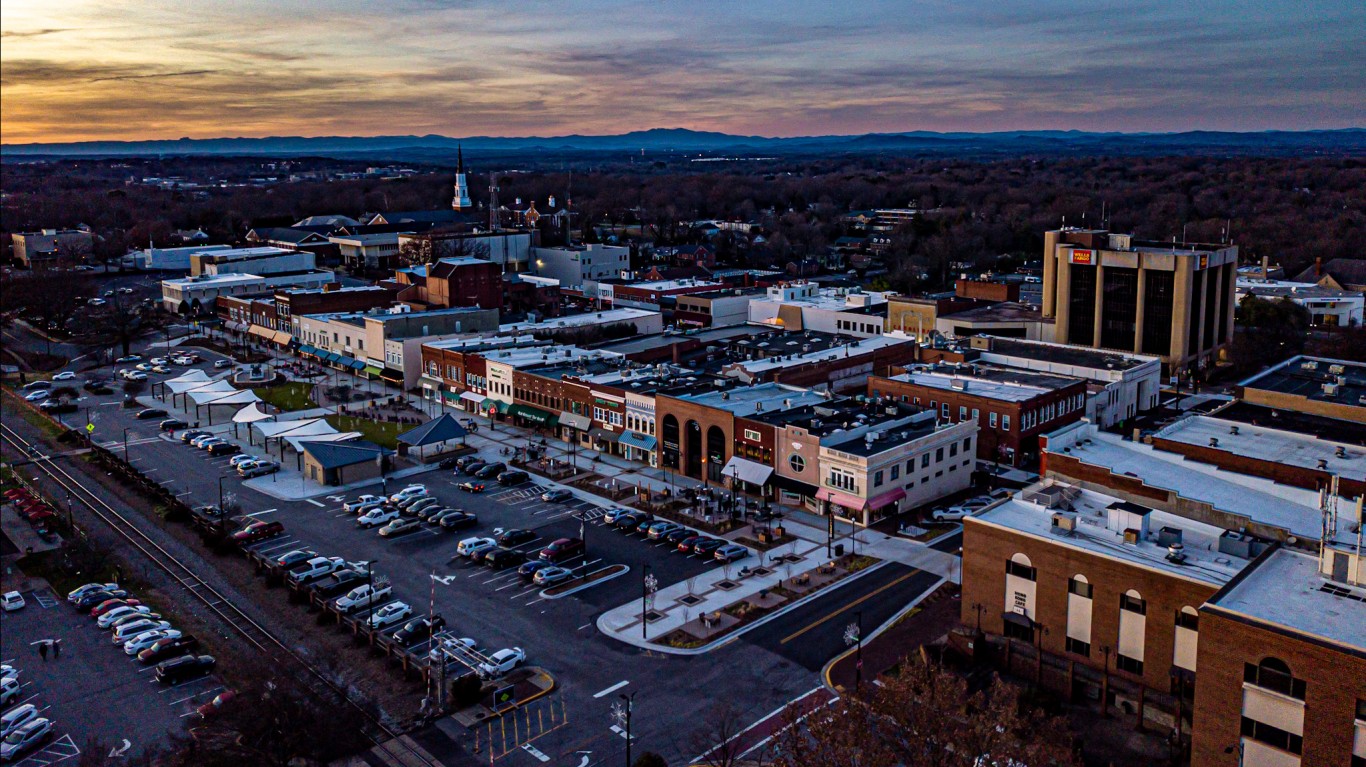
North Carolina: Hickory
> Vehicle theft rate, Hickory (2018): 477 per 100,000 residents
> Vehicle theft rate, North Carolina (2018): 170 per 100,000 residents
> Total vehicles stolen, Hickory (2018): 194
> Total vehicles stolen, North Carolina (2018): 17,632
> Property crime rate, Hickory (2018): 4,629 per 100,000 residents
> Property crime rate, North Carolina (2018): 2,494 per 100,000 residents
> Most stolen vehicle, North Carolina (2018): Honda Accord

North Dakota: Mandan
> Vehicle theft rate, Mandan (2018): 479 per 100,000 residents
> Vehicle theft rate, North Dakota (2018): 234 per 100,000 residents
> Total vehicles stolen, Mandan (2018): 109
> Total vehicles stolen, North Dakota (2018): 1,775
> Property crime rate, Mandan (2018): 3,034 per 100,000 residents
> Property crime rate, North Dakota (2018): 2,040 per 100,000 residents
> Most stolen vehicle, North Dakota (2018): Chevrolet Pickup

Ohio: Cleveland
> Vehicle theft rate, Cleveland (2018): 772 per 100,000 residents
> Vehicle theft rate, Ohio (2018): 170 per 100,000 residents
> Total vehicles stolen, Cleveland (2018): 2,970
> Total vehicles stolen, Ohio (2018): 19,909
> Property crime rate, Cleveland (2018): 4,412 per 100,000 residents
> Property crime rate, Ohio (2018): 2,177 per 100,000 residents
> Most stolen vehicle, Ohio (2018): Ford Pickup
[in-text-ad-2]

Source: ffooter / iStock Editorial via Getty Images
Oklahoma: Tulsa
> Vehicle theft rate, Tulsa (2018): 808 per 100,000 residents
> Vehicle theft rate, Oklahoma (2018): 337 per 100,000 residents
> Total vehicles stolen, Tulsa (2018): 3,259
> Total vehicles stolen, Oklahoma (2018): 13,289
> Property crime rate, Tulsa (2018): 5,431 per 100,000 residents
> Property crime rate, Oklahoma (2018): 2,875 per 100,000 residents
> Most stolen vehicle, Oklahoma (2018): Chevrolet Pickup
Source: hstiver / iStock Editorial via Getty Images
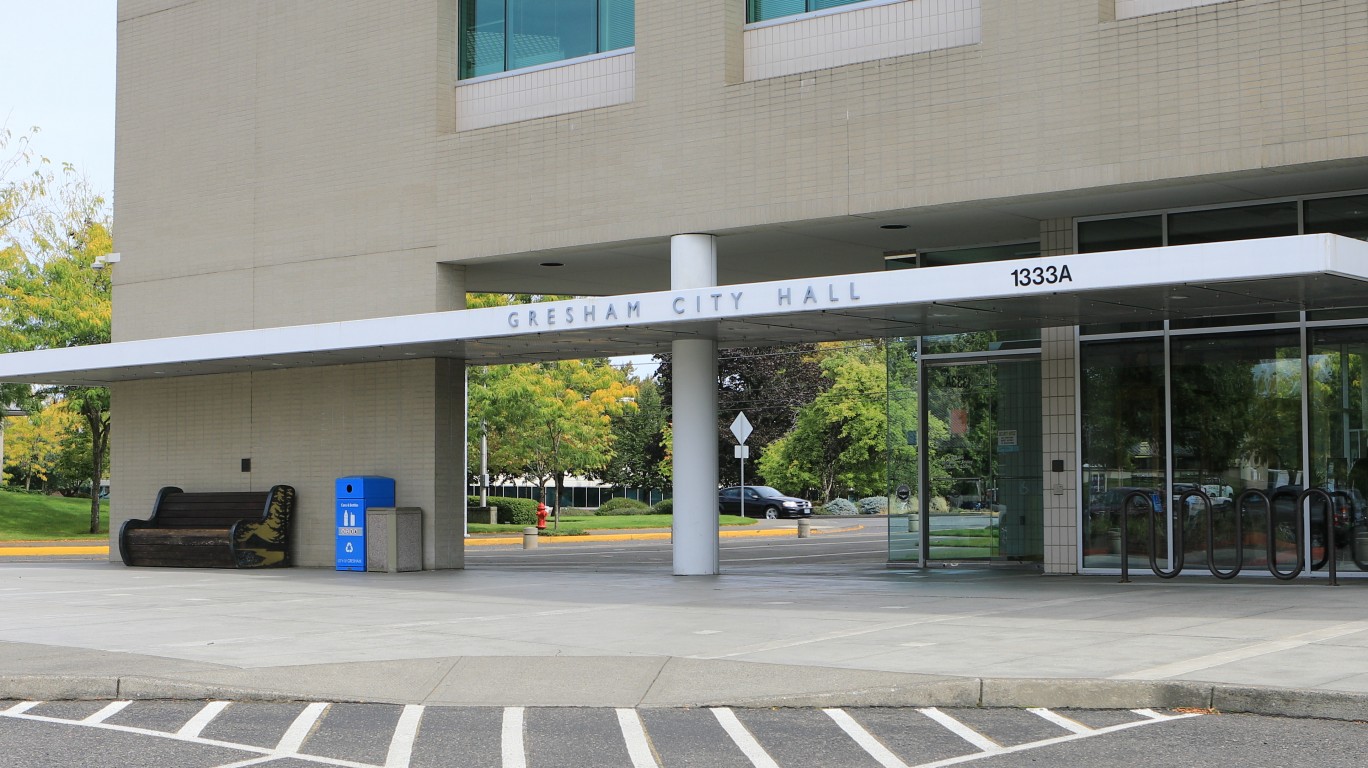
Oregon: Gresham
> Vehicle theft rate, Gresham (2018): 1,132 per 100,000 residents
> Vehicle theft rate, Oregon (2018): 395 per 100,000 residents
> Total vehicles stolen, Gresham (2018): 1,265
> Total vehicles stolen, Oregon (2018): 16,556
> Property crime rate, Gresham (2018): 3,420 per 100,000 residents
> Property crime rate, Oregon (2018): 2,894 per 100,000 residents
> Most stolen vehicle, Oregon (2018): Honda Civic
[in-text-ad]

Source: Courtesy of Lincolnman65 via Wikimedia Commons
Pennsylvania: York
> Vehicle theft rate, York (2018): 521 per 100,000 residents
> Vehicle theft rate, Pennsylvania (2018): 102 per 100,000 residents
> Total vehicles stolen, York (2018): 230
> Total vehicles stolen, Pennsylvania (2018): 13,116
> Property crime rate, York (2018): 2,574 per 100,000 residents
> Property crime rate, Pennsylvania (2018): 1,490 per 100,000 residents
> Most stolen vehicle, Pennsylvania (2018): Honda Civic
 24/7 Wall St.
Rhode Island: Pawtucket
> Vehicle theft rate, Pawtucket (2018): 320 per 100,000 residents
> Vehicle theft rate, Rhode Island (2018): 145 per 100,000 residents
> Total vehicles stolen, Pawtucket (2018): 230
> Total vehicles stolen, Rhode Island (2018): 1,531
> Property crime rate, Pawtucket (2018): 2,618 per 100,000 residents
> Property crime rate, Rhode Island (2018): 1,661 per 100,000 residents
> Most stolen vehicle, Rhode Island (2018): Honda Accord

South Carolina: Myrtle Beach
> Vehicle theft rate, Myrtle Beach (2018): 772 per 100,000 residents
> Vehicle theft rate, South Carolina (2018): 282 per 100,000 residents
> Total vehicles stolen, Myrtle Beach (2018): 260
> Total vehicles stolen, South Carolina (2018): 14,332
> Property crime rate, Myrtle Beach (2018): 10,547 per 100,000 residents
> Property crime rate, South Carolina (2018): 3,018 per 100,000 residents
> Most stolen vehicle, South Carolina (2018): Ford Pickup
[in-text-ad-2]
Source: James_Gabbert / iStock Editorial via Getty Images
South Dakota: Rapid City
> Vehicle theft rate, Rapid City (2018): 351 per 100,000 residents
> Vehicle theft rate, South Dakota (2018): 173 per 100,000 residents
> Total vehicles stolen, Rapid City (2018): 264
> Total vehicles stolen, South Dakota (2018): 1,524
> Property crime rate, Rapid City (2018): 2,914 per 100,000 residents
> Property crime rate, South Dakota (2018): 1,729 per 100,000 residents
> Most stolen vehicle, South Dakota (2018): Chevrolet Pickup
Source: Lorraine Boogich / iStock via Getty Images
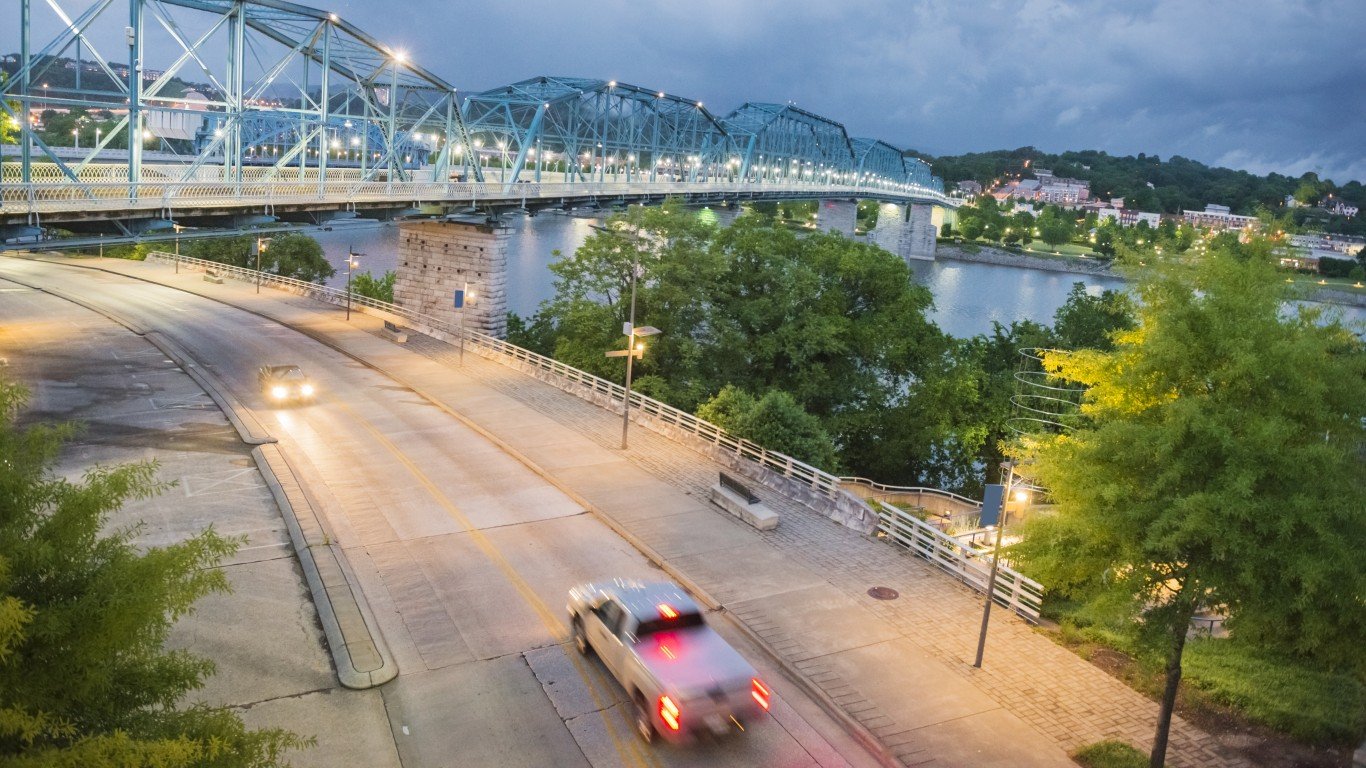
Tennessee: Chattanooga
> Vehicle theft rate, Chattanooga (2018): 789 per 100,000 residents
> Vehicle theft rate, Tennessee (2018): 302 per 100,000 residents
> Total vehicles stolen, Chattanooga (2018): 1,424
> Total vehicles stolen, Tennessee (2018): 20,439
> Property crime rate, Chattanooga (2018): 6,059 per 100,000 residents
> Property crime rate, Tennessee (2018): 2,825 per 100,000 residents
> Most stolen vehicle, Tennessee (2018): Chevrolet Pickup
[in-text-ad]

Source: Courtesy of Google Maps 2017
Texas: Balch Springs
> Vehicle theft rate, Balch Springs (2018): 763 per 100,000 residents
> Vehicle theft rate, Texas (2018): 243 per 100,000 residents
> Total vehicles stolen, Balch Springs (2018): 195
> Total vehicles stolen, Texas (2018): 69,817
> Property crime rate, Balch Springs (2018): 3,454 per 100,000 residents
> Property crime rate, Texas (2018): 2,367 per 100,000 residents
> Most stolen vehicle, Texas (2018): Ford Pickup
Source: StellaMc / iStock via Getty Images
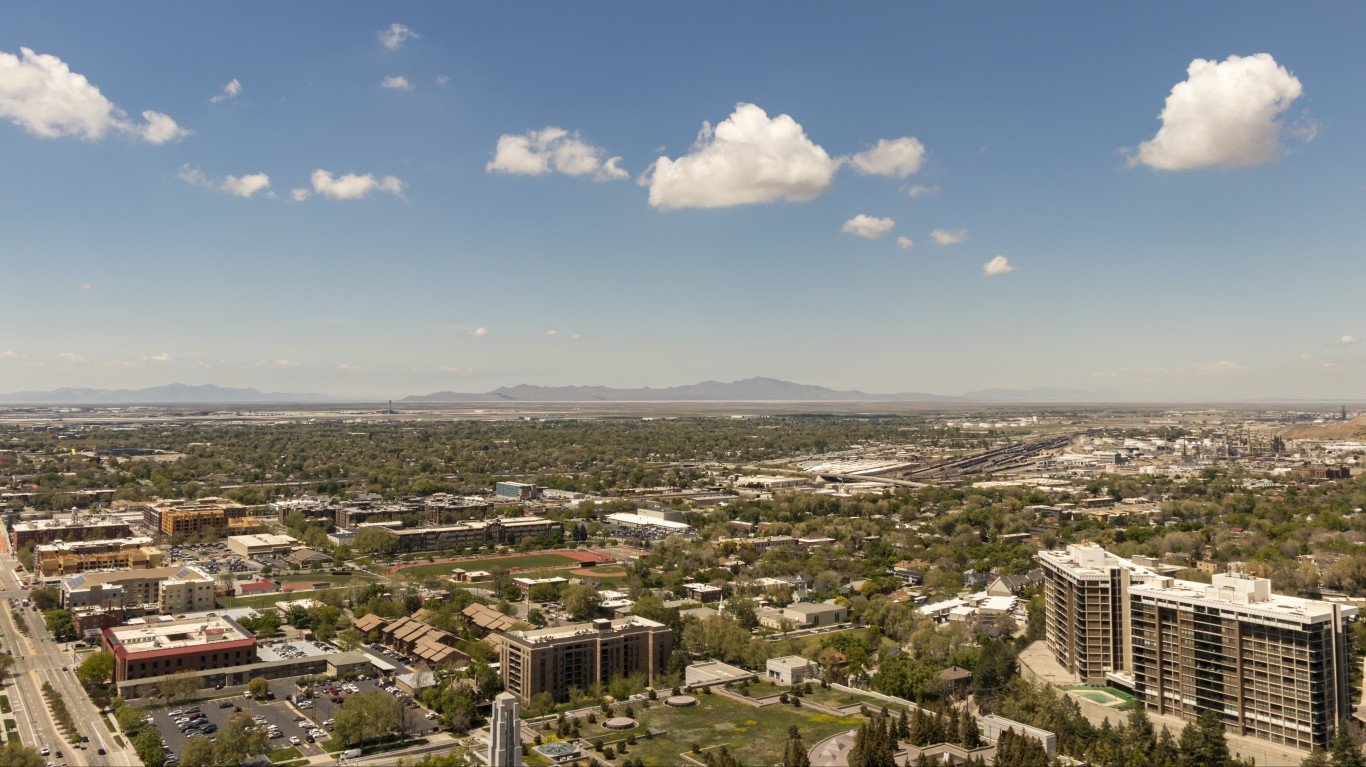
Utah: South Salt Lake
> Vehicle theft rate, South Salt Lake (2018): 1,244 per 100,000 residents
> Vehicle theft rate, Utah (2018): 245 per 100,000 residents
> Total vehicles stolen, South Salt Lake (2018): 313
> Total vehicles stolen, Utah (2018): 7,728
> Property crime rate, South Salt Lake (2018): 7,138 per 100,000 residents
> Property crime rate, Utah (2018): 2,378 per 100,000 residents
> Most stolen vehicle, Utah (2018): Honda Civic

Vermont: Essex
> Vehicle theft rate, Essex (2018): 50 per 100,000 residents
> Vehicle theft rate, Vermont (2018): 40 per 100,000 residents
> Total vehicles stolen, Essex (2018): 11
> Total vehicles stolen, Vermont (2018): 253
> Property crime rate, Essex (2018): 1,362 per 100,000 residents
> Property crime rate, Vermont (2018): 1,283 per 100,000 residents
> Most stolen vehicle, Vermont (2018): Toyota Tacoma
[in-text-ad-2]
Source: aimintang / iStock Unreleased via Getty Images
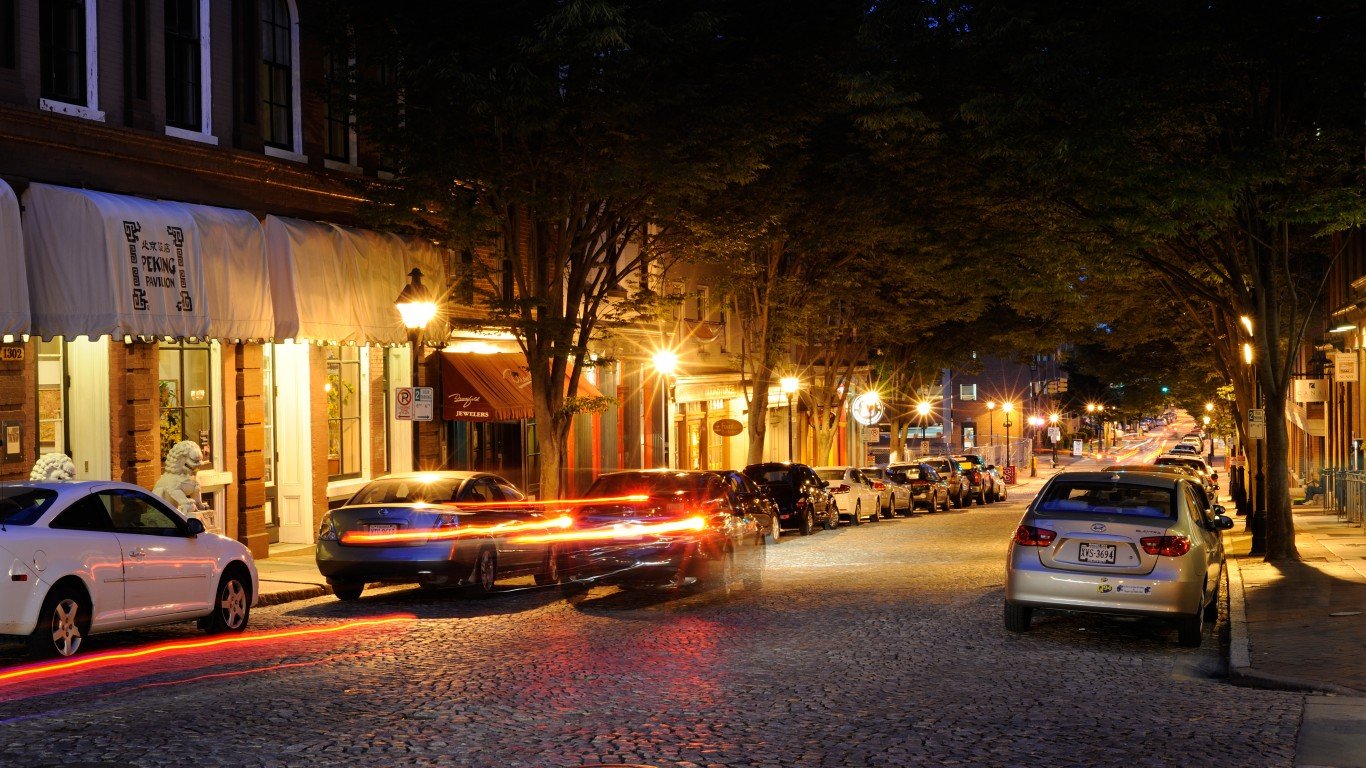
Virginia: Richmond
> Vehicle theft rate, Richmond (2018): 508 per 100,000 residents
> Vehicle theft rate, Virginia (2018): 127 per 100,000 residents
> Total vehicles stolen, Richmond (2018): 1,168
> Total vehicles stolen, Virginia (2018): 10,778
> Property crime rate, Richmond (2018): 3,830 per 100,000 residents
> Property crime rate, Virginia (2018): 1,666 per 100,000 residents
> Most stolen vehicle, Virginia (2018): Honda Accord
Source: drial7m1 / iStock Unreleased via Getty Images
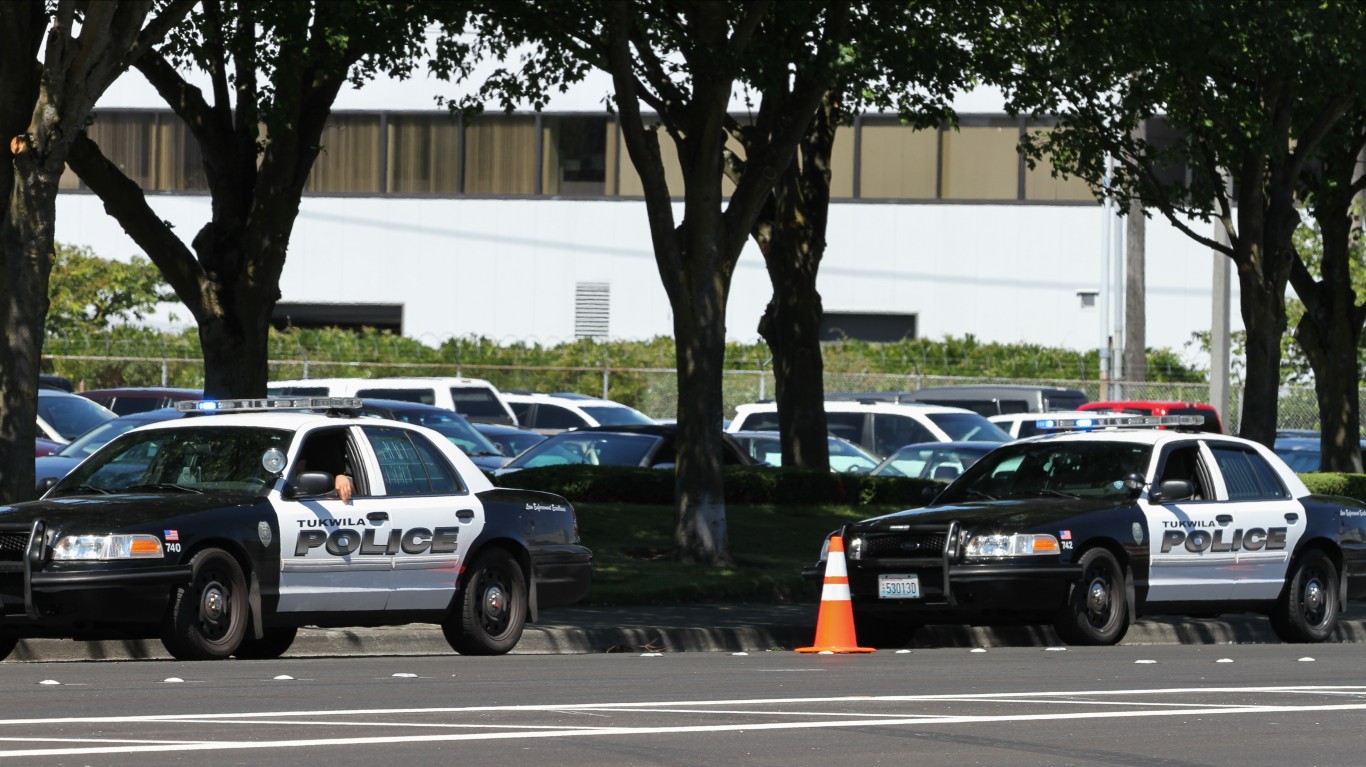
Washington: Tukwila
> Vehicle theft rate, Tukwila (2018): 2,819 per 100,000 residents
> Vehicle theft rate, Washington (2018): 367 per 100,000 residents
> Total vehicles stolen, Tukwila (2018): 572
> Total vehicles stolen, Washington (2018): 27,677
> Property crime rate, Tukwila (2018): 16,764 per 100,000 residents
> Property crime rate, Washington (2018): 2,946 per 100,000 residents
> Most stolen vehicle, Washington (2018): Honda Civic
[in-text-ad]

Source: Sean Pavone / iStock via Getty Images
West Virginia: Charleston
> Vehicle theft rate, Charleston (2018): 518 per 100,000 residents
> Vehicle theft rate, West Virginia (2018): 140 per 100,000 residents
> Total vehicles stolen, Charleston (2018): 246
> Total vehicles stolen, West Virginia (2018): 2,519
> Property crime rate, Charleston (2018): 6,010 per 100,000 residents
> Property crime rate, West Virginia (2018): 1,486 per 100,000 residents
> Most stolen vehicle, West Virginia (2018): Ford Pickup
Source: peeterv / iStock via Getty Images
Wisconsin: Milwaukee
> Vehicle theft rate, Milwaukee (2018): 770 per 100,000 residents
> Vehicle theft rate, Wisconsin (2018): 149 per 100,000 residents
> Total vehicles stolen, Milwaukee (2018): 4,589
> Total vehicles stolen, Wisconsin (2018): 8,634
> Property crime rate, Milwaukee (2018): 2,972 per 100,000 residents
> Property crime rate, Wisconsin (2018): 1,560 per 100,000 residents
> Most stolen vehicle, Wisconsin (2018): Dodge Caravan

Source: benkrut / iStock via Getty Images
Wyoming: Cheyenne
> Vehicle theft rate, Cheyenne (2018): 337 per 100,000 residents
> Vehicle theft rate, Wyoming (2018): 145 per 100,000 residents
> Total vehicles stolen, Cheyenne (2018): 216
> Total vehicles stolen, Wyoming (2018): 839
> Property crime rate, Cheyenne (2018): 3,987 per 100,000 residents
> Property crime rate, Wyoming (2018): 1,785 per 100,000 residents
> Most stolen vehicle, Wyoming (2018): Ford Pickup
Take This Retirement Quiz To Get Matched With A Financial Advisor (Sponsored)
Take the quiz below to get matched with a financial advisor today.
Each advisor has been vetted by SmartAsset and is held to a fiduciary standard to act in your best interests.
Here’s how it works:
1. Answer SmartAsset advisor match quiz
2. Review your pre-screened matches at your leisure. Check out the
advisors’ profiles.
3. Speak with advisors at no cost to you. Have an introductory call on the phone or introduction in person and choose whom to work with in the future
Take the retirement quiz right here.
Thank you for reading! Have some feedback for us?
Contact the 24/7 Wall St. editorial team.
Editors' Picks