
Many Americans have likely noticed that it’s much hotter than normal for this time of year. As of Monday, July 20, excessive heat warnings and advisories had been issued for much of the East Coast, affecting around 70 million people from Maine to South Carolina.
Temperatures are forecast to exceed 90 degrees for much of the country throughout the rest of the week, according to the National Weather Service, and in some cases — such as in the Desert Southwest — even 100 degrees.
While warm and even hot weather can be enjoyable, extreme heat puts many — especially infants, young children, and older adults — at risk of heat-related illnesses. The frequency of heat-related health issues, such as heat stroke and exhaustion, is directly related to how high temperatures are and the level of humidity. According to the Department of Homeland Security, extreme heat often results in a greater number of annual deaths than any other weather-related hazard.
24/7 Wall St. has identified the country’s 50 hottest cities (with populations of at least 10,000) based on the average number of 90-plus degree days per year using climate data from the National Oceanic and Atmospheric Administration.
In the 50 large cities on the list, the temperature reaches at least 90 degrees Fahrenheit for an average of 67 days or more per year. In some of these cities, the temperature is this high in more than double that number of days (and more) a year.
Click here to see the 50 hottest cities in America.
Click here to see our methodology.
The majority of these cities are located in the Southern states. Texas has the most cities on this list of hottest U.S. cities, with 16, followed by Florida with eight. Among the other hottest states in the country with numerous cities on our list are Louisiana and Mississippi.
Many of the hottest cities in America are also relatively dense and populous urban areas. As human-made creations such as buildings, roads, and other infrastructure replace natural landscapes, temperatures often rise. The result is what is referred to as a “heat island.” In the evening, the temperature in an urban heat island can be as much as 22 degrees warmer than in nearby rural areas.

Source: Marc Averette / Wikimedia Commons
50. Miami, FL
> Days per year with 90 F+ temp.: 68
> Highest temp. on record (1948-2018): 98.0 F
> Normal mid-summer high: 91.0 F
> Normal year-round high: 84.3 F
[in-text-ad]

Source: DenisTangneyJr / iStock via Getty Images
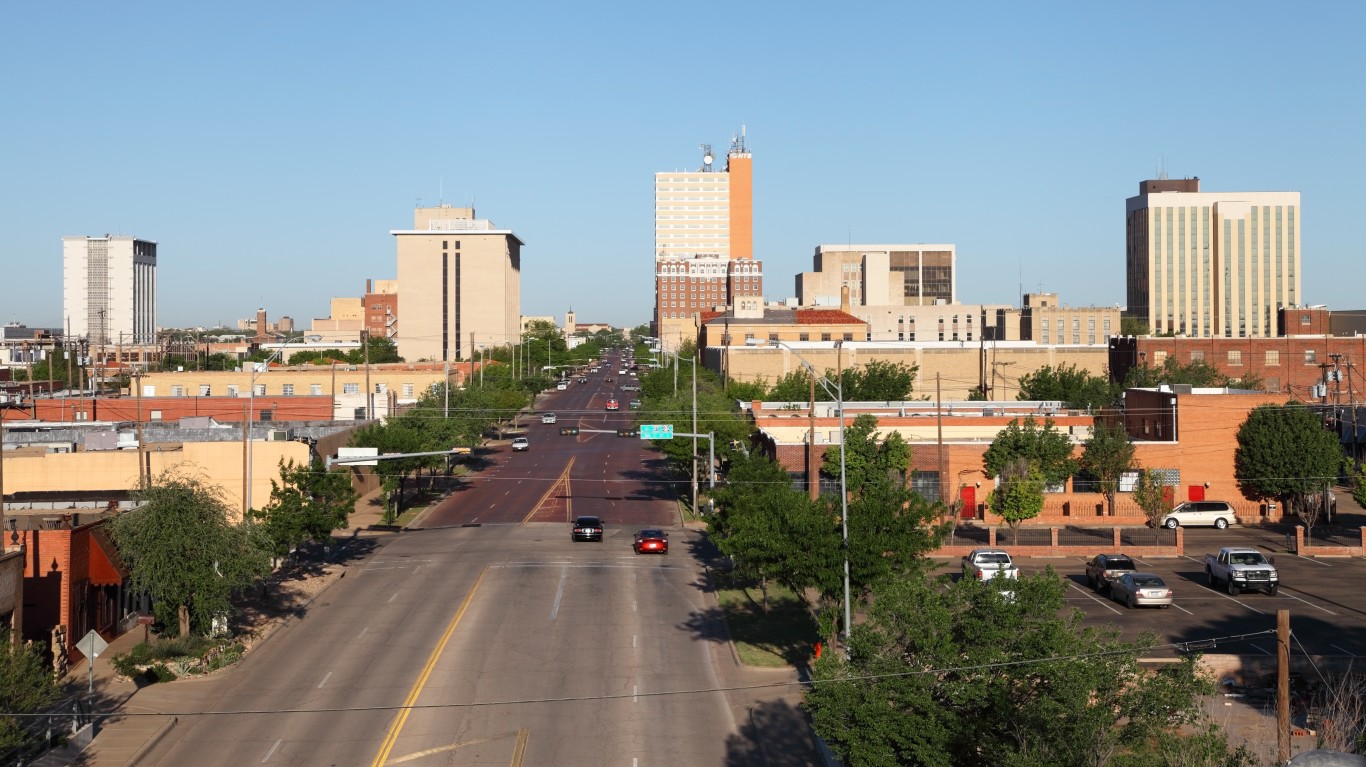
49. Amarillo, TX
> Days per year with 90 F+ temp.: 68
> Highest temp. on record (1947-2018): 111.0 F
> Normal mid-summer high: 91.4 F
> Normal year-round high: 70.9 F
 24/7 Wall St.
Source: Nclauzing / Getty Images
48. Memphis, TN
> Days per year with 90 F+ temp.: 68
> Highest temp. on record (1940-2018): 108.0 F
> Normal mid-summer high: 91.6 F
> Normal year-round high: 72.4 F

Source: DenisTangneyJr / Getty Images
47. Tupelo, MS
> Days per year with 90 F+ temp.: 70
> Highest temp. on record (1962-2018): 107.0 F
> Normal mid-summer high: 91.7 F
> Normal year-round high: 73.4 F
[in-text-ad-2]

Source: Davel5957 / Getty Images
46. Oklahoma City, OK
> Days per year with 90 F+ temp.: 71
> Highest temp. on record (1948-2018): 113.0 F
> Normal mid-summer high: 93.9 F
> Normal year-round high: 72.2 F

Source: Michael Wright / iStock via Getty Images
45. Savannah, GA
> Days per year with 90 F+ temp.: 72
> Highest temp. on record (1948-2018): 105.0 F
> Normal mid-summer high: 92.4 F
> Normal year-round high: 77.4 F
[in-text-ad]

Source: Davel5957 / Getty Images
44. Tulsa, OK
> Days per year with 90 F+ temp.: 73
> Highest temp. on record (1938-2018): 113.0 F
> Normal mid-summer high: 93.5 F
> Normal year-round high: 71.7 F
 24/7 Wall St.
Source: SpVVK / Getty Images
43. Sacramento, CA
> Days per year with 90 F+ temp.: 74
> Highest temp. on record (1941-2018): 115.0 F
> Normal mid-summer high: 92.1 F
> Normal year-round high: 73.6 F

Source: SeanPavonePhoto / Getty Images
42. West Palm Beach, FL
> Days per year with 90 F+ temp.: 75
> Highest temp. on record (1938-2018): 101.0 F
> Normal mid-summer high: 90.1 F
> Normal year-round high: 82.9 F
[in-text-ad-2]

Source: f11photo / Getty Images
41. New Orleans, LA
> Days per year with 90 F+ temp.: 75
> Highest temp. on record (1948-2018): 102.0 F
> Normal mid-summer high: 91.2 F
> Normal year-round high: 78.2 F

Source: Davel5957 / Getty Images
40. Little Rock, AR
> Days per year with 90 F+ temp.: 75
> Highest temp. on record (1938-2018): 114.0 F
> Normal mid-summer high: 92.6 F
> Normal year-round high: 72.8 F
[in-text-ad]

Source: Sean Pavone / Getty Images
39. Mobile, AL
> Days per year with 90 F+ temp.: 76
> Highest temp. on record (1948-2018): 105.0 F
> Normal mid-summer high: 90.5 F
> Normal year-round high: 76.7 F

Source: Sean Pavone / Getty Images
38. Columbus, GA
> Days per year with 90 F+ temp.: 78
> Highest temp. on record (1948-2018): 106.0 F
> Normal mid-summer high: 92.2 F
> Normal year-round high: 76.2 F

Source: DenisTangneyJr / Getty Images
37. Fort Smith, AR
> Days per year with 90 F+ temp.: 78
> Highest temp. on record (1945-2018): 115.0 F
> Normal mid-summer high: 93.4 F
> Normal year-round high: 72.8 F
[in-text-ad-2]

Source: Kruck20 / Getty Images
36. Columbia, SC
> Days per year with 90 F+ temp.: 79
> Highest temp. on record (1948-2018): 109.0 F
> Normal mid-summer high: 92.7 F
> Normal year-round high: 75.4 F

Source: DenisTangneyJr / Getty Images
35. Lake Charles, LA
> Days per year with 90 F+ temp.: 80
> Highest temp. on record (1961-2018): 107.0 F
> Normal mid-summer high: 91.9 F
> Normal year-round high: 78.0 F
[in-text-ad]

Source: SeanPavonePhoto / iStock via Getty Images
34. Jacksonville, FL
> Days per year with 90 F+ temp.: 82
> Highest temp. on record (1938-2018): 105.0 F
> Normal mid-summer high: 92.0 F
> Normal year-round high: 79.3 F

Source: DenisTangneyJr / Getty Images
33. Stockton, CA
> Days per year with 90 F+ temp.: 83
> Highest temp. on record (1948-2018): 115.0 F
> Normal mid-summer high: 93.4 F
> Normal year-round high: 74.3 F

Source: SeanPavonePhoto / Getty Images
32. Jackson, MS
> Days per year with 90 F+ temp.: 84
> Highest temp. on record (1963-2018): 107.0 F
> Normal mid-summer high: 91.5 F
> Normal year-round high: 75.5 F
[in-text-ad-2]
Source: DenisTangneyJr / Getty Images
31. Lubbock, TX
> Days per year with 90 F+ temp.: 84
> Highest temp. on record (1947-2018): 114.0 F
> Normal mid-summer high: 92.8 F
> Normal year-round high: 74.3 F
Source: Sean Pavone / Getty Images
30. Gainesville, FL
> Days per year with 90 F+ temp.: 85
> Highest temp. on record (1960-2018): 103.0 F
> Normal mid-summer high: 90.9 F
> Normal year-round high: 80.0 F
[in-text-ad]

Source: DenisTangneyJr / Getty Images
29. Meridian, MS
> Days per year with 90 F+ temp.: 85
> Highest temp. on record (1944-2018): 107.0 F
> Normal mid-summer high: 91.8 F
> Normal year-round high: 75.8 F
 24/7 Wall St.
Source: SeanPavonePhoto / iStock via Getty Images
28. Montgomery, AL
> Days per year with 90 F+ temp.: 85
> Highest temp. on record (1948-2018): 106.0 F
> Normal mid-summer high: 92.1 F
> Normal year-round high: 76.5 F

Source: CHBD / Getty Images
27. Tampa, FL
> Days per year with 90 F+ temp.: 87
> Highest temp. on record (1939-2018): 99.0 F
> Normal mid-summer high: 90.2 F
> Normal year-round high: 81.7 F
[in-text-ad-2]

Source: DenisTangneyJr / Getty Images
26. Port Arthur, TX
> Days per year with 90 F+ temp.: 87
> Highest temp. on record (1947-2018): 108.0 F
> Normal mid-summer high: 92.2 F
> Normal year-round high: 78.3 F

Source: felixmizioznikov / iStock via Getty Images
25. Baton Rouge, LA
> Days per year with 90 F+ temp.: 89
> Highest temp. on record (1930-2018): 105.0 F
> Normal mid-summer high: 92.5 F
> Normal year-round high: 78.9 F
[in-text-ad]

Source: Sean Pavone / Getty Images
24. Tallahassee, FL
> Days per year with 90 F+ temp.: 91
> Highest temp. on record (1940-2018): 105.0 F
> Normal mid-summer high: 92.1 F
> Normal year-round high: 79.5 F

Source: Sean Pavone / Getty Images
23. Shreveport, LA
> Days per year with 90 F+ temp.: 93
> Highest temp. on record (1939-2018): 109.0 F
> Normal mid-summer high: 93.4 F
> Normal year-round high: 75.8 F
Source: Artystyk386 / Wikimedia Commons
22. Orlando, FL
> Days per year with 90 F+ temp.: 98
> Highest temp. on record (1952-2018): 101.0 F
> Normal mid-summer high: 91.8 F
> Normal year-round high: 82.4 F
[in-text-ad-2]

Source: fotoguy22 / iStock via Getty Images
21. Fort Myers, FL
> Days per year with 90 F+ temp.: 99
> Highest temp. on record (1892-2018): 103.0 F
> Normal mid-summer high: 91.9 F
> Normal year-round high: 84.7 F

Source: DenisTangneyJr / Getty Images
20. Roswell, NM
> Days per year with 90 F+ temp.: 99
> Highest temp. on record (1949-2018): 114.0 F
> Normal mid-summer high: 93.7 F
> Normal year-round high: 75.4 F
[in-text-ad]

Source: DenisTangneyJr / Getty Images
19. Abilene, TX
> Days per year with 90 F+ temp.: 101
> Highest temp. on record (1948-2018): 110.0 F
> Normal mid-summer high: 94.2 F
> Normal year-round high: 76.2 F

Source: f11photo / iStock via Getty Images
18. Dallas, TX
> Days per year with 90 F+ temp.: 103
> Highest temp. on record (1939-2018): 112.0 F
> Normal mid-summer high: N/A
> Normal year-round high: 76.6 F

Source: Sean Pavone / Getty Images
17. Houston, TX
> Days per year with 90 F+ temp.: 104
> Highest temp. on record (1969-2018): 109.0 F
> Normal mid-summer high: 92.3 F
> Normal year-round high: 78.5 F
[in-text-ad-2]

Source: jgreesonarts / iStock via Getty Images
16. Redding, CA
> Days per year with 90 F+ temp.: 105
> Highest temp. on record (1986-2018): 118.0 F
> Normal mid-summer high: 94.9 F
> Normal year-round high: 72.1 F

Source: DenisTangneyJr / Getty Images
15. El Paso, TX
> Days per year with 90 F+ temp.: 107
> Highest temp. on record (1938-2018): 114.0 F
> Normal mid-summer high: 95.5 F
> Normal year-round high: 77.4 F
[in-text-ad]

Source: DenisTangneyJr / Getty Images
14. Wichita Falls, TX
> Days per year with 90 F+ temp.: 107
> Highest temp. on record (1907-2018): 117.0 F
> Normal mid-summer high: 96.9 F
> Normal year-round high: 75.7 F
 24/7 Wall St.
Source: Davel5957 / Getty Images
13. Fresno, CA
> Days per year with 90 F+ temp.: 108
> Highest temp. on record (1948-2018): 113.0 F
> Normal mid-summer high: 98.4 F
> Normal year-round high: 76.7 F

Source: DenisTangneyJr / Getty Images
12. Bakersfield, CA
> Days per year with 90 F+ temp.: 110
> Highest temp. on record (1937-2018): 115.0 F
> Normal mid-summer high: 97.1 F
> Normal year-round high: 76.8 F
[in-text-ad-2]

Source: Billy Hathorn / Wikimedia Commons
11. Victoria, TX
> Days per year with 90 F+ temp.: 111
> Highest temp. on record (1953-2018): 111.0 F
> Normal mid-summer high: 95.0 F
> Normal year-round high: 80.7 F
Source: ChrisBoswell / iStock via Getty Images
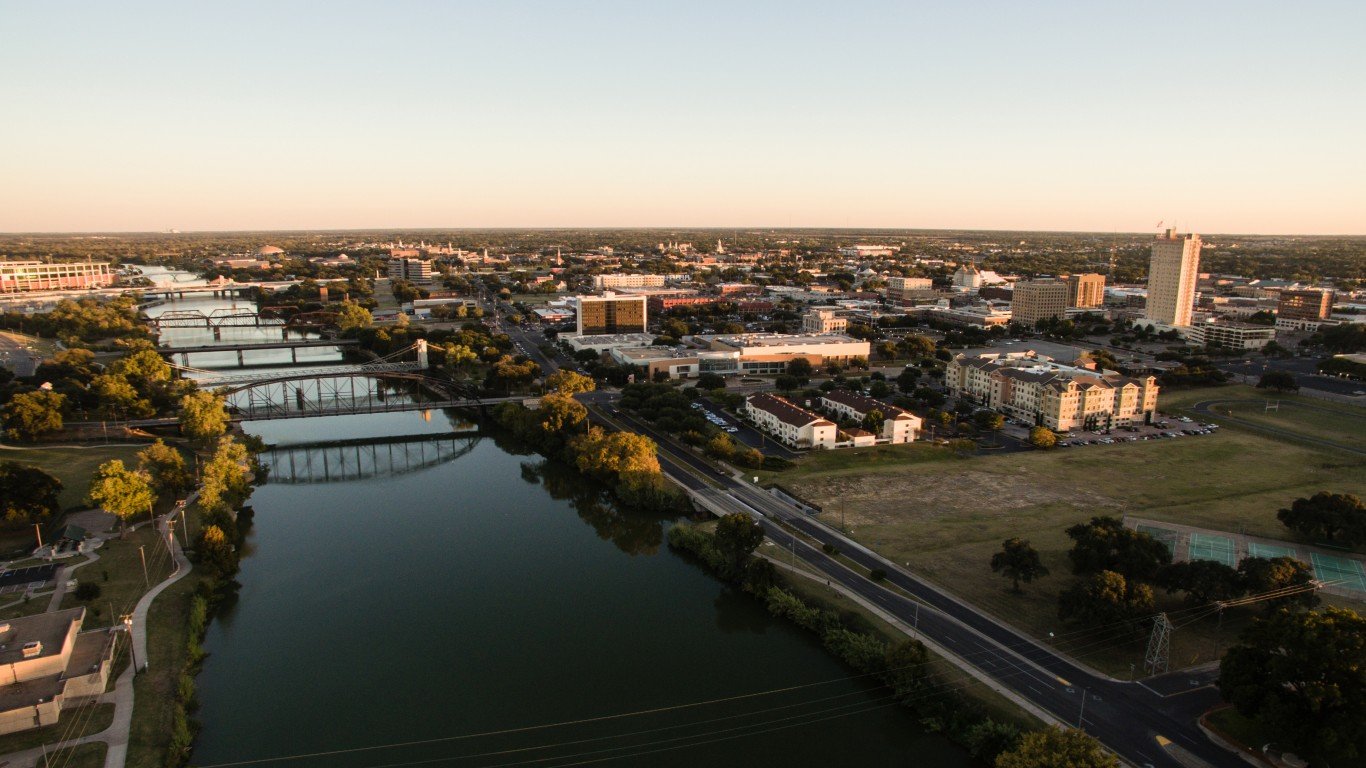
10. Waco, TX
> Days per year with 90 F+ temp.: 111
> Highest temp. on record (1941-2018): 114.0 F
> Normal mid-summer high: 96.8 F
> Normal year-round high: 77.8 F
[in-text-ad]

Source: RoschetzkyIstockPhoto / iStock via Getty Images
9. Corpus Christi, TX
> Days per year with 90 F+ temp.: 112
> Highest temp. on record (1948-2018): 109.0 F
> Normal mid-summer high: 94.4 F
> Normal year-round high: 81.6 F

Source: DenisTangneyJr / Getty Images
8. San Angelo, TX
> Days per year with 90 F+ temp.: 114
> Highest temp. on record (1907-2018): 111.0 F
> Normal mid-summer high: 95.1 F
> Normal year-round high: 78.2 F

Source: NicolasMcComber / Getty Images
7. Austin, TX
> Days per year with 90 F+ temp.: 114
> Highest temp. on record (1938-2018): 112.0 F
> Normal mid-summer high: N/A
> Normal year-round high: 79.7 F
[in-text-ad-2]

Source: Sean Pavone / iStock via Getty Images
6. San Antonio, TX
> Days per year with 90 F+ temp.: 116
> Highest temp. on record (1946-2018): 111.0 F
> Normal mid-summer high: 97.5 F
> Normal year-round high: 80.7 F

Source: DenisTangneyJr / Getty Images
5. Brownsville, TX
> Days per year with 90 F+ temp.: 125
> Highest temp. on record (1898-2018): 106.0 F
> Normal mid-summer high: 94.4 F
> Normal year-round high: 83.5 F
[in-text-ad]
Source: M. Kaercher / Getty Images
4. Del Rio, TX
> Days per year with 90 F+ temp.: 134
> Highest temp. on record (1951-2018): 112.0 F
> Normal mid-summer high: 97.1 F
> Normal year-round high: 81.6 F

Source: f11photo / Getty Images
3. Las Vegas, NV
> Days per year with 90 F+ temp.: 135
> Highest temp. on record (1948-2018): 117.0 F
> Normal mid-summer high: 104.1 F
> Normal year-round high: 79.6 F

Source: dszc / Getty Images
2. Tucson, AZ
> Days per year with 90 F+ temp.: 147
> Highest temp. on record (1946-2018): 117.0 F
> Normal mid-summer high: 100.2 F
> Normal year-round high: 82.9 F
[in-text-ad-2]

Source: Dreamframer / iStock via Getty Images
1. Phoenix, AZ
> Days per year with 90 F+ temp.: 169
> Highest temp. on record (1933-2018): 122.0 F
> Normal mid-summer high: 106.1 F
> Normal year-round high: 86.6 F
Methodology:
To determine the hottest cities in America, 24/7 Wall St. ranked 192 cities based on the average number of 90-plus degree days per year, using climate data from the National Oceanic Atmospheric Administration’s 2018 Comparative Climatic Data report. In cases where multiple cities had the same amount of 90-plus degree days per year, the city with the higher average daily maximum temperature during its hottest month was given the higher rank. Only cities with populations of at least 10,000 were considered.
Averages for each city were calculated since each city began keeping records.
The normal mid-summer high temperature is the 30-year average daily maximum temperature for the month with the highest average daily temperature for each city, using data recorded between 1981 and 2010. The normal year-round high temperature is the 30-year average daily maximum temperature from 1981 to 2010. Highest temperature on record refers to the highest temperature recorded at each city’s weather station, and this figure may differ from citywide or statewide figures. A full year’s data was not always available for the first year listed in each city’s range of recorded temperatures.
Sponsored: Attention Savvy Investors: Speak to 3 Financial Experts – FREE
Ever wanted an extra set of eyes on an investment you’re considering? Now you can speak with up to 3 financial experts in your area for FREE. By simply
clicking here you can begin to match with financial professionals who can help guide you through the financial decisions you’re making. And the best part? The first conversation with them is free.
Click here to match with up to 3 financial pros who would be excited to help you make financial decisions.
Thank you for reading! Have some feedback for us?
Contact the 24/7 Wall St. editorial team.
Editors' Picks