
Almost 4 million COVID-19 cases have been confirmed in the United States, and more than 144,000 people are known to have died as a result of the virus — by far the most cases and deaths of any country. Within the United States, the extent of the spread varies considerably from state to state, and even from county to county. As the number of daily new cases is declining in some parts of the country, they are spiking alarmingly in others. In the vast majority of states, the number of daily new cases is rising, and a number of states have paused their planned reopenings as a result.
Using data from state and local health departments, 24/7 Wall St. compiled and reviewed the average of new daily confirmed COVID-19 cases for the week ending July 20 and compared it to the average of new daily cases from the previous week to determine the county in each state where the virus is spreading the fastest. We excluded counties with populations of fewer than 5,000 people, as well as those with fewer than 20 reported new cases in the past 14 days.
The average number of new daily cases per capita nationwide has increased from 17.0 per 100,000 during the week ending July 13 to 19.8 per 100,000 in the week ending July 20, an increase of 2.8 daily new cases per 100,000 people. Some counties on this list reported relatively modest increases. In five states — Connecticut, Hawaii, New Hampshire, Maine, and Vermont — no qualifying county had a week-over-week increase of at least one average daily new case per 100,000 residents. At the other end of the spectrum, one county on this list reported a surge of 163 daily new cases per 100,000 people in just one week, from an average of 78 daily new cases per 100,000 residents two weeks ago to an average of 241 per 100,000 the past week.
Generally, the counties on this list where new cases are increasing the fastest — not just in their state but also nationwide — are in states where the virus is also spreading the fastest, and vice versa. But there are some notable exceptions. Similar to the U.S., Minnesota and Nebraska have recorded increases of fewer than 3 daily new cases per 100,000, week-over-week. Both states, however, have counties that have recorded increases of more than 40 new daily cases per 100,000 compared to the previous week. These are the states with the most and fewest COVID-19 cases.
Click here to see the counties in every state where COVID-19 is growing the fastest

Source: BOB WESTON / iStock via Getty Images
Alabama: Marion County
> Change in daily avg. new COVID-19 cases week over week: +31 per 100,000 people
> Avg. new daily cases in Marion County in 7 days ending July 20: 56 per 100,000
> Avg. new daily cases in Marion County in 7 days ending July 13: 25 per 100,000
> Avg. new daily cases in Alabama in 7 days ending July 20: 36 per 100,000 (5th most)
> Cumulative confirmed COVID-19 cases in Marion County as of July 20: 1,435 per 100,000 people (total: 430)
> COVID-19 related deaths in Marion County as of July 20: 16
> Population: 29,965
> Largest place in Marion County: Hamilton
[in-text-ad]
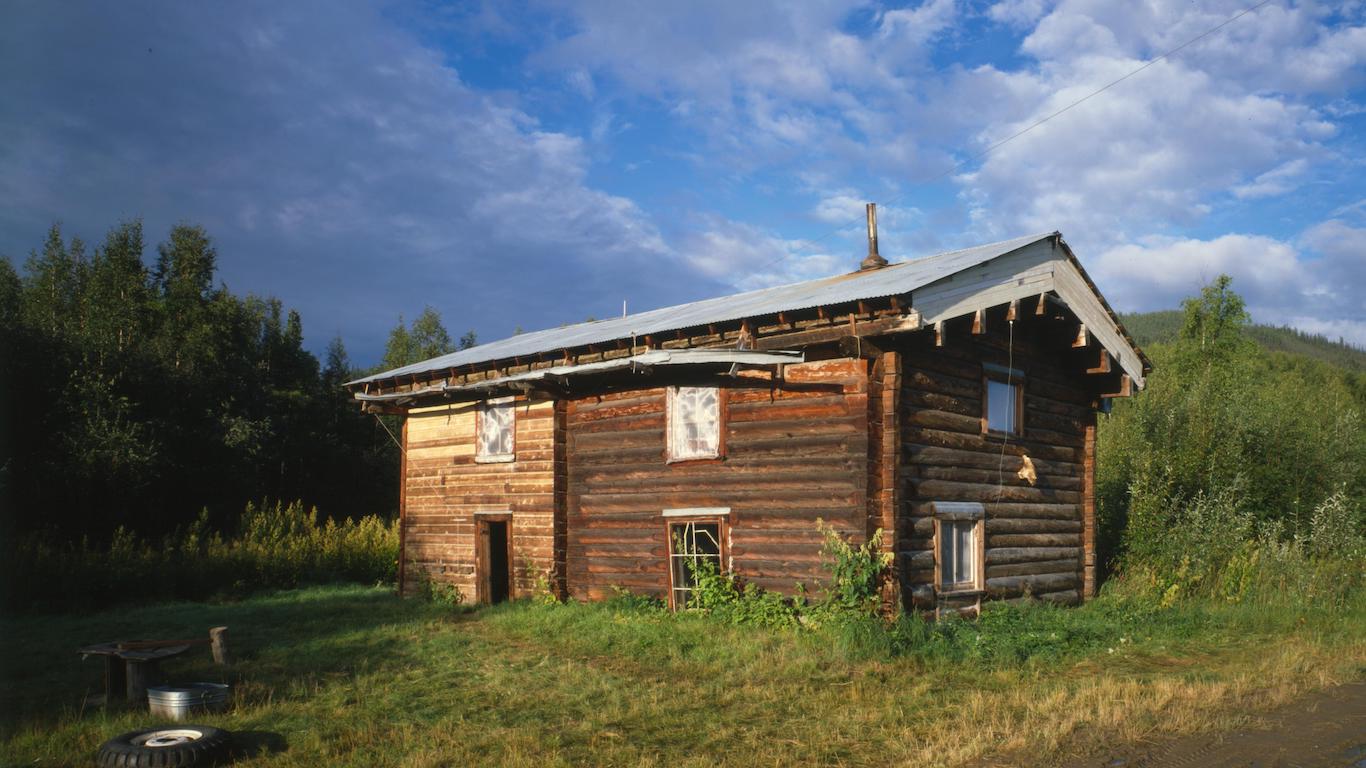
Source: Public Domain / Wikimedia Commons
Alaska: Yukon-Koyukuk Census Area
> Change in daily avg. new COVID-19 cases week over week: +23 per 100,000 people
> Avg. new daily cases in Yukon-Koyukuk Census Area in 7 days ending July 20: 34 per 100,000
> Avg. new daily cases in Yukon-Koyukuk Census Area in 7 days ending July 13: 11 per 100,000
> Avg. new daily cases in Alaska in 7 days ending July 20: 8 per 100,000 (15th fewest)
> Cumulative confirmed COVID-19 cases in Yukon-Koyukuk Census Area as of July 20: 536 per 100,000 people (total: 29)
> COVID-19 related deaths in Yukon-Koyukuk Census Area as of July 20: 0
> Population: 5,415
> Largest place in Yukon-Koyukuk Census Area: Fort Yukon

Source: Terryfic3D / Getty Images
Arizona: Gila County
> Change in daily avg. new COVID-19 cases week over week: +8 per 100,000 people
> Avg. new daily cases in Gila County in 7 days ending July 20: 31 per 100,000
> Avg. new daily cases in Gila County in 7 days ending July 13: 23 per 100,000
> Avg. new daily cases in Arizona in 7 days ending July 20: 45 per 100,000 (2nd most)
> Cumulative confirmed COVID-19 cases in Gila County as of July 20: 1,073 per 100,000 people (total: 573)
> COVID-19 related deaths in Gila County as of July 20: 16
> Population: 53,400
> Largest place in Gila County: Payson

Source: BOB WESTON / iStock via Getty Images
Arkansas: Lincoln County
> Change in daily avg. new COVID-19 cases week over week: +39 per 100,000 people
> Avg. new daily cases in Lincoln County in 7 days ending July 20: 45 per 100,000
> Avg. new daily cases in Lincoln County in 7 days ending July 13: 6 per 100,000
> Avg. new daily cases in Arkansas in 7 days ending July 20: 23 per 100,000 (12th most)
> Cumulative confirmed COVID-19 cases in Lincoln County as of July 20: 8,185 per 100,000 people (total: 1,121)
> COVID-19 related deaths in Lincoln County as of July 20: 11
> Population: 13,695
> Largest place in Lincoln County: Star City
[in-text-ad-2]

Source: DenisTangneyJr / E+ via Getty Images
California: Kern County
> Change in daily avg. new COVID-19 cases week over week: +13 per 100,000 people
> Avg. new daily cases in Kern County in 7 days ending July 20: 29 per 100,000
> Avg. new daily cases in Kern County in 7 days ending July 13: 17 per 100,000
> Avg. new daily cases in California in 7 days ending July 20: 22 per 100,000 (13th most)
> Cumulative confirmed COVID-19 cases in Kern County as of July 20: 1,143 per 100,000 people (total: 10,094)
> COVID-19 related deaths in Kern County as of July 20: 105
> Population: 883,053
> Largest place in Kern County: Bakersfield

Colorado: Chaffee County
> Change in daily avg. new COVID-19 cases week over week: +46 per 100,000 people
> Avg. new daily cases in Chaffee County in 7 days ending July 20: 54 per 100,000
> Avg. new daily cases in Chaffee County in 7 days ending July 13: 9 per 100,000
> Avg. new daily cases in Colorado in 7 days ending July 20: 8 per 100,000 (17th fewest)
> Cumulative confirmed COVID-19 cases in Chaffee County as of July 20: 1,122 per 100,000 people (total: 215)
> COVID-19 related deaths in Chaffee County as of July 20: 19
> Population: 19,164
> Largest place in Chaffee County: Salida
[in-text-ad]

Source: SeanPavonePhoto / Getty Images
Connecticut: No Counties With Increase
> Avg. new daily cases in Connecticut in 7 days ending July 20: 2 per 100,000 (5th fewest)

Source: David Osberg / Getty Images
Delaware: Kent County
> Change in daily avg. new COVID-19 cases week over week: +3 per 100,000 people
> Avg. new daily cases in Kent County in 7 days ending July 20: 10 per 100,000
> Avg. new daily cases in Kent County in 7 days ending July 13: 7 per 100,000
> Avg. new daily cases in Delaware in 7 days ending July 20: 9 per 100,000 (19th fewest)
> Cumulative confirmed COVID-19 cases in Kent County as of July 20: 1,151 per 100,000 people (total: 2,013)
> COVID-19 related deaths in Kent County as of July 20: 95
> Population: 174,822
> Largest place in Kent County: Dover

Source: Courtesy of Ebyabe via Wikimedia Commons
Florida: Columbia County
> Change in daily avg. new COVID-19 cases week over week: +101 per 100,000 people
> Avg. new daily cases in Columbia County in 7 days ending July 20: 126 per 100,000
> Avg. new daily cases in Columbia County in 7 days ending July 13: 25 per 100,000
> Avg. new daily cases in Florida in 7 days ending July 20: 54 per 100,000 (the most)
> Cumulative confirmed COVID-19 cases in Columbia County as of July 20: 1,985 per 100,000 people (total: 1,372)
> COVID-19 related deaths in Columbia County as of July 20: 5
> Population: 69,105
> Largest place in Columbia County: Lake City
[in-text-ad-2]
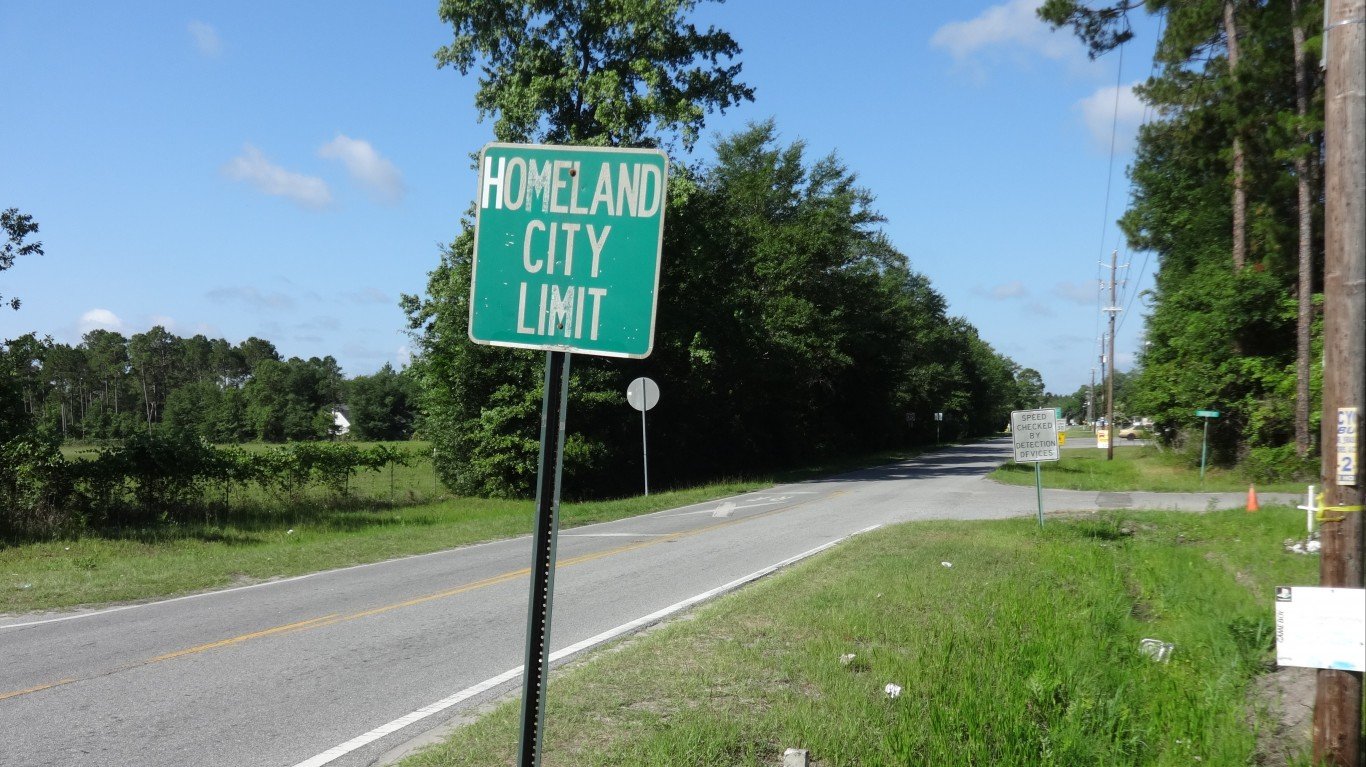
Source: Michael Rivera / Wikimedia Commons
Georgia: Charlton County
> Change in daily avg. new COVID-19 cases week over week: +44 per 100,000 people
> Avg. new daily cases in Charlton County in 7 days ending July 20: 80 per 100,000
> Avg. new daily cases in Charlton County in 7 days ending July 13: 36 per 100,000
> Avg. new daily cases in Georgia in 7 days ending July 20: 33 per 100,000 (6th most)
> Cumulative confirmed COVID-19 cases in Charlton County as of July 20: 1,494 per 100,000 people (total: 194)
> COVID-19 related deaths in Charlton County as of July 20: 2
> Population: 12,983
> Largest place in Charlton County: Folkston

Source: maximkabb / Getty Images
Hawaii: No Counties With Increase
> Avg. new daily cases in Hawaii in 7 days ending July 20: 2 per 100,000 (4th fewest)
[in-text-ad]
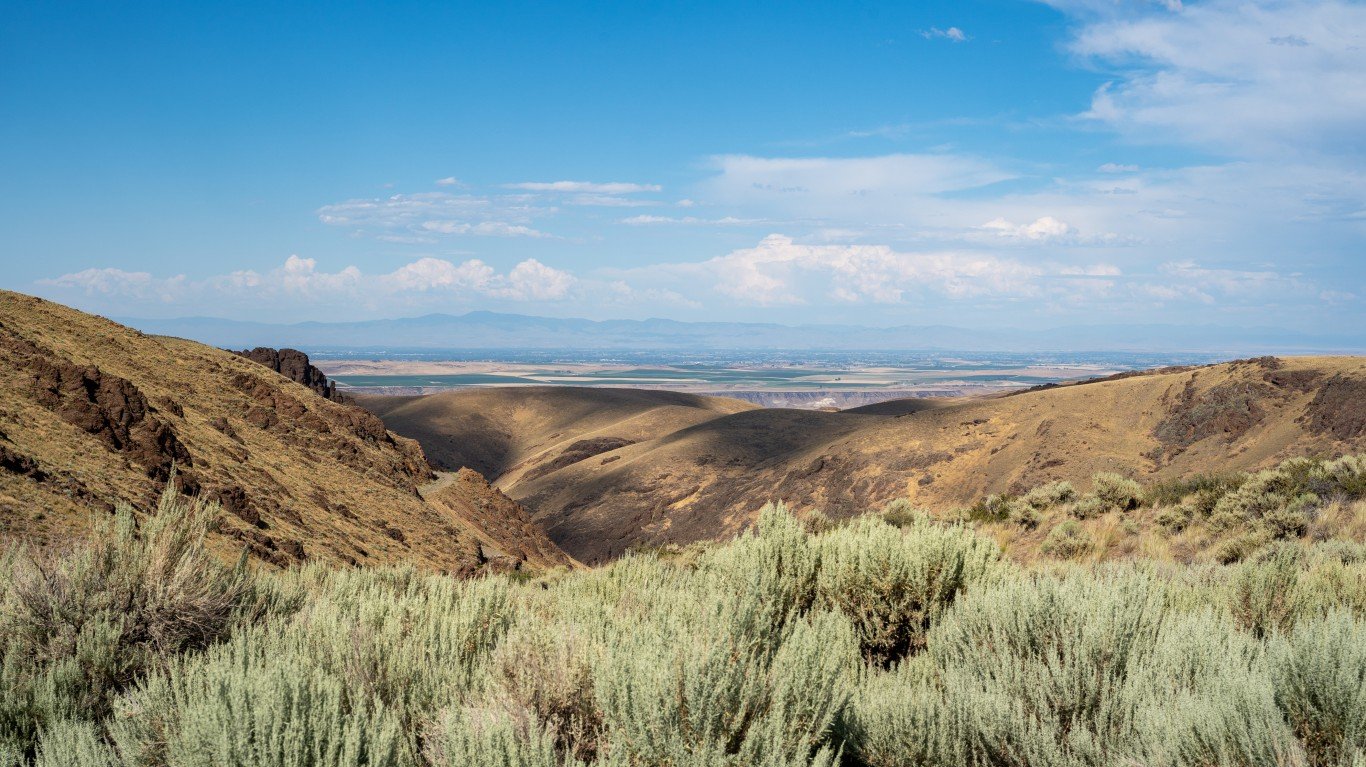
Source: Melissa Kopka / iStock via Getty Images
Idaho: Owyhee County
> Change in daily avg. new COVID-19 cases week over week: +21 per 100,000 people
> Avg. new daily cases in Owyhee County in 7 days ending July 20: 57 per 100,000
> Avg. new daily cases in Owyhee County in 7 days ending July 13: 36 per 100,000
> Avg. new daily cases in Idaho in 7 days ending July 20: 30 per 100,000 (10th most)
> Cumulative confirmed COVID-19 cases in Owyhee County as of July 20: 1,248 per 100,000 people (total: 143)
> COVID-19 related deaths in Owyhee County as of July 20: 0
> Population: 11,455
> Largest place in Owyhee County: Homedale

Source: BOB WESTON / iStock via Getty Images
Illinois: Randolph County
> Change in daily avg. new COVID-19 cases week over week: +14 per 100,000 people
> Avg. new daily cases in Randolph County in 7 days ending July 20: 20 per 100,000
> Avg. new daily cases in Randolph County in 7 days ending July 13: 7 per 100,000
> Avg. new daily cases in Illinois in 7 days ending July 20: 8 per 100,000 (18th fewest)
> Cumulative confirmed COVID-19 cases in Randolph County as of July 20: 1,137 per 100,000 people (total: 370)
> COVID-19 related deaths in Randolph County as of July 20: 7
> Population: 32,546
> Largest place in Randolph County: Chester

Source: Roberto Galan / iStock Editorial via Getty Images
Indiana: Dubois County
> Change in daily avg. new COVID-19 cases week over week: +20 per 100,000 people
> Avg. new daily cases in Dubois County in 7 days ending July 20: 31 per 100,000
> Avg. new daily cases in Dubois County in 7 days ending July 13: 11 per 100,000
> Avg. new daily cases in Indiana in 7 days ending July 20: 10 per 100,000 (21st fewest)
> Cumulative confirmed COVID-19 cases in Dubois County as of July 20: 1,026 per 100,000 people (total: 435)
> COVID-19 related deaths in Dubois County as of July 20: 7
> Population: 42,418
> Largest place in Dubois County: Jasper
[in-text-ad-2]

Source: Nst101 / Wikimedia Commons
Iowa: Guthrie County
> Change in daily avg. new COVID-19 cases week over week: +14 per 100,000 people
> Avg. new daily cases in Guthrie County in 7 days ending July 20: 24 per 100,000
> Avg. new daily cases in Guthrie County in 7 days ending July 13: 11 per 100,000
> Avg. new daily cases in Iowa in 7 days ending July 20: 16 per 100,000 (17th most)
> Cumulative confirmed COVID-19 cases in Guthrie County as of July 20: 965 per 100,000 people (total: 103)
> COVID-19 related deaths in Guthrie County as of July 20: 5
> Population: 10,674
> Largest place in Guthrie County: Guthrie Center

Kansas: Wyandotte County
> Change in daily avg. new COVID-19 cases week over week: +19 per 100,000 people
> Avg. new daily cases in Wyandotte County in 7 days ending July 20: 54 per 100,000
> Avg. new daily cases in Wyandotte County in 7 days ending July 13: 35 per 100,000
> Avg. new daily cases in Kansas in 7 days ending July 20: 16 per 100,000 (18th most)
> Cumulative confirmed COVID-19 cases in Wyandotte County as of July 20: 2,153 per 100,000 people (total: 3,539)
> COVID-19 related deaths in Wyandotte County as of July 20: 0
> Population: 164,345
> Largest place in Wyandotte County: Kansas City
[in-text-ad]

Source: Public Domain / Wikimedia Commons
Kentucky: Casey County
> Change in daily avg. new COVID-19 cases week over week: +25 per 100,000 people
> Avg. new daily cases in Casey County in 7 days ending July 20: 40 per 100,000
> Avg. new daily cases in Casey County in 7 days ending July 13: 15 per 100,000
> Avg. new daily cases in Kentucky in 7 days ending July 20: 10 per 100,000 (20th fewest)
> Cumulative confirmed COVID-19 cases in Casey County as of July 20: 652 per 100,000 people (total: 103)
> COVID-19 related deaths in Casey County as of July 20: 6
> Population: 15,796
> Largest place in Casey County: Liberty

Source: formulanone / Flickr
Louisiana: Red River Parish
> Change in daily avg. new COVID-19 cases week over week: +43 per 100,000 people
> Avg. new daily cases in Red River Parish in 7 days ending July 20: 63 per 100,000
> Avg. new daily cases in Red River Parish in 7 days ending July 13: 20 per 100,000
> Avg. new daily cases in Louisiana in 7 days ending July 20: 42 per 100,000 (3rd most)
> Cumulative confirmed COVID-19 cases in Red River Parish as of July 20: 1,520 per 100,000 people (total: 131)
> COVID-19 related deaths in Red River Parish as of July 20: 9
> Population: 8,618
> Largest place in Red River Parish: Coushatta

Source: SeanPavonePhoto / Getty Images
Maine: No Counties With Increase
> Avg. new daily cases in Maine in 7 days ending July 20: 1 per 100,000 (2nd fewest)
[in-text-ad-2]
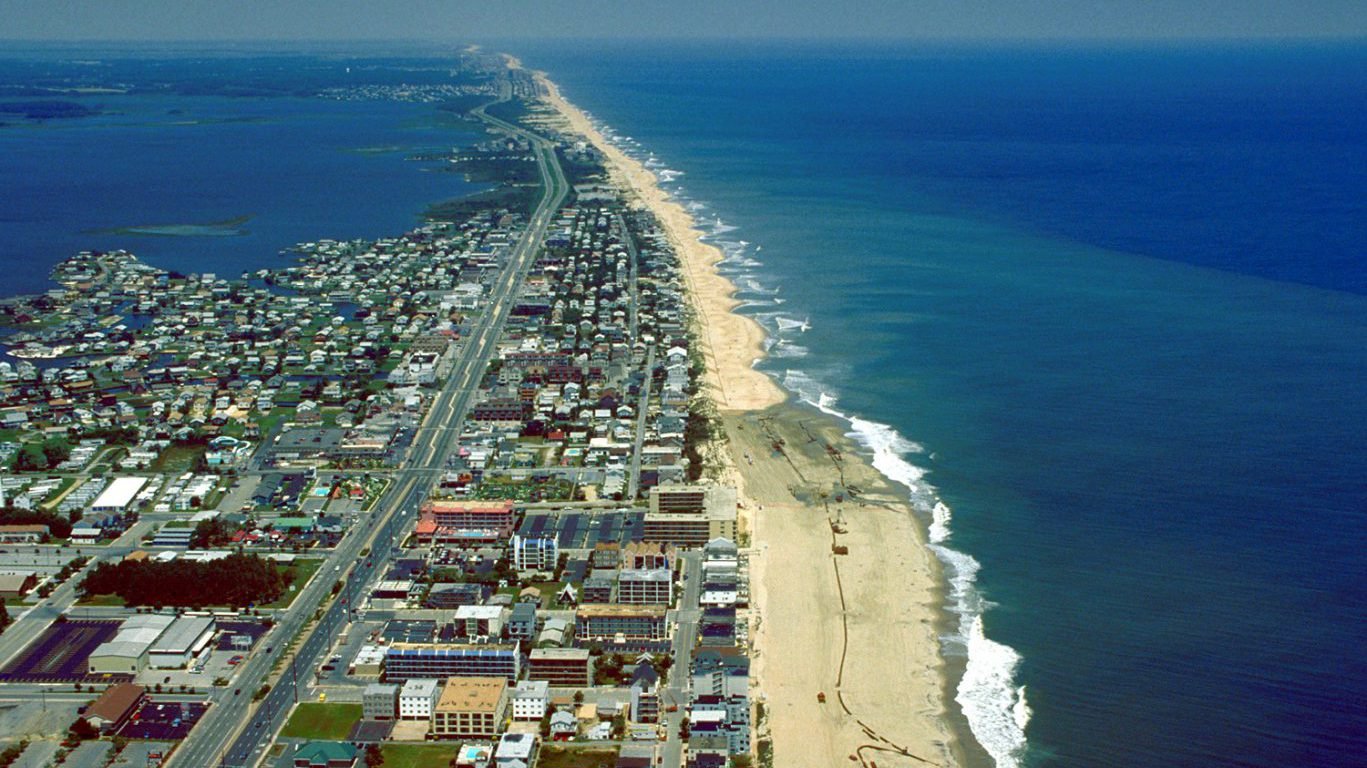
Source: Public Domain / Wikimedia Commons
Maryland: Worcester County
> Change in daily avg. new COVID-19 cases week over week: +10 per 100,000 people
> Avg. new daily cases in Worcester County in 7 days ending July 20: 16 per 100,000
> Avg. new daily cases in Worcester County in 7 days ending July 13: 6 per 100,000
> Avg. new daily cases in Maryland in 7 days ending July 20: 11 per 100,000 (25th fewest)
> Cumulative confirmed COVID-19 cases in Worcester County as of July 20: 809 per 100,000 people (total: 417)
> COVID-19 related deaths in Worcester County as of July 20: 18
> Population: 51,564
> Largest place in Worcester County: Ocean Pines CDP

Source: DenisTangneyJr / iStock via Getty Images
Massachusetts: Bristol County
> Change in daily avg. new COVID-19 cases week over week: +2 per 100,000 people
> Avg. new daily cases in Bristol County in 7 days ending July 20: 5 per 100,000
> Avg. new daily cases in Bristol County in 7 days ending July 13: 3 per 100,000
> Avg. new daily cases in Massachusetts in 7 days ending July 20: 4 per 100,000 (8th fewest)
> Cumulative confirmed COVID-19 cases in Bristol County as of July 20: 1,560 per 100,000 people (total: 8,719)
> COVID-19 related deaths in Bristol County as of July 20: 610
> Population: 558,905
> Largest place in Bristol County: New Bedford
[in-text-ad]

Source: groveb / iStock via Getty Images
Michigan: Gogebic County
> Change in daily avg. new COVID-19 cases week over week: +7 per 100,000 people
> Avg. new daily cases in Gogebic County in 7 days ending July 20: 11 per 100,000
> Avg. new daily cases in Gogebic County in 7 days ending July 13: 4 per 100,000
> Avg. new daily cases in Michigan in 7 days ending July 20: 7 per 100,000 (14th fewest)
> Cumulative confirmed COVID-19 cases in Gogebic County as of July 20: 234 per 100,000 people (total: 36)
> COVID-19 related deaths in Gogebic County as of July 20: 1
> Population: 15,414
> Largest place in Gogebic County: Ironwood

Source: BOB WESTON / iStock via Getty Images
Minnesota: Lincoln County
> Change in daily avg. new COVID-19 cases week over week: +45 per 100,000 people
> Avg. new daily cases in Lincoln County in 7 days ending July 20: 59 per 100,000
> Avg. new daily cases in Lincoln County in 7 days ending July 13: 14 per 100,000
> Avg. new daily cases in Minnesota in 7 days ending July 20: 10 per 100,000 (23rd fewest)
> Cumulative confirmed COVID-19 cases in Lincoln County as of July 20: 824 per 100,000 people (total: 47)
> COVID-19 related deaths in Lincoln County as of July 20: 0
> Population: 5,707
> Largest place in Lincoln County: Tyler
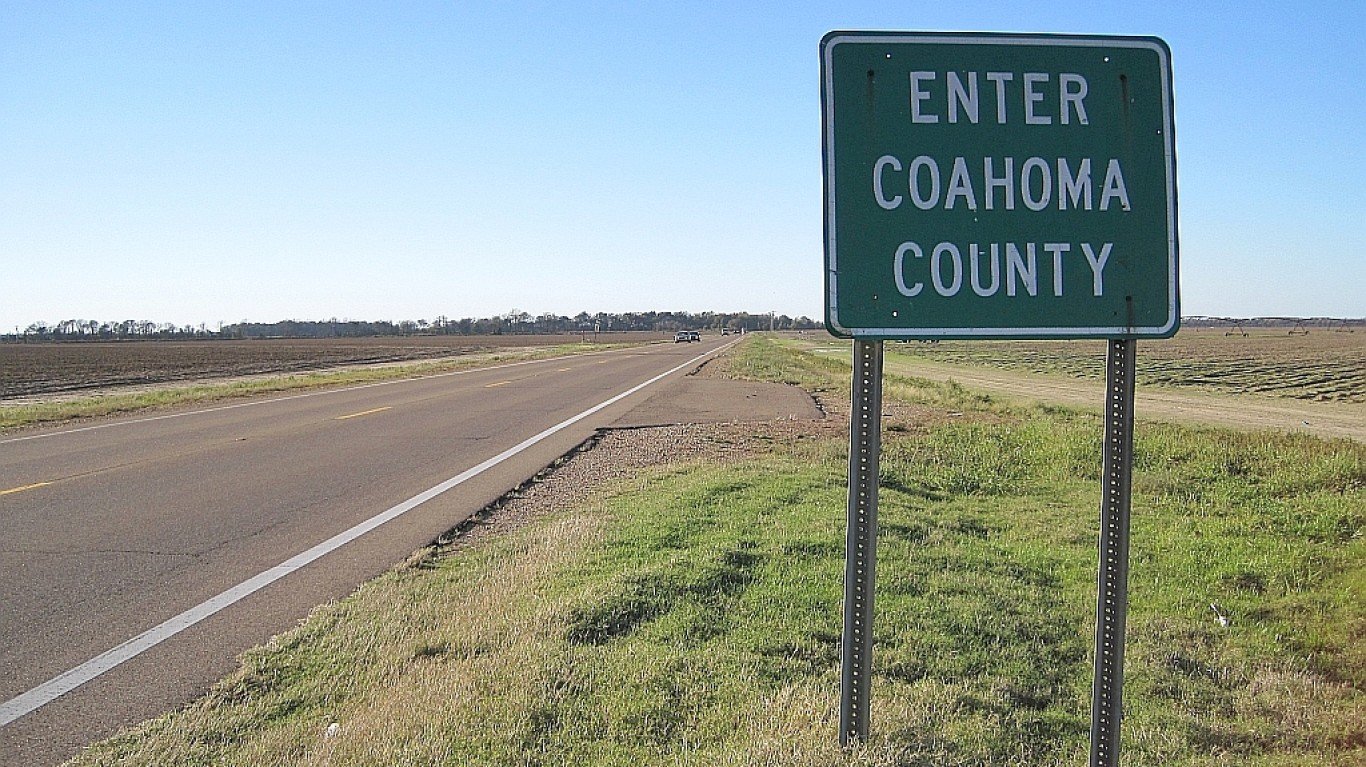
Source: Thomas R Machnitzki ([email protected]) / Wikimedia Commons
Mississippi: Coahoma County
> Change in daily avg. new COVID-19 cases week over week: +35 per 100,000 people
> Avg. new daily cases in Coahoma County in 7 days ending July 20: 51 per 100,000
> Avg. new daily cases in Coahoma County in 7 days ending July 13: 16 per 100,000
> Avg. new daily cases in Mississippi in 7 days ending July 20: 30 per 100,000 (11th most)
> Cumulative confirmed COVID-19 cases in Coahoma County as of July 20: 1,773 per 100,000 people (total: 422)
> COVID-19 related deaths in Coahoma County as of July 20: 7
> Population: 23,802
> Largest place in Coahoma County: Clarksdale
[in-text-ad-2]

Source: Courtesy of Brian Stansberry via Wikimedia Commons
Missouri: New Madrid County
> Change in daily avg. new COVID-19 cases week over week: +27 per 100,000 people
> Avg. new daily cases in New Madrid County in 7 days ending July 20: 31 per 100,000
> Avg. new daily cases in New Madrid County in 7 days ending July 13: 4 per 100,000
> Avg. new daily cases in Missouri in 7 days ending July 20: 12 per 100,000 (22nd most)
> Cumulative confirmed COVID-19 cases in New Madrid County as of July 20: 567 per 100,000 people (total: 101)
> COVID-19 related deaths in New Madrid County as of July 20: 1
> Population: 17,811
> Largest place in New Madrid County: Portageville
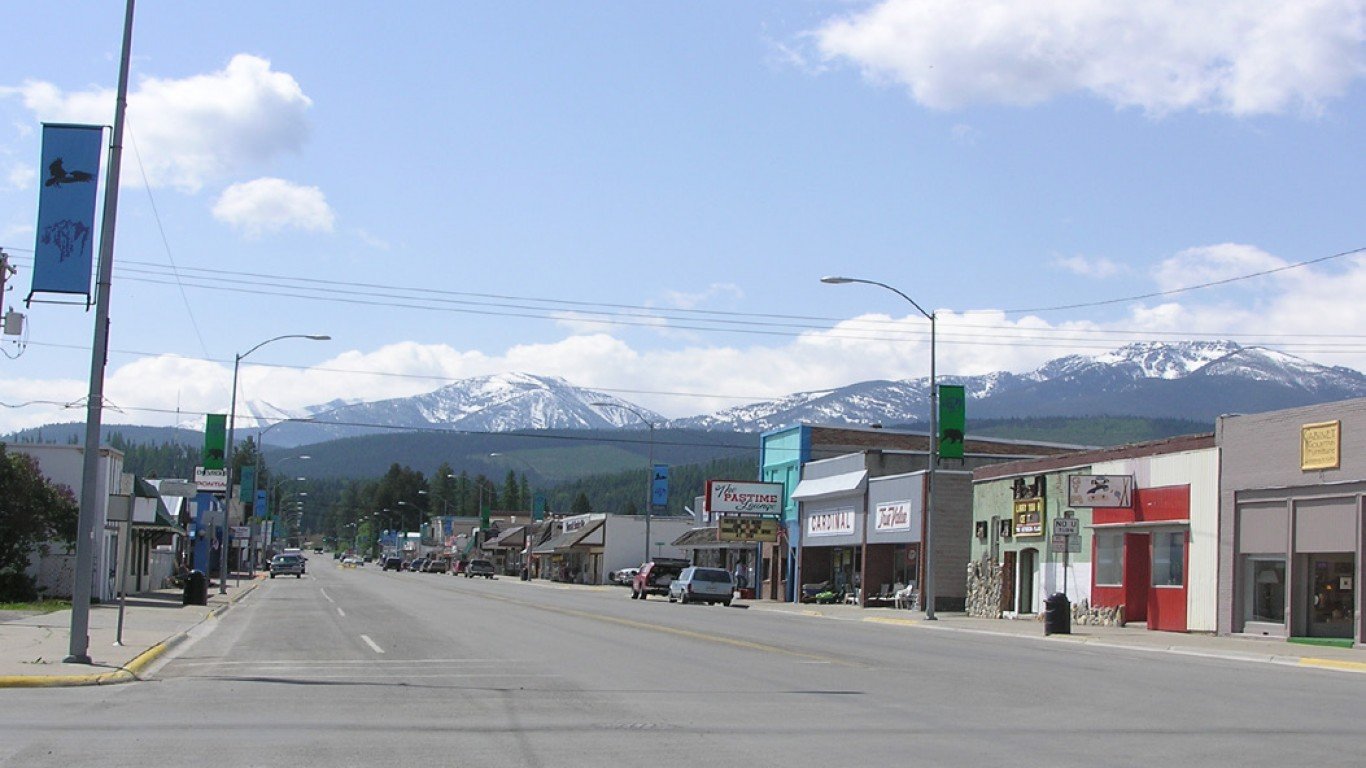
Source: usepagov / Flickr
Montana: Lincoln County
> Change in daily avg. new COVID-19 cases week over week: +16 per 100,000 people
> Avg. new daily cases in Lincoln County in 7 days ending July 20: 21 per 100,000
> Avg. new daily cases in Lincoln County in 7 days ending July 13: 4 per 100,000
> Avg. new daily cases in Montana in 7 days ending July 20: 10 per 100,000 (22nd fewest)
> Cumulative confirmed COVID-19 cases in Lincoln County as of July 20: 248 per 100,000 people (total: 48)
> COVID-19 related deaths in Lincoln County as of July 20: 1
> Population: 19,358
> Largest place in Lincoln County: Libby
[in-text-ad]

Source: Ammodramus / Wikimedia Commons
Nebraska: Dakota County
> Change in daily avg. new COVID-19 cases week over week: +50 per 100,000 people
> Avg. new daily cases in Dakota County in 7 days ending July 20: 59 per 100,000
> Avg. new daily cases in Dakota County in 7 days ending July 13: 9 per 100,000
> Avg. new daily cases in Nebraska in 7 days ending July 20: 11 per 100,000 (24th fewest)
> Cumulative confirmed COVID-19 cases in Dakota County as of July 20: 9,214 per 100,000 people (total: 1,872)
> COVID-19 related deaths in Dakota County as of July 20: 37
> Population: 20,317
> Largest place in Dakota County: South Sioux City
 24/7 Wall St.
Source: LPETTET / Getty Images
Nevada: Clark County
> Change in daily avg. new COVID-19 cases week over week: +6 per 100,000 people
> Avg. new daily cases in Clark County in 7 days ending July 20: 40 per 100,000
> Avg. new daily cases in Clark County in 7 days ending July 13: 33 per 100,000
> Avg. new daily cases in Nevada in 7 days ending July 20: 33 per 100,000 (7th most)
> Cumulative confirmed COVID-19 cases in Clark County as of July 20: 1,421 per 100,000 people (total: 30,432)
> COVID-19 related deaths in Clark County as of July 20: 527
> Population: 2,141,574
> Largest place in Clark County: Las Vegas

Source: AppalachianViews / iStock via Getty Images
New Hampshire: No Counties With Increase
> Avg. new daily cases in New Hampshire in 7 days ending July 20: 2 per 100,000 (3rd fewest)
[in-text-ad-2]
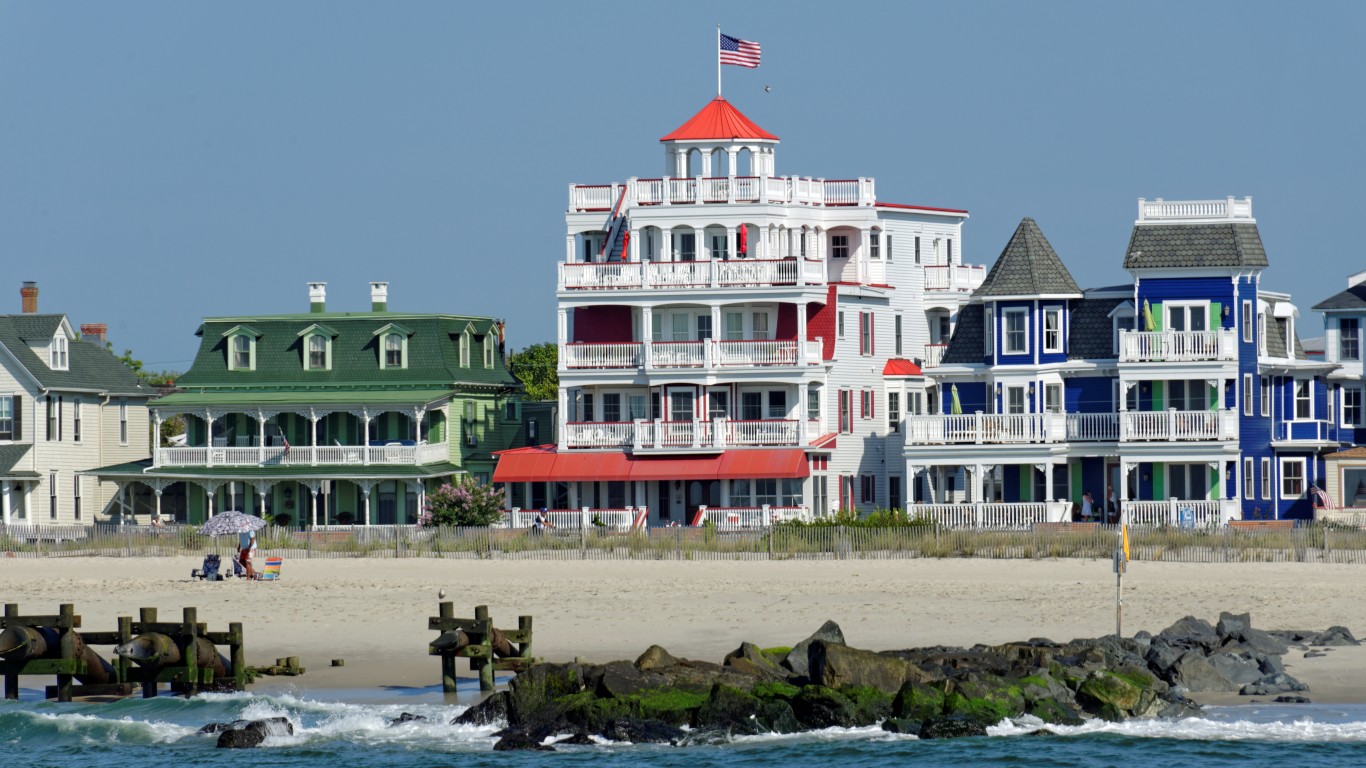
Source: sparhawk4242 / Getty Images
New Jersey: Cape May County
> Change in daily avg. new COVID-19 cases week over week: +2 per 100,000 people
> Avg. new daily cases in Cape May County in 7 days ending July 20: 4 per 100,000
> Avg. new daily cases in Cape May County in 7 days ending July 13: 1 per 100,000
> Avg. new daily cases in New Jersey in 7 days ending July 20: 3 per 100,000 (6th fewest)
> Cumulative confirmed COVID-19 cases in Cape May County as of July 20: 808 per 100,000 people (total: 757)
> COVID-19 related deaths in Cape May County as of July 20: 82
> Population: 93,705
> Largest place in Cape May County: Ocean City

Source: BOB WESTON / iStock via Getty Images
New Mexico: Rio Arriba County
> Change in daily avg. new COVID-19 cases week over week: +6 per 100,000 people
> Avg. new daily cases in Rio Arriba County in 7 days ending July 20: 16 per 100,000
> Avg. new daily cases in Rio Arriba County in 7 days ending July 13: 10 per 100,000
> Avg. new daily cases in New Mexico in 7 days ending July 20: 13 per 100,000 (20th most)
> Cumulative confirmed COVID-19 cases in Rio Arriba County as of July 20: 522 per 100,000 people (total: 205)
> COVID-19 related deaths in Rio Arriba County as of July 20: 1
> Population: 39,307
> Largest place in Rio Arriba County: Española
[in-text-ad]

Source: nancykennedy / iStock via Getty Images
New York: Dutchess County
> Change in daily avg. new COVID-19 cases week over week: +2 per 100,000 people
> Avg. new daily cases in Dutchess County in 7 days ending July 20: 4 per 100,000
> Avg. new daily cases in Dutchess County in 7 days ending July 13: 2 per 100,000
> Avg. new daily cases in New York in 7 days ending July 20: 4 per 100,000 (7th fewest)
> Cumulative confirmed COVID-19 cases in Dutchess County as of July 20: 1,489 per 100,000 people (total: 4,376)
> COVID-19 related deaths in Dutchess County as of July 20: 153
> Population: 293,894
> Largest place in Dutchess County: Poughkeepsie
 24/7 Wall St.
North Carolina: Clay County
> Change in daily avg. new COVID-19 cases week over week: +15 per 100,000 people
> Avg. new daily cases in Clay County in 7 days ending July 20: 16 per 100,000
> Avg. new daily cases in Clay County in 7 days ending July 13: 1 per 100,000
> Avg. new daily cases in North Carolina in 7 days ending July 20: 19 per 100,000 (15th most)
> Cumulative confirmed COVID-19 cases in Clay County as of July 20: 305 per 100,000 people (total: 33)
> COVID-19 related deaths in Clay County as of July 20: 0
> Population: 10,813
> Largest place in Clay County: Hayesville

Source: Courtesy of Andrew Filer via Wikimedia Commons
North Dakota: Mountrail County
> Change in daily avg. new COVID-19 cases week over week: +27 per 100,000 people
> Avg. new daily cases in Mountrail County in 7 days ending July 20: 37 per 100,000
> Avg. new daily cases in Mountrail County in 7 days ending July 13: 10 per 100,000
> Avg. new daily cases in North Dakota in 7 days ending July 20: 12 per 100,000 (21st most)
> Cumulative confirmed COVID-19 cases in Mountrail County as of July 20: 896 per 100,000 people (total: 91)
> COVID-19 related deaths in Mountrail County as of July 20: 1
> Population: 10,152
> Largest place in Mountrail County: Stanley
[in-text-ad-2]

Source: benkrut / iStock via Getty Images
Ohio: Ottawa County
> Change in daily avg. new COVID-19 cases week over week: +12 per 100,000 people
> Avg. new daily cases in Ottawa County in 7 days ending July 20: 25 per 100,000
> Avg. new daily cases in Ottawa County in 7 days ending July 13: 13 per 100,000
> Avg. new daily cases in Ohio in 7 days ending July 20: 11 per 100,000 (23rd most)
> Cumulative confirmed COVID-19 cases in Ottawa County as of July 20: 656 per 100,000 people (total: 267)
> COVID-19 related deaths in Ottawa County as of July 20: 24
> Population: 40,709
> Largest place in Ottawa County: Port Clinton

Source: Wesley Fryer / Flickr
Oklahoma: Jackson County
> Change in daily avg. new COVID-19 cases week over week: +53 per 100,000 people
> Avg. new daily cases in Jackson County in 7 days ending July 20: 60 per 100,000
> Avg. new daily cases in Jackson County in 7 days ending July 13: 7 per 100,000
> Avg. new daily cases in Oklahoma in 7 days ending July 20: 18 per 100,000 (16th most)
> Cumulative confirmed COVID-19 cases in Jackson County as of July 20: 847 per 100,000 people (total: 215)
> COVID-19 related deaths in Jackson County as of July 20: 3
> Population: 25,384
> Largest place in Jackson County: Altus
[in-text-ad]

Oregon: Malheur County
> Change in daily avg. new COVID-19 cases week over week: +20 per 100,000 people
> Avg. new daily cases in Malheur County in 7 days ending July 20: 84 per 100,000
> Avg. new daily cases in Malheur County in 7 days ending July 13: 64 per 100,000
> Avg. new daily cases in Oregon in 7 days ending July 20: 8 per 100,000 (16th fewest)
> Cumulative confirmed COVID-19 cases in Malheur County as of July 20: 1,640 per 100,000 people (total: 499)
> COVID-19 related deaths in Malheur County as of July 20: 5
> Population: 30,431
> Largest place in Malheur County: Ontario
 24/7 Wall St.
Source: BOB WESTON / iStock via Getty Images
Pennsylvania: Mercer County
> Change in daily avg. new COVID-19 cases week over week: +4 per 100,000 people
> Avg. new daily cases in Mercer County in 7 days ending July 20: 6 per 100,000
> Avg. new daily cases in Mercer County in 7 days ending July 13: 2 per 100,000
> Avg. new daily cases in Pennsylvania in 7 days ending July 20: 6 per 100,000 (11th fewest)
> Cumulative confirmed COVID-19 cases in Mercer County as of July 20: 218 per 100,000 people (total: 245)
> COVID-19 related deaths in Mercer County as of July 20: 8
> Population: 112,630
> Largest place in Mercer County: Hermitage

Source: DenisTangneyJr / iStock via Getty Images
Rhode Island: Providence County
> Change in daily avg. new COVID-19 cases week over week: +8 per 100,000 people
> Avg. new daily cases in Providence County in 7 days ending July 20: 12 per 100,000
> Avg. new daily cases in Providence County in 7 days ending July 13: 3 per 100,000
> Avg. new daily cases in Rhode Island in 7 days ending July 20: 6 per 100,000 (9th fewest)
> Cumulative confirmed COVID-19 cases in Providence County as of July 20: 2,155 per 100,000 people (total: 13,674)
> COVID-19 related deaths in Providence County as of July 20: 0
> Population: 634,533
> Largest place in Providence County: Providence
[in-text-ad-2]

Source: Courtesy of Bamberg County Government
South Carolina: Bamberg County
> Change in daily avg. new COVID-19 cases week over week: +50 per 100,000 people
> Avg. new daily cases in Bamberg County in 7 days ending July 20: 83 per 100,000
> Avg. new daily cases in Bamberg County in 7 days ending July 13: 33 per 100,000
> Avg. new daily cases in South Carolina in 7 days ending July 20: 37 per 100,000 (4th most)
> Cumulative confirmed COVID-19 cases in Bamberg County as of July 20: 2,130 per 100,000 people (total: 311)
> COVID-19 related deaths in Bamberg County as of July 20: 3
> Population: 14,600
> Largest place in Bamberg County: Bamberg

Source: Courtesy of Tobin via Flickr
South Dakota: Lake County
> Change in daily avg. new COVID-19 cases week over week: +17 per 100,000 people
> Avg. new daily cases in Lake County in 7 days ending July 20: 21 per 100,000
> Avg. new daily cases in Lake County in 7 days ending July 13: 5 per 100,000
> Avg. new daily cases in South Dakota in 7 days ending July 20: 7 per 100,000 (13th fewest)
> Cumulative confirmed COVID-19 cases in Lake County as of July 20: 382 per 100,000 people (total: 48)
> COVID-19 related deaths in Lake County as of July 20: 1
> Population: 12,574
> Largest place in Lake County: Madison
[in-text-ad]

Source: Nyttend / Wikimedia Commons
Tennessee: Henderson County
> Change in daily avg. new COVID-19 cases week over week: +22 per 100,000 people
> Avg. new daily cases in Henderson County in 7 days ending July 20: 35 per 100,000
> Avg. new daily cases in Henderson County in 7 days ending July 13: 13 per 100,000
> Avg. new daily cases in Tennessee in 7 days ending July 20: 30 per 100,000 (9th most)
> Cumulative confirmed COVID-19 cases in Henderson County as of July 20: 628 per 100,000 people (total: 175)
> COVID-19 related deaths in Henderson County as of July 20: 0
> Population: 27,859
> Largest place in Henderson County: Lexington
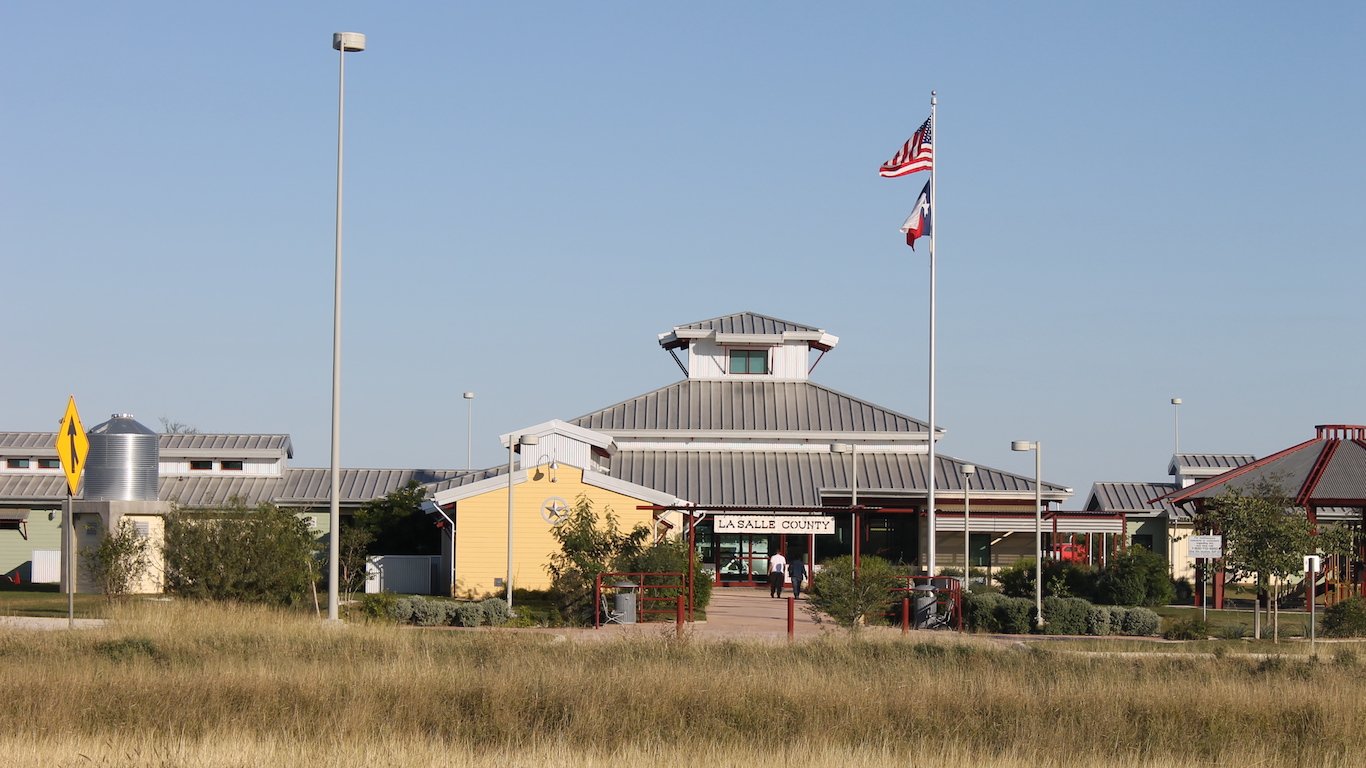
Source: Billy Hathorn / Wikimedia Commons
Texas: La Salle County
> Change in daily avg. new COVID-19 cases week over week: +163 per 100,000 people
> Avg. new daily cases in La Salle County in 7 days ending July 20: 241 per 100,000
> Avg. new daily cases in La Salle County in 7 days ending July 13: 78 per 100,000
> Avg. new daily cases in Texas in 7 days ending July 20: 33 per 100,000 (8th most)
> Cumulative confirmed COVID-19 cases in La Salle County as of July 20: 4,198 per 100,000 people (total: 311)
> COVID-19 related deaths in La Salle County as of July 20: 0
> Population: 7,409
> Largest place in La Salle County: Cotulla

Source: AlexMcGuffie / Getty Images
Utah: San Juan County
> Change in daily avg. new COVID-19 cases week over week: +17 per 100,000 people
> Avg. new daily cases in San Juan County in 7 days ending July 20: 55 per 100,000
> Avg. new daily cases in San Juan County in 7 days ending July 13: 38 per 100,000
> Avg. new daily cases in Utah in 7 days ending July 20: 21 per 100,000 (14th most)
> Cumulative confirmed COVID-19 cases in San Juan County as of July 20: 3,488 per 100,000 people (total: 533)
> COVID-19 related deaths in San Juan County as of July 20: 19
> Population: 15,281
> Largest place in San Juan County: Blanding
[in-text-ad-2]

Source: Sean Pavone / iStock via Getty Images
Vermont: No Counties With Increase
> Avg. new daily cases in Vermont in 7 days ending July 20: 1 per 100,000 (the fewest)

Source: Davel5957 / iStock via Getty Images
Virginia: Portsmouth city
> Change in daily avg. new COVID-19 cases week over week: +18 per 100,000 people
> Avg. new daily cases in Portsmouth city in 7 days ending July 20: 36 per 100,000
> Avg. new daily cases in Portsmouth city in 7 days ending July 13: 17 per 100,000
> Avg. new daily cases in Virginia in 7 days ending July 20: 11 per 100,000 (24th most)
> Cumulative confirmed COVID-19 cases in Portsmouth city as of July 20: 1,059 per 100,000 people (total: 1,009)
> COVID-19 related deaths in Portsmouth city as of July 20: 20
> Population: 95,311
> Largest place in Portsmouth city: Portsmouth
[in-text-ad]

Source: KarenMassier / iStock via Getty Images
Washington: Yakima County
> Change in daily avg. new COVID-19 cases week over week: +15 per 100,000 people
> Avg. new daily cases in Yakima County in 7 days ending July 20: 49 per 100,000
> Avg. new daily cases in Yakima County in 7 days ending July 13: 35 per 100,000
> Avg. new daily cases in Washington in 7 days ending July 20: 11 per 100,000 (25th most)
> Cumulative confirmed COVID-19 cases in Yakima County as of July 20: 3,660 per 100,000 people (total: 9,125)
> COVID-19 related deaths in Yakima County as of July 20: 195
> Population: 249,325
> Largest place in Yakima County: Yakima

Source: Courtesy of Tim Kiser via Wikimedia Commons
West Virginia: Boone County
> Change in daily avg. new COVID-19 cases week over week: +6 per 100,000 people
> Avg. new daily cases in Boone County in 7 days ending July 20: 12 per 100,000
> Avg. new daily cases in Boone County in 7 days ending July 13: 5 per 100,000
> Avg. new daily cases in West Virginia in 7 days ending July 20: 7 per 100,000 (12th fewest)
> Cumulative confirmed COVID-19 cases in Boone County as of July 20: 263 per 100,000 people (total: 60)
> COVID-19 related deaths in Boone County as of July 20: 0
> Population: 22,817
> Largest place in Boone County: Madison

Source: Royalbroil / Wikimedia Commons
Wisconsin: Iron County
> Change in daily avg. new COVID-19 cases week over week: +21 per 100,000 people
> Avg. new daily cases in Iron County in 7 days ending July 20: 30 per 100,000
> Avg. new daily cases in Iron County in 7 days ending July 13: 9 per 100,000
> Avg. new daily cases in Wisconsin in 7 days ending July 20: 14 per 100,000 (19th most)
> Cumulative confirmed COVID-19 cases in Iron County as of July 20: 490 per 100,000 people (total: 28)
> COVID-19 related deaths in Iron County as of July 20: 1
> Population: 5,715
> Largest place in Iron County: Hurley
[in-text-ad-2]

Source: mdesigner125 / iStock via Getty Images
Wyoming: Teton County
> Change in daily avg. new COVID-19 cases week over week: +9 per 100,000 people
> Avg. new daily cases in Teton County in 7 days ending July 20: 20 per 100,000
> Avg. new daily cases in Teton County in 7 days ending July 13: 11 per 100,000
> Avg. new daily cases in Wyoming in 7 days ending July 20: 6 per 100,000 (10th fewest)
> Cumulative confirmed COVID-19 cases in Teton County as of July 20: 902 per 100,000 people (total: 208)
> COVID-19 related deaths in Teton County as of July 20: 1
> Population: 23,059
> Largest place in Teton County: Jackson
Take This Retirement Quiz To Get Matched With A Financial Advisor (Sponsored)
Take the quiz below to get matched with a financial advisor today.
Each advisor has been vetted by SmartAsset and is held to a fiduciary standard to act in your best interests.
Here’s how it works:
1. Answer SmartAsset advisor match quiz
2. Review your pre-screened matches at your leisure. Check out the
advisors’ profiles.
3. Speak with advisors at no cost to you. Have an introductory call on the phone or introduction in person and choose whom to work with in the future
Take the retirement quiz right here.
Thank you for reading! Have some feedback for us?
Contact the 24/7 Wall St. editorial team.
Editors' Picks


