More than 150,000 Americans are confirmed to have died from COVID-19 — by far the highest death count of any country. Within the United States, the extent of the spread varies considerably from state to state, and even from county to county. As the number of daily new cases is flattening or even declining in some parts of the country, it continues to surge at a growing rate in others.
Using data from state and local health departments, 24/7 Wall St. compiled and reviewed the average of new daily confirmed COVID-19 cases for the week ending July 27 and compared it to the average of new daily cases from the previous week to determine the county in each state where the virus is spreading the fastest. We excluded counties with populations of fewer than 5,000 people, as well as those with fewer than 20 reported new cases in the past 14 days.
The average number of new daily cases per capita nationwide has increased only slightly week-over-week, from 19.8 per 100,000 during the week ending July 20 to 20.4 per 100,000 in the week ending July 27, an increase of less than one daily new cases per 100,000 people. Some counties on this list reported relatively modest increases. In four states — Hawaii, Maine, Rhode Island, and Vermont — no qualifying county had a week-over-week increase of at least one average daily new case per 100,000 residents. At the other end of the spectrum, one county on this list reported a surge of 90 daily new cases per 100,000 people in just one week, from an average of 83 daily new cases per 100,000 residents two weeks ago to an average of 172 per 100,000 the past week.
Generally, the counties on this list where new cases are increasing the fastest — not just in their state but also nationwide — are in states where the virus has been spreading the most in recent weeks, and vice versa. As of July 27, week-over-week growth has slowed or even declined in many states, but there are some exceptions, including Mississippi, Louisiana, Missouri, and Georgia. The counties on this list in those four states have had among the worst increases in COVID-19 in the country.
Click here to see the places in every state where COVID-19 is growing the fastest

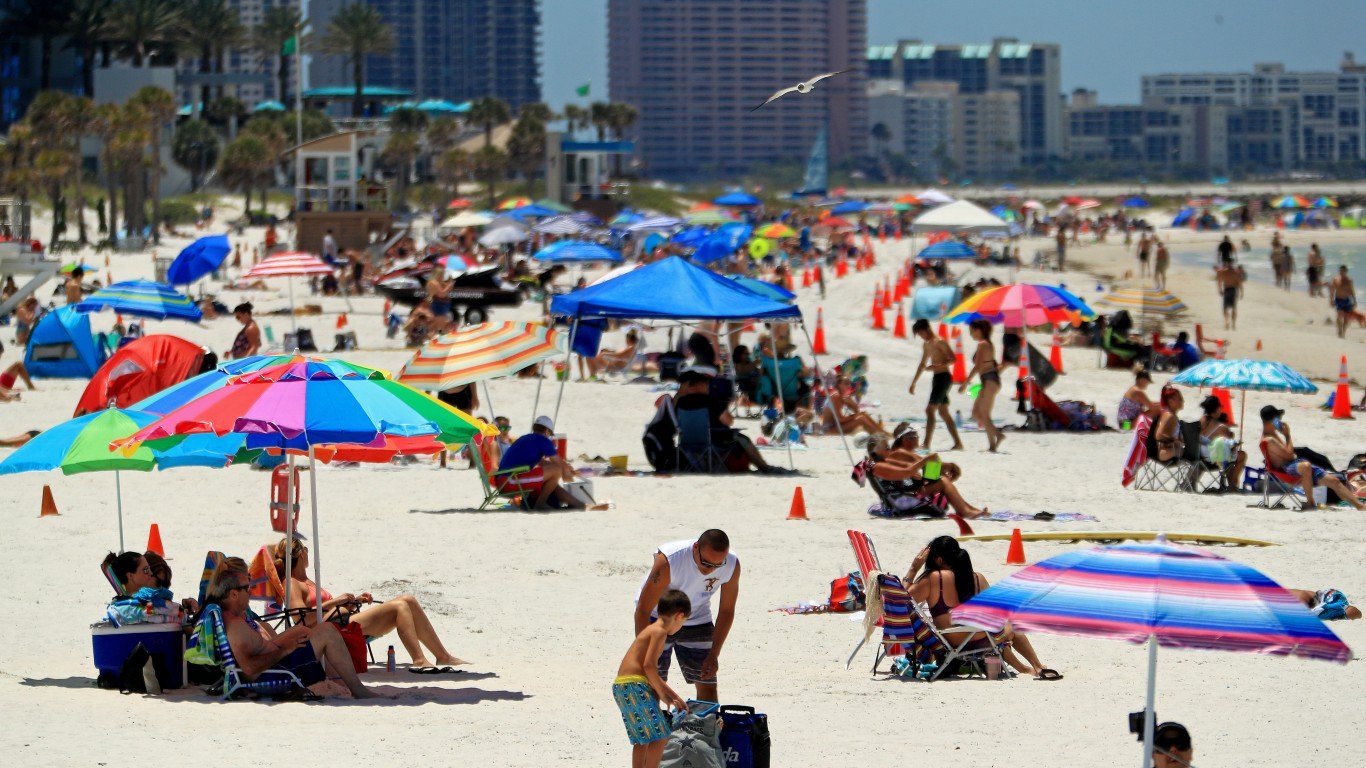
Source: BOB WESTON / iStock via Getty Images
Alabama: Crenshaw County
> Change in daily avg. new COVID-19 cases week over week: +45 per 100,000 people
> Avg. new daily cases in Crenshaw County in 7 days ending July 27: 68 per 100,000
> Avg. new daily cases in Crenshaw County in 7 days ending July 20: 23 per 100,000
> Avg. new daily cases in Alabama in 7 days ending July 27: 35 per 100,000 (7th most)
> Cumulative confirmed COVID-19 cases in Crenshaw County as of July 27: 1,652 per 100,000 people (total: 229)
> Population: 13,865
> Largest place in Crenshaw County: Luverne
[in-text-ad]

Source: Debbie Ann Powell / Getty Images
Alaska: Juneau City and Borough
> Change in daily avg. new COVID-19 cases week over week: +12 per 100,000 people
> Avg. new daily cases in Juneau City and Borough in 7 days ending July 27: 19 per 100,000
> Avg. new daily cases in Juneau City and Borough in 7 days ending July 20: 6 per 100,000
> Avg. new daily cases in Alaska in 7 days ending July 27: 11 per 100,000 (19th fewest)
> Cumulative confirmed COVID-19 cases in Juneau City and Borough as of July 27: 362 per 100,000 people (total: 117)
> Population: 32,330
> Largest place in Juneau City and Borough: Juneau
 24/7 Wall St.
Source: Ammodramus / Wikimedia Commons
Arizona: Santa Cruz County
> Change in daily avg. new COVID-19 cases week over week: +13 per 100,000 people
> Avg. new daily cases in Santa Cruz County in 7 days ending July 27: 58 per 100,000
> Avg. new daily cases in Santa Cruz County in 7 days ending July 20: 46 per 100,000
> Avg. new daily cases in Arizona in 7 days ending July 27: 38 per 100,000 (4th most)
> Cumulative confirmed COVID-19 cases in Santa Cruz County as of July 27: 5,403 per 100,000 people (total: 2,517)
> Population: 46,584
> Largest place in Santa Cruz County: Nogales

Source: Courtesy of Valis55 via Wikimedia Commons
Arkansas: Newton County
> Change in daily avg. new COVID-19 cases week over week: +62 per 100,000 people
> Avg. new daily cases in Newton County in 7 days ending July 27: 71 per 100,000
> Avg. new daily cases in Newton County in 7 days ending July 20: 9 per 100,000
> Avg. new daily cases in Arkansas in 7 days ending July 27: 25 per 100,000 (12th most)
> Cumulative confirmed COVID-19 cases in Newton County as of July 27: 1,083 per 100,000 people (total: 85)
> Population: 7,848
> Largest place in Newton County: Jasper
[in-text-ad-2]

Source: GaryKavanagh / Getty Images
California: Kern County
> Change in daily avg. new COVID-19 cases week over week: +76 per 100,000 people
> Avg. new daily cases in Kern County in 7 days ending July 27: 105 per 100,000
> Avg. new daily cases in Kern County in 7 days ending July 20: 29 per 100,000
> Avg. new daily cases in California in 7 days ending July 27: 25 per 100,000 (13th most)
> Cumulative confirmed COVID-19 cases in Kern County as of July 27: 1,970 per 100,000 people (total: 17,394)
> Population: 883,053
> Largest place in Kern County: Bakersfield

Colorado: Gunnison County
> Change in daily avg. new COVID-19 cases week over week: +11 per 100,000 people
> Avg. new daily cases in Gunnison County in 7 days ending July 27: 16 per 100,000
> Avg. new daily cases in Gunnison County in 7 days ending July 20: 5 per 100,000
> Avg. new daily cases in Colorado in 7 days ending July 27: 9 per 100,000 (16th fewest)
> Cumulative confirmed COVID-19 cases in Gunnison County as of July 27: 1,330 per 100,000 people (total: 220)
> Population: 16,537
> Largest place in Gunnison County: Gunnison
[in-text-ad]

Source: DenisTangneyJr / Getty Images
Connecticut: Fairfield County
> Change in daily avg. new COVID-19 cases week over week: +02 per 100,000 people
> Avg. new daily cases in Fairfield County in 7 days ending July 27: 4 per 100,000
> Avg. new daily cases in Fairfield County in 7 days ending July 20: 2 per 100,000
> Avg. new daily cases in Connecticut in 7 days ending July 27: 3 per 100,000 (5th fewest)
> Cumulative confirmed COVID-19 cases in Fairfield County as of July 27: 1,849 per 100,000 people (total: 17,459)
> Population: 944,348
> Largest place in Fairfield County: Bridgeport

Delaware: Sussex County
> Change in daily avg. new COVID-19 cases week over week: +03 per 100,000 people
> Avg. new daily cases in Sussex County in 7 days ending July 27: 15 per 100,000
> Avg. new daily cases in Sussex County in 7 days ending July 20: 11 per 100,000
> Avg. new daily cases in Delaware in 7 days ending July 27: 12 per 100,000 (22nd fewest)
> Cumulative confirmed COVID-19 cases in Sussex County as of July 27: 2,518 per 100,000 people (total: 5,529)
> Population: 219,540
> Largest place in Sussex County: Seaford
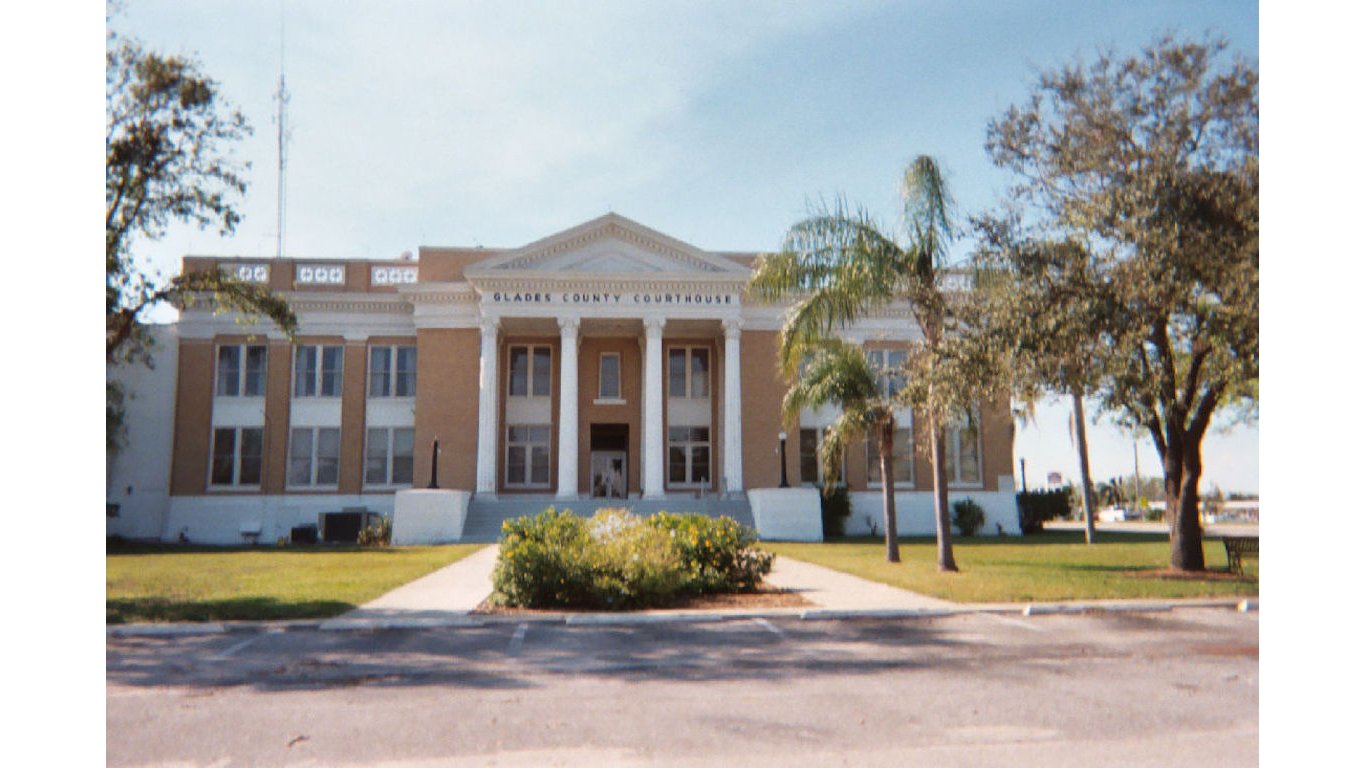
Source: Ebyabe / Wikimedia Commons
Florida: Glades County
> Change in daily avg. new COVID-19 cases week over week: +47 per 100,000 people
> Avg. new daily cases in Glades County in 7 days ending July 27: 95 per 100,000
> Avg. new daily cases in Glades County in 7 days ending July 20: 48 per 100,000
> Avg. new daily cases in Florida in 7 days ending July 27: 51 per 100,000 (the most)
> Cumulative confirmed COVID-19 cases in Glades County as of July 27: 2,866 per 100,000 people (total: 383)
> Population: 13,363
> Largest place in Glades County: Moore Haven
[in-text-ad-2]

Source: BOB WESTON / iStock via Getty Images
Georgia: Wayne County
> Change in daily avg. new COVID-19 cases week over week: +46 per 100,000 people
> Avg. new daily cases in Wayne County in 7 days ending July 27: 104 per 100,000
> Avg. new daily cases in Wayne County in 7 days ending July 20: 58 per 100,000
> Avg. new daily cases in Georgia in 7 days ending July 27: 37 per 100,000 (6th most)
> Cumulative confirmed COVID-19 cases in Wayne County as of July 27: 1,767 per 100,000 people (total: 526)
> Population: 29,767
> Largest place in Wayne County: Jesup

Source: carmengabriela / iStock via Getty Images
Hawaii: No Counties With Increase
> Avg. new daily cases in Hawaii in 7 days ending July 27: 2 per 100,000 (4th fewest)
[in-text-ad]

Source: csfotoimages / iStock Editorial via Getty Images
Idaho: Shoshone County
> Change in daily avg. new COVID-19 cases week over week: +14 per 100,000 people
> Avg. new daily cases in Shoshone County in 7 days ending July 27: 25 per 100,000
> Avg. new daily cases in Shoshone County in 7 days ending July 20: 11 per 100,000
> Avg. new daily cases in Idaho in 7 days ending July 27: 31 per 100,000 (10th most)
> Cumulative confirmed COVID-19 cases in Shoshone County as of July 27: 447 per 100,000 people (total: 56)
> Population: 12,526
> Largest place in Shoshone County: Kellogg

Source: BOB WESTON / iStock via Getty Images
Illinois: Gallatin County
> Change in daily avg. new COVID-19 cases week over week: +32 per 100,000 people
> Avg. new daily cases in Gallatin County in 7 days ending July 27: 50 per 100,000
> Avg. new daily cases in Gallatin County in 7 days ending July 20: 17 per 100,000
> Avg. new daily cases in Illinois in 7 days ending July 27: 10 per 100,000 (18th fewest)
> Cumulative confirmed COVID-19 cases in Gallatin County as of July 27: 717 per 100,000 people (total: 37)
> Population: 5,157
> Largest place in Gallatin County: Shawneetown

Source: William Reagan / iStock via Getty Images
Indiana: Tipton County
> Change in daily avg. new COVID-19 cases week over week: +18 per 100,000 people
> Avg. new daily cases in Tipton County in 7 days ending July 27: 24 per 100,000
> Avg. new daily cases in Tipton County in 7 days ending July 20: 7 per 100,000
> Avg. new daily cases in Indiana in 7 days ending July 27: 12 per 100,000 (24th fewest)
> Cumulative confirmed COVID-19 cases in Tipton County as of July 27: 539 per 100,000 people (total: 82)
> Population: 15,218
> Largest place in Tipton County: Tipton
[in-text-ad-2]
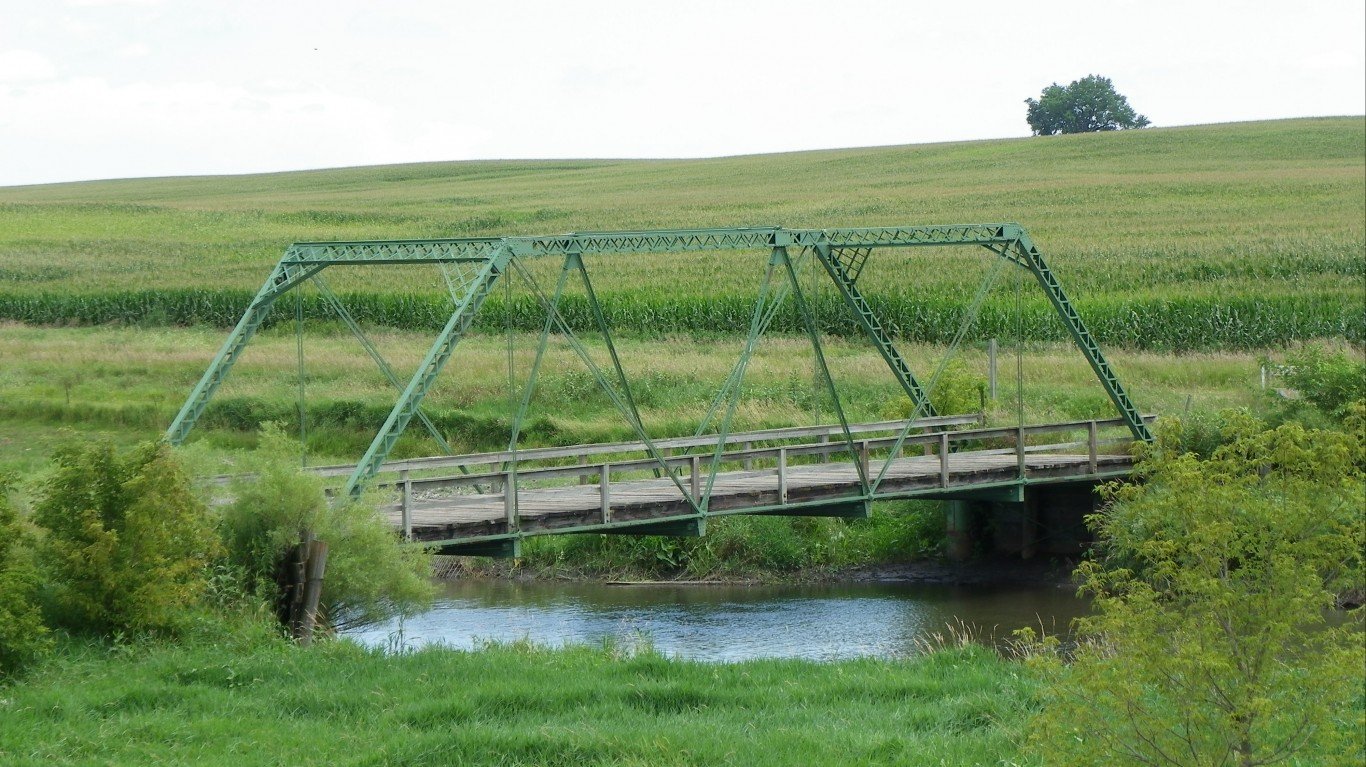
Source: bridgehunterchronicle / Flickr
Iowa: Emmet County
> Change in daily avg. new COVID-19 cases week over week: +16 per 100,000 people
> Avg. new daily cases in Emmet County in 7 days ending July 27: 36 per 100,000
> Avg. new daily cases in Emmet County in 7 days ending July 20: 20 per 100,000
> Avg. new daily cases in Iowa in 7 days ending July 27: 16 per 100,000 (19th most)
> Cumulative confirmed COVID-19 cases in Emmet County as of July 27: 1,508 per 100,000 people (total: 144)
> Population: 9,551
> Largest place in Emmet County: Estherville

Source: kristyfox / Flickr
Kansas: Montgomery County
> Change in daily avg. new COVID-19 cases week over week: +10 per 100,000 people
> Avg. new daily cases in Montgomery County in 7 days ending July 27: 16 per 100,000
> Avg. new daily cases in Montgomery County in 7 days ending July 20: 7 per 100,000
> Avg. new daily cases in Kansas in 7 days ending July 27: 16 per 100,000 (18th most)
> Cumulative confirmed COVID-19 cases in Montgomery County as of July 27: 358 per 100,000 people (total: 118)
> Population: 32,970
> Largest place in Montgomery County: Coffeyville
[in-text-ad]

Source: BOB WESTON / iStock via Getty Images
Kentucky: Harlan County
> Change in daily avg. new COVID-19 cases week over week: +23 per 100,000 people
> Avg. new daily cases in Harlan County in 7 days ending July 27: 39 per 100,000
> Avg. new daily cases in Harlan County in 7 days ending July 20: 16 per 100,000
> Avg. new daily cases in Kentucky in 7 days ending July 27: 13 per 100,000 (23rd most)
> Cumulative confirmed COVID-19 cases in Harlan County as of July 27: 601 per 100,000 people (total: 163)
> Population: 27,134
> Largest place in Harlan County: Cumberland

Source: BOB WESTON / iStock via Getty Images
Louisiana: Allen Parish
> Change in daily avg. new COVID-19 cases week over week: +90 per 100,000 people
> Avg. new daily cases in Allen Parish in 7 days ending July 27: 172 per 100,000
> Avg. new daily cases in Allen Parish in 7 days ending July 20: 83 per 100,000
> Avg. new daily cases in Louisiana in 7 days ending July 27: 47 per 100,000 (2nd most)
> Cumulative confirmed COVID-19 cases in Allen Parish as of July 27: 3,870 per 100,000 people (total: 993)
> Population: 25,661
> Largest place in Allen Parish: Oakdale

Source: SeanPavonePhoto / Getty Images
Maine: No Counties With Increase
> Avg. new daily cases in Maine in 7 days ending July 27: 1 per 100,000 (2nd fewest)
[in-text-ad-2]

Source: Courtesy of Eli Pousson via Wikimedia Commons
Maryland: Dorchester County
> Change in daily avg. new COVID-19 cases week over week: +18 per 100,000 people
> Avg. new daily cases in Dorchester County in 7 days ending July 27: 29 per 100,000
> Avg. new daily cases in Dorchester County in 7 days ending July 20: 11 per 100,000
> Avg. new daily cases in Maryland in 7 days ending July 27: 13 per 100,000 (25th most)
> Cumulative confirmed COVID-19 cases in Dorchester County as of July 27: 989 per 100,000 people (total: 319)
> Population: 32,261
> Largest place in Dorchester County: Cambridge

Source: mamahoohooba / iStock via Getty Images
Massachusetts: Barnstable County
> Change in daily avg. new COVID-19 cases week over week: +02 per 100,000 people
> Avg. new daily cases in Barnstable County in 7 days ending July 27: 4 per 100,000
> Avg. new daily cases in Barnstable County in 7 days ending July 20: 2 per 100,000
> Avg. new daily cases in Massachusetts in 7 days ending July 27: 4 per 100,000 (8th fewest)
> Cumulative confirmed COVID-19 cases in Barnstable County as of July 27: 795 per 100,000 people (total: 1,698)
> Population: 213,690
> Largest place in Barnstable County: Barnstable Town
[in-text-ad]

Source: groveb / iStock via Getty Images
Michigan: Gogebic County
> Change in daily avg. new COVID-19 cases week over week: +14 per 100,000 people
> Avg. new daily cases in Gogebic County in 7 days ending July 27: 25 per 100,000
> Avg. new daily cases in Gogebic County in 7 days ending July 20: 11 per 100,000
> Avg. new daily cases in Michigan in 7 days ending July 27: 7 per 100,000 (11th fewest)
> Cumulative confirmed COVID-19 cases in Gogebic County as of July 27: 402 per 100,000 people (total: 62)
> Population: 15,414
> Largest place in Gogebic County: Ironwood
 24/7 Wall St.
Minnesota: Koochiching County
> Change in daily avg. new COVID-19 cases week over week: +12 per 100,000 people
> Avg. new daily cases in Koochiching County in 7 days ending July 27: 24 per 100,000
> Avg. new daily cases in Koochiching County in 7 days ending July 20: 13 per 100,000
> Avg. new daily cases in Minnesota in 7 days ending July 27: 12 per 100,000 (21st fewest)
> Cumulative confirmed COVID-19 cases in Koochiching County as of July 27: 459 per 100,000 people (total: 58)
> Population: 12,644
> Largest place in Koochiching County: International Falls

Source: BOB WESTON / iStock via Getty Images
Mississippi: Winston County
> Change in daily avg. new COVID-19 cases week over week: +75 per 100,000 people
> Avg. new daily cases in Winston County in 7 days ending July 27: 104 per 100,000
> Avg. new daily cases in Winston County in 7 days ending July 20: 29 per 100,000
> Avg. new daily cases in Mississippi in 7 days ending July 27: 42 per 100,000 (3rd most)
> Cumulative confirmed COVID-19 cases in Winston County as of July 27: 2,631 per 100,000 people (total: 483)
> Population: 18,358
> Largest place in Winston County: Louisville
[in-text-ad-2]

Source: Courtesy of Wroller via Wikimedia Commons
Missouri: Polk County
> Change in daily avg. new COVID-19 cases week over week: +29 per 100,000 people
> Avg. new daily cases in Polk County in 7 days ending July 27: 42 per 100,000
> Avg. new daily cases in Polk County in 7 days ending July 20: 12 per 100,000
> Avg. new daily cases in Missouri in 7 days ending July 27: 18 per 100,000 (17th most)
> Cumulative confirmed COVID-19 cases in Polk County as of July 27: 485 per 100,000 people (total: 153)
> Population: 31,549
> Largest place in Polk County: Bolivar

Montana: Big Horn County
> Change in daily avg. new COVID-19 cases week over week: +34 per 100,000 people
> Avg. new daily cases in Big Horn County in 7 days ending July 27: 64 per 100,000
> Avg. new daily cases in Big Horn County in 7 days ending July 20: 29 per 100,000
> Avg. new daily cases in Montana in 7 days ending July 27: 10 per 100,000 (17th fewest)
> Cumulative confirmed COVID-19 cases in Big Horn County as of July 27: 1,690 per 100,000 people (total: 226)
> Population: 13,376
> Largest place in Big Horn County: Hardin
[in-text-ad]

Source: fotoguy22 / iStock via Getty Images
Nebraska: Dawson County
> Change in daily avg. new COVID-19 cases week over week: +06 per 100,000 people
> Avg. new daily cases in Dawson County in 7 days ending July 27: 13 per 100,000
> Avg. new daily cases in Dawson County in 7 days ending July 20: 7 per 100,000
> Avg. new daily cases in Nebraska in 7 days ending July 27: 13 per 100,000 (24th most)
> Cumulative confirmed COVID-19 cases in Dawson County as of July 27: 3,848 per 100,000 people (total: 916)
> Population: 23,804
> Largest place in Dawson County: Lexington

Source: DougLemke / Getty Images
Nevada: Nye County
> Change in daily avg. new COVID-19 cases week over week: +12 per 100,000 people
> Avg. new daily cases in Nye County in 7 days ending July 27: 23 per 100,000
> Avg. new daily cases in Nye County in 7 days ending July 20: 11 per 100,000
> Avg. new daily cases in Nevada in 7 days ending July 27: 38 per 100,000 (5th most)
> Cumulative confirmed COVID-19 cases in Nye County as of July 27: 698 per 100,000 people (total: 305)
> Population: 43,705
> Largest place in Nye County: Pahrump CDP

Source: DenisTangneyJr / iStock via Getty Images
New Hampshire: Hillsborough County
> Change in daily avg. new COVID-19 cases week over week: +02 per 100,000 people
> Avg. new daily cases in Hillsborough County in 7 days ending July 27: 5 per 100,000
> Avg. new daily cases in Hillsborough County in 7 days ending July 20: 3 per 100,000
> Avg. new daily cases in New Hampshire in 7 days ending July 27: 2 per 100,000 (3rd fewest)
> Cumulative confirmed COVID-19 cases in Hillsborough County as of July 27: 893 per 100,000 people (total: 3,669)
> Population: 411,087
> Largest place in Hillsborough County: Manchester
[in-text-ad-2]

New Jersey: Warren County
> Change in daily avg. new COVID-19 cases week over week: +03 per 100,000 people
> Avg. new daily cases in Warren County in 7 days ending July 27: 4 per 100,000
> Avg. new daily cases in Warren County in 7 days ending July 20: 1 per 100,000
> Avg. new daily cases in New Jersey in 7 days ending July 27: 3 per 100,000 (6th fewest)
> Cumulative confirmed COVID-19 cases in Warren County as of July 27: 1,237 per 100,000 people (total: 1,315)
> Population: 106,293
> Largest place in Warren County: Phillipsburg

Source: BOB WESTON / iStock via Getty Images
New Mexico: Rio Arriba County
> Change in daily avg. new COVID-19 cases week over week: +17 per 100,000 people
> Avg. new daily cases in Rio Arriba County in 7 days ending July 27: 33 per 100,000
> Avg. new daily cases in Rio Arriba County in 7 days ending July 20: 16 per 100,000
> Avg. new daily cases in New Mexico in 7 days ending July 27: 14 per 100,000 (22nd most)
> Cumulative confirmed COVID-19 cases in Rio Arriba County as of July 27: 712 per 100,000 people (total: 280)
> Population: 39,307
> Largest place in Rio Arriba County: Española
[in-text-ad]

New York: Jefferson County
> Change in daily avg. new COVID-19 cases week over week: +02 per 100,000 people
> Avg. new daily cases in Jefferson County in 7 days ending July 27: 2 per 100,000
> Avg. new daily cases in Jefferson County in 7 days ending July 20: 1 per 100,000
> Avg. new daily cases in New York in 7 days ending July 27: 4 per 100,000 (7th fewest)
> Cumulative confirmed COVID-19 cases in Jefferson County as of July 27: 112 per 100,000 people (total: 128)
> Population: 114,448
> Largest place in Jefferson County: Watertown

North Carolina: Chowan County
> Change in daily avg. new COVID-19 cases week over week: +24 per 100,000 people
> Avg. new daily cases in Chowan County in 7 days ending July 27: 37 per 100,000
> Avg. new daily cases in Chowan County in 7 days ending July 20: 13 per 100,000
> Avg. new daily cases in North Carolina in 7 days ending July 27: 18 per 100,000 (16th most)
> Cumulative confirmed COVID-19 cases in Chowan County as of July 27: 732 per 100,000 people (total: 104)
> Population: 14,205
> Largest place in Chowan County: Edenton
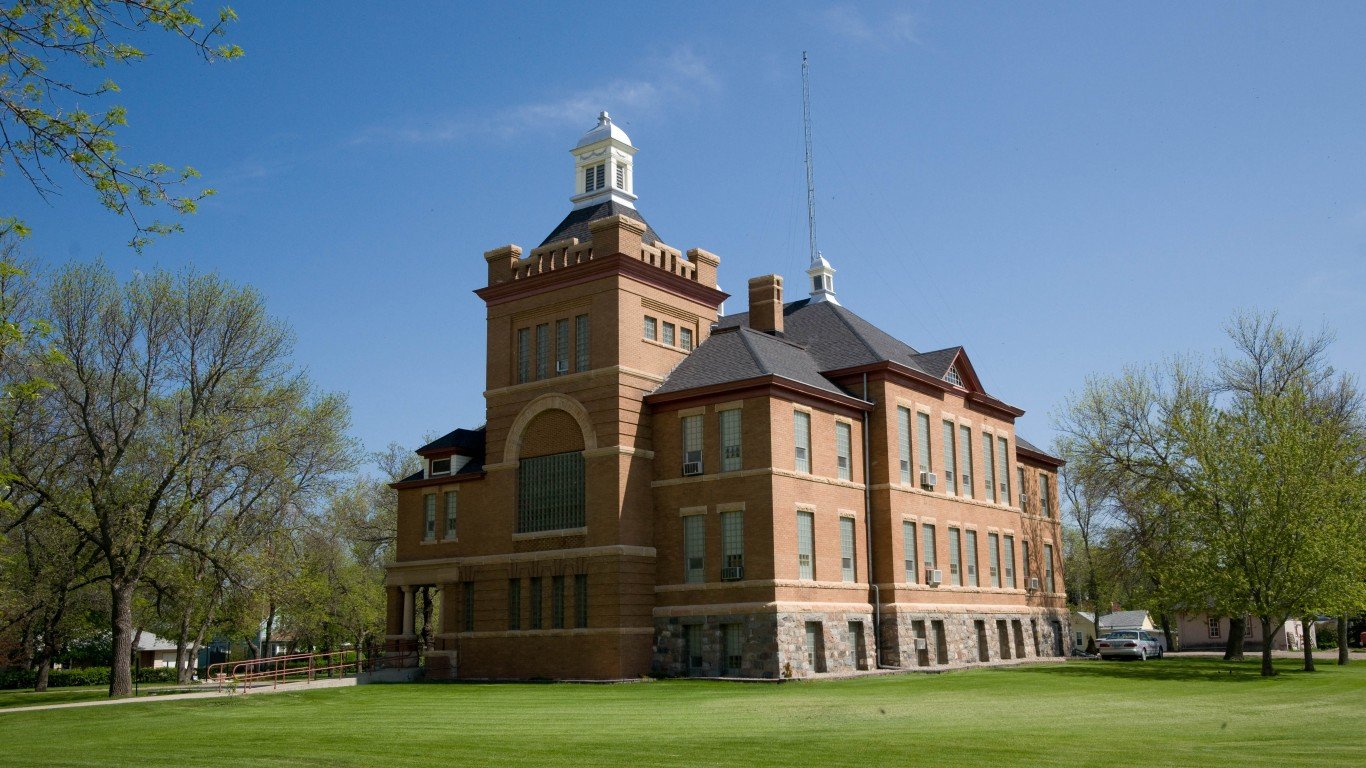
Source: By Andrew Filer - Flickr: Minnewaukan, North Dakota, CC BY-SA 2.0, https://commons.wikimedia.org/w/index.php?curid=27346716
North Dakota: Benson County
> Change in daily avg. new COVID-19 cases week over week: +33 per 100,000 people
> Avg. new daily cases in Benson County in 7 days ending July 27: 50 per 100,000
> Avg. new daily cases in Benson County in 7 days ending July 20: 17 per 100,000
> Avg. new daily cases in North Dakota in 7 days ending July 27: 15 per 100,000 (21st most)
> Cumulative confirmed COVID-19 cases in Benson County as of July 27: 958 per 100,000 people (total: 66)
> Population: 6,886
> Largest place in Benson County: Fort Totten CDP
[in-text-ad-2]

Source: Public Domain
Ohio: Mercer County
> Change in daily avg. new COVID-19 cases week over week: +19 per 100,000 people
> Avg. new daily cases in Mercer County in 7 days ending July 27: 29 per 100,000
> Avg. new daily cases in Mercer County in 7 days ending July 20: 10 per 100,000
> Avg. new daily cases in Ohio in 7 days ending July 27: 11 per 100,000 (20th fewest)
> Cumulative confirmed COVID-19 cases in Mercer County as of July 27: 1,100 per 100,000 people (total: 449)
> Population: 40,806
> Largest place in Mercer County: Celina

Source: BOB WESTON / iStock via Getty Images
Oklahoma: Hughes County
> Change in daily avg. new COVID-19 cases week over week: +23 per 100,000 people
> Avg. new daily cases in Hughes County in 7 days ending July 27: 29 per 100,000
> Avg. new daily cases in Hughes County in 7 days ending July 20: 6 per 100,000
> Avg. new daily cases in Oklahoma in 7 days ending July 27: 19 per 100,000 (15th most)
> Cumulative confirmed COVID-19 cases in Hughes County as of July 27: 579 per 100,000 people (total: 78)
> Population: 13,460
> Largest place in Hughes County: Holdenville
[in-text-ad]
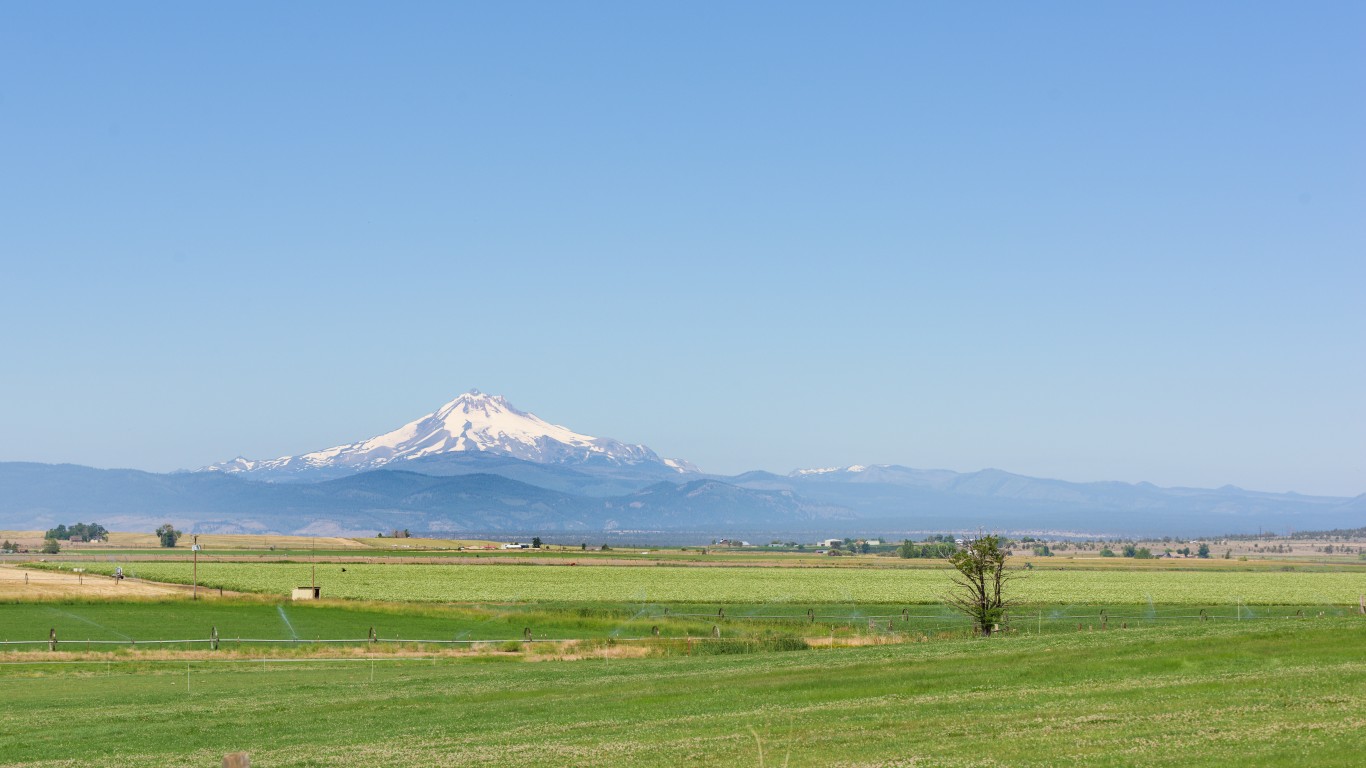
Source: Em Campos / iStock via Getty Images
Oregon: Jefferson County
> Change in daily avg. new COVID-19 cases week over week: +19 per 100,000 people
> Avg. new daily cases in Jefferson County in 7 days ending July 27: 37 per 100,000
> Avg. new daily cases in Jefferson County in 7 days ending July 20: 18 per 100,000
> Avg. new daily cases in Oregon in 7 days ending July 27: 7 per 100,000 (12th fewest)
> Cumulative confirmed COVID-19 cases in Jefferson County as of July 27: 1,154 per 100,000 people (total: 267)
> Population: 23,143
> Largest place in Jefferson County: Madras
 24/7 Wall St.
Pennsylvania: Franklin County
> Change in daily avg. new COVID-19 cases week over week: +06 per 100,000 people
> Avg. new daily cases in Franklin County in 7 days ending July 27: 11 per 100,000
> Avg. new daily cases in Franklin County in 7 days ending July 20: 5 per 100,000
> Avg. new daily cases in Pennsylvania in 7 days ending July 27: 7 per 100,000 (10th fewest)
> Cumulative confirmed COVID-19 cases in Franklin County as of July 27: 781 per 100,000 people (total: 1,201)
> Population: 153,751
> Largest place in Franklin County: Chambersburg

Source: DenisTangneyJr / Getty Images
Rhode Island: No Counties With Increase
> Avg. new daily cases in Rhode Island in 7 days ending July 27: 6 per 100,000 (9th fewest)
[in-text-ad-2]

Source: Courtesy of Ffuhr via Wikimedia Commons
South Carolina: Hampton County
> Change in daily avg. new COVID-19 cases week over week: +30 per 100,000 people
> Avg. new daily cases in Hampton County in 7 days ending July 27: 64 per 100,000
> Avg. new daily cases in Hampton County in 7 days ending July 20: 34 per 100,000
> Avg. new daily cases in South Carolina in 7 days ending July 27: 34 per 100,000 (8th most)
> Cumulative confirmed COVID-19 cases in Hampton County as of July 27: 1,388 per 100,000 people (total: 275)
> Population: 19,807
> Largest place in Hampton County: Estill
Source: BOB WESTON / Getty Images
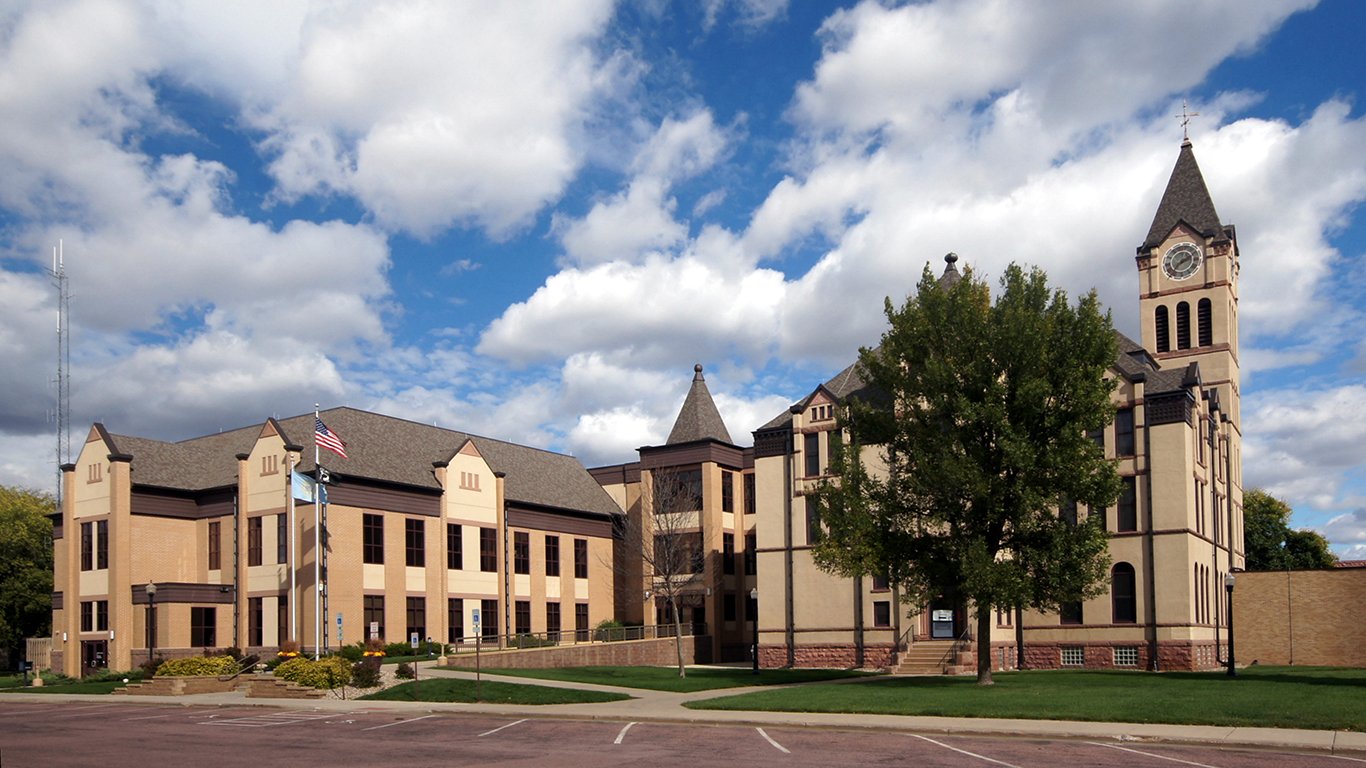
South Dakota: Lincoln County
> Change in daily avg. new COVID-19 cases week over week: +06 per 100,000 people
> Avg. new daily cases in Lincoln County in 7 days ending July 27: 12 per 100,000
> Avg. new daily cases in Lincoln County in 7 days ending July 20: 6 per 100,000
> Avg. new daily cases in South Dakota in 7 days ending July 27: 7 per 100,000 (13th fewest)
> Cumulative confirmed COVID-19 cases in Lincoln County as of July 27: 890 per 100,000 people (total: 489)
> Population: 54,914
> Largest place in Lincoln County: Sioux Falls
[in-text-ad]
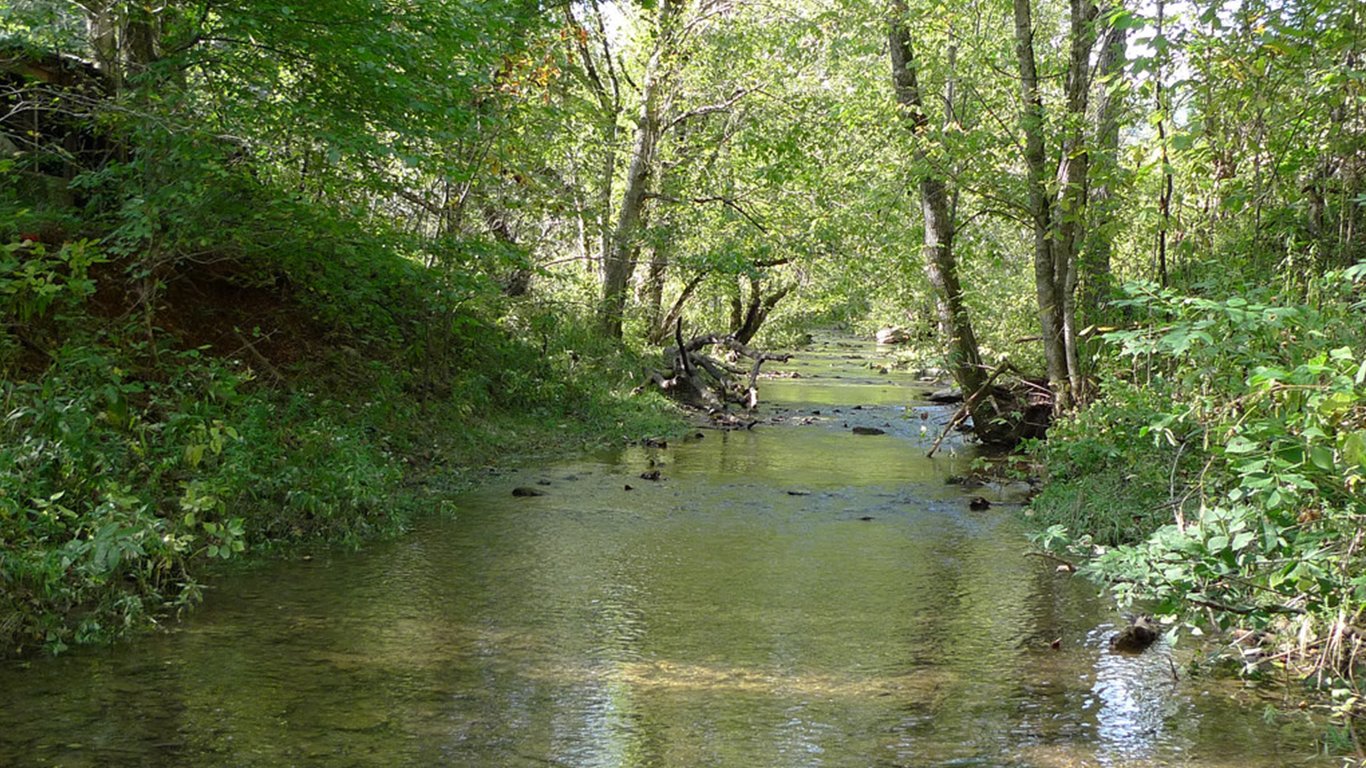
Source: DM / Flickr
Tennessee: Hancock County
> Change in daily avg. new COVID-19 cases week over week: +43 per 100,000 people
> Avg. new daily cases in Hancock County in 7 days ending July 27: 66 per 100,000
> Avg. new daily cases in Hancock County in 7 days ending July 20: 23 per 100,000
> Avg. new daily cases in Tennessee in 7 days ending July 27: 33 per 100,000 (9th most)
> Cumulative confirmed COVID-19 cases in Hancock County as of July 27: 1,033 per 100,000 people (total: 68)
> Population: 6,585
> Largest place in Hancock County: Sneedville
 24/7 Wall St.
Source: LaVonna Moore / iStock via Getty Images
Texas: Refugio County
> Change in daily avg. new COVID-19 cases week over week: +76 per 100,000 people
> Avg. new daily cases in Refugio County in 7 days ending July 27: 126 per 100,000
> Avg. new daily cases in Refugio County in 7 days ending July 20: 50 per 100,000
> Avg. new daily cases in Texas in 7 days ending July 27: 29 per 100,000 (11th most)
> Cumulative confirmed COVID-19 cases in Refugio County as of July 27: 2,156 per 100,000 people (total: 156)
> Population: 7,236
> Largest place in Refugio County: Refugio

Source: kenlh / Getty Images
Utah: Utah County
> Change in daily avg. new COVID-19 cases week over week: +03 per 100,000 people
> Avg. new daily cases in Utah County in 7 days ending July 27: 24 per 100,000
> Avg. new daily cases in Utah County in 7 days ending July 20: 21 per 100,000
> Avg. new daily cases in Utah in 7 days ending July 27: 20 per 100,000 (14th most)
> Cumulative confirmed COVID-19 cases in Utah County as of July 27: 1,236 per 100,000 people (total: 7,296)
> Population: 590,440
> Largest place in Utah County: Provo
[in-text-ad-2]

Source: DenisTangneyJr / Getty Images
Vermont: No Counties With Increase
> Avg. new daily cases in Vermont in 7 days ending July 27: 1 per 100,000 (the fewest)

Source: John M. Chase / iStock Unreleased via Getty Images
Virginia: Patrick County
> Change in daily avg. new COVID-19 cases week over week: +16 per 100,000 people
> Avg. new daily cases in Patrick County in 7 days ending July 27: 21 per 100,000
> Avg. new daily cases in Patrick County in 7 days ending July 20: 5 per 100,000
> Avg. new daily cases in Virginia in 7 days ending July 27: 12 per 100,000 (23rd fewest)
> Cumulative confirmed COVID-19 cases in Patrick County as of July 27: 554 per 100,000 people (total: 99)
> Population: 17,859
> Largest place in Patrick County: Patrick Springs CDP
[in-text-ad]

Washington: Okanogan County
> Change in daily avg. new COVID-19 cases week over week: +54 per 100,000 people
> Avg. new daily cases in Okanogan County in 7 days ending July 27: 92 per 100,000
> Avg. new daily cases in Okanogan County in 7 days ending July 20: 38 per 100,000
> Avg. new daily cases in Washington in 7 days ending July 27: 12 per 100,000 (25th fewest)
> Cumulative confirmed COVID-19 cases in Okanogan County as of July 27: 1,525 per 100,000 people (total: 635)
> Population: 41,638
> Largest place in Okanogan County: Omak

Source: Famartin / Wikimedia Commons
West Virginia: Mingo County
> Change in daily avg. new COVID-19 cases week over week: +15 per 100,000 people
> Avg. new daily cases in Mingo County in 7 days ending July 27: 24 per 100,000
> Avg. new daily cases in Mingo County in 7 days ending July 20: 8 per 100,000
> Avg. new daily cases in West Virginia in 7 days ending July 27: 7 per 100,000 (14th fewest)
> Cumulative confirmed COVID-19 cases in Mingo County as of July 27: 420 per 100,000 people (total: 104)
> Population: 24,741
> Largest place in Mingo County: Williamson

Source: Royalbroil / Wikimedia Commons
Wisconsin: Iron County
> Change in daily avg. new COVID-19 cases week over week: +26 per 100,000 people
> Avg. new daily cases in Iron County in 7 days ending July 27: 57 per 100,000
> Avg. new daily cases in Iron County in 7 days ending July 20: 30 per 100,000
> Avg. new daily cases in Wisconsin in 7 days ending July 27: 16 per 100,000 (20th most)
> Cumulative confirmed COVID-19 cases in Iron County as of July 27: 1,085 per 100,000 people (total: 62)
> Population: 5,715
> Largest place in Iron County: Hurley
[in-text-ad-2]

Source: Justinreznick / iStock
Wyoming: Teton County
> Change in daily avg. new COVID-19 cases week over week: +26 per 100,000 people
> Avg. new daily cases in Teton County in 7 days ending July 27: 46 per 100,000
> Avg. new daily cases in Teton County in 7 days ending July 20: 20 per 100,000
> Avg. new daily cases in Wyoming in 7 days ending July 27: 8 per 100,000 (15th fewest)
> Cumulative confirmed COVID-19 cases in Teton County as of July 27: 1,266 per 100,000 people (total: 292)
> Population: 23,059
> Largest place in Teton County: Jackson
Sponsored: Attention Savvy Investors: Speak to 3 Financial Experts – FREE
Ever wanted an extra set of eyes on an investment you’re considering? Now you can speak with up to 3 financial experts in your area for FREE. By simply
clicking here you can begin to match with financial professionals who can help guide you through the financial decisions you’re making. And the best part? The first conversation with them is free.
Click here to match with up to 3 financial pros who would be excited to help you make financial decisions.
Thank you for reading! Have some feedback for us?
Contact the 24/7 Wall St. editorial team.
Editors' Picks


