About 18.9 million Americans — 11.4% of the workforce — either switch occupations or exit the labor force entirely each year. Many of these workers may have made the choice to leave their jobs for a higher-paying job, a better work environment, a career better suited to their skills or interests, or simply to retire. In other cases, these workers may not have had a choice and were either laid off or terminated.
But not all occupations have the same conditions, and conditions in some may encourage more workers to leave — willingly or not. In these occupations, turnover rates far exceed the national average.
Using data from the Bureau of Labor Statistics’ Employment Projections program, 24/7 Wall St. identified the occupations Americans are most likely to lose. Occupations are ranked by their turnover, or separation rate — the annualized share of workers projected to leave the occupation, either to retire or start a new career — voluntarily or not. The separation rates on this list range from to 16.4% to nearly 25%. In the case of a tie, the occupation with more workers ranked higher.
The occupations with the highest turnover tend to share several characteristics. Some of them are physically demanding and can take a toll on workers’ health. Many of them require little in the way of formal education or training and involve simple, repetitive tasks. Additionally, in nearly every job on this list, the median compensation is well below the median salary across all occupations of $39,810. Here is a list of the 25 lowest paying jobs in America.
Other occupations on this list are simply becoming less common. Six of the 24 jobs on this list are projected to have a decline in overall employment from 2018 to 2028. Waning demand for these workers suggests that high turnover rates are more likely to be driven by layoffs.
It is important to note that these projections do not account for the ongoing COVID-19 pandemic. Recent fluctuations in economic activity due to the coronavirus outbreak and efforts to contain it, as well as government relief programs for employers and workers, are likely to have significant impacts on separation rates in coming years. Many of the occupations on this list are in the industries hardest hit by COVID-19, including accommodation and food services, arts, entertainment and recreation, and leisure and hospitality. Here is a complete list of the industries being devastated by the coronavirus.
Click here to see the 24 jobs you are most likely to lose
Click here to read our methodology

Source: kali9 / E+ via Getty Images
24. Crossing guards
> Annual total occupational separations rate, 2018-28: 16.4%
> Employment, 2018: 81,700
> Employment, 2028: 86,300
> 10-yr projected employment chg.: +4,600 (+5.6%)
> Median annual wage: $29,760
According to Bureau of Labor Statistics projections, an average of about 16.4% of all crossing guards working in the United States will leave the job every year through 2028. Of the 1,500 Americans expected to leave the job annually, about 1,100 will likely move on to other occupations and 400 will leave the labor force entirely.
As is the case with the majority of jobs Americans are most likely to quit, crossing guards wages are relatively low. The median wage of a crossing guard is less than $30,000 a year, while the median annual wage across all occupations is about $40,000.
[in-text-ad]

Source: Ridofranz / iStock via Getty Images
23. Fitness trainers and aerobics instructors
> Annual total occupational separations rate, 2018-28: 16.6%
> Employment, 2018: 356,900
> Employment, 2028: 402,500
> 10-yr projected employment chg.: +45,700 (+12.8%)
> Median annual wage: $40,390
Fitness trainers and aerobics instructors is one of several physically demanding occupations to rank on this list. These workers typically conduct training sessions in any number of environments, including gyms, studios, and clients’ homes — often working on nights, weekends, and holidays. Each year through 2028, about 16.6% of fitness trainers and aerobics instructors are projected to leave their job — either retiring or switching careers.
In much of the country, gyms and fitness centers have been shut-down for months as a part of the effort to contain the spread of the coronavirus. Many of these facilities will likely not reopen, and as a result, turnover among fitness trainers and aerobics instructors this year could be far higher than projected.
 24/7 Wall St.
Source: kali9 / E+ / Getty Images
22. Recreation workers
> Annual total occupational separations rate, 2018-28: 16.6%
> Employment, 2018: 408,300
> Employment, 2028: 442,000
> 10-yr projected employment chg.: +33,800 (+8.3%)
> Median annual wage: $26,350
Recreation workers lead activities in summer camps, recreation centers, nursing care facilities, parks, and more. About one in six people in this field are projected to leave the occupation annually between 2018 and 2028, amounting to over 70,600 people per year.
Most of the people leaving their jobs as recreational workers are switching jobs, not leaving the labor force altogether. This may be due in part to the fact that the typical recreation worker earns just $26,350, well below the median annual wage of $39,810 for all jobs.

Source: macniak / iStock via Getty Images
21. Hotel, motel, and resort desk clerks
> Annual total occupational separations rate, 2018-28: 16.9%
> Employment, 2018: 265,400
> Employment, 2028: 248,700
> 10-yr projected employment chg.: -16,700 (-6.3%)
> Median annual wage: $24,470
The number of hotel, motel, and resort desk clerk occupations is projected to decline from 265,400 to 248,700 by 2028. The job’s high turnover rate may be due in part to layoffs, as it is one of six occupations on this list expected to lose jobs by 2028.
Desk clerks are in one of the lowest paying jobs in the country, with a median annual wage of $24,470. It is one of less than two dozen jobs in the country with a median annual wage below $25,000.
[in-text-ad-2]

Source: CoffeeAndMilk / E+ via Getty Images
20. Models
> Annual total occupational separations rate, 2018-28: 17.1%
> Employment, 2018: 3,600
> Employment, 2028: 3,400
> 10-yr projected employment chg.: -200 (-5.7%)
> Median annual wage: $28,350
Models pose for artists and photographers, often to advertise a product. Unlike many jobs with lower turnover, models’ work schedules tend to be inconsistent and less predictable, and the job requires no formal education. Models often must fit within a certain height and weight range. Every year between now and 2028, the BLS projects that about 400 models will retire and another 200 will transfer to a new career.
With the emergence of social media and new marketing strategies, demand for models is projected to decline in the coming years. The number of models working in the United States is projected to decline by 6% between 2018 and 2028.

Source: Deagreez / iStock / Getty Images Plus
19. Demonstrators and product promoters
> Annual total occupational separations rate, 2018-28: 17.1%
> Employment, 2018: 87,400
> Employment, 2028: 92,000
> 10-yr projected employment chg.: +4,600 (+5.2%)
> Median annual wage: $30,930
Demonstrators and product promoters show off merchandise and answer questions for the purpose of creating public interest in buying the product. Many also sell the demonstrated merchandise.
Unlike many of the jobs with high turnover, demonstrators and product promoters are projected to be more likely to leave the labor force entirely than switch occupations. Some 9,100 workers in the occupation are projected to exit the labor force, and 6,300 to transfer to a new occupation each year from 2018 to 2028.
[in-text-ad]

Source: martin-dm / E+ / Getty Images
18. Dining room and cafeteria attendants and bartender helpers
> Annual total occupational separations rate, 2018-28: 17.1%
> Employment, 2018: 465,900
> Employment, 2028: 511,100
> 10-yr projected employment chg.: +45,200 (+9.7%)
> Median annual wage: $23,470
Unlike many of the other jobs with the highest annual turnover, dining room and cafeteria attendants and bartender helpers are projected to have a relatively even amount of workers leaving the profession for another job and those leaving the labor force altogether. Each year from 2018 to 2028, the BLS expects 40,300 of these workers to stop working and 43,200 to transfer to a new occupation.
As a part of the effort to contain the spread of the novel coronavirus, in-door dining facilities and bars have been shut down for months in much of the country. Many of these facilities will likely not reopen, and as a result, turnover among dining room and cafeteria attendants and bartender helpers this year could be far higher than the BLS initially projected.
 24/7 Wall St.
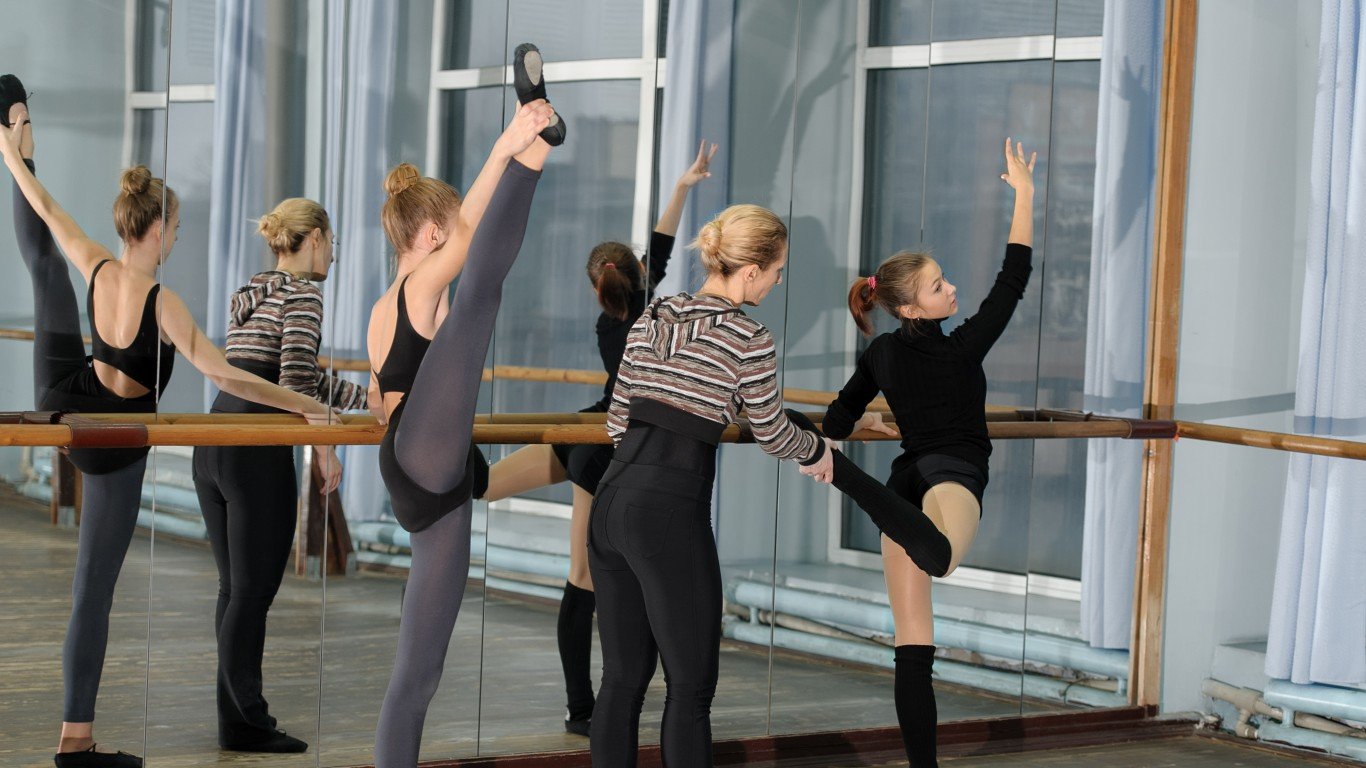
Source: danr13 / iStock via Getty Images
17. Choreographers
> Annual total occupational separations rate, 2018-28: 17.3%
> Employment, 2018: 7,200
> Employment, 2028: 7,000
> 10-yr projected employment chg.: -200 (-2.8%)
> Median annual wage: $46,330
The number of choreographers is projected to decline from 7,200 to 7,000 from 2018 to 2028. The job is one of six occupations on this list expected to lose jobs within 10 years. Waning demand for choreographers in the job market suggests that the occupation’s high projected turnover rate is driven in part by layoffs.
With a median annual wage of $46,330, choreographers have the highest median income of any job with the highest projected annual turnover.

Source: valentinrussanov / E+ / Getty Images
16. Dancers
> Annual total occupational separations rate, 2018-28: 17.3%
> Employment, 2018: 13,900
> Employment, 2028: 14,000
> 10-yr projected employment chg.: +100 (+0.6%)
> Median annual wage: Not available
Dancers can work in a range of environments, from casinos and cruise ships to traveling dance companies and in music videos. The job can take a considerable toll on performers’ bodies, and dancers are among the most likely workers to sustain an injury. The demanding physical nature of the work likely explains why, each year, about 17.3% of dancers — about 2,400 people — in the United States either move on to a new career or leave the workforce entirely.
Across the country, live performances, including those that involve dancers, have been cancelled in an effort to slow the spread of the novel coronavirus. Cancelled performances could contribute to higher turnover among dancers this year than the BLS anticipated in its projections.
[in-text-ad-2]

Source: EvgeniiAnd / iStock via Getty Images
15. Food preparation workers
> Annual total occupational separations rate, 2018-28: 17.3%
> Employment, 2018: 842,100
> Employment, 2028: 911,200
> 10-yr projected employment chg.: +69,100 (+8.2%)
> Median annual wage: $24,800
Food preparation workers are generally not well compensated. Most workers in the occupation earn less than $25,000 per year, well below the U.S. median annual wage for all occupations of $39,810. An estimated 17.3% of workers in the industry will leave it annually between 2018 and 2028, or over 151,000 people a year. Yet the number of jobs in this sector is expected to increase by 8.2% during that time, well above the 5.2% projected employment increase across all jobs.
Like other occupations on this list in the food services industry — one that has been hit particularly hard by the COVID-19 pandemic — food preparation workers may now have a higher turnover rate this year than the BLS originally projected. Restaurants across the country have been closed for months, and many will not reopen.

Source: Pekic / E+ via Getty Images
14. Bartenders
> Annual total occupational separations rate, 2018-28: 17.6%
> Employment, 2018: 644,100
> Employment, 2028: 696,300
> 10-yr projected employment chg.: +52,200 (+8.1%)
> Median annual wage: $23,680
Every year until 2028, just over one in every 10 bartenders working in the United States will transfer to a new occupation, and about one in every 20 will leave the labor force entirely. All told, about 117,900 bartenders are expected to leave their job each year between 2018 and 2028. Bartenders have repetitive and often stressful work. Their work hours can go late into the night and often include shifts on weekends and holidays. As is often the case among the jobs on this list, bartenders are not required to have any formal education.
Bars are among the businesses most likely to remain closed the longest to slow the spread of the novel coronavirus. As a result, bartenders may be more likely to switch to a different line of work during the pandemic, driving the turnover rate this year higher than what the BLS originally projected.
[in-text-ad]

Source: CasarsaGuru / E+ via Getty Images
13. Forest and conservation workers
> Annual total occupational separations rate, 2018-28: 17.7%
> Employment, 2018: 13,900
> Employment, 2028: 13,500
> 10-yr projected employment chg.: -400 (-3.2%)
> Median annual wage: $31,770
No occupation has a higher percentage of its workers transferring to other jobs than forest and conservation workers. Each year by 2028, 14.0% of forest and conservation workers are projected to be in new jobs and just 3.7% are projected to exit the labor force.
The number of forest and conservation jobs is projected to decline from 13,900 to 13,500 — one of six occupations on this list expected to lose jobs by 2028.
 24/7 Wall St.
Source: Juanmonino / Getty Images
12. Combined food preparation and serving workers, including fast food
> Annual total occupational separations rate, 2018-28: 17.8%
> Employment, 2018: 3,704,200
> Employment, 2028: 4,344,300
> 10-yr projected employment chg.: +640,100 (+17.3%)
> Median annual wage: Not available
Only 11 jobs are projected to have a higher annual turnover rate from 2018 to 2028 than combined food preparation and serving workers, at 17.8%. According to the BLS, large occupations typically have more openings than small ones, regardless of growth or replacement needs. Combined food preparation and serving workers, including fast food jobs, are one of the nation’s largest occupations, employing 3.7 million people. The occupation is also projected to be one of the fastest growing, with an anticipated 17.3% increase in total employment — more than triple the projected growth rate for all jobs.
Like other occupations on this list in the food services industry — one that has been hit particularly hard by the COVID-19 pandemic — combined food preparation and serving workers may now have a higher turnover rate than the BLS projected. Restaurants across the country have been closed for months, and many will not reopen.

Source: Rawpixel / iStock / Getty Images Plus
11. Gaming change persons and booth cashiers
> Annual total occupational separations rate, 2018-28: 18.9%
> Employment, 2018: 22,600
> Employment, 2028: 22,800
> 10-yr projected employment chg.: +200 (+0.7%)
> Median annual wage: $25,690
Gaming change persons and booth cashiers exchange chips and tokens for money in casinos. The number of Americans working in this field is projected to remain nearly flat over the next 10 years, increasing by just 0.7%. Nearly 19% of those working in the field will either work in a new job or leave the workforce altogether each year through 2028.
[in-text-ad-2]

Source: Drazen_ / E+ via Getty Images
10. Cashiers
> Annual total occupational separations rate, 2018-28: 18.9%
> Employment, 2018: 3,648,500
> Employment, 2028: 3,509,800
> 10-yr projected employment chg.: -138,700 (-3.8%)
> Median annual wage: $23,650
The number of cashier jobs is projected to decline from over 3.6 million to 3.5 million from 2018 to 2028. The job is one of six occupations on this list expected to lose jobs by 2028. This loss of about 139,000 workers is one of the largest projected declines of any occupation nationwide. Many of those leaving will likely search for a profession with higher wages, as the median annual wage of cashiers of $23,650 is one of the lowest wages of any job.

Source: 6okean / iStock via Getty Images
9. Waiters and waitresses
> Annual total occupational separations rate, 2018-28: 19.2%
> Employment, 2018: 2,634,600
> Employment, 2028: 2,804,800
> 10-yr projected employment chg.: +170,200 (+6.5%)
> Median annual wage: $22,890
Between 2018 and 2028, 19.3% of people working as waiters and waitresses are expected to leave the job each year. Like many jobs on this list, working as a waiter or waitress can be stressful and physically demanding. Those in the job spend most working hours on their feet, often carrying heavy trays in a hectic and fast-paced environment. According to the BLS, large occupations typically have more openings than small ones, regardless of growth or replacement needs. Waiter jobs are one of the nation’s largest occupations, with 2.6 million jobs across the U.S.
The food services industry has been hit harder than most during the COVID-19 pandemic. As a result, waiters and waitresses may be more likely to switch to a different line of work during the pandemic, driving the turnover rate higher than what the BLS projected.
[in-text-ad]

Source: ronstik / iStock / Getty Images Plus
8. Motion picture projectionists
> Annual total occupational separations rate, 2018-28: 19.3%
> Employment, 2018: 4,900
> Employment, 2028: 4,300
> 10-yr projected employment chg.: -600 (-11.6%)
> Median annual wage: $25,150
The BLS projects that 19.3% of all Americans working as motion picture projectionists will leave the job each year until 2028. Many of those separations are likely to be involuntary as the number of jobs in the field is projected to decline by 11.6% from 2018 to 2028. Of the 900 people expected to leave the job each year, about 500 are expected to transfer to another occupation and 400 will likely leave the workforce entirely.
 24/7 Wall St.
Source: pixelfit / Getty Images
7. Counter attendants, cafeteria, food concession, and coffee shop
> Annual total occupational separations rate, 2018-28: 21.7%
> Employment, 2018: 480,200
> Employment, 2028: 496,300
> 10-yr projected employment chg.: +16,000 (+3.3%)
> Median annual wage: Not available
Counter attendants at cafeterias, concessions, and coffee shops are in one of seven occupations with an annual projected separations rate of more than 20% from 2018 to 2028. Like many other jobs with high turnover, the occupation does not require a high level of skill or education. Generally, counter attendant jobs do not have prior work experience or educational requirements.
The food services industry has been hit harder than most during the COVID-19 pandemic, and due to prolonged shutdowns, counter attendants, cafeteria, food concession, and coffee shop workers may be more likely to transition to a different line of work. As a result, the BLS’s projected 21.7% turnover rate may be too low an estimate during the pandemic.

Source: andresr / Getty Images
6. Hosts and hostesses, restaurant, lounge, and coffee shop
> Annual total occupational separations rate, 2018-28: 22.9%
> Employment, 2018: 425,600
> Employment, 2028: 472,700
> 10-yr projected employment chg.: +47,200 (+11.1%)
> Median annual wage: $23,090
Restaurant, lounge, and coffee shop hosts welcome and seat patrons at their establishments. Of the more than 425,000 Americans working in this job, 52,700 are projected to leave it for another job each year through 2028, and another 50,200 are projected to leave the workforce altogether each year. Combined, this means 22.9% of hosts will leave their jobs annually in the next decade.
[in-text-ad-2]

Source: Jub Job / iStock / Getty Images Plus
5. Costume attendants
> Annual total occupational separations rate, 2018-28: 23.0%
> Employment, 2018: 6,700
> Employment, 2028: 7,000
> 10-yr projected employment chg.: +300 (+5.1%)
> Median annual wage: $41,410
Costume attendants typically work in the theater, television, fashion, or film industries, organizing, caring for, and altering costumes for performers or models. With a median annual wage of $41,410, the occupation is one of only a handful on this list where most people earn more than the typical American worker. According to BLS projections, about 1,600 people leave the job each year, voluntarily or otherwise.
Across the country, live performances, including those that involve costume attendants, have been cancelled in an effort to slow the spread of the novel coronavirus. Cancelled performances could contribute to higher turnover among costume attendants this year than the BLS had originally anticipated.

Source: benedek / Getty Images
4. Locker room, coatroom, and dressing room attendants
> Annual total occupational separations rate, 2018-28: 23.0%
> Employment, 2018: 18,500
> Employment, 2028: 19,700
> 10-yr projected employment chg.: +1,200 (+6.7%)
> Median annual wage: $25,110
Locker room, coatroom, and dressing room attendants are among the most likely members of the workforce to leave their job. According to BLS projections, over one in every five Americans working as attendants will either exit the workforce or move to a new line of work every year until 2028.
As is the case with many jobs on this list, locker room, coatroom, and dressing room attendants are not especially well paid. The median annual wage for the occupation is just $25,110, compared to the median of $39,810 across all occupations.
[in-text-ad]

Source: jimd_stock / iStock / Getty Images Plus
3. Amusement and recreation attendants
> Annual total occupational separations rate, 2018-28: 23.0%
> Employment, 2018: 338,600
> Employment, 2028: 364,400
> 10-yr projected employment chg.: +25,800 (+7.6%)
> Median annual wage: $23,370
Amusement and recreation attendants work in places like amusement parks or sports stadiums, performing any number of duties, including selling tickets or concessions, providing information, or directing patrons to their seats. Like many jobs on this list, work in this occupation is often repetitive, and compensation is relatively low. The median annual wage for amusement and recreation attendants is just $23,370 — well below the median of $39,810 across all occupations.
Source: fotostorm / iStock via Getty Images
2. Lifeguards, ski patrol, and other recreational protective service workers
> Annual total occupational separations rate, 2018-28: 24.1%
> Employment, 2018: 151,800
> Employment, 2028: 162,400
> 10-yr projected employment chg.: +10,700 (+7.0%)
> Median annual wage: $23,420
Nearly one in every four people working as lifeguards, ski patrol, or other recreational protective service workers will leave their job in the next year. High turnover in these occupations is likely due in part to the seasonal nature of such jobs.
Like many jobs on this list, occupations in recreational protective services can be stressful and dangerous. These workers are often expected to administer first aid and rescue people from hazardous situations. Compensation is also relatively low. The median annual wage for these occupations is just $23,420 — well below the median of $39,810 across all occupations.

Source: RichLegg / E+ via Getty Images
1. Ushers, lobby attendants, and ticket takers
> Annual total occupational separations rate, 2018-28: 24.3%
> Employment, 2018: 136,400
> Employment, 2028: 140,600
> 10-yr projected employment chg.: +4,200 (+3.1%)
> Median annual wage: $23,500
Ushers, lobby attendants, and ticket takers are more likely to leave their job in the next year, voluntarily or otherwise, than workers in any other occupation. According to the BLS, nearly one in every four Americans in the profession will either exit the workforce or move to a new career in the next year.
The primary responsibilities of ushers, lobby attendants, and ticket takers include collecting admission passes for shows or events, showing patrons to their seats, and looking for lost articles — repetitive work that requires little in the way of training or formal education. The median annual wage for these workers is just $23,500 — well below the median of $39,810 across all occupations. Cancellations of live performances during the COVID-19 pandemic have likely driven many ushers and ticket takers into new careers. The BLS’s projected turnover rate for the profession may therefore be too low to accurately reflect the current reality.
Methodology
To identify the jobs you are most likely to quit, 24/7 Wall St. reviewed the annual average projected job separations rate for the period 2018 to 2028 for over 700 detailed occupations tracked by the Bureau of Labor Statistics’ Employment Projections program. Annual average separation rates represent the percentage of workers projected to permanently leave an occupation each year and are the sum of labor force exits and occupational transfers. Employment projections were released in 2019 and do not reflect the COVID-19 pandemic’s effect on the economy.
Supplemental data on educational attainment rates for 2016 to 2017 and typical education requirements by occupation also came from the BLS Employment Projections program. Median annual wage for each job in 2019 came from the BLS Occupational Employment Statistics program. Seasonally adjusted sector-level separation rates came from the BLS Job Openings and Labor Turnover Survey program.
Total separations includes quits, layoffs and discharges, and other separations. Total separations is referred to as turnover. Quits are generally voluntary separations initiated by the employee. Therefore, the quits rate can serve as a measure of workers’ willingness or ability to leave jobs. Layoffs and discharges are involuntary separations initiated by the employer. Other separations include separations due to retirement, death, disability, and transfers to other locations of the same company.
Take This Retirement Quiz To Get Matched With An Advisor Now (Sponsored)
Are you ready for retirement? Planning for retirement can be overwhelming, that’s why it could be a good idea to speak to a fiduciary financial advisor about your goals today.
Start by taking this retirement quiz right here from SmartAsset that will match you with up to 3 financial advisors that serve your area and beyond in 5 minutes. Smart Asset is now matching over 50,000 people a month.
Click here now to get started.
Thank you for reading! Have some feedback for us?
Contact the 24/7 Wall St. editorial team.
Editors' Picks