More than one-quarter of the 31.4 million Americans who moved last year did so for just a handful of reasons — the desire to live in an area with lower crime, a shorter commute, more affordable housing, or a better job market. These and other factors can make a big difference in overall quality of life.
24/7 Wall St. created a weighted index of 25 measures in four main categories — economy, affordability, quality of life, and community — using data from the U.S. Census Bureau, the FBI, and other sources to identify the best city to live in each state. We considered all boroughs, Census designated places, cities, towns, and villages with at least 8,000 residents.
While household income was not itself a factor in the index, many of the cities and towns on this list are relatively wealthy. This is likely not a coincidence, however, as income is closely tied to several other measures used to create this list, including low crime and low unemployment. Here is a list of the richest town in each state.
Population growth can be a sign that a given area is attractive to new residents and families, and not surprisingly, the majority of cities on this list are home to more people today than five years ago. Well over half of the cities on this list reported greater population growth than the U.S. as a whole between 2014 and 2018. Here is a list of the cities Americans are flocking to.
Click here to see the best cities to live in every state.
Click here to read our methodology.
Source: Rivers Langley / Wikimedia Commons
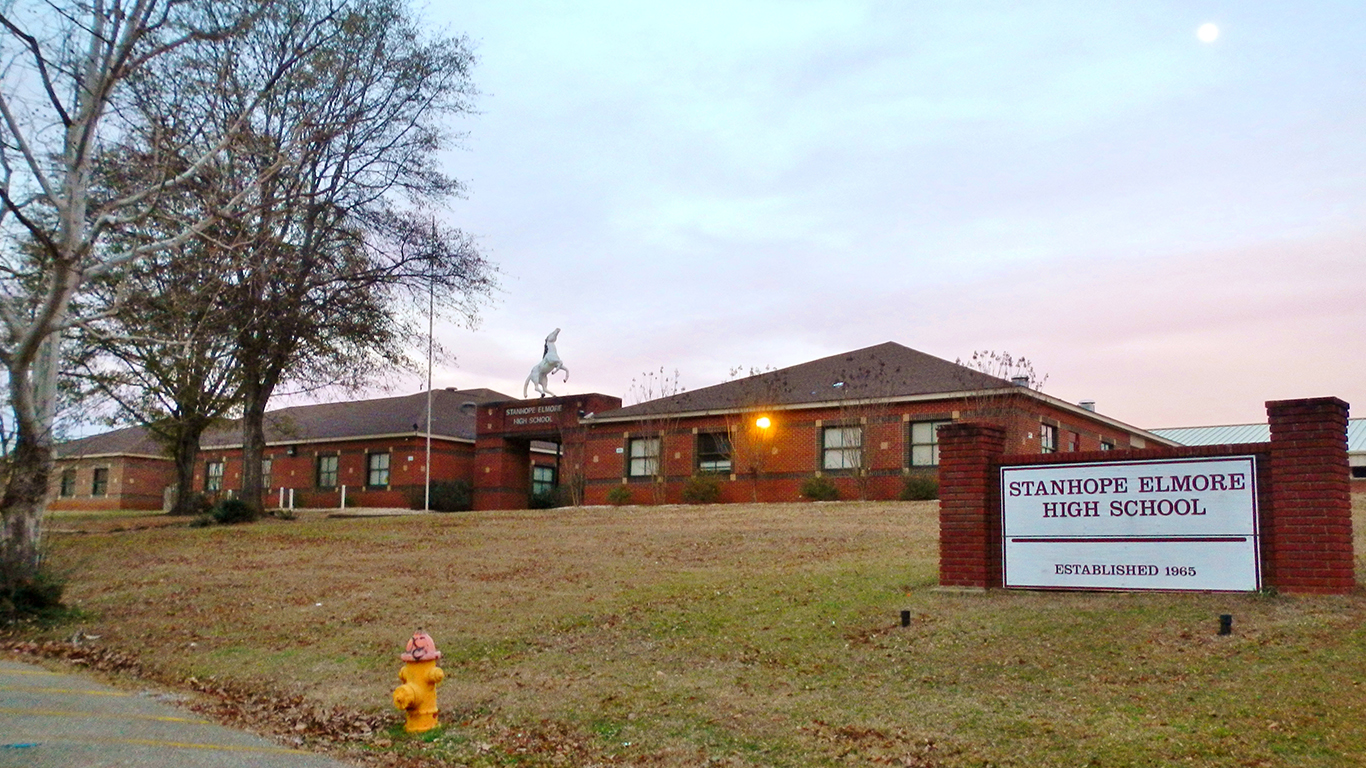
Alabama: Millbrook
> Population: 15,160
> 5 yr. population change: +3.0%
> Median home value: $150,300
> Median household income: $59,443
> 5 yr. avg. unemployment: 3.7%
Based on a weighted index of 25 social and economic measures, Millbrook, a small city of just over 15,000 residents, ranks as the best city to live in Alabama. Millbrook has a low cost of living, and real estate is especially affordable. The median value of homes in the area is only about 2.5 times the median household income. Across the country, the median home value is about 3.4 times the median household income. Millbrook has a relatively low violent crime rate, and the city’s five-year average unemployment rate of 3.7% is well below the comparable national jobless rate of 5.9%.
As is the case in many cities on this list, Millbrook residents have access to jobs and cultural attractions in a larger nearby city. Millbrook is located just 10 miles north of Montgomery, the state capital.
[in-text-ad]

Source: emperorcosar / Shutterstock.com
Alaska: Juneau
> Population: 32,330
> 5 yr. population change: +1.4%
> Median home value: $344,000
> Median household income: $88,213
> 5 yr. avg. unemployment: 5.8%
Juneau, Alaska’s state capital, also ranks as the best city to live in the state. Located along the coast in southern Alaska, Juneau offers a range of attractions, many of which are geared towards those with an appreciation for the outdoors. The area offers beaches, hundreds of miles of hiking and biking trails, glaciers, and access to rivers and the ocean.
Juneau residents are also more likely to be financially secure than most Americans. Most households in the city earn over $88,000 a year, and just 7.9% of the population lives below the poverty line. Nationwide, the typical household earns $60,293 annually, and 14.1% of the population lives in poverty.
 24/7 Wall St.
Source: Focqus, LLC / Getty Images
Arizona: Paradise Valley
> Population: 14,215
> 5 yr. population change: +8.8%
> Median home value: $1,505,300
> Median household income: $204,145
> 5 yr. avg. unemployment: 1.4%
Paradise Valley, located in south-central Arizona, within commuting distance of Phoenix and Scottsdale, ranks as the best place to live in the state. Though most of Paradise Valley is residential, the town is also home to nine resorts, 15 places of worship, 11 schools, three golf courses, and four medical centers.
Like many desirable towns and cities with safe streets and strong job markets, Paradise Valley is not a cheap place to live. Over half of all area homes are worth over $1.5 million.
Source: Brandonrush / Wikimedia Commons
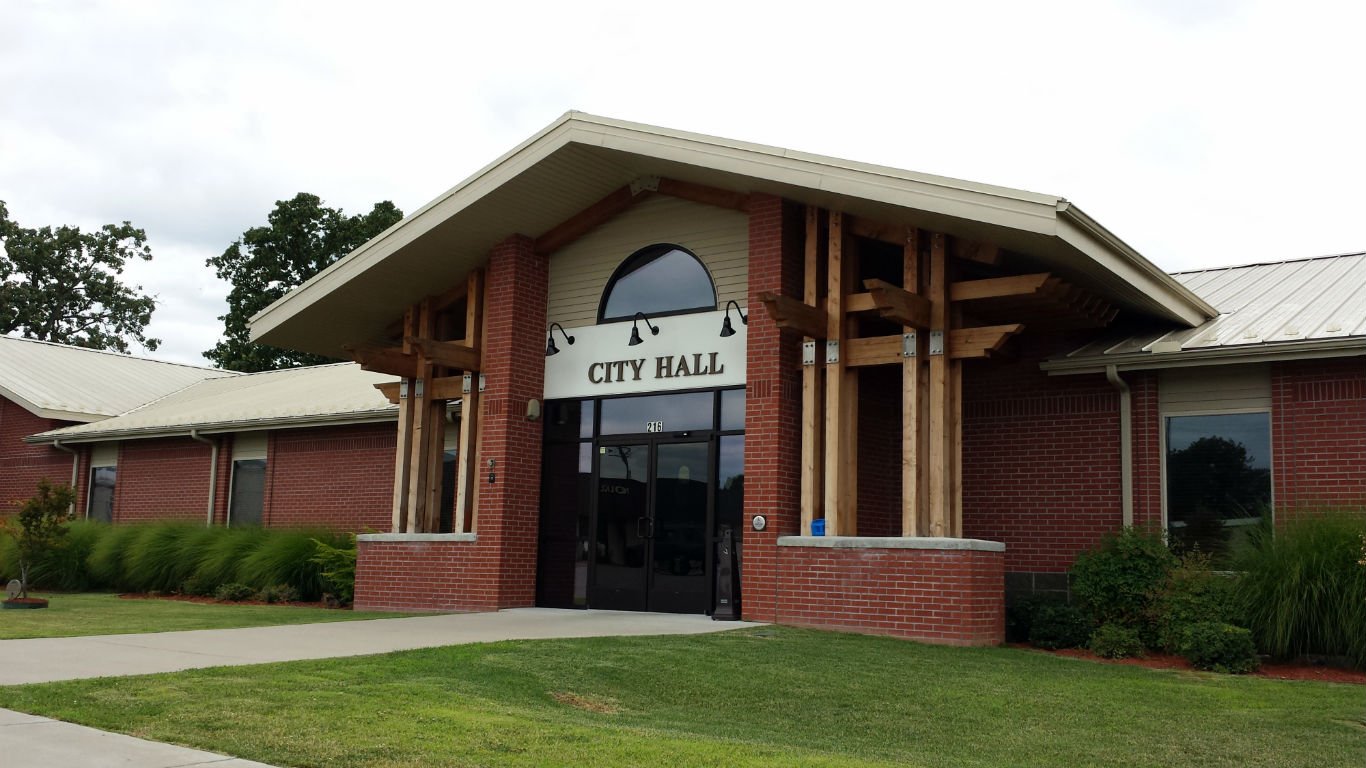
Arkansas: Lowell
> Population: 8,926
> 5 yr. population change: +18.4%
> Median home value: $147,200
> Median household income: $66,994
> 5 yr. avg. unemployment: 1.4%
Lowell is a small city of less than 10,000 people located in Northwestern Arkansas. As is often the case in the cities and towns on this list, Lowell is rapidly growing. Over the past half decade, the number of people living in Lowell increased by 18.4%. Such population growth is common in areas with strong economic conditions, and in Lowell, overall employment has climbed by 22.6% over that time. The city’s average unemployment rate during the same period was just 1.4%.
Lowell is a relatively safe city. There were only 189 violent crimes reported in the city for every 100,000 people in 2018, about half the national violent crime rate.
[in-text-ad-2]

California: Manhattan Beach
> Population: 35,573
> 5 yr. population change: +0.7%
> Median home value: $1,947,900
> Median household income: $150,083
> 5 yr. avg. unemployment: 5.3%
Located on the Pacific Coast about 20 miles from downtown Los Angeles, Manhattan Beach residents have access to a major urban area and miles of ocean coast. Due in part to its high desirability as a place to live, real estate in Manhattan Beach is expensive, as is the overall cost of living. Goods and services are about 7.4% more expensive than the national average, and most homes are worth over $1.9 million.
As is often the case in wealthy areas, violent crimes are relatively uncommon in Manhattan Beach. The city’s violent crime rate of 158 incidents per 100,000 people is less than half the national rate of 381 per 100,000.
Source: arinahabich / Getty Images
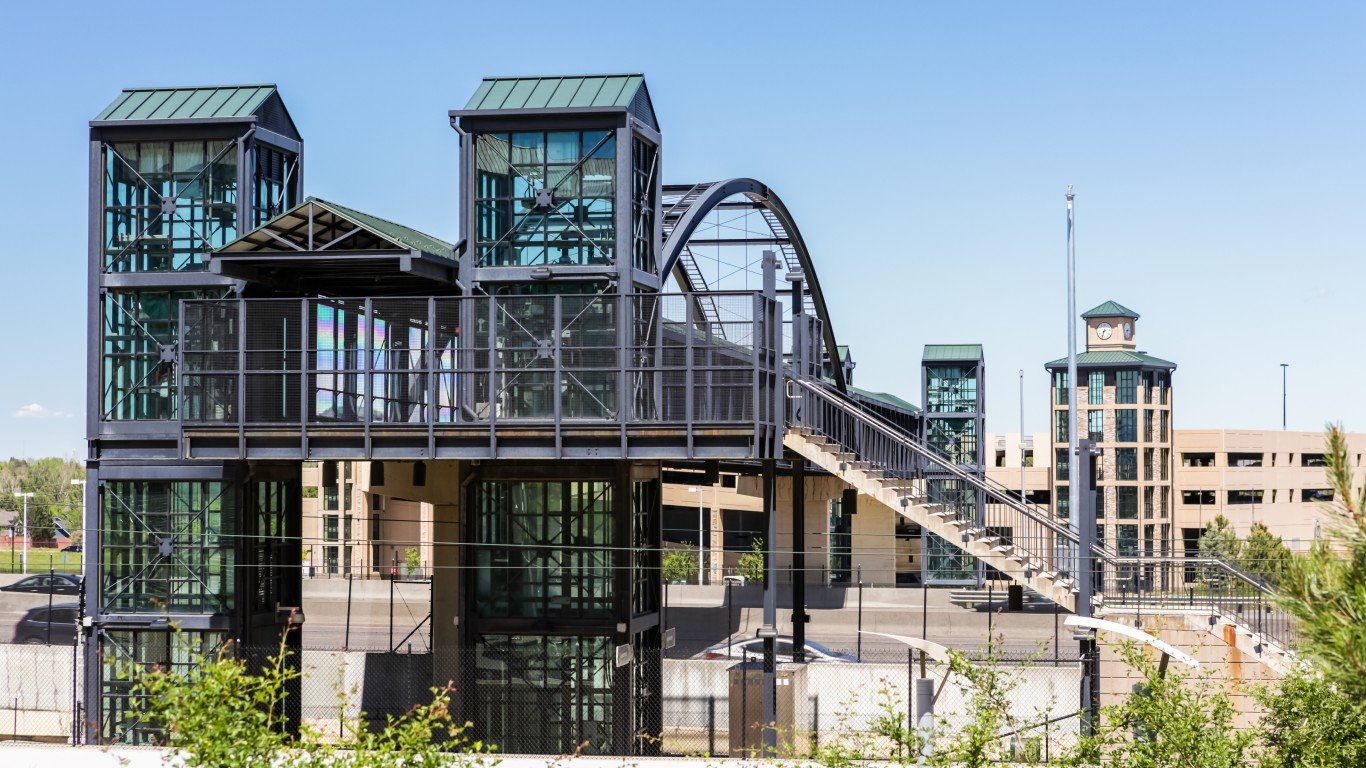
Colorado: Greenwood Village
> Population: 15,677
> 5 yr. population change: +10.2%
> Median home value: $889,400
> Median household income: $127,134
> 5 yr. avg. unemployment: 3.4%
Greenwood Village is a small Denver suburb about 10 miles south of the city. Like many other municipalities within commuting distance of a major urban area, Greenwood Village residents benefit from easy access to amenities in the nearby city as well as employment opportunities there. Likely partially as a result, an average of just 3.4% of workers in Greenwood were unemployed in the past five years, a far lower share than the comparable 5.9% national unemployment rate over that period.
Greenwood Village residents give the city high marks in several measures of quality of life. According to a residential survey conducted in fall 2018, the city’s parks, aesthetics, and safety are the primary reasons most residents are very satisfied living in Greenwood Village. These and other conditions likely help explain why Greenwood Village is drawing in new residents and families. Over the last five years, the city’s population grew by 10.2%.
[in-text-ad]

Connecticut: Darien
> Population: 21,759
> 5 yr. population change: +4.0%
> Median home value: $1,461,100
> Median household income: $210,511
> 5 yr. avg. unemployment: 5.2%
Darien, Connecticut, located in Long Island Sound less than 50 miles from midtown Manhattan, is home to one of the wealthiest communities in the country. Well over half of all households in Darien earn at least $200,000 a year. Darien is also one of the safest communities in the country. There were just 18 violent crimes for every 100,000 residents in 2018, a fraction of the 381 violent crimes per 100,000 people nationwide.
Residents of Darien and the surrounding county have easy access to a range of amenities and attractions. The area has a higher than average concentration of places like gyms, golf courses, marinas, parks, and museums.
 24/7 Wall St.
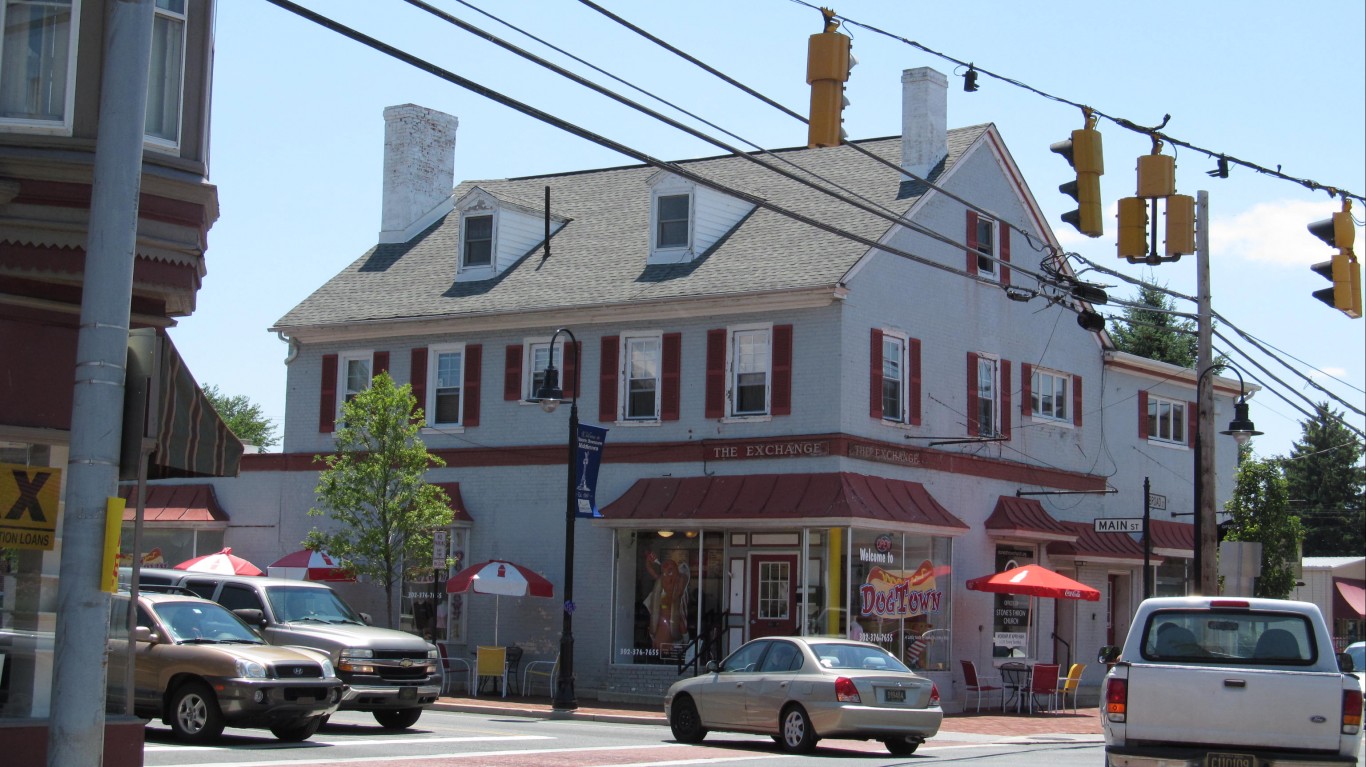
Source: dougtone / Flickr
Delaware: Middletown
> Population: 21,250
> 5 yr. population change: +11.5%
> Median home value: $288,400
> Median household income: $89,354
> 5 yr. avg. unemployment: 5.9%
Middletown, located about 30 miles south of Wilmington, ranks as the best community in Delaware to live in. The city has several parks, and partially as a result, about 97% of Middletown and surrounding county residents have easy access to places for physical activity, such as gyms or parks. Middletown is also a safe town. There were 286 violent crimes for every 100,000 people in Middletown in 2018, one of the lowest violent crime rates in the state and well below the national violent crime rate of 381 per 100,000.
Like many of the cities and towns on this list, Middletown is growing rapidly. In the last five years, Middletown’s population climbed 11.5%.

Source: Art Wager / Getty Images
Florida: Key Biscayne
> Population: 13,054
> 5 yr. population change: +3.9%
> Median home value: $1,218,200
> Median household income: $133,958
> 5 yr. avg. unemployment: 4.4%
Key Biscayne, a small town located on a barrier island just south of Miami, ranks as the best place to live in Florida. One of the safest communities in the country, Key Biscayne’s violent crime rate of 38 incidents for every 100,000 people is only about a 10th of the national violent crime rate of 381 per 100,000.
While the area has a high cost of living with especially high housing costs, incomes are also high in the area. The typical Key Biscayne household earns $133,958 per year, more than double the national median household income of $60,293. Poverty is also relatively uncommon in Key Biscayne. Less than 5% of the population lives below the poverty line, one of the lowest poverty rates in Florida.
[in-text-ad-2]
Source: Thomson200 / Wikimedia Commons
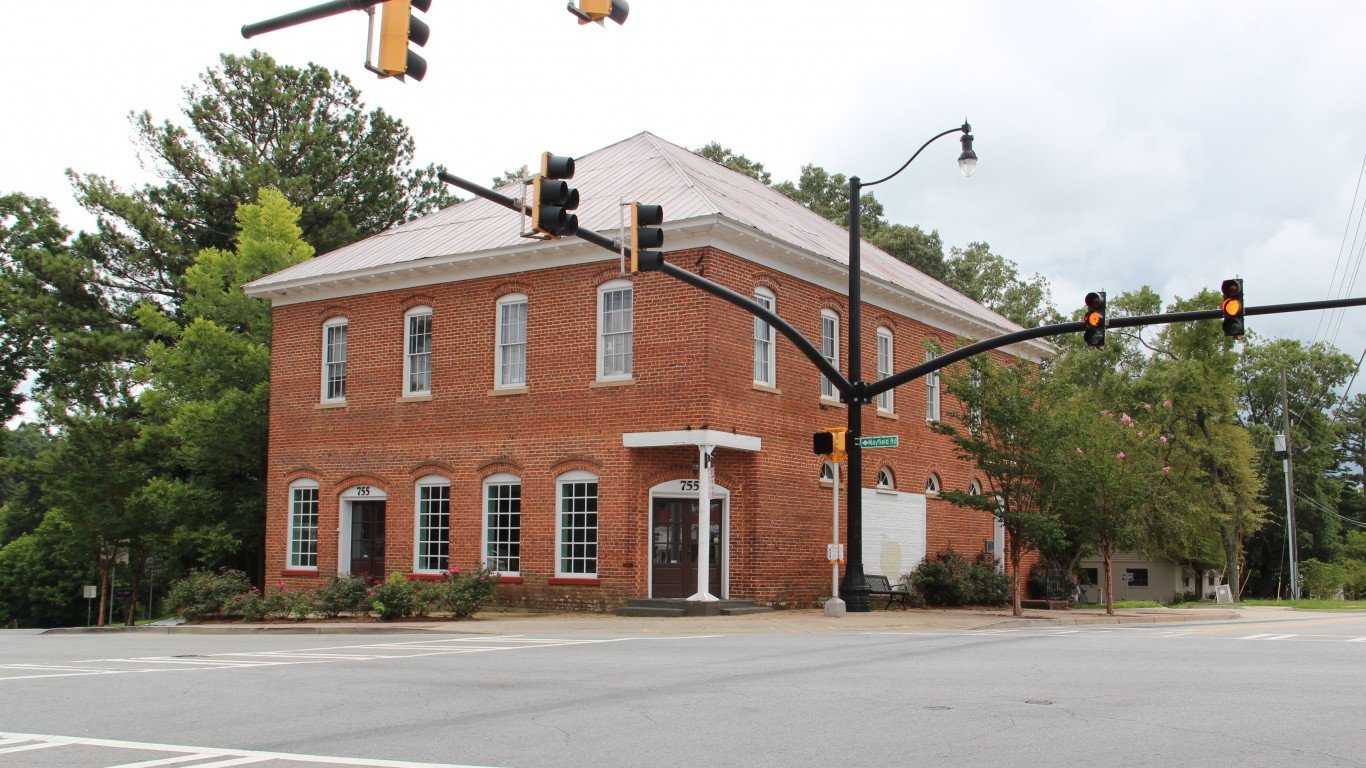
Georgia: Milton
> Population: 38,171
> 5 yr. population change: +13.0%
> Median home value: $534,400
> Median household income: $125,096
> 5 yr. avg. unemployment: 3.2%
Incorporated in 2006, Milton, Georgia, is a young and rapidly growing planned community. Home to over 38,000 people, Milton’s population has boomed by 13.0% in the last five years. Within commuting distance of Atlanta, Milton residents have access to jobs in the largest city in the state. Partially as a result, Milton has had an average unemployment rate of only 3.2% over the past five years, one of the lowest jobless rates in the state and well below the 5.9% national average during that time.
Milton is also one of the safest cities in Georgia. There were just 28 violent crimes for every 100,000 residents in 2018, a fraction of the comparable national rate of 381 per 100,000.

Source: Yoshi Canopus / Wikimedia Commons
Hawaii: Kalaoa
> Population: 11,604
> 5 yr. population change: +14.3%
> Median home value: $498,900
> Median household income: $71,051
> 5 yr. avg. unemployment: 2.9%
Kalaoa is a Census designated place on the west coast of the island of Hawaii. Economic conditions are strong in the area, as an average of only 2.9% of the local labor force has been unemployed in the last five years, and about one in every 10 households earn $200,000 or more per year. Kalaoa also has more cultural and entertainment attractions such as restaurants, golf courses, zoos, and movie theaters, per capita than the U.S. as a whole.
As is the case in many of the communities on this list, Kalaoa is growing rapidly. The number of people living in the area climbed by 14.3% in the last five years, faster than the vast majority of places in Hawaii.
[in-text-ad]

Source:
Idaho: Meridian
> Population: 97,008
> 5 yr. population change: +24.3%
> Median home value: $242,000
> Median household income: $68,131
> 5 yr. avg. unemployment: 3.1%
Few parts of the country are growing as rapidly as the western Idaho city of Meridian. The city is home to just over 97,000 people, a 24.3% increase from five years earlier. Over the same period, employment in the city climbed by 26.4%, and the average unemployment rate was only 3.1%. Meridian is also a safe city, with only 159 violent crimes reported for every 100,000 people in 2018 — less than half the national violent crime rate.
Meridian residents have access to over a dozen local parks, covering nearly 400 acres, and more restaurants, bars, fitness centers, movie theaters, theatre companies, and zoos and botanical gardens on a per capita basis than Americans, on average, nationwide.
 24/7 Wall St.
Source: UrAveragePhotographer / Getty Images
Illinois: Winnetka
> Population: 12,481
> 5 yr. population change: +1.7%
> Median home value: $1,076,000
> Median household income: $220,577
> 5 yr. avg. unemployment: 2.4%
Winnetka is a small village along the shore of Lake Michigan about 20 miles north of downtown Chicago. Residents have easy access to the largest city in the Midwest with a commuter line that goes directly downtown. Partially as a result, over a quarter of commuters in the area use public transit to get to work and do not have to rely on a car. As is often the case in municipalities on this list located outside major urban areas, unemployment is low in Winnetka. The village’s five-year average jobless rate of 2.4% is less than half the comparable national figure of 5.9%.
The village also boasts a high per capita concentration of restaurants, bars, and theater companies as well as a total of 27 parks that span nearly 250 acres.

Indiana: Kendallville
> Population: 9,522
> 5 yr. population change: -5.0%
> Median home value: $97,100
> Median household income: $42,278
> 5 yr. avg. unemployment: 5.3%
Kendallville, a small city in northeastern Indiana, is a relatively affordable place to live. The typical home is worth 2.3 times as much as the city’s median household income. Meanwhile, the median home value across the country is 3.4 times higher than the median household income. Not just housing is more affordable, but the overall cost of living in Kendallville is about 14.5% lower than it is on average nationwide.
While Kendalville’s median household income of $42,278 is well below the national median of $60,293, area residents are less likely than most Americans to face serious financial hardship. Just 12.1% of Kendallville residents live below the poverty line compared to 14.1% of people nationwide.
[in-text-ad-2]
Source: Cubsftw / Wikimedia Commons
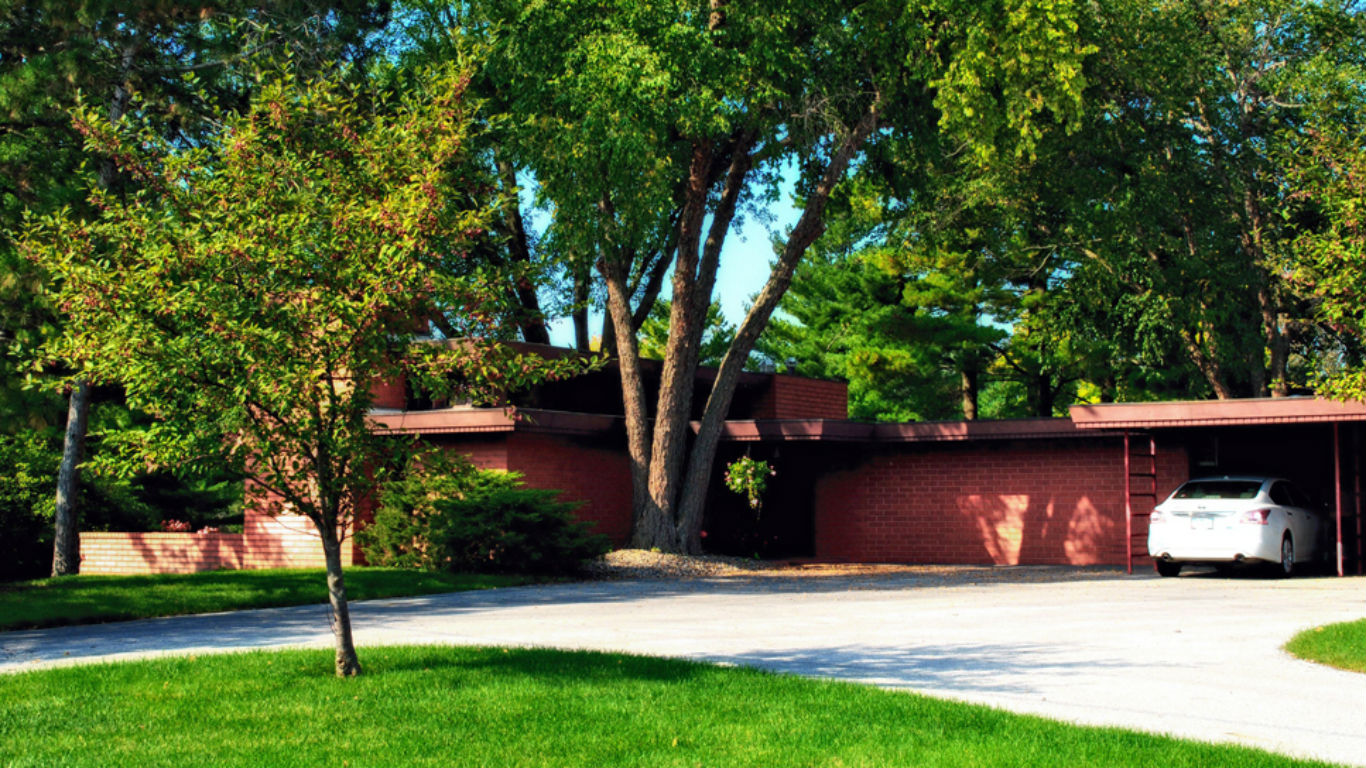
Iowa: Johnston
> Population: 20,767
> 5 yr. population change: +14.5%
> Median home value: $249,200
> Median household income: $98,552
> 5 yr. avg. unemployment: 2.7%
Johnston, Iowa, located just north of the state capital of Des Moines, ranks as the best city to live in the state. The suburb boasts more than a dozen parks and 40 miles of trail. And according to a 2015 survey, nine in every 10 residents are satisfied or very satisfied with quality of life there.
Area residents benefit from a low cost of living, affordable housing, and a strong job market. Such conditions appear to be drawing in new residents and families. Over the last five years, Johnston’s population grew by 14.5%.

Source: TriggerPhoto / iStock via Getty Images
Kansas: Leawood
> Population: 34,570
> 5 yr. population change: +7.1%
> Median home value: $447,100
> Median household income: $149,736
> 5 yr. avg. unemployment: 2.4%
Leawood, Kansas, is a city of just under 35,000 residents located about 10 miles south of Kansas City, Missouri. Within commuting distance to one of the largest cities in the Midwest, Leawood’s five-year average unemployment rate of 2.4% is less than half the comparable 5.9% national rate. The city is one of the safest in the state, with a violent crime rate of just 77 per 100,000 people, about one-fifth the comparable national rate.
The city’s safe streets and a strong job market are likely pulling many new residents and families to Leawood. Over the last five years, the city’s population has grown by 7.1%.
[in-text-ad]
Source: Public Domain / Wikimedia Commons
Kentucky: Fort Mitchell
> Population: 8,237
> 5 yr. population change: +0.5%
> Median home value: $258,500
> Median household income: $66,754
> 5 yr. avg. unemployment: 0.4%
Bolstered by employment opportunities in nearby Cincinnati, Fort Mitchell, Kentucky, boasts one of the strongest job markets in the country. Over the last five years, unemployment in the northern Kentucky city has averaged just 0.4%. The area’s widespread employment has reduced the likelihood of financial hardship, and just 8.3% of Fort Mitchell’s population lives below the poverty line, one of the lower poverty rates in Kentucky.
Quality of life in Fort Mitchell is bolstered by several parks, containing baseball fields, tennis, basketball, and volleyball courts, pavilions, playgrounds, and picnic areas. The city is also one of the safest in the state, with a violent crime rate of just 48 per 100,000 people, about one-eighth of the comparable national rate.
Source: Infrogmation / Wikimedia Commons
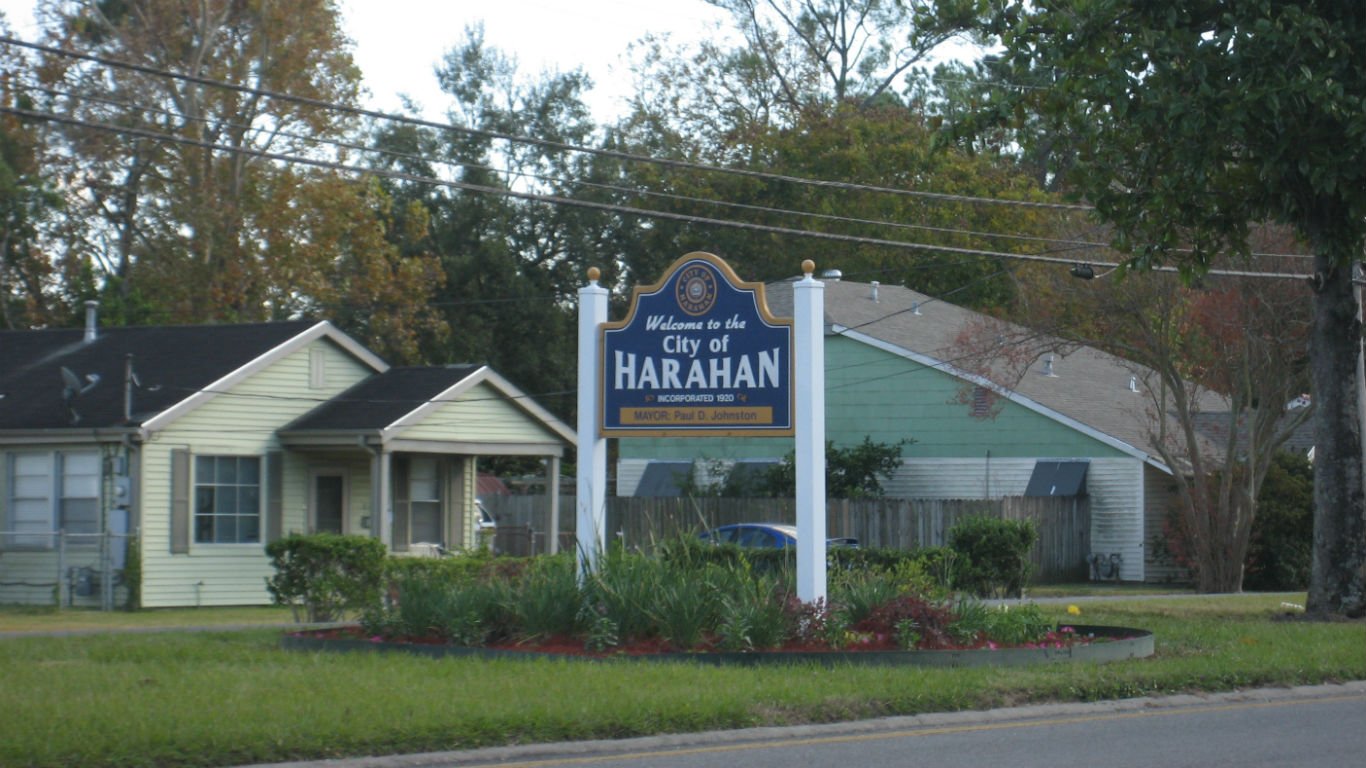
Louisiana: Harahan
> Population: 9,309
> 5 yr. population change: +0.2%
> Median home value: $233,600
> Median household income: $63,854
> 5 yr. avg. unemployment: 2.9%
Residents of Harahan, Louisiana, a suburb of New Orleans, benefit from a strong job market. The average unemployment rate in the city was just 2.9% over the last five years, lower than in the vast majority of the state. Widespread job opportunities can help reduce the likelihood of financial instability. In Harahan, most households earn more than $63,000 a year, more than in most parts of Louisiana.
Harahan is also a relatively safe city, with only 127 violent crimes reported for every 100,000 people in 2018 — about one-third the national violent crime rate.
Source: P199 / Wikimedia Commons
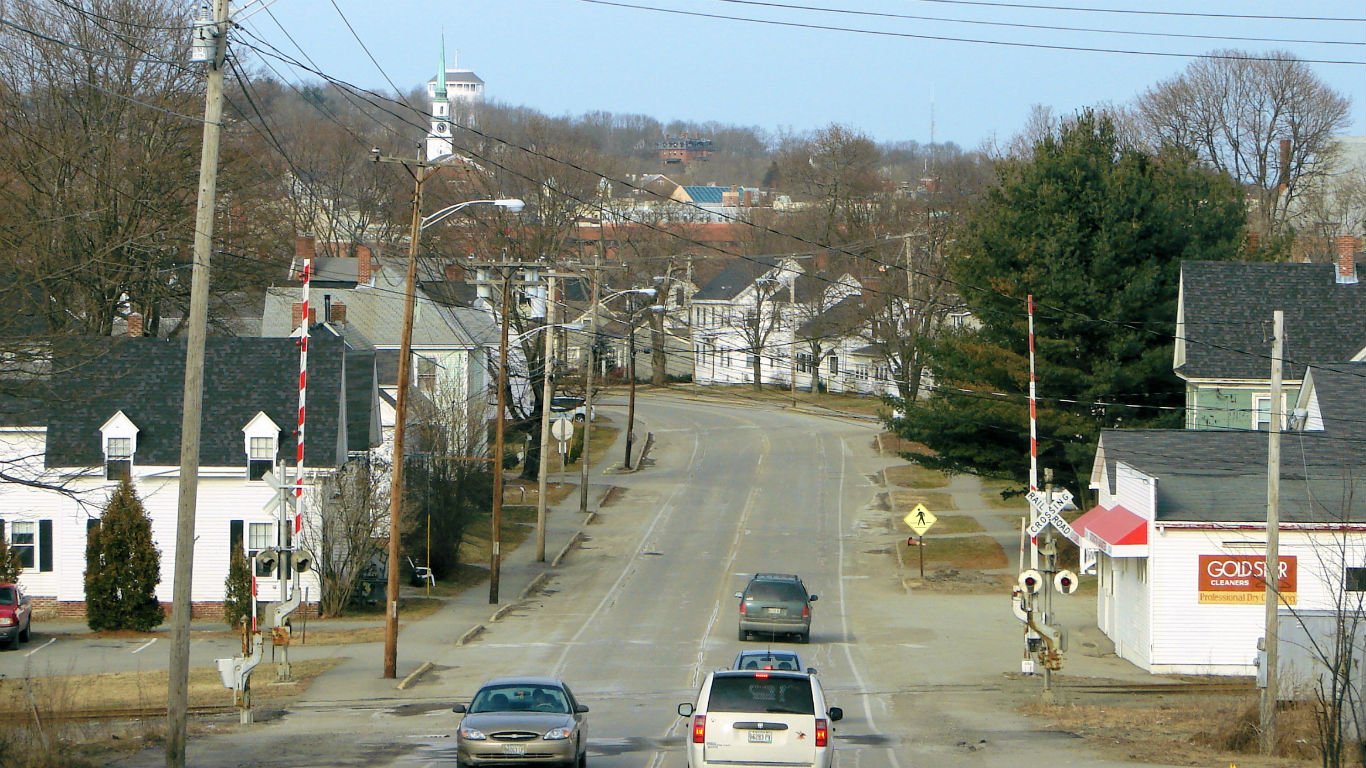
Maine: Brewer
> Population: 9,123
> 5 yr. population change: -3.2%
> Median home value: $162,000
> Median household income: $58,403
> 5 yr. avg. unemployment: 2.6%
Residents of Brewer, Maine, benefit from a low cost of living. Goods and services in the small city located just outside of Bangor are about 10% less expensive than they are nationwide on average. Brewer is also a safe city with a violent crime rate of just 134 for every 100,000 people — well below the national rate of 381 violent crimes per 100,000 Americans. Brewer champions itself as a business-friendly community, and industry does appear to be thriving in the area. Over the last five years, the local unemployment rate has averaged just 2.6%, less than half the comparable national rate.
Maine is struggling with weak population growth, and despite ranking as the best city in the state, Brewer’s population is contracting. Over the last five years, the number of people living there has fallen by 3.2%.
[in-text-ad-2]

Maryland: Mount Airy
> Population: 9,395
> 5 yr. population change: +1.1%
> Median home value: $368,500
> Median household income: $117,341
> 5 yr. avg. unemployment: 3.1%
Mount Airy, Maryland, is a town of less than 10,000 about 40 miles north of Washington D.C. Of all cities and towns tracked by the FBI, Mount Airy is the safest in Maryland, with only 42 violent crimes for every 100,000 people.
As is often the case in safe communities on this list, Mount Airy has a strong job market and a relatively affluent population. The town’s average unemployment rate over the last five years was just 3.1%. Additionally, most households in the area earn over $117,000 a year.
Source: Marcio Jose Bastos Silva / Shuterstock.com
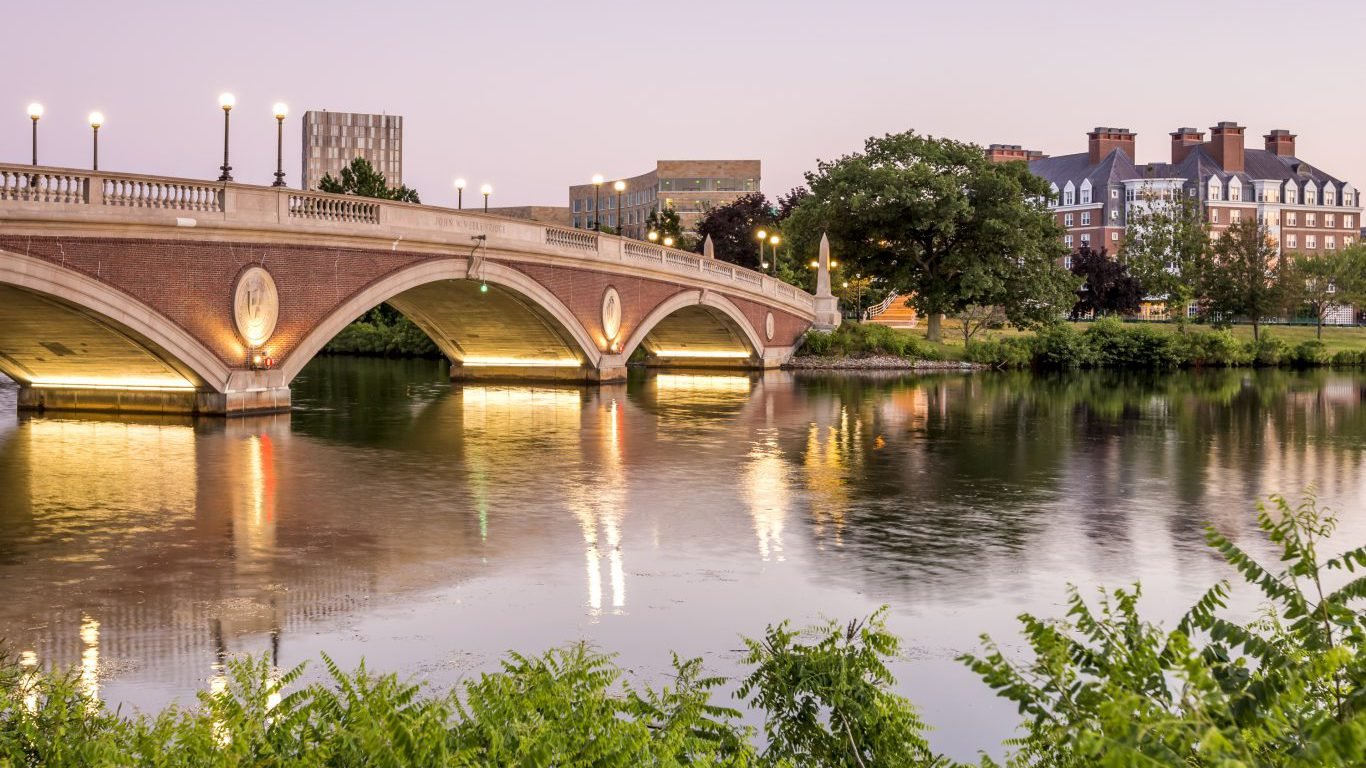
Massachusetts: Cambridge
> Population: 115,665
> 5 yr. population change: +9.4%
> Median home value: $719,300
> Median household income: $95,404
> 5 yr. avg. unemployment: 4.4%
Cambridge, the best city to live in Massachusetts, is located directly across the Charles River from Boston, the state capital and largest city in New England. The historic city, home to both Harvard and MIT, has a higher concentration of places like restaurants, gyms, museums, and libraries per capita than the U.S. as a whole. It also has a relatively strong job market, with a five-year average unemployment rate of just 4.4%, compared to the 5.9% national average.
Cambridge is a relatively condensed city with reliable public transportation, giving residents far more commuting options than most Americans have. Only about one-quarter of commuters in the city drive alone to work, compared to more than three-quarters of Americans nationwide. Meanwhile, over half of all workers in Cambridge either walk or take public transportation, compared to less than 10% of workers nationwide.
[in-text-ad]
Source: CT757fan / Getty Images
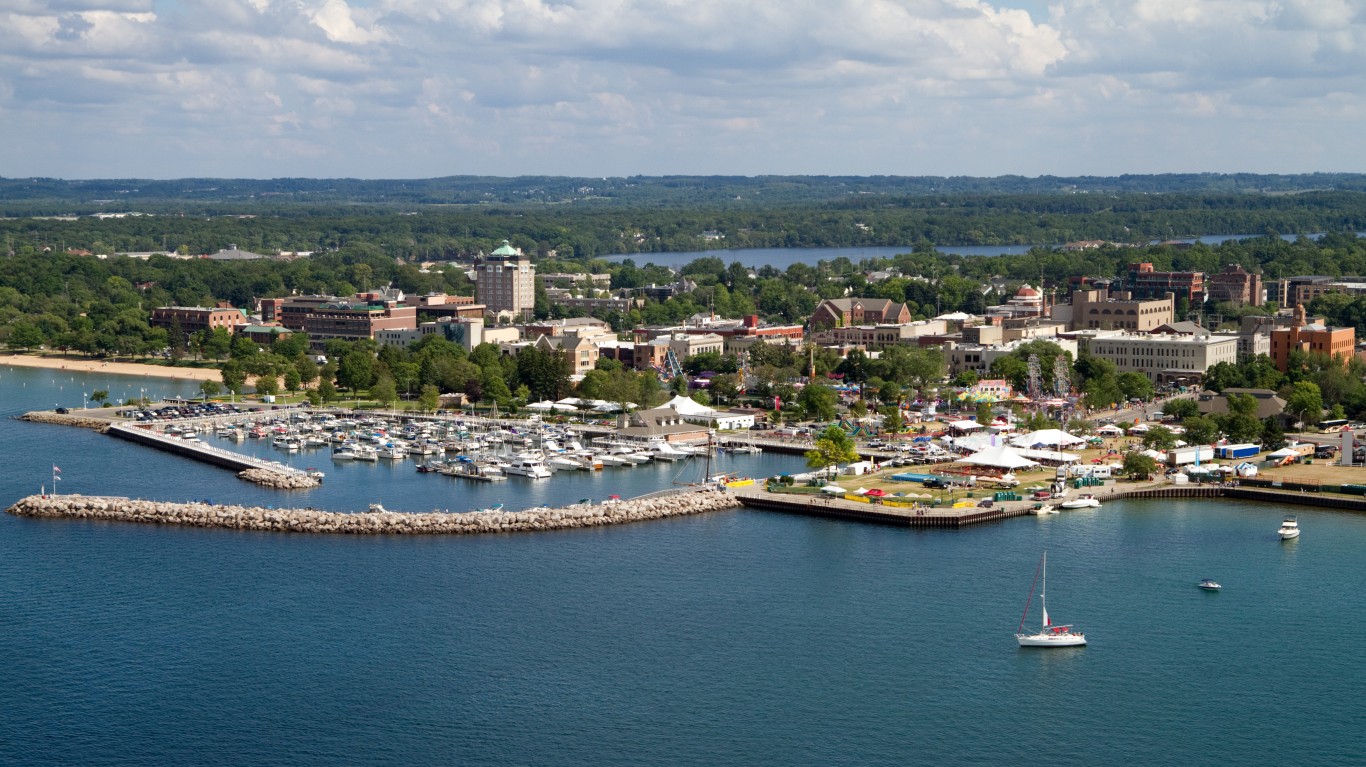
Michigan: Traverse City
> Population: 15,474
> 5 yr. population change: +3.6%
> Median home value: $240,100
> Median household income: $53,871
> 5 yr. avg. unemployment: 4.9%
Traverse City is located in northwestern Michigan on the southern end of the Grand Traverse Bay. Though incomes tend to be slightly lower than average in the city, residents benefit from a lower cost of living, as goods and services are about 6.5% less expensive than they are on average nationwide. Traverse City also has a stronger than average job market, and partially as a result, area residents are less likely than most Americans to live below the poverty line.
The city also boasts far higher concentrations of entertainment and recreational venues like restaurants, bars, and golf courses than the national average. Additionally, across the broader county, 87.4% of the population has easy access to places for exercise like parks and recreation centers, a larger share than the 84.0% of Americans nationwide.
 24/7 Wall St.
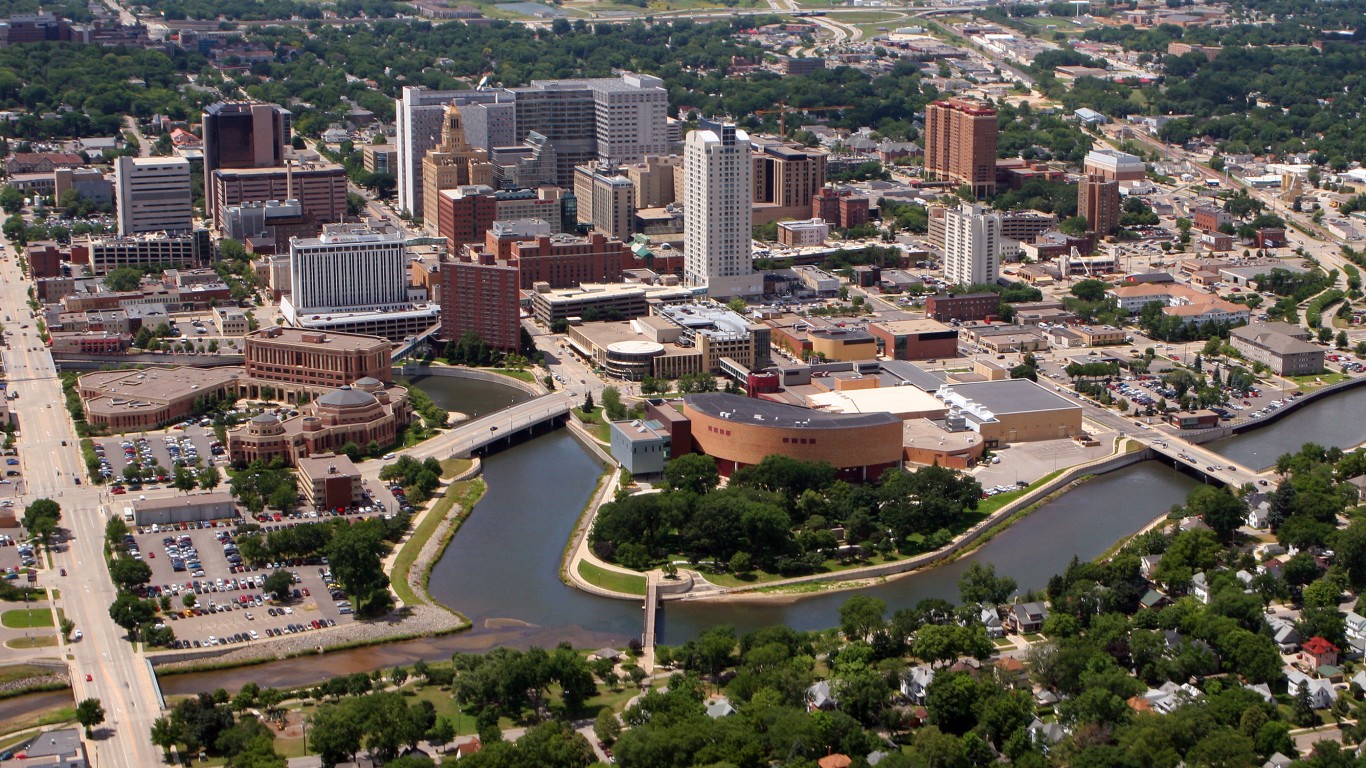
Source: BanksPhotos / Getty Images
Minnesota: Rochester
> Population: 113,913
> 5 yr. population change: +5.3%
> Median home value: $188,000
> Median household income: $70,749
> 5 yr. avg. unemployment: 4.2%
With relatively high incomes and a low cost of living, Rochester, Minnesota, is an affordable place to live. The median annual household income in the city is $70,749, about $10,000 more than the median household income nationwide. Meanwhile, goods and services are about 5% less expensive in Rochester than they are nationwide, on average. Housing is particularly affordable, as the median home value in the city is just 2.7 times more than the median household income, well below the comparable 3.4 national ratio.
Rochester residents also benefit from a high per capita concentration of recreation and cultural venues, including gyms, golf courses, museums, and theater companies.
Source: GilbertThompson / Wikimedia Commons
Mississippi: Byram
> Population: 11,657
> 5 yr. population change: +1.3%
> Median home value: $140,600
> Median household income: $65,671
> 5 yr. avg. unemployment: 2.6%
Byram, Mississippi, is located less than 15 miles south of Jackson, the state capital. Incomes are higher in Byram than in the vast majority of cities and towns in the state. Most households in Byram earn over $65,000 a year, which is higher than the national median household income of $60,293. The higher than average incomes are likely due in part to the area’s strong job market. Over the past five years, Byram’s average unemployment rate has been just 2.6%, less than half the comparable 5.9% national jobless rate.
[in-text-ad-2]
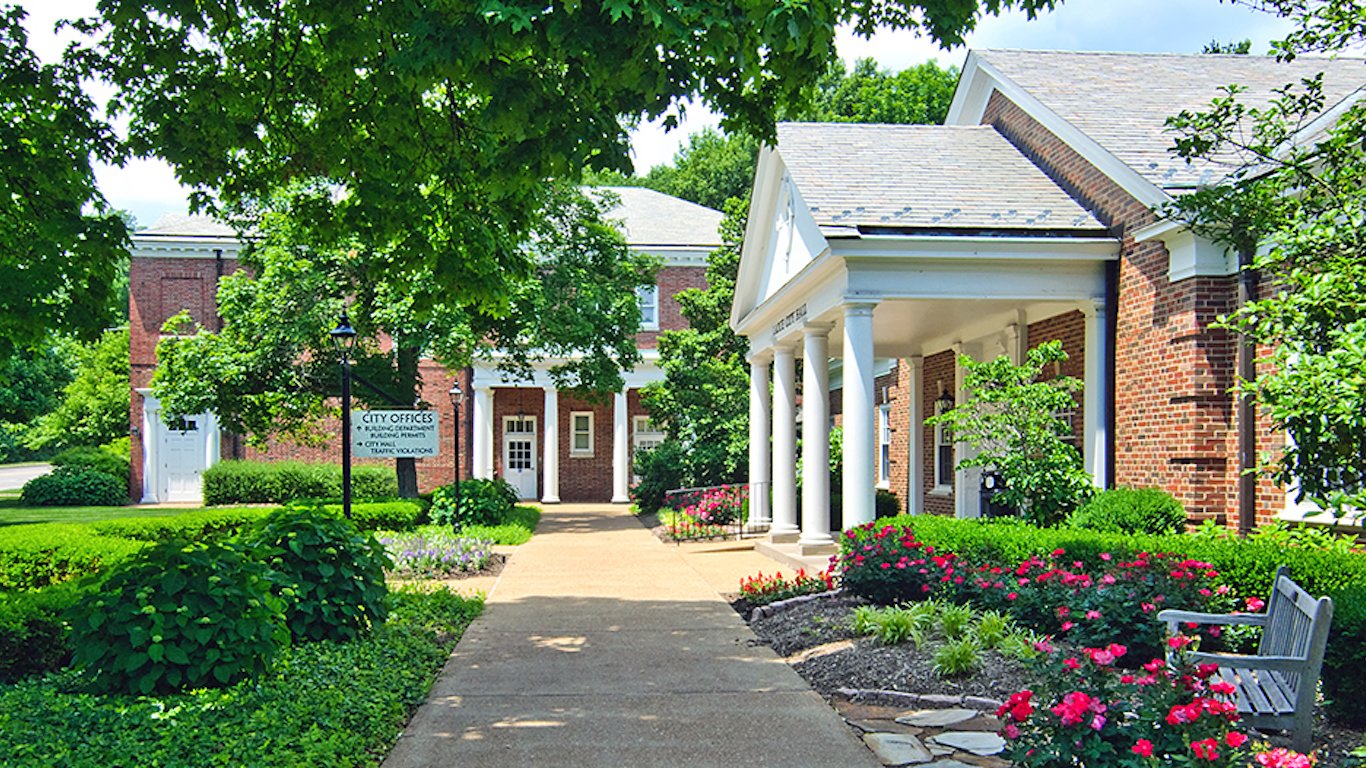
Source: Courtesy of the City of Ladue, Missouri
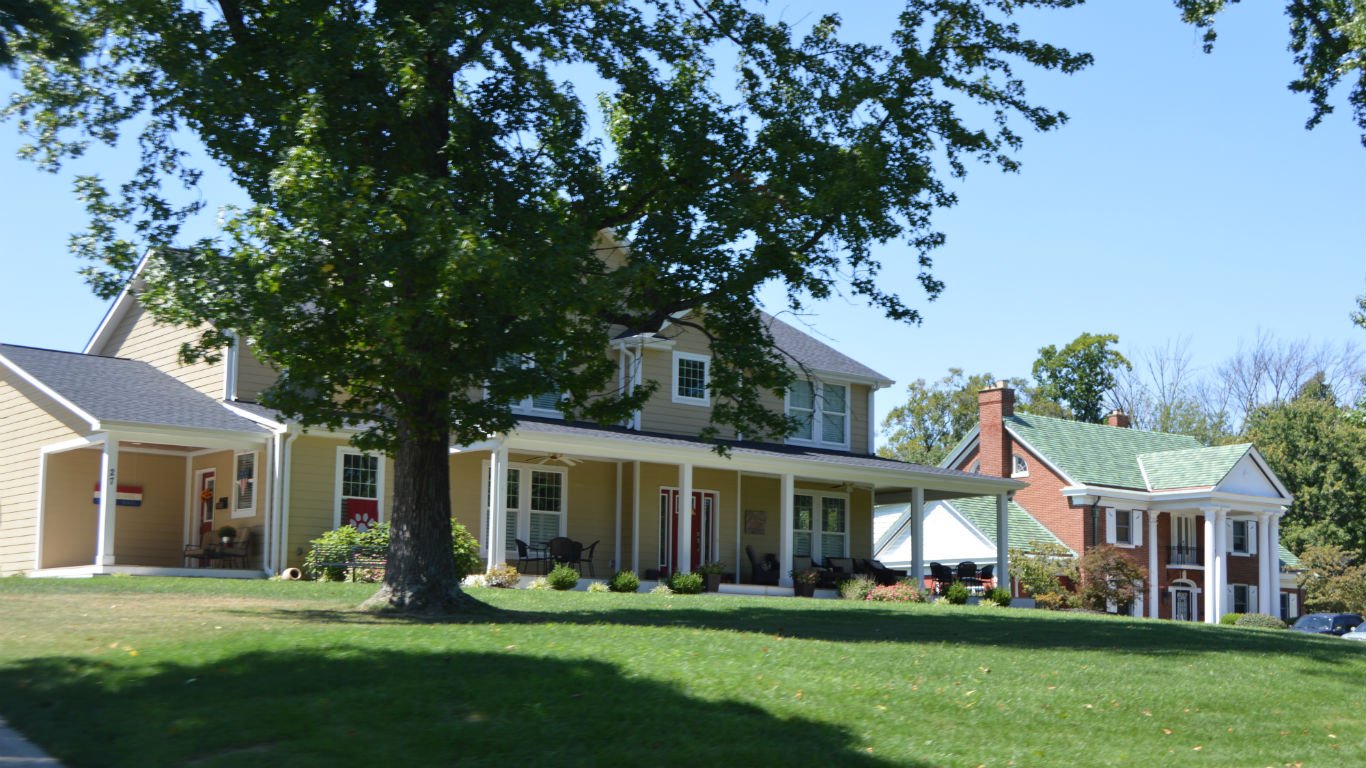
Missouri: Ladue
> Population: 8,586
> 5 yr. population change: +0.8%
> Median home value: $835,300
> Median household income: $192,500
> 5 yr. avg. unemployment: 1.6%
One of the wealthiest cities in Missouri, Ladue’s median household income of $192,500 a year is more than triple the national median income of $60,293. Not only is Ladue a wealthy city, but it is also inexpensive. Goods and services are 11.2% cheaper on average than they are typically nationwide.
Ladue is located less than 15 miles west of St. Louis, one of the largest cities in the Midwest with a large job market. Over the last five years, unemployment averaged just 1.6% in the city, a fraction of the 5.9% national average. In addition to cultural attractions and entertainment venues in St. Louis, Ladue residents enjoy a greater concentration than the national average of restaurants, fitness and recreation centers, and movie theaters within their own city limits.

Source: IslandLeigh / iStock via Getty Images
Montana: Belgrade
> Population: 8,345
> 5 yr. population change: +11.4%
> Median home value: $222,100
> Median household income: $58,146
> 5 yr. avg. unemployment: 2.5%
Belgrade, located in western Montana, about 10 miles from Bozeman, is the best city to live in the state partially due to the concentration of entertainment and cultural venues. The city boasts a far larger than typical share of places like bars, restaurants, gyms, movie theaters, museums, and golf courses on a per capita basis. The concentration of such businesses may also partially explain the city’s low unemployment rate. An average of just 2.5% of Belgrade’s labor force was out of work in the last five years, less than half the comparable 5.9% national unemployment rate.
Like many cities and towns on this list, Belgrade is growing rapidly. Over the last five years, the city’s population expanded by 11.4%. Over the same period, the U.S. population grew by just 3.6%.
[in-text-ad]
Source: Atomic Energy505 / Wikimedia Commons
Nebraska: Papillion
> Population: 20,466
> 5 yr. population change: +1.4%
> Median home value: $180,700
> Median household income: $80,853
> 5 yr. avg. unemployment: 2.2%
Papillion, Nebraska, located in the Omaha metro area, touts itself as a low-tax, business friendly city. Indeed, businesses appear to be thriving in the area, as the local unemployment rate has averaged just 2.2% over the last five years, well below the comparable 5.9% national average.
Incomes are also high in the area, as the typical household earns over $80,000 a year — a higher median household income than the vast majority of cities and towns in the state, and about $20,000 higher than the national median household income. Papillon residents are also far less likely than most Americans to be facing serious financial hardship, as the city’s 4.1% poverty rate is one of the lowest in the state and a fraction of the 14.1% national poverty rate.
Source: hairballusa / E+ via Getty Images
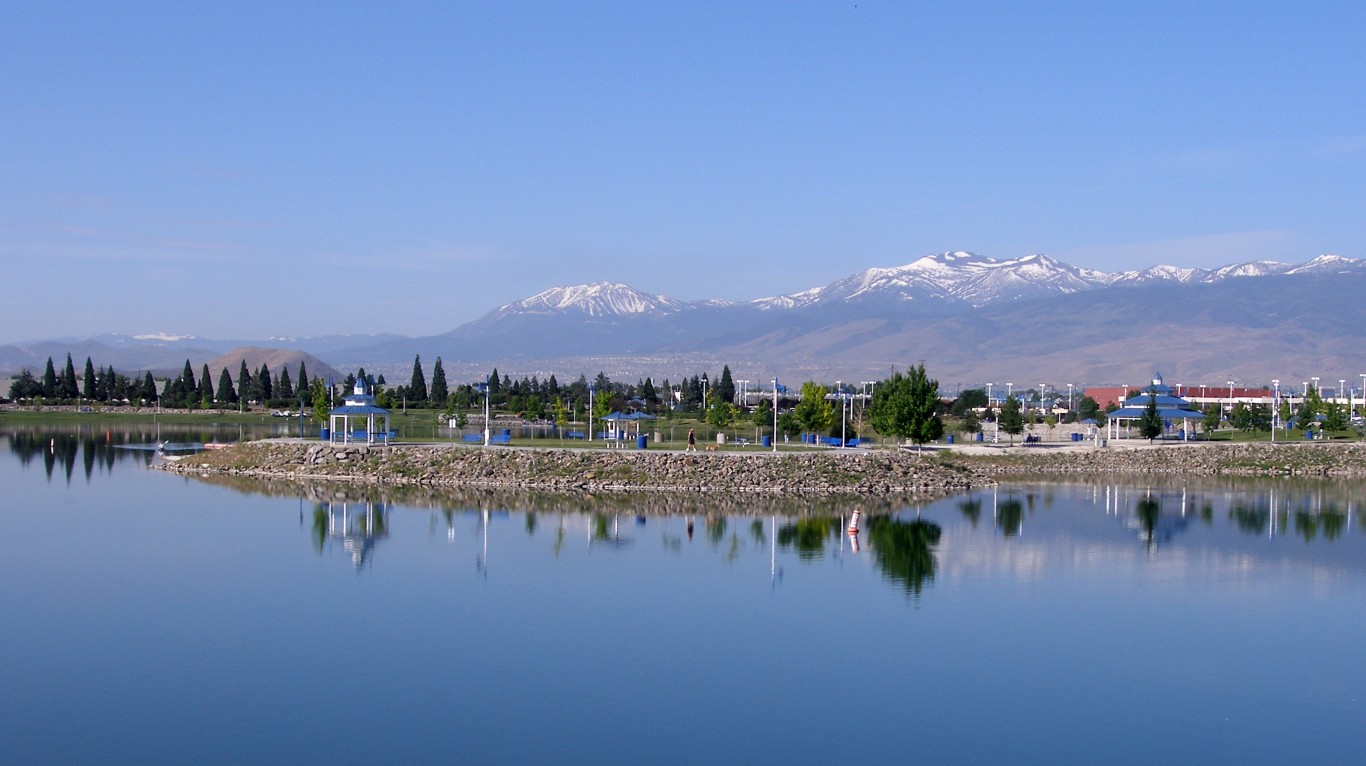
Nevada: Sparks
> Population: 98,524
> 5 yr. population change: +8.1%
> Median home value: $275,100
> Median household income: $60,785
> 5 yr. avg. unemployment: 5.6%
Sparks, a city of just under 100,000 residents, located outside of Reno, ranks as the best city to live in Nevada. Sparks residents have access to more than 50 parks and facilities across the city and several more that are currently in the process of being built. The climate is mild and sunny, and the local economy is bolstered by the presence of several nearby employers, including Tesla Motors’ gigafactory and the University of Nevada, Reno.
Sparks is growing rapidly. Over the last five years, the city’s population expanded by 8.1%, even as the U.S. population grew by just 3.6%.

Source: Jorisvo / iStock via Getty Images
New Hampshire: Hanover
> Population: 8,591
> 5 yr. population change: +0.5%
> Median home value: $576,700
> Median household income: $103,558
> 5 yr. avg. unemployment: 3.4%
Hanover has several advantages over other cities in New Hampshire. It is one of only five cities or towns in the state where most households earn over $100,000 a year. It is also a relatively walkable city. Nearly 40% of workers in the city commute to their job on foot, compared to just 2.7% of workers nationwide.
Hanover residents also benefit from a range of entertainment, cultural, and recreation options. There is a higher than typical per capita concentration of places like restaurants, gyms, golf courses, nature parks, museums, libraries, and movie theaters in Hanover.
[in-text-ad-2]

Source: pierre9x6 / Flickr
New Jersey: Hoboken
> Population: 53,211
> 5 yr. population change: +4.5%
> Median home value: $693,400
> Median household income: $136,402
> 5 yr. avg. unemployment: 3.4%
Hoboken, New Jersey, is located directly across the Hudson River from Manhattan. Though the area has an especially high cost of living, residents benefit from access to a wide range of jobs in the largest U.S. metro area. Over the last five years, the unemployment rate in Hoboken has averaged just 3.4%, well below the comparable 5.9% national rate. Many jobs in the area are high paying, as the median household income in Hoboken is $136,402 a year.
A relatively condensed city with a reliable public transit system, Hoboken offers residents a range of commuting options. More than 60% of workers in the city use public transportation to get to work, and over 8% walk, compared to just 5.0% and 2.7% of commuters nationwide, respectively.

Source: DenisTangneyJr / Getty Images
New Mexico: Santa Fe
> Population: 83,847
> 5 yr. population change: +21.9%
> Median home value: $270,700
> Median household income: $56,262
> 5 yr. avg. unemployment: 5.0%
New Mexico’s capital city also ranks as the most livable city in the state. Though Sante Fe’s violent crime rate of 396 incidents per 100,000 people is slightly higher than the national average, it is lower than most other cities and towns in New Mexico with available data.
Quality of life in the city is supported by a high per capita concentration of cultural venues — museums in particular. Santa Fe is home to the New Mexico Museum of Art, the Georgia O’Keeffe Museum, and the Museum of contemporary Native Arts — in addition to more than 250 smaller galleries. Steeped in history, Sante Fe was established over a decade before the Mayflower pilgrims arrived in Plymouth, making it the oldest capital city in North America.
[in-text-ad]

Source: Debora Truax / iStock via Getty Images
New York: Canandaigua
> Population: 10,348
> 5 yr. population change: -1.8%
> Median home value: $166,200
> Median household income: $49,198
> 5 yr. avg. unemployment: 4.4%
Located on the northern end of New York state’s Finger Lake with the same name, Canandaigua is a popular regional destination and has a far higher per capita concentration of bars, restaurants, hotels, marinas, golf courses, and museums than is typical among cities. Canandaigua is also a relatively safe place. There were just 24 violent crimes committed in the city in 2018, equivalent to 234 for every 100,000 people, which is well below the national violent crime rate of 381 per 100,000.

North Carolina: Pinehurst
> Population: 15,821
> 5 yr. population change: +8.8%
> Median home value: $297,100
> Median household income: $80,128
> 5 yr. avg. unemployment: 2.6%
Pinehurst, a village of just under 16,000 residents located about 100 miles east of Charlotte, ranks as the best place to live in in North Carolina. The area is home to the historic golf course of the same name, and it has a higher per capita concentration of restaurants and hotels than most of the country.
Over the last five years, the average unemployment rate in Pinehurst was just 2.6%, less than half the comparable 5.9% national rate. With a healthy job market, area residents are relatively financially secure. The typical Pinehurst household earns $80,128 a year, and just 2.7% of the population lives below the poverty line, compared to the national median household income of $60,293 and a poverty rate of 14.1%.
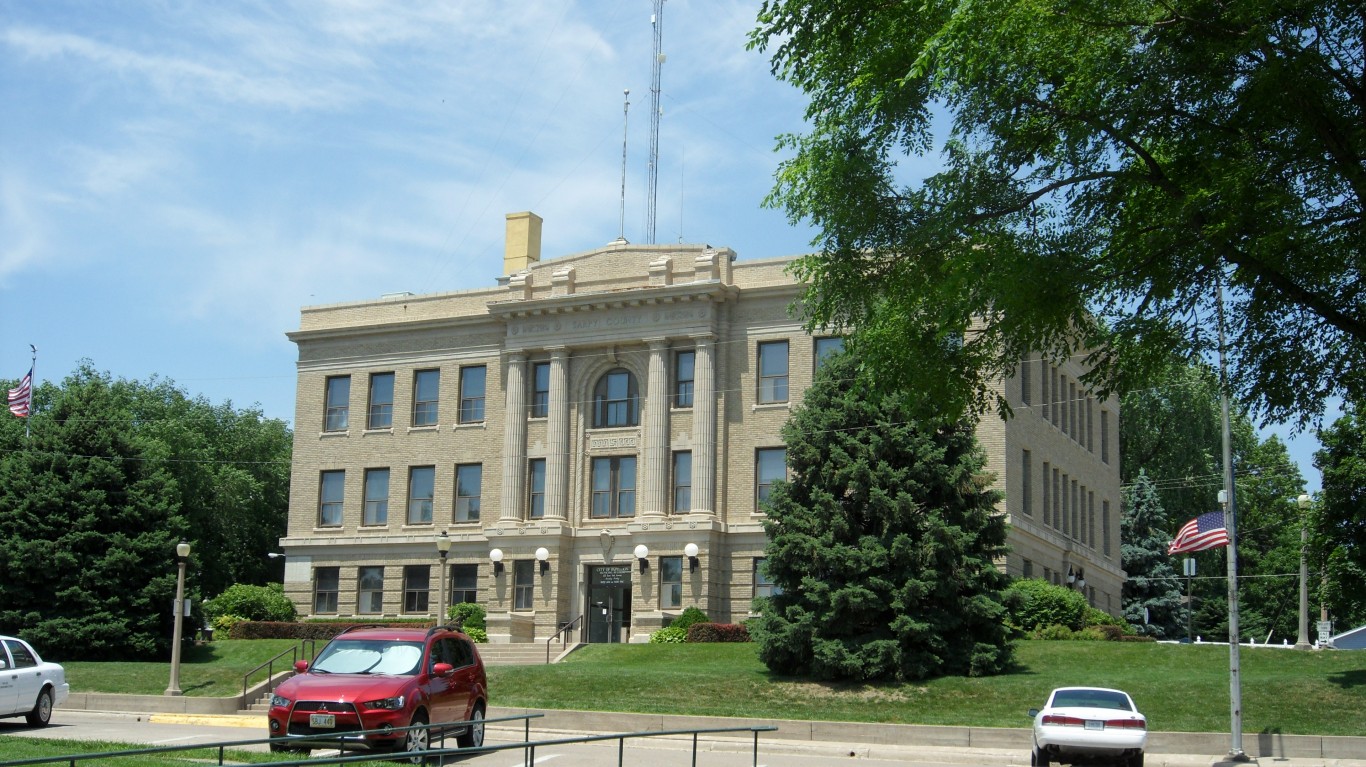
Source: Carrie Scarr / Flickr
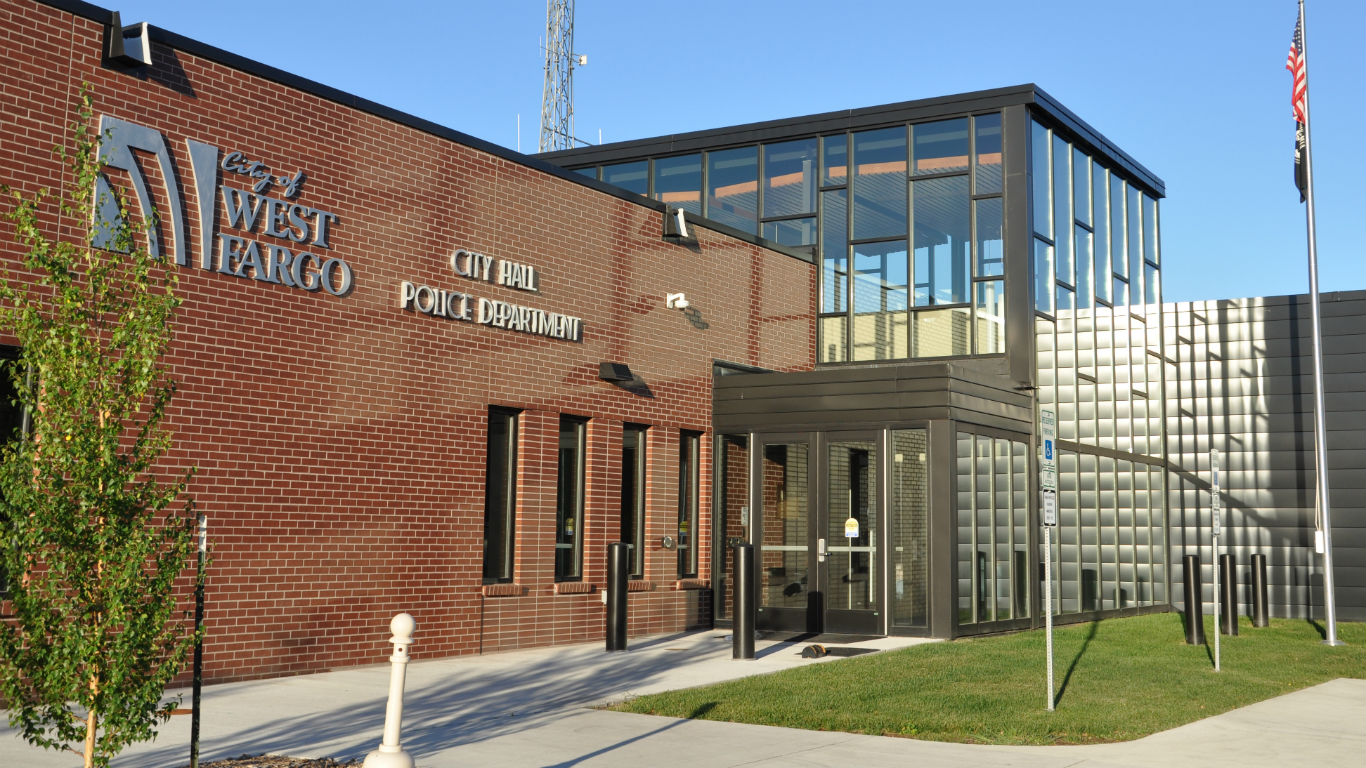
North Dakota: West Fargo
> Population: 34,419
> 5 yr. population change: +27.4%
> Median home value: $228,100
> Median household income: $81,051
> 5 yr. avg. unemployment: 1.5%
West Fargo, the best city to live in North Dakota, is also among the fastest growing communities in the country. The number of people living in West Fargo increased by 27.4% in the last five years, well above the 3.6% national population growth rate. The city is also adding jobs rapidly, with overall employment climbing 17.9% between 2014 and 2018, well above the comparable 6.5% national job growth. The city’s five-year average unemployment rate of 1.5% is considerably lower than the 5.9% national rate.
With a strong job market, people in West Fargo are less likely than most Americans to face serious financial hardship. The city’s poverty rate of 7.4% is nearly half the 14.1% national rate.
[in-text-ad-2]

Source: bkueppers / Getty Images
Ohio: New Albany
> Population: 10,896
> 5 yr. population change: +33.9%
> Median home value: $494,600
> Median household income: $203,194
> 5 yr. avg. unemployment: 3.9%
New Albany is one of the fastest growing cities in Ohio. In the past five years, the number of people living in the city grew by over a third. Located less than 20 miles northeast of Columbus, New Albany residents are within commuting distance to jobs in and around the state capital — and many of those jobs are high paying. The median household income in New Albany is $203,194 a year, more than triple the median nationwide of $60,293.
Not only are New Albany residents likely to have high incomes, but a dollar also goes further in the city than it does in much of the country. Goods and services are 13.4% less expensive in the city than they are nationwide, on average.
Source: DenisTangneyJr / Getty Images
Oklahoma: Broken Arrow
> Population: 107,500
> 5 yr. population change: +7.0%
> Median home value: $163,900
> Median household income: $72,686
> 5 yr. avg. unemployment: 4.4%
Broken Arrow, Oklahoma, located about 15 miles southeast of Tulsa, is the best city to live in the state. The city’s ranking on this list is attributable in part to low crime and relative safety. There were only 142 violent crimes in Broken Arrow for every 100,000 people in 2018, a lower violent crime rate than in the vast majority of cities and towns in Oklahoma and less than half the national violent crime rate of 381 per 100,000.
Broken Arrow residents also benefit from a far higher per capita concentration of bars, restaurants, gyms, and movie theaters than the national average. Over the last five years, the average unemployment rate in the city was just 4.4%, less than the comparable 5.9% national rate.
[in-text-ad]

Source: bradleyhebdon / E+ via Getty Images
Oregon: Lake Oswego
> Population: 38,705
> 5 yr. population change: +4.5%
> Median home value: $603,800
> Median household income: $100,461
> 5 yr. avg. unemployment: 3.2%
Lake Oswego is located about 10 miles south of Portland, meaning residents have access to jobs and attractions in a major city. Goods and services in Lake Oswego are about 7.4% more expensive than average. Still, the high cost of living is offset by higher incomes as the majority of households in the city earn over $100,000 a year, well above the national median household income of $60,293. Additionally, just 4.5% of city residents live below the poverty line, less than a third the 14.1% national poverty rate.
Lake Oswego is also a relatively safe city, with a violent crime rate of 50.6 incidents per 100,000 people, a fraction of the 380.6 per 100,000 national rate.
Source: Jesse Beam / Getty Images
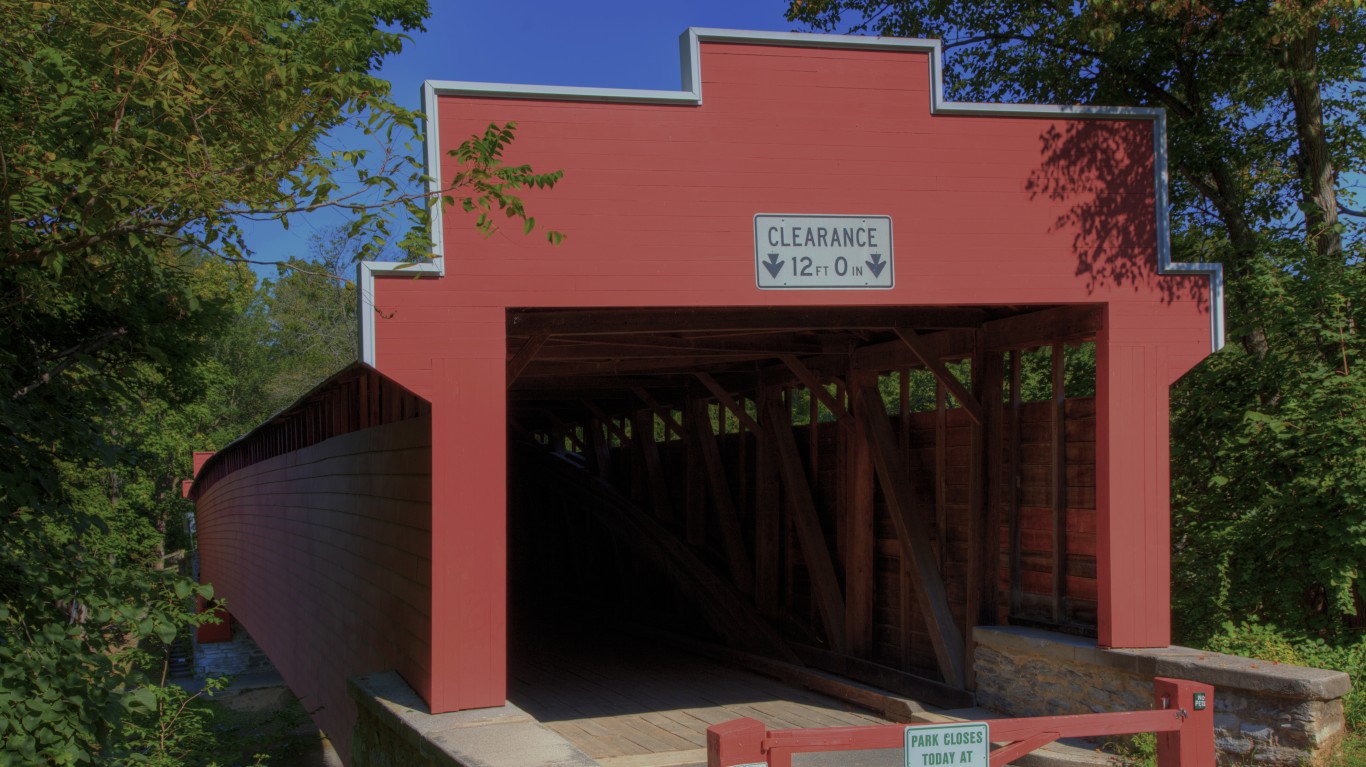
Pennsylvania: Wyomissing
> Population: 10,452
> 5 yr. population change: -0.2%
> Median home value: $240,500
> Median household income: $82,600
> 5 yr. avg. unemployment: 3.7%
Wyomissing is a small borough in eastern Pennsylvania, just across the Schuylkill River from Reading. Wyomissing is relatively affordable with a cost of living about 7% lower than the national average. Incomes are also relatively high in Wyomissing, with a household earning $82,600 a year, about $22,000 more than the typical U.S. household.
The area’s high incomes are likely due in part to a tight labor market. An average of just 3.7% of Wyomissing’s labor force was unemployed in the last five years, compared to the 5.9% national unemployment rate.
Source: DenisTangneyJr / iStock via Getty Images
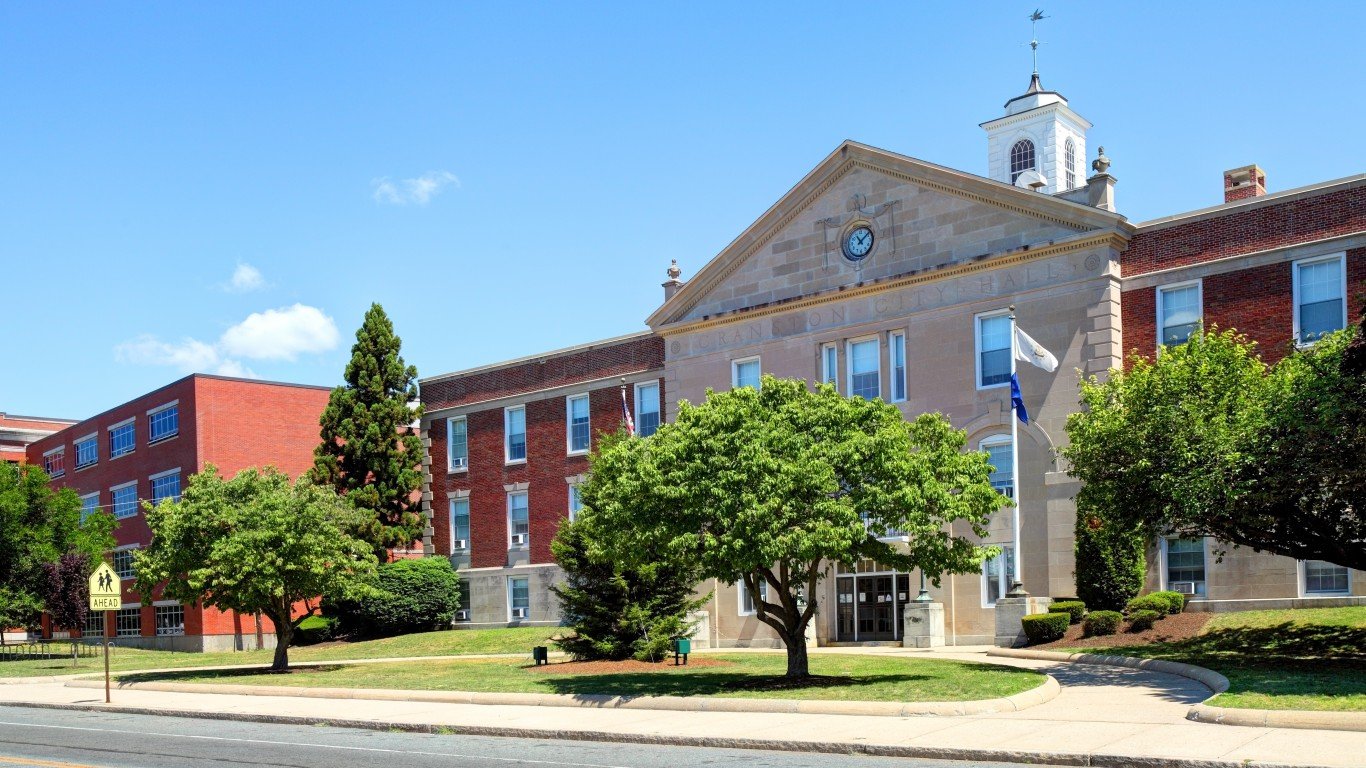
Rhode Island: Cranston
> Population: 81,196
> 5 yr. population change: +0.9%
> Median home value: $228,300
> Median household income: $66,283
> 5 yr. avg. unemployment: 5.4%
Cranston, a city of about 81,000 located just outside of Providence, ranks as the best city in Rhode Island, due in part to strong job growth in recent years. Overall employment climbed by 6.0% in the city from 2014 to 2018, a time when many cities and towns in the state shed jobs.
Both the job market and overall quality of life in the city are supported by a high concentration of entertainment and cultural attractions. Cranston has more restaurants, bars, gyms, theater companies, and libraries per capita than the U.S. as a whole.
[in-text-ad-2]
Source: PeterPhoto / Getty Images
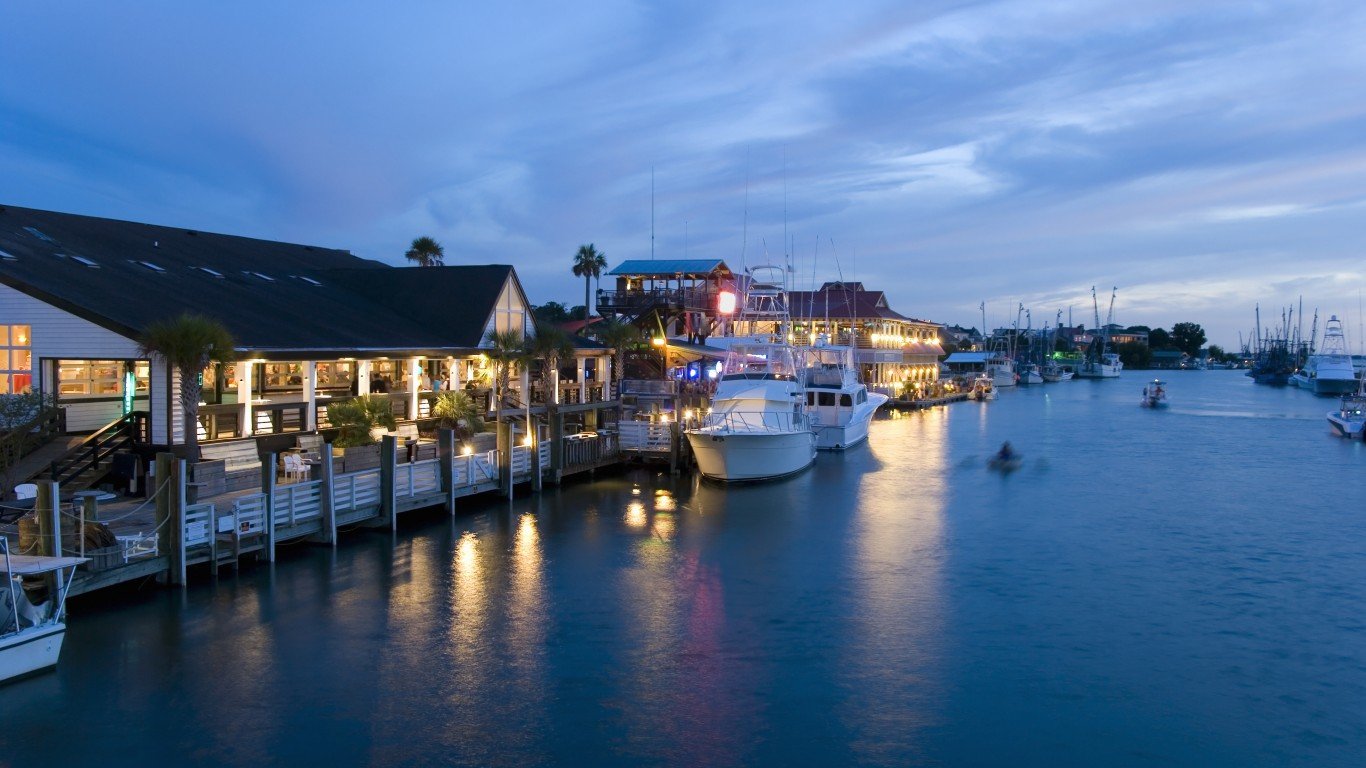
South Carolina: Mount Pleasant
> Population: 83,700
> 5 yr. population change: +19.3%
> Median home value: $441,600
> Median household income: $97,176
> 5 yr. avg. unemployment: 2.7%
Mount Pleasant, a Charleston suburb of about 84,000, ranks as the most livable city in South Carolina. The town’s 2.7% five-year average unemployment rate is lower than the comparable rate in most cities and towns in the state, and well below the comparable 5.9% national rate. As is often the case in areas with economic opportunity, Mount Pleasant is also safe. The town’s violent crime rate of 154 incidents per 100,000 people is lower than the comparable rate in most cities and towns in South Carolina and less than half the national rate of 381 per 100,000.
Like many cities and towns on this list, Mount Pleasant is growing rapidly. In the last five years, the town’s population expanded by 19.3%.
Source: Jacob Boomsma / iStock via Getty Images
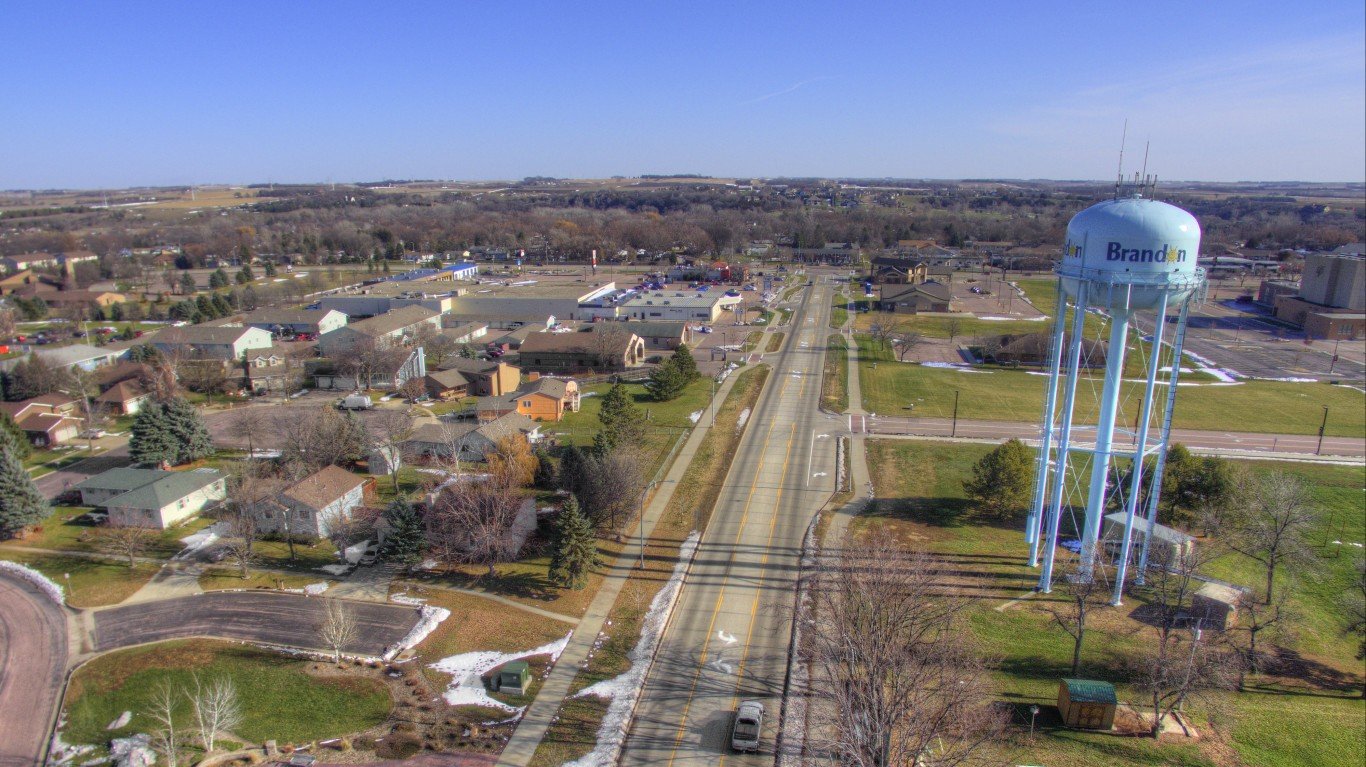
South Dakota: Brandon
> Population: 9,867
> 5 yr. population change: +8.4%
> Median home value: $206,600
> Median household income: $84,075
> 5 yr. avg. unemployment: 1.6%
The Sioux City suburb of Brandon ranks as the most livable city in South Dakota. With access to jobs locally and in a larger nearby city, unemployment is low in Brandon. Over the last five years, an average of just 1.6% of the city’s labor force has been out of work, a lower unemployment rate than in the vast majority of cities and towns in the state and far lower than the national rate.
Brandon is also a relatively affordable city, with a cost of living 11.6% lower than the national average. Housing is particularly affordable as the median value of area homes is $206,600, just 2.5 more than the median household income in the city. Nationwide, the median home value is 3.4 more than what the median household income.
[in-text-ad]
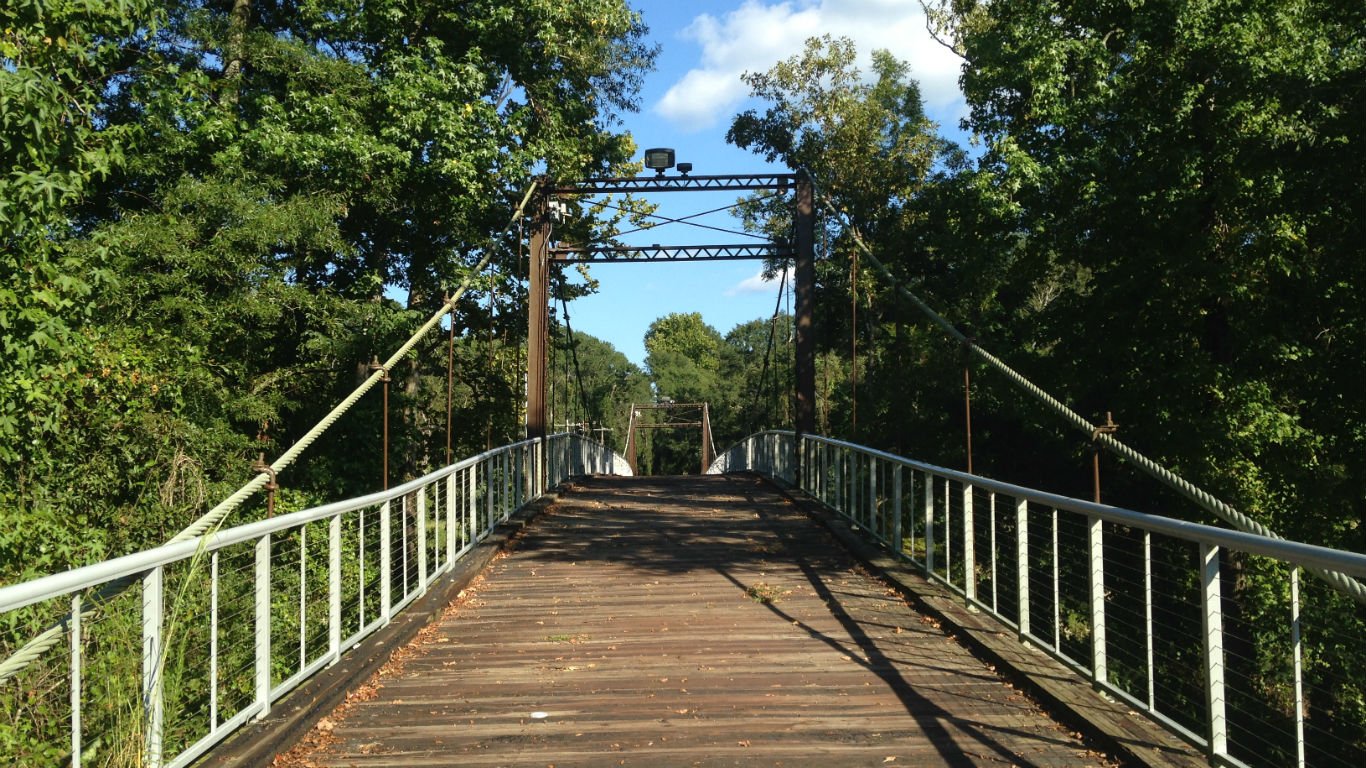
Source: Thomas R Machnitzki / Wikimedia Commons
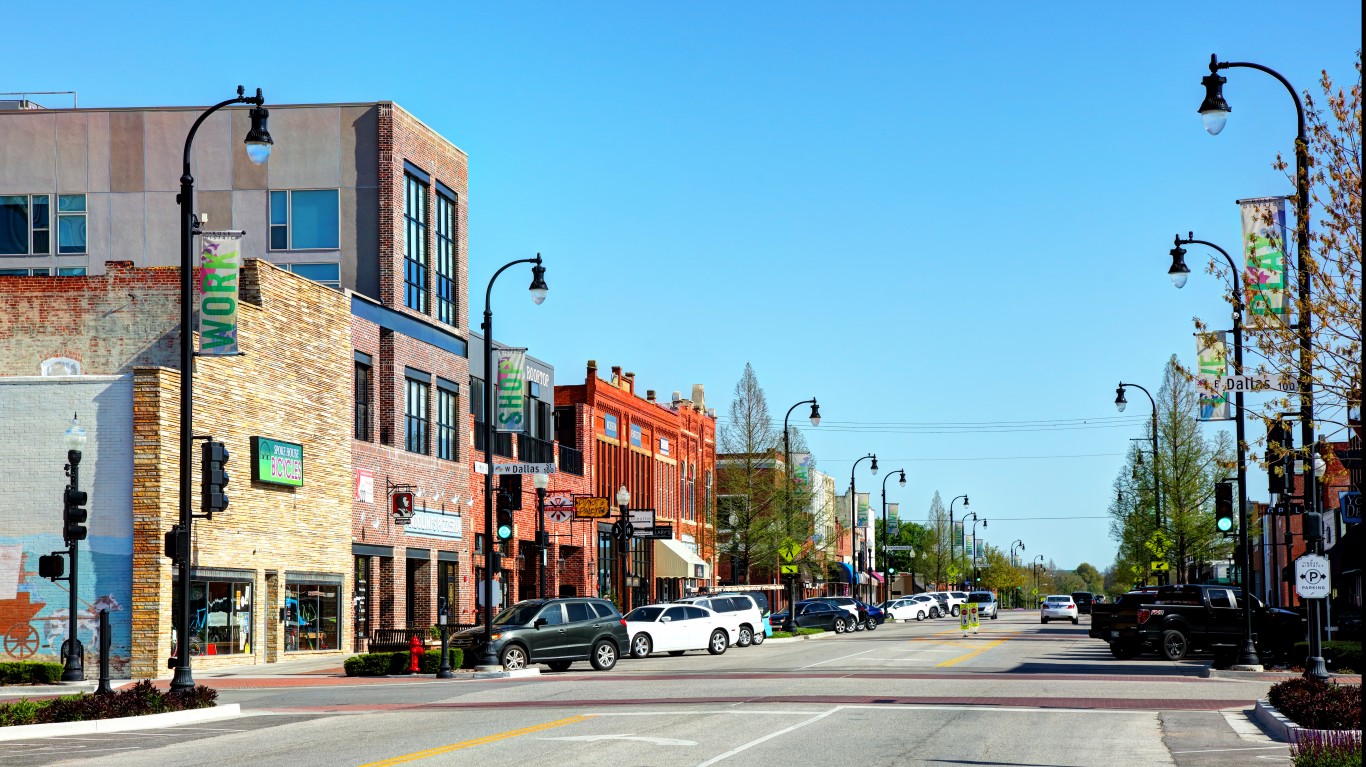
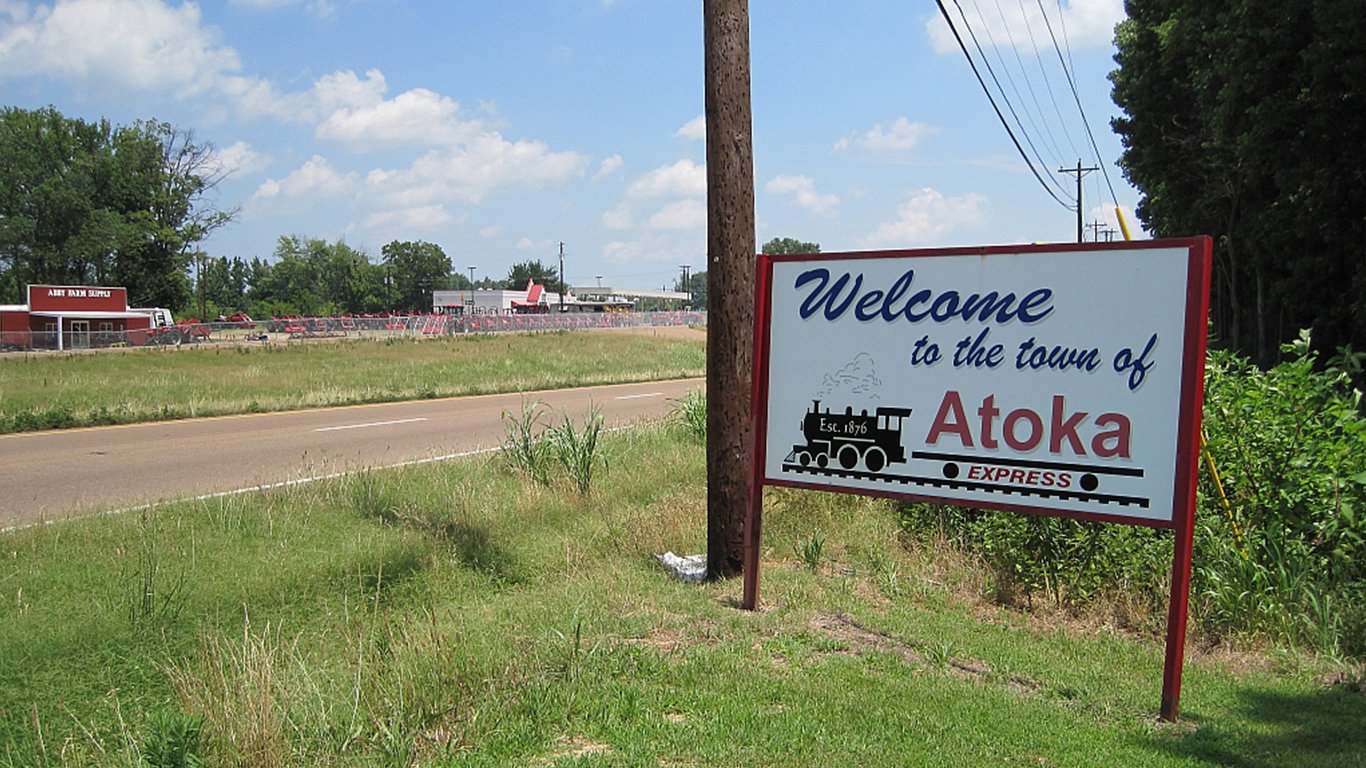
Tennessee: Atoka
> Population: 9,139
> 5 yr. population change: +6.7%
> Median home value: $192,400
> Median household income: $91,228
> 5 yr. avg. unemployment: 2.0%
Atoka is a small town in western Tennessee located just north of Memphis. The town reported a 6.7% population growth over the last five years. A strong job market may partially explain the influx of new residents. According to the Census, an average of just 2.0% of Atoka’s labor force was unemployed in the last five years, about one-third the 5.9% national unemployment rate. The town’s economy also provides relatively high paying jobs. The typical Atoka household earns $91,228 a year, well above the $60,293 national median household income.
Crime rates are low in Atoka. Its violent crime rate of 96.7 per 100,000 people and property crime rate of 870.5 per 100,000 are each well below the national rates of 380.6 violent crimes per 100,000 and 2,199.5 property crimes per 100,000.
 24/7 Wall St.
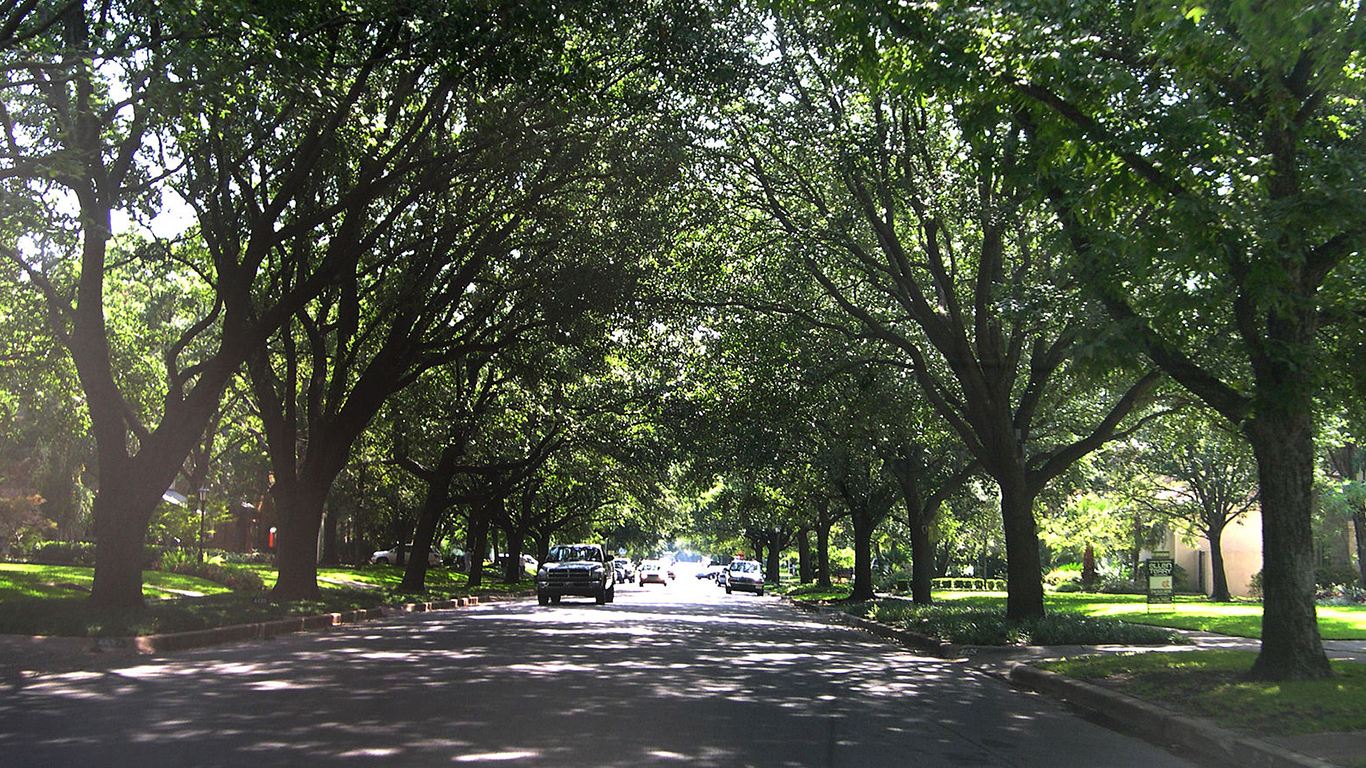
Source: Ansem27 / Wikimedia Commons
Texas: Highland Park
> Population: 9,145
> 5 yr. population change: +5.0%
> Median home value: $1,440,400
> Median household income: $207,019
> 5 yr. avg. unemployment: 2.3%
Highland Park, Texas, is one of the wealthiest communities in the United States. The area’s median annual household income of $207,019 is well more than triple the national median household income of $60,293 a year. Just north of downtown Dallas, Highland Park residents have access to employment opportunities in a major city, and just 2.3% of area workers were out of a job in the last five years, well below the 5.9% national unemployment rate.
Town residents benefit not only from access to cultural and entertainment options in nearby Dallas, but also from access to such venues within the town. There are 22 parks in the town, including eight tennis courts, three playgrounds, and a swimming pool.
Source: DenisTangneyJr / iStock via Getty Images
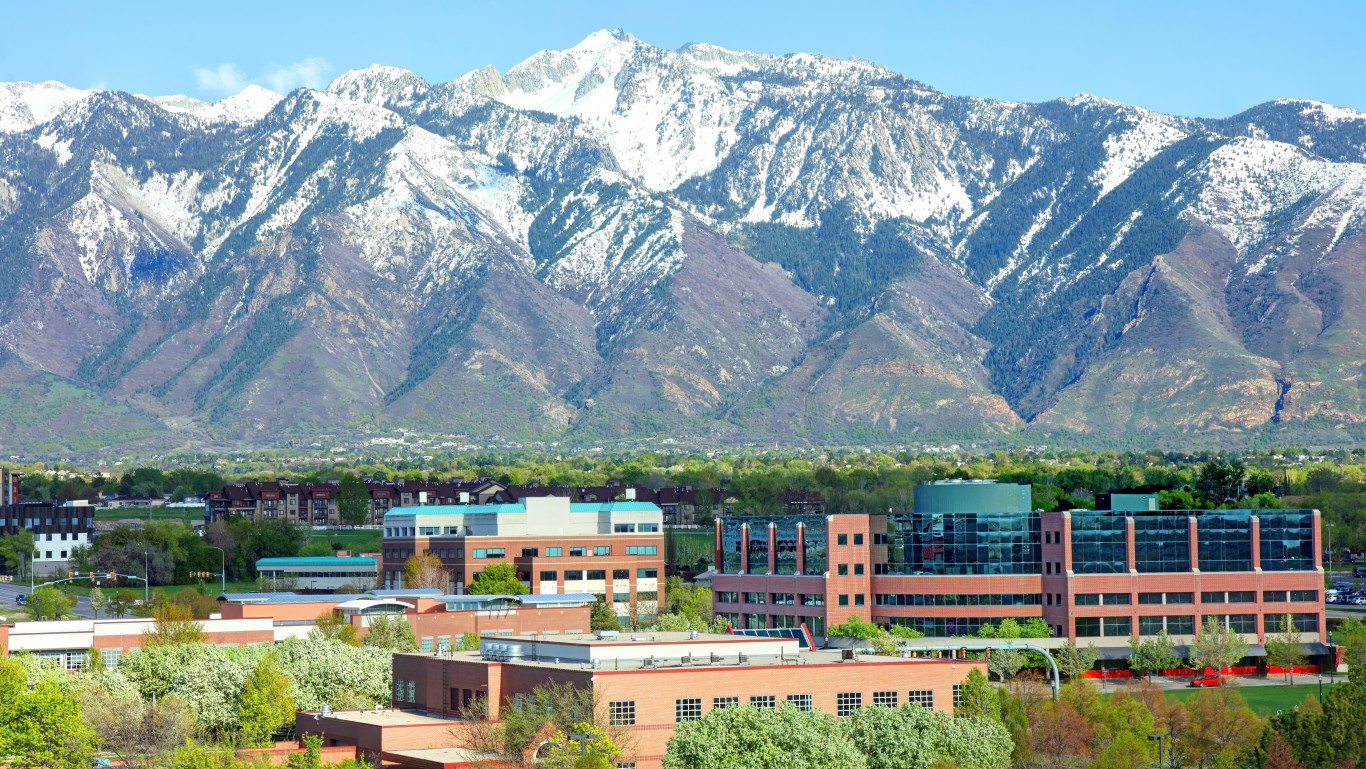
Utah: Sandy
> Population: 95,420
> 5 yr. population change: +7.6%
> Median home value: $334,200
> Median household income: $91,836
> 5 yr. avg. unemployment: 3.1%
Residents of Sandy, a city less than 20 miles south of Salt Lake City, benefit from a healthy job market. Between 2014 and 2018, the number of people working in the city climbed by 9.2%, well above the national employment growth rate of 6.5%. An average of just 3.1% of the local labor force was unemployed in the last five years, well below the comparable 5.9% national unemployment rate.
Like many cities and municipalities on this list, Sandy appears to be an attractive place for new residents and families. In the past five years, the city’s population increased by 7.6%, more than double the 3.6% national population growth over the same period.
[in-text-ad-2]

Source: kenlund / Flickr
Vermont: South Burlington
> Population: 18,975
> 5 yr. population change: +4.5%
> Median home value: $299,100
> Median household income: $71,017
> 5 yr. avg. unemployment: 3.3%
Sitting along Lake Champlain, South Burlington is adjacent to Burlington, the largest city in Vermont. A higher than average per capita concentration of businesses and attractions such as bars, restaurants, hotels, gyms, marinas, golf courses, museums, and movie theaters, improves quality of life in the area. These businesses, in addition to nearby colleges such as Champlain College and the University of Vermont, provide a wide range of employment opportunities for local residents. Over the last five years, an average of just 3.3% of the labor force in South Burlington was unemployed, well below the 5.9% national average.
Areas with economic opportunity often have lower crime rates. In South Burlington, there were just 166 violent crimes for every 100,000 people in 2018, less than half the comparable national rate of 381 per 100,000.
Source: Thinkstock
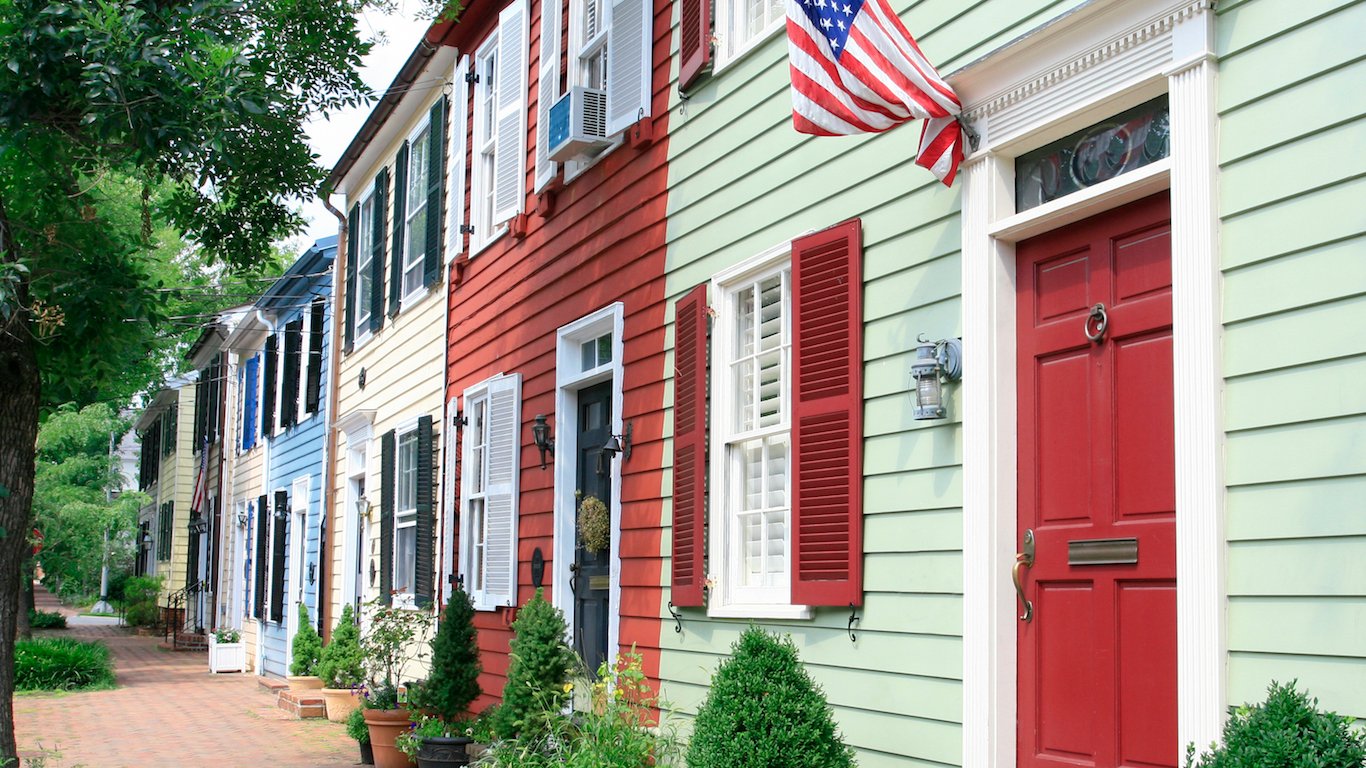
Virginia: Alexandria
> Population: 156,505
> 5 yr. population change: +8.9%
> Median home value: $557,000
> Median household income: $96,733
> 5 yr. avg. unemployment: 3.3%
Alexandria is a city of over 156,000 residents that sits within the Beltway around Washington D.C. Residents have access to jobs in and around the nation’s capital, and partially as a result, the area’s five-year average unemployment rate was just 3.3% — well below the comparable 5.9% national rate. Many of those jobs are high paying, as most households in the city earn over $96,000 a year.
Alexandria residents also benefit from a reliable public transit system — more than one in every five workers in the city commute using public transportation, compared to just 5% of workers nationwide.
[in-text-ad]

Source: Art Wager / E+ via Getty Images
Washington: Mercer Island
> Population: 25,492
> 5 yr. population change: +9.4%
> Median home value: $1,135,200
> Median household income: $142,413
> 5 yr. avg. unemployment: 3.6%
Mercer Island is a municipality on an island in Lake Washington, in between the cities of Seattle and Bellevue. Though the cost of living on the island, particularly housing, is higher than average, area residents also have relatively high incomes. The typical Mercer Island household earns $142,413 a year, more than double the national median household income of $60,293.
The island also boasts a range of cultural and entertainment options, with a far greater than typical per capita concentration of places like restaurants, gyms, movie theaters, and museums.
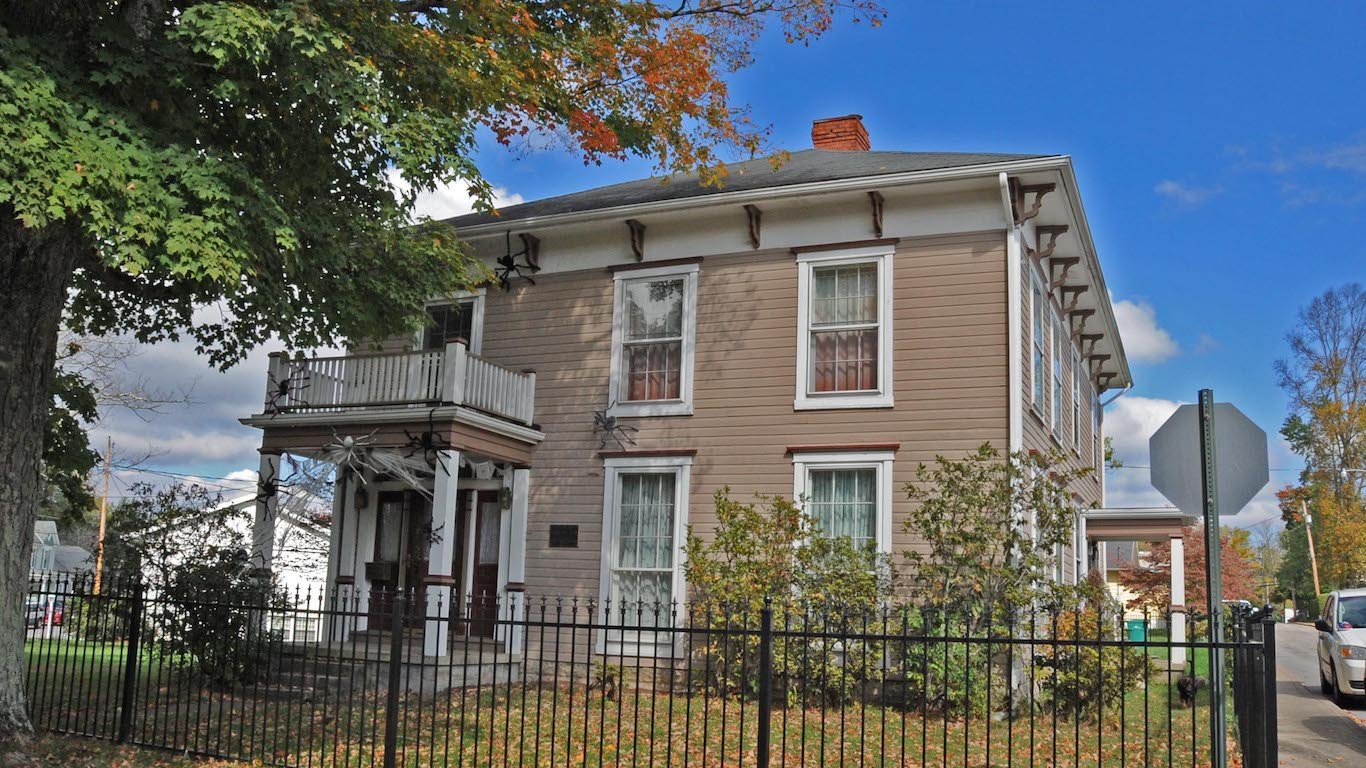
Source: JERRYE & ROY KLOTZ M.D. / Wikimedia Commons
West Virginia: Bridgeport
> Population: 8,466
> 5 yr. population change: +2.5%
> Median home value: $220,100
> Median household income: $80,666
> 5 yr. avg. unemployment: 2.6%
Bridgeport is a small city of fewer than 9,000 people located in central West Virginia. A relatively affluent area, Bridgeport’s median household income of $80,666 is about $20,000 higher than the median household income nationwide. The area’s high incomes are bolstered by a strong job market. An average of just 2.6% of the city’s labor force was unemployed in the last five years, well below the comparable 5.9% national unemployment rate.
Bridgeport residents have options when it comes to their leisure time. The city has a far higher than typical concentration of bars, restaurants, recreation centers, and golf courses.

Wisconsin: Whitefish Bay
> Population: 14,039
> 5 yr. population change: -0.5%
> Median home value: $373,200
> Median household income: $117,300
> 5 yr. avg. unemployment: 2.1%
Whitefish Bay, a Milwaukee suburb along the shore of Lake Michigan, ranks as the best place to live in Wisconsin. The high quality of life in Whitefish Bay is partially the result of a strong job market. The area’s unemployment rate over the last five years averaged just 2.1% â less than half the comparable nationwide rate of 5.9%.
According to the village website, area residents choose to live in the town because of the local school quality, well maintained public property, and safety. Indeed, Whitefish Bay is one of the safest places in the country. There were 71.8 violent crimes reported in the village for every 100,000 people in 2018, a fraction of the national violent crime rate of 380.6 per 100,000.
[in-text-ad-2]
Source: hakkun / Wikimedia Commons
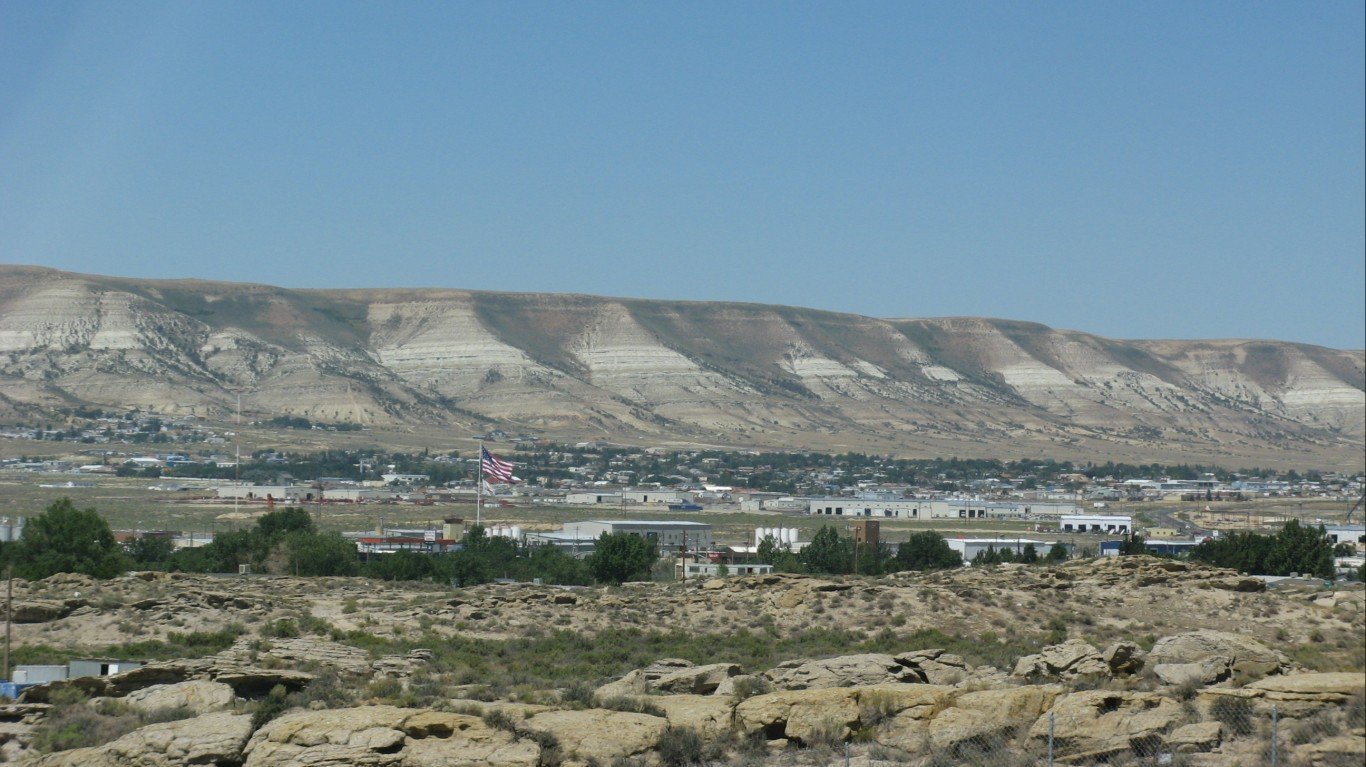
Wyoming: Rock Springs
> Population: 23,633
> 5 yr. population change: +0.4%
> Median home value: $217,400
> Median household income: $75,441
> 5 yr. avg. unemployment: 4.8%
Rock Springs, located in southwest Wyoming, ranks as the best city to live in the state. The city has a median household income of $75,441, which is about $15,000 higher than the median household income across the U.S. While some higher-income communities tend to also be more expensive, goods and services are still relatively affordable in the city, costing about 10% less than the national average.
Methodology
To identify the best cities to live in, 24/7 Wall St. created a weighted index of 25 measures across four categories: affordability, economy, quality of life, and community.
1.) The affordability category consists of three measures:
- The ratio of median home value to median household income at full weight.
- Median property taxes paid as a percentage of median home value at one-fourth weight.
- Regional price parity, a measure of cost of living, was included at full weight.
2.) The economy category consists of four measures:
- Median home value was included at full weight.
- Employment growth from 2014 to 2018 was included at one-half weight.
- The ratio of the number of employed workers to the total population was included at one-half weight.
- The unemployment rate was included at full weight.
3.) The quality of life category consists of six measures:
- The poverty rate was included at full weight.
- The share of the population in urban census tracts at least 1 mile from a grocery store and in rural census tracts at least 10 miles from a grocery store, a measure of poor food access, was included at full weight.
- The distance from the city center to the nearest hospital was included at full weight.
- The percentage of patients discharged from acute care hospitals who are readmitted to the hospital within 30 days was included at full weight.
- The percentage of heart attack, coronary artery bypass grafting (CABG) surgery, chronic obstructive pulmonary disease (COPD), heart failure, pneumonia, and stroke patients who pass away within 30 days of treatment was included at full weight.
- The number of drug-related fatalities per 100,000 residents was included at one-fourth weight.
4.) The community category consists of 12 measures:
- The percentage of workers 16 and over commuting by public transit, walking, or other non-car means was included at one-half weight.
- The average travel time to work was included at full weight.
- The number of hospital admissions for conditions that could be treated in an outpatient setting per 1,000 Medicare enrollees — an indication of poor outpatient care and overuse of hospitals — was included at one-half weight.
- The number of violent crimes — homicide, rape, robbery, and aggravated assault — reported per 100,000 residents was included at full weight.
- The number of property crimes — burglary, larceny, motor vehicle theft, and arson — reported per 100,000 residents was included at full weight.
- The number of movie theaters per 100,000 residents was included at one-fourth weight.
- The number of libraries and archives per 100,000 residents was included at one-fourth weight.
- The number of theater companies and dinner theaters per 100,000 residents was included at one-fourth weight.
- The number of museums per 100,000 residents was included at one-fourth weight.
- The number of nature parks and similar institutions per 100,000 residents was included at one-fourth weight.
- The number of alcoholic drinking places per 100,000 residents was included at one-fourth weight.
- The number of restaurants and other eating places per 100,000 residents was included at one-fourth weight.
Data on population, employment, unemployment, median home value, median household income, median property taxes paid, commuter characteristics, average travel time to work, and poverty came from the U.S. Census Bureau’s American Community Survey and are five-year estimates for the period 2014 to 2018. Employment data used to calculate five-year employment growth are five-year estimates for the years 2010 to 2014. Data on cost of living came from real estate analysis company ATTOM Data Solutions and is for the year 2014.
Data on the share of the population in urban census tracts or areas at least 1 mile from a grocery store and in rural census tracts at least 10 miles from a grocery store, a measure of poor food access, came from the U.S. Department of Agriculture’s 2017 update to the Food Access Research Atlas and is at the county level.
Data on hospital locations came from the Centers for Medicare & Medicaid Services. Data on 30-day readmission rates and 30-day mortality rates also came from the CMS and are for the period July 2015 to June 2018. Data was aggregated to the city level for cities with at least one hospital, and was aggregated to the county level for cities with no hospitals. Data on the number of drug-related deaths per 100,000 residents per year from the period 2015 to 2017 is from the Centers for Disease Control and Prevention and is at the county level. Data on preventable hospitalizations per 1,000 Medicare enrollees came from the 2019 County Health Rankings and Roadmaps program, a collaboration between the Robert Wood Johnson Foundation and University of Wisconsin Population Health Institute, and is at the county level.
Data on the number of violent crimes and property crimes reported per 100,000 residents came from the FBI’s Uniform Crime Reporting Program and are for the year 2018.
Data on the number of movie theaters, libraries and archives, theater companies and dinner theaters, museums, nature parks and other similar institutions, alcoholic beverage drinking places, and restaurants and other eating places came from the Census Bureau’s 2017 County Business Patterns series and is at the county level.
To avoid geographic clustering, we only took the top-ranking city in a given county. Our list includes cities, towns, villages, boroughs, and Census designated places. We did not include places with fewer than 8,000 residents in our analysis. Additionally, any city or town with a poverty rate or unemployment above the national average was not considered.
Sponsored: Find a Qualified Financial Advisor
Finding a qualified financial advisor doesn’t have to be hard. SmartAsset’s free tool matches you with up to 3 fiduciary financial advisors in your area in 5 minutes. Each advisor has been vetted by SmartAsset and is held to a fiduciary standard to act in your best interests. If you’re ready to be matched with local advisors that can help you achieve your financial goals, get started now.
Thank you for reading! Have some feedback for us?
Contact the 24/7 Wall St. editorial team.