With schools reopening across the country, teachers and students will inevitably be at greater risk of contracting COVID-19. Educators, who are responsible for molding the future generation, are protesting or threatening to strike in several states because they don’t feel safe physically returning to the classroom.
Though teaching is considered one of the more important jobs, teachers are not among the best paid jobs. Teachers have repeatedly had to take to the streets to get more funds for their schools, fight for better conditions, and higher wages. The teachers strikes in Arizona, West Virginia, and Oklahoma in 2018 demonstrated how in some states pay for teachers, as well as funding for schools in general, might be insufficient.
24/7 Wall St. reviewed the median annual salary for elementary, middle, and secondary schools teachers in every state from the May 2019 Occupational Employment Statistics (OES) program produced by the U.S. Labor Department to determine the states where teachers are paid the most and least.
The U.S. median annual salary across K-12 teaching professions is $64,524, but it varies significantly by state from just under $45,000 to more than $85,000.
Additionally, the annual salary for teachers varies geographically. Ten of the 15 states with the lowest pay for educators are in the South. States with the highest pay for teachers tend to be on the West Coast and the Northeast.
Teacher salaries are just one component of a state’s overall public schools spending, and states with low teacher salaries also have relatively low education expenditures per-pupil. Among the 25 states with lowest median annual teacher salaries, per-pupil expenditures do not exceed the average expenditure of $20,722 per pupil nationwide in all but two states. Only four states on the higher end of the teacher pay range spend less than the national average per student.
In states that pay teachers relatively little the average wage for all occupations is also relatively lower. In fact, in only one of the 25 states with the lowest annual average salary for teachers, the average wage for all jobs is higher than the national average of $53,490.
Though being a teacher comes with many challenges, only one of which is financial, teachers are not leaving the profession. In fact, the number of all elementary, middle, and secondary school teachers is projected to grow, albeit not by a lot, between 2019 and 2029 — these are America’s fastest growing jobs.
Click here for the states where teachers are paid the most and least
Click here for our detailed methodology

Source: DenisTangneyJr / Getty Images
50. South Dakota
> Avg teacher salary, adjusted to cost of living: $44,472
> Avg salary, all workers: $42,920 — 3rd lowest
> 2017 school spending per student: $17,659 — 16th lowest
> Teacher employment: 9,490 (42.9% elementary, 20.2% middle, 36.9% high school)
> High school graduation rate: 84.1% — 20th lowest
> Cost of living: 12.1% lower than nat’l avg. — 6th lowest
[in-text-ad]

Source: SeanPavonePhoto / Getty Images
49. Mississippi
> Avg teacher salary, adjusted to cost of living: $45,803
> Avg salary, all workers: $40,090 — the lowest
> 2017 school spending per student: $17,101 — 13th lowest
> Teacher employment: 27,370 (45.1% elementary, 22.6% middle, 32.3% high school)
> High school graduation rate: 84.0% — 19th lowest
> Cost of living: 14.0% lower than nat’l avg. — 2nd lowest
 24/7 Wall St.
Source: DenisTangneyJr / Getty Images
48. Oklahoma
> Avg teacher salary, adjusted to cost of living: $46,471
> Avg salary, all workers: $45,620 — 11th lowest
> 2017 school spending per student: $15,069 — 6th lowest
> Teacher employment: 37,980 (47.3% elementary, 21.9% middle, 30.8% high school)
> High school graduation rate: 81.8% — 12th lowest
> Cost of living: 11.6% lower than nat’l avg. — 8th lowest

Source: Sean Pavone / Getty Images
47. West Virginia
> Avg teacher salary, adjusted to cost of living: $46,805
> Avg salary, all workers: $43,420 — 4th lowest
> 2017 school spending per student: $19,811 — 23rd lowest
> Teacher employment: 14,950 (35.7% elementary, 34.5% middle, 29.8% high school)
> High school graduation rate: 90.2% — 4th highest
> Cost of living: 12.2% lower than nat’l avg. — 5th lowest
[in-text-ad-2]
Source: miroslav_1 / iStock
46. Arizona
> Avg teacher salary, adjusted to cost of living: $47,012
> Avg salary, all workers: $50,930 — 20th highest
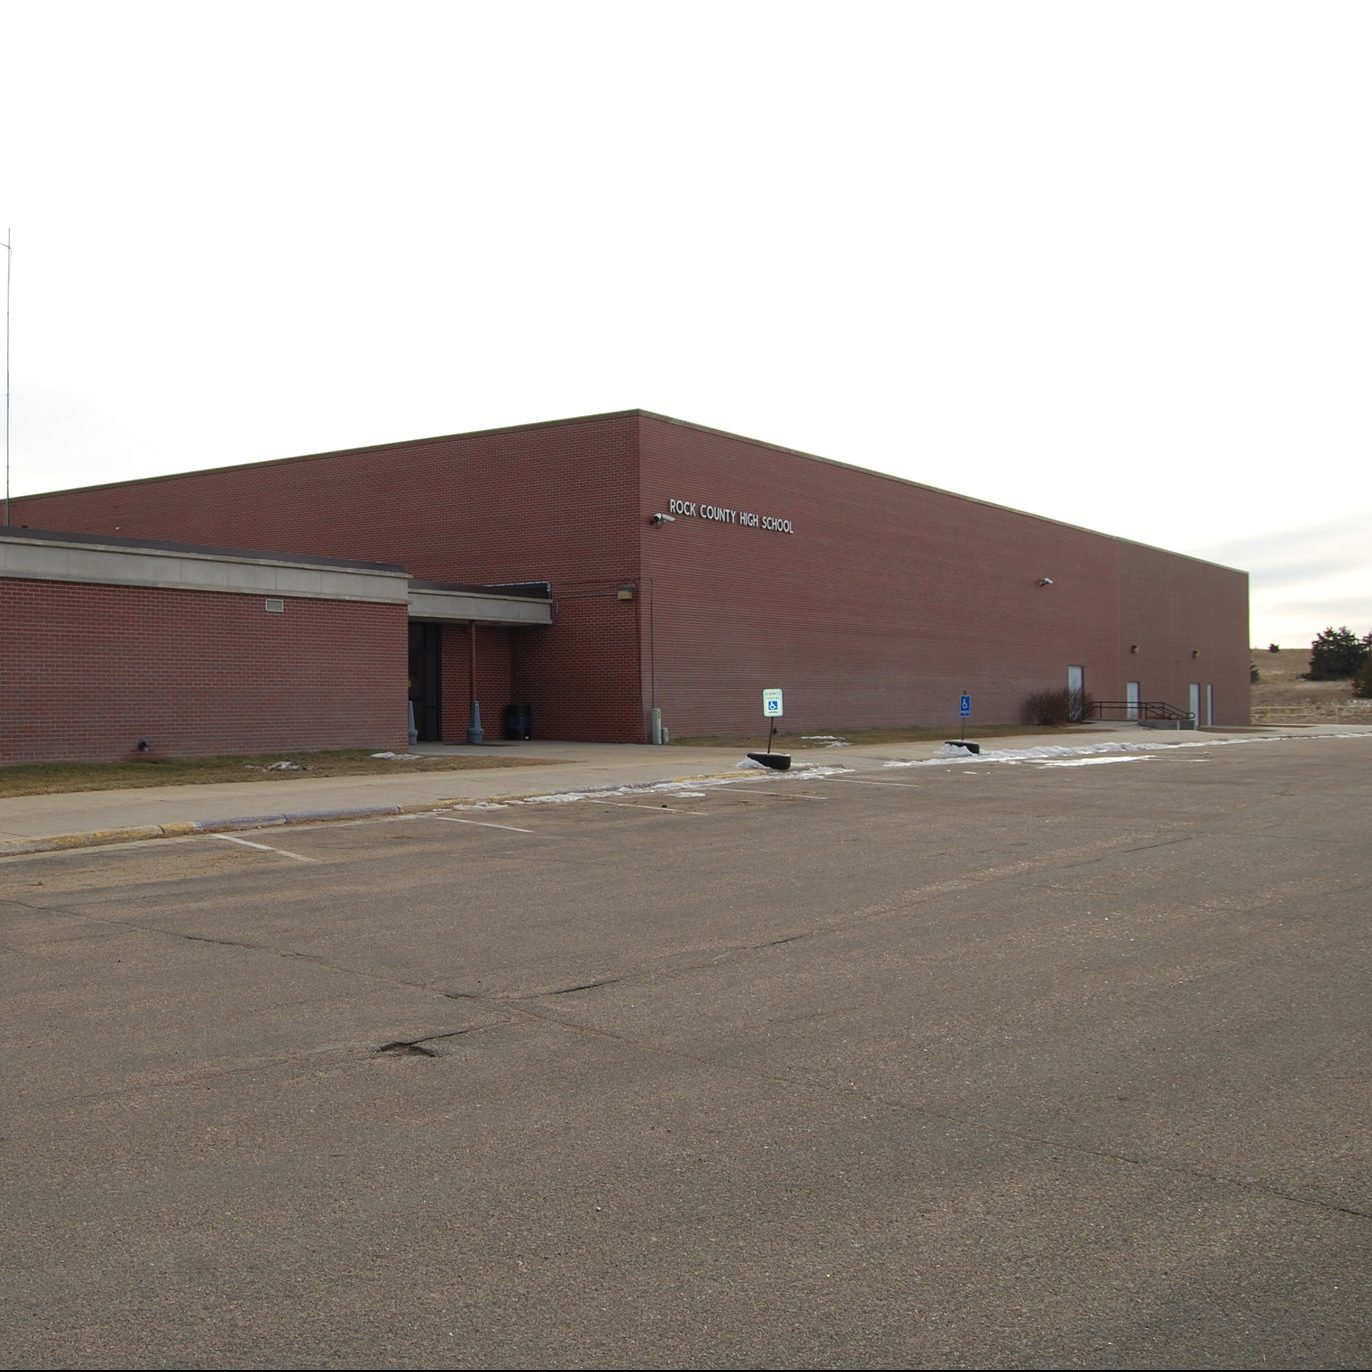
> 2017 school spending per student: $13,651 — 3rd lowest
> Teacher employment: 52,610 (44.3% elementary, 23.4% middle, 32.3% high school)
> High school graduation rate: 78.7% — 4th lowest
> Cost of living: 3.5% lower than nat’l avg. — 25th highest

Source: Kruck20 / iStock via Getty Images
45. North Carolina
> Avg teacher salary, adjusted to cost of living: $49,179
> Avg salary, all workers: $48,550 — 22nd lowest
> 2017 school spending per student: $17,461 — 15th lowest
> Teacher employment: 85,320 (49.8% elementary, 22.0% middle, 28.2% high school)
> High school graduation rate: 86.3% — 25th lowest
> Cost of living: 8.2% lower than nat’l avg. — 19th lowest
[in-text-ad]

Source: pedrosz / Flickr
44. Louisiana
> Avg teacher salary, adjusted to cost of living: $49,933
> Avg salary, all workers: $44,170 — 6th lowest
> 2017 school spending per student: $17,271 — 14th lowest
> Teacher employment: 46,080 (51.4% elementary, 16.5% middle, 32.1% high school)
> High school graduation rate: 81.4% — 9th lowest
> Cost of living: 10.9% lower than nat’l avg. — 10th lowest

Source: mattalberts / Getty Images
43. Idaho
> Avg teacher salary, adjusted to cost of living: $50,111
> Avg salary, all workers: $44,890 — 8th lowest
> 2017 school spending per student: $11,831 — the lowest
> Teacher employment: 16,410 (51.1% elementary, 11.1% middle, 37.8% high school)
> High school graduation rate: 80.7% — 6th lowest
> Cost of living: 7.5% lower than nat’l avg. — 22nd lowest

Source: Sean Pavone / Getty Images
42. Arkansas
> Avg teacher salary, adjusted to cost of living: $50,362
> Avg salary, all workers: $42,690 — 2nd lowest
> 2017 school spending per student: $16,751 — 10th lowest
> Teacher employment: 31,400 (41.4% elementary, 20.5% middle, 38.0% high school)
> High school graduation rate: 89.2% — 9th highest
> Cost of living: 14.7% lower than nat’l avg. — the lowest
[in-text-ad-2]

Source: Sean Pavone / Getty Images
41. Alabama
> Avg teacher salary, adjusted to cost of living: $51,069
> Avg salary, all workers: $44,930 — 9th lowest
> 2017 school spending per student: $18,947 — 19th lowest
> Teacher employment: 49,190 (48.1% elementary, 21.0% middle, 31.0% high school)
> High school graduation rate: 90.0% — 5th highest
> Cost of living: 13.6% lower than nat’l avg. — 3rd lowest

Source: Sean Pavone / iStock via Getty Images
40. Missouri
> Avg teacher salary, adjusted to cost of living: $51,122
> Avg salary, all workers: $47,820 — 19th lowest
> 2017 school spending per student: $16,837 — 11th lowest
> Teacher employment: 64,570 (35.4% elementary, 17.2% middle, 47.5% high school)
> High school graduation rate: 89.2% — 9th highest
> Cost of living: 11.2% lower than nat’l avg. — 9th lowest
[in-text-ad]
Source: Jeff Zehnder / Shutterstock.com
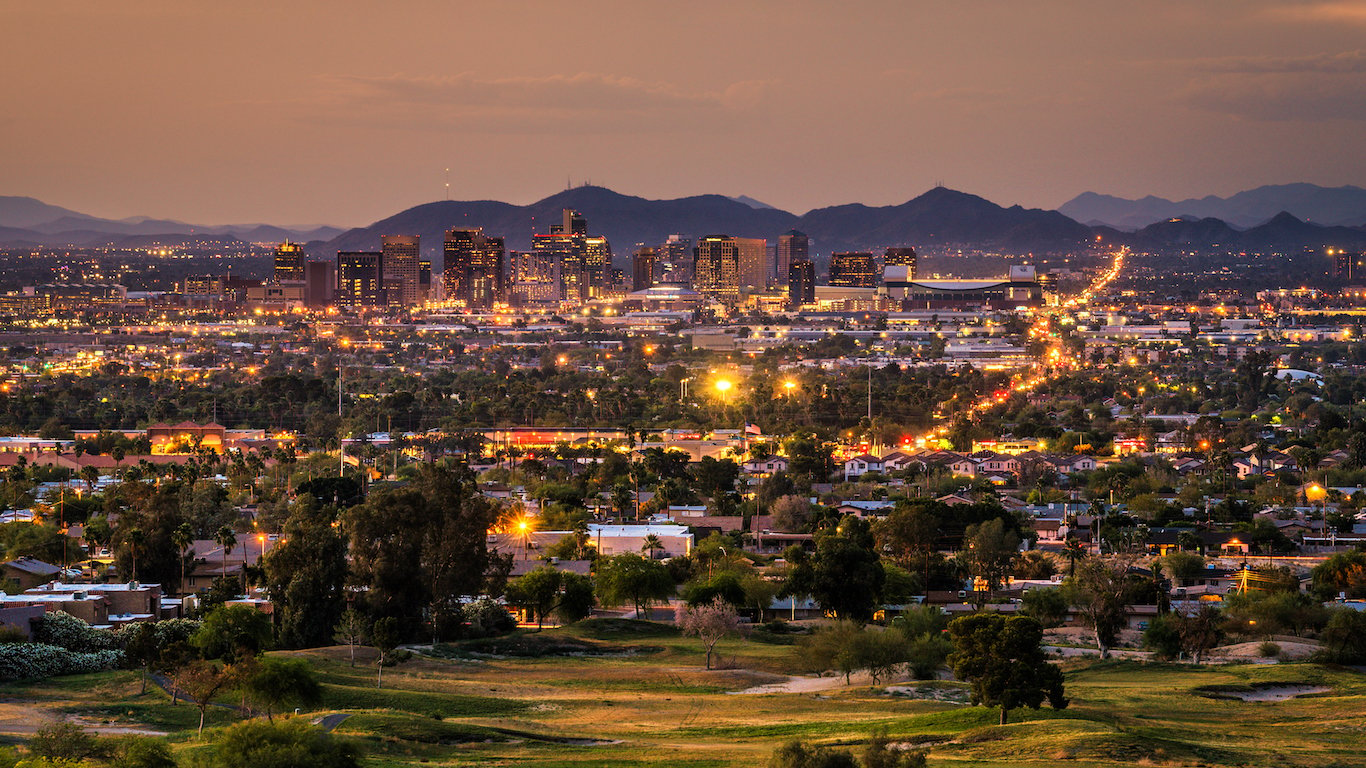
39. Kansas
> Avg teacher salary, adjusted to cost of living: $51,674
> Avg salary, all workers: $46,520 — 13th lowest
> 2017 school spending per student: $19,962 — 24th lowest
> Teacher employment: 35,280 (46.3% elementary, 18.8% middle, 34.9% high school)
> High school graduation rate: 87.2% — 18th highest
> Cost of living: 10.0% lower than nat’l avg. — 15th lowest

Source: f11photo / Getty Images
38. Indiana
> Avg teacher salary, adjusted to cost of living: $52,758
> Avg salary, all workers: $46,770 — 14th lowest
> 2017 school spending per student: $16,910 — 12th lowest
> Teacher employment: 58,030 (44.0% elementary, 19.5% middle, 36.5% high school)
> High school graduation rate: 88.1% — 14th highest
> Cost of living: 10.7% lower than nat’l avg. — 12th lowest
Source: Nick Fox / Shutterstock.com
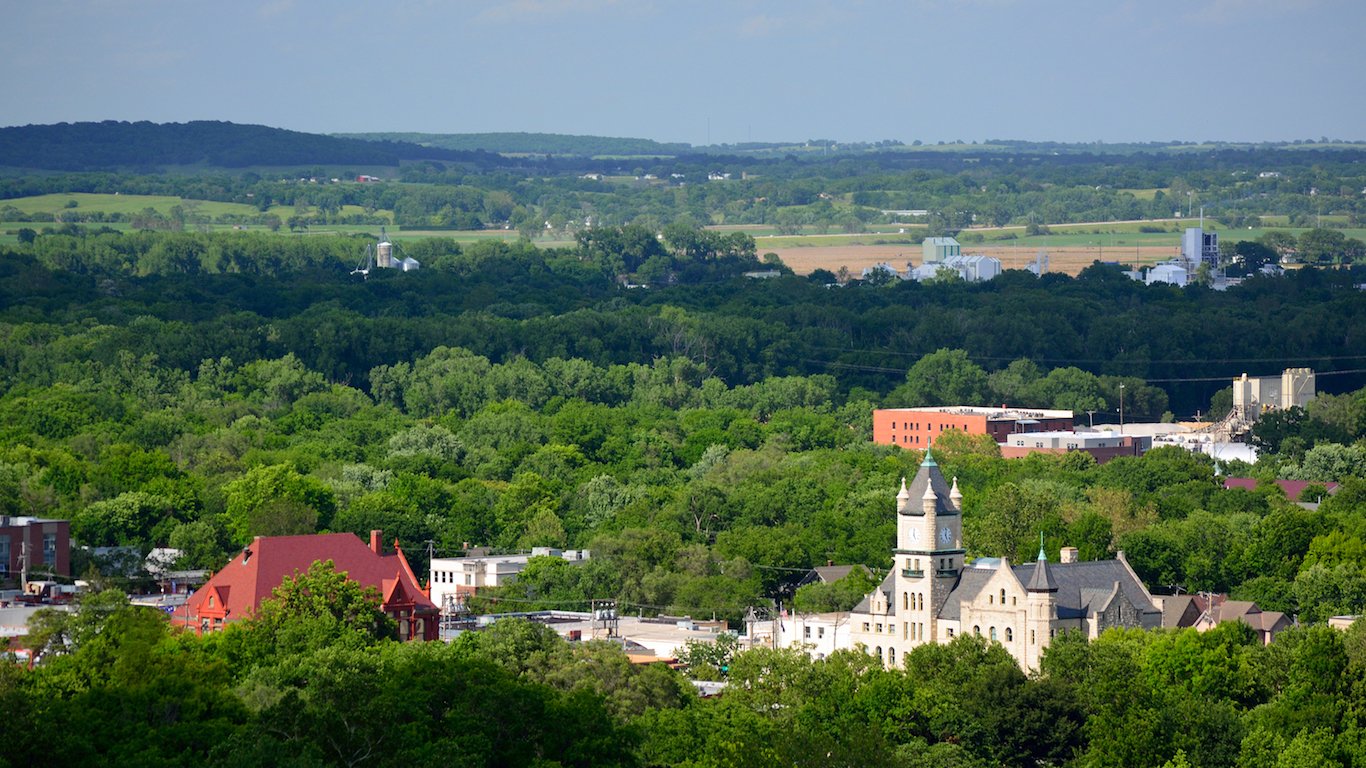
37. Montana
> Avg teacher salary, adjusted to cost of living: $53,501
> Avg salary, all workers: $45,370 — 10th lowest
> 2017 school spending per student: $20,062 — 25th lowest
> Teacher employment: 10,660 (46.2% elementary, 19.4% middle, 34.4% high school)
> High school graduation rate: 86.4% — 25th highest
> Cost of living: 6.7% lower than nat’l avg. — 25th lowest
[in-text-ad-2]

Source: Sean Pavone / Getty Images
36. Kentucky
> Avg teacher salary, adjusted to cost of living: $53,655
> Avg salary, all workers: $44,020 — 5th lowest
> 2017 school spending per student: $18,908 — 18th lowest
> Teacher employment: 39,710 (48.5% elementary, 20.5% middle, 30.9% high school)
> High school graduation rate: 90.3% — 3rd highest
> Cost of living: 12.2% lower than nat’l avg. — 5th lowest

Source: Sean Pavone / Getty Images
35. Tennessee
> Avg teacher salary, adjusted to cost of living: $54,097
> Avg salary, all workers: $45,650 — 12th lowest
> 2017 school spending per student: $14,485 — 4th lowest
> Teacher employment: 64,550 (47.4% elementary, 20.5% middle, 32.1% high school)
> High school graduation rate: 90.0% — 5th highest
> Cost of living: 10.1% lower than nat’l avg. — 14th lowest
[in-text-ad]

Source: SeanPavonePhoto / Getty Images
34. Maine
> Avg teacher salary, adjusted to cost of living: $54,629
> Avg salary, all workers: $48,470 — 21st lowest
> 2017 school spending per student: $20,243 — 25th highest
> Teacher employment: 14,410 (40.1% elementary, 22.4% middle, 37.5% high school)
> High school graduation rate: 86.7% — 22nd highest
> Cost of living: same as than nat’l avg. — 16th highest

Source: Sean Pavone / Getty Images
33. South Carolina
> Avg teacher salary, adjusted to cost of living: $54,808
> Avg salary, all workers: $44,380 — 7th lowest
> 2017 school spending per student: $19,374 — 22nd lowest
> Teacher employment: 46,390 (48.6% elementary, 21.1% middle, 30.3% high school)
> High school graduation rate: 81.0% — 8th lowest
> Cost of living: 8.9% lower than nat’l avg. — 18th lowest

Source: pabradyphoto / Getty Images
32. Iowa
> Avg teacher salary, adjusted to cost of living: $55,028
> Avg salary, all workers: $47,330 — 17th lowest
> 2017 school spending per student: $22,008 — 18th highest
> Teacher employment: 38,590 (48.5% elementary, 20.5% middle, 31.0% high school)
> High school graduation rate: 91.4% — the highest
> Cost of living: 10.8% lower than nat’l avg. — 11th lowest
[in-text-ad-2]

Source: f11photo / Getty Images
31. Colorado
> Avg teacher salary, adjusted to cost of living: $55,263
> Avg salary, all workers: $57,690 — 9th highest
> 2017 school spending per student: $19,129 — 21st lowest
> Teacher employment: 56,300 (45.7% elementary, 23.1% middle, 31.2% high school)
> High school graduation rate: 80.8% — 7th lowest
> Cost of living: 1.9% greater than nat’l avg. — 13th highest

Source: ferrantraite / Getty Images
30. New Mexico
> Avg teacher salary, adjusted to cost of living: $55,943
> Avg salary, all workers: $47,040 — 15th lowest
> 2017 school spending per student: $20,388 — 24th highest
> Teacher employment: 17,780 (43.0% elementary, 18.3% middle, 38.7% high school)
> High school graduation rate: 73.9% — the lowest
> Cost of living: 8.9% lower than nat’l avg. — 18th lowest
[in-text-ad]

Source: SeanPavonePhoto / Getty Images
29. Florida
> Avg teacher salary, adjusted to cost of living: $56,345
> Avg salary, all workers: $47,750 — 18th lowest
> 2017 school spending per student: $15,103 — 7th lowest
> Teacher employment: 161,410 (47.8% elementary, 20.8% middle, 31.4% high school)
> High school graduation rate: 86.3% — 25th lowest
> Cost of living: 0.6% greater than nat’l avg. — 15th highest
 24/7 Wall St.
Source: DenisTangneyJr / Getty Images
28. North Dakota
> Avg teacher salary, adjusted to cost of living: $56,482
> Avg salary, all workers: $50,430 — 23rd highest
> 2017 school spending per student: $27,239 — 5th highest
> Teacher employment: 8,630 (51.6% elementary, 16.0% middle, 32.4% high school)
> High school graduation rate: 88.1% — 14th highest
> Cost of living: 9.4% lower than nat’l avg. — 16th lowest

Source: RoschetzkyIstockPhoto / Getty Images
27. Texas
> Avg teacher salary, adjusted to cost of living: $56,890
> Avg salary, all workers: $50,490 — 22nd highest
> 2017 school spending per student: $16,565 — 9th lowest
> Teacher employment: 303,410 (43.5% elementary, 21.2% middle, 35.3% high school)
> High school graduation rate: 90.0% — 5th highest
> Cost of living: 3.2% lower than nat’l avg. — 23rd highest
[in-text-ad-2]

Source: 4kodiak / Getty Images
26. Nevada
> Avg teacher salary, adjusted to cost of living: $57,725
> Avg salary, all workers: $47,210 — 16th lowest
> 2017 school spending per student: $13,565 — 2nd lowest
> Teacher employment: 20,240 (51.8% elementary, 19.8% middle, 28.5% high school)
> High school graduation rate: 83.2% — 17th lowest
> Cost of living: 2.5% lower than nat’l avg. — 20th highest

Source: Sean Pavone / Getty Images
25. Wisconsin
> Avg teacher salary, adjusted to cost of living: $58,559
> Avg salary, all workers: $48,850 — 23rd lowest
> 2017 school spending per student: $21,204 — 19th highest
> Teacher employment: 59,920 (47.1% elementary, 23.0% middle, 29.8% high school)
> High school graduation rate: 89.7% — 8th highest
> Cost of living: 8.1% lower than nat’l avg. — 20th lowest
[in-text-ad]

Source: Sean Pavone / Getty Images
24. Georgia
> Avg teacher salary, adjusted to cost of living: $58,784
> Avg salary, all workers: $49,620 — 25th highest
> 2017 school spending per student: $15,867 — 8th lowest
> Teacher employment: 105,190 (47.8% elementary, 27.0% middle, 25.2% high school)
> High school graduation rate: 81.6% — 10th lowest
> Cost of living: 7.0% lower than nat’l avg. — 24th lowest
 24/7 Wall St.
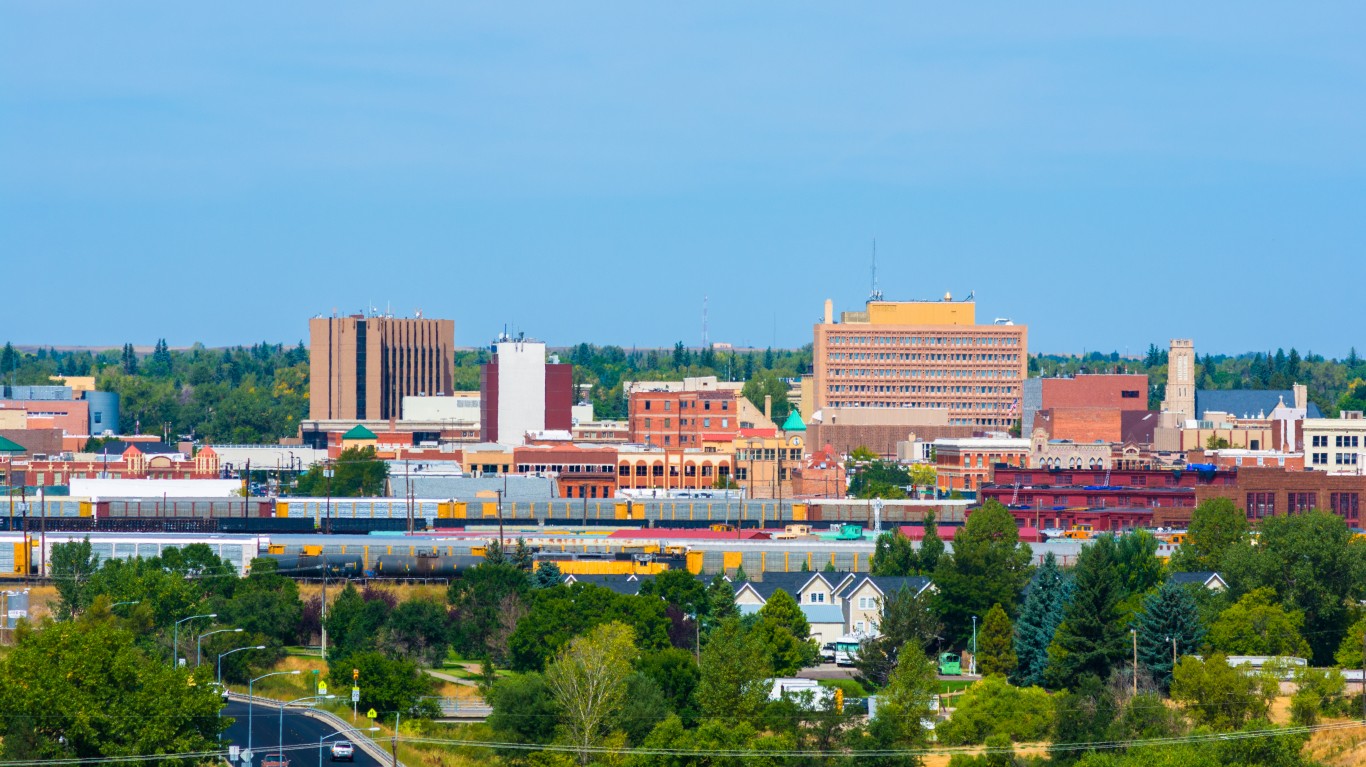
Source: Davel5957 / Getty Images
23. Wyoming
> Avg teacher salary, adjusted to cost of living: $60,211
> Avg salary, all workers: $49,760 — 24th highest
> 2017 school spending per student: $32,526 — 2nd highest
> Teacher employment: 5,330 (47.8% elementary, 20.5% middle, 31.7% high school)
> High school graduation rate: 81.7% — 11th lowest
> Cost of living: 7.3% lower than nat’l avg. — 23rd lowest

Source: DenisTangneyJr / Getty Images
22. New Hampshire
> Avg teacher salary, adjusted to cost of living: $60,288
> Avg salary, all workers: $53,950 — 16th highest
> 2017 school spending per student: $23,330 — 13th highest
> Teacher employment: 14,170 (42.8% elementary, 21.9% middle, 35.3% high school)
> High school graduation rate: 88.8% — 11th highest
> Cost of living: 6.0% greater than nat’l avg. — 9th highest
[in-text-ad-2]

Source: Davel5957 / Getty Images
21. Nebraska
> Avg teacher salary, adjusted to cost of living: $60,783
> Avg salary, all workers: $48,250 — 20th lowest
> 2017 school spending per student: $22,624 — 15th highest
> Teacher employment: 21,010 (46.7% elementary, 20.5% middle, 32.8% high school)
> High school graduation rate: 88.7% — 12th highest
> Cost of living: 10.5% lower than nat’l avg. — 13th lowest
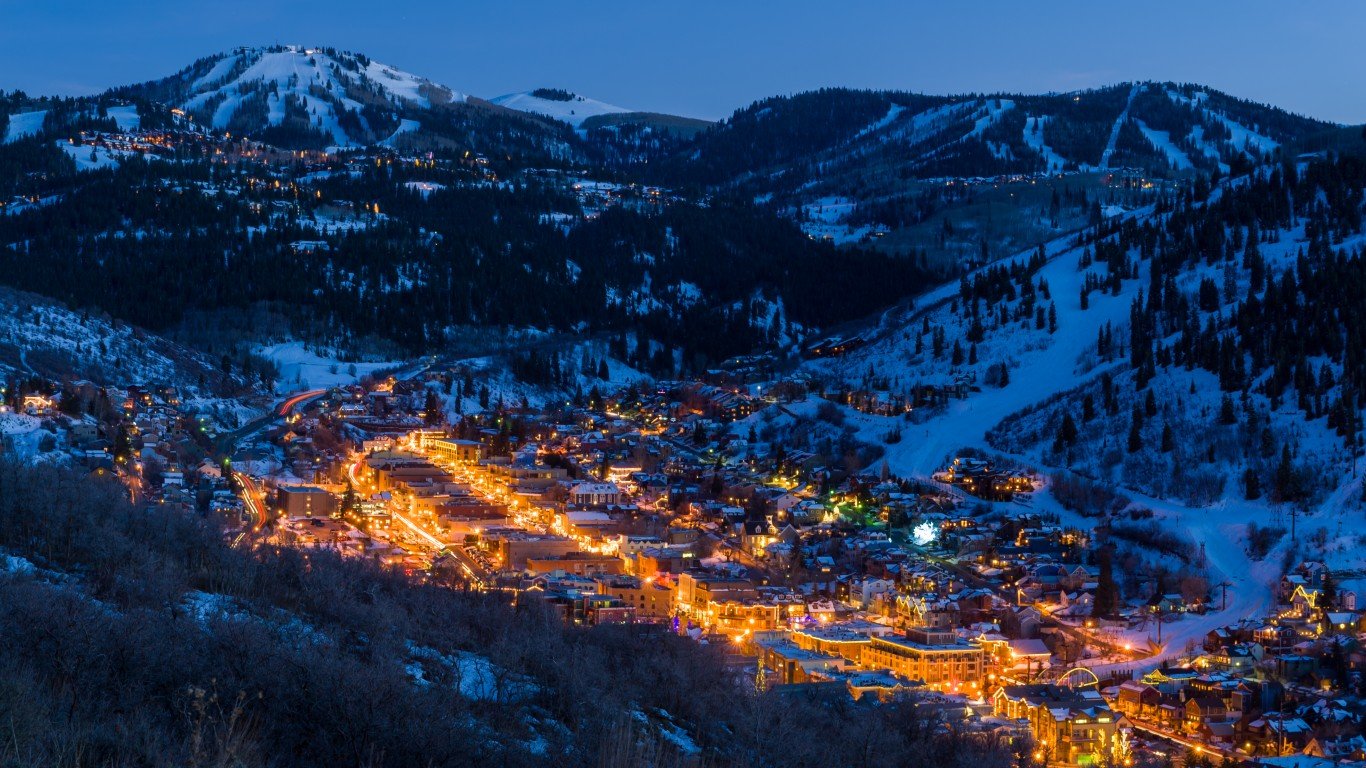
Source: Adventure_Photo / Getty Images
20. Utah
> Avg teacher salary, adjusted to cost of living: $61,482
> Avg salary, all workers: $49,420 — 24th lowest
> 2017 school spending per student: $14,887 — 5th lowest
> Teacher employment: 28,570 (45.9% elementary, 22.9% middle, 31.2% high school)
> High school graduation rate: 87.0% — 20th highest
> Cost of living: 3.4% lower than nat’l avg. — 24th highest
[in-text-ad]
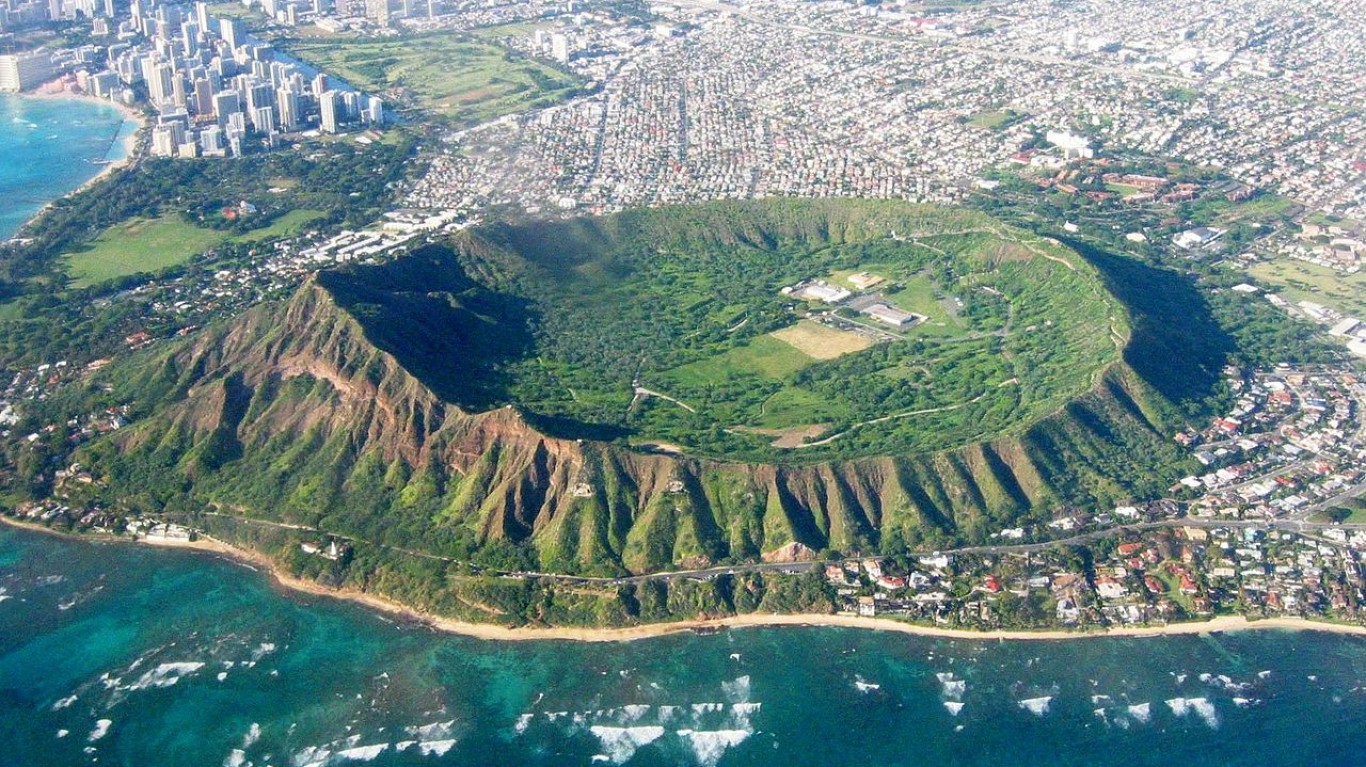
Source: Eric Tessmer / Wikimedia Commons
19. Hawaii
> Avg teacher salary, adjusted to cost of living: $63,111
> Avg salary, all workers: $54,930 — 14th highest
> 2017 school spending per student: $18,854 — 17th lowest
> Teacher employment: 12,190 (47.4% elementary, 17.1% middle, 35.4% high school)
> High school graduation rate: 84.5% — 21st lowest
> Cost of living: 18.1% greater than nat’l avg. — the highest

Source: AndreyKrav / Getty Images
18. Ohio
> Avg teacher salary, adjusted to cost of living: $64,070
> Avg salary, all workers: $49,430 — 25th lowest
> 2017 school spending per student: $20,982 — 21st highest
> Teacher employment: 135,610 (42.2% elementary, 22.8% middle, 35.0% high school)
> High school graduation rate: 82.1% — 13th lowest
> Cost of living: 11.6% lower than nat’l avg. — 8th lowest

Source: Scruggelgreen / Getty Images
17. Minnesota
> Avg teacher salary, adjusted to cost of living: $64,195
> Avg salary, all workers: $55,890 — 12th highest
> 2017 school spending per student: $22,281 — 16th highest
> Teacher employment: 52,280 (42.9% elementary, 18.6% middle, 38.5% high school)
> High school graduation rate: 83.2% — 17th lowest
> Cost of living: 2.5% lower than nat’l avg. — 20th highest
[in-text-ad-2]

Source: SeanPavonePhoto / Getty Images
16. Vermont
> Avg teacher salary, adjusted to cost of living: $64,370
> Avg salary, all workers: $51,120 — 19th highest
> 2017 school spending per student: $33,637 — the highest
> Teacher employment: 7,570 (49.8% elementary, 13.6% middle, 36.6% high school)
> High school graduation rate: 85.1% — 22nd lowest
> Cost of living: 3.0% greater than nat’l avg. — 11th highest

Source: mdgmorris / Getty Images
15. Delaware
> Avg teacher salary, adjusted to cost of living: $65,219
> Avg salary, all workers: $54,370 — 15th highest
> 2017 school spending per student: $29,287 — 4th highest
> Teacher employment: 9,330 (40.7% elementary, 23.6% middle, 35.7% high school)
> High school graduation rate: 86.9% — 21st highest
> Cost of living: 1.2% lower than nat’l avg. — 18th highest
[in-text-ad]

Source: pawel.gaul / Getty Images
14. Michigan
> Avg teacher salary, adjusted to cost of living: $66,403
> Avg salary, all workers: $50,780 — 21st highest
> 2017 school spending per student: $20,879 — 22nd highest
> Teacher employment: 73,860 (50.3% elementary, 18.8% middle, 30.9% high school)
> High school graduation rate: 80.6% — 5th lowest
> Cost of living: 7.6% lower than nat’l avg. — 21st lowest

Source: lhongfoto / Getty Images
13. Illinois
> Avg teacher salary, adjusted to cost of living: $67,128
> Avg salary, all workers: $55,130 — 13th highest
> 2017 school spending per student: $18,975 — 20th lowest
> Teacher employment: 130,780 (49.1% elementary, 16.6% middle, 34.3% high school)
> High school graduation rate: 86.5% — 24th highest
> Cost of living: 1.9% lower than nat’l avg. — 19th highest

Source: f11photo / Getty Images
12. Pennsylvania
> Avg teacher salary, adjusted to cost of living: $68,605
> Avg salary, all workers: $51,340 — 18th highest
> 2017 school spending per student: $25,427 — 8th highest
> Teacher employment: 129,690 (44.0% elementary, 20.4% middle, 35.6% high school)
> High school graduation rate: 85.9% — 23rd lowest
> Cost of living: 2.5% lower than nat’l avg. — 20th highest
[in-text-ad-2]

Source: Sean Pavone / Getty Images
11. Virginia
> Avg teacher salary, adjusted to cost of living: $69,992
> Avg salary, all workers: $56,740 — 11th highest
> 2017 school spending per student: $20,875 — 23rd highest
> Teacher employment: 82,620 (46.8% elementary, 22.1% middle, 31.0% high school)
> High school graduation rate: 87.5% — 17th highest
> Cost of living: 2.0% greater than nat’l avg. — 12th highest

Source: evenfh / Shutterstock.com
10. Washington
> Avg teacher salary, adjusted to cost of living: $70,285
> Avg salary, all workers: $62,020 — 4th highest
> 2017 school spending per student: $22,152 — 17th highest
> Teacher employment: 54,680 (55.7% elementary, 17.2% middle, 27.1% high school)
> High school graduation rate: 86.7% — 22nd highest
> Cost of living: 7.8% greater than nat’l avg. — 7th highest
[in-text-ad]

Source: 4nadia / Getty Images
9. Oregon
> Avg teacher salary, adjusted to cost of living: $70,630
> Avg salary, all workers: $53,890 — 17th highest
> 2017 school spending per student: $23,811 — 12th highest
> Teacher employment: 31,040 (51.4% elementary, 20.1% middle, 28.5% high school)
> High school graduation rate: 78.7% — 4th lowest
> Cost of living: 1.1% greater than nat’l avg. — 14th highest

Source: SeanPavonePhoto / Getty Images
8. New Jersey
> Avg teacher salary, adjusted to cost of living: $74,215
> Avg salary, all workers: $59,980 — 7th highest
> 2017 school spending per student: $26,900 — 6th highest
> Teacher employment: 97,460 (41.7% elementary, 27.3% middle, 31.0% high school)
> High school graduation rate: 90.9% — 2nd highest
> Cost of living: 15.2% greater than nat’l avg. — 4th highest

Source: SeanPavonePhoto / Getty Images
7. Rhode Island
> Avg teacher salary, adjusted to cost of living: $74,414
> Avg salary, all workers: $57,220 — 10th highest
> 2017 school spending per student: $24,399 — 10th highest
> Teacher employment: 10,610 (38.6% elementary, 15.7% middle, 45.6% high school)
> High school graduation rate: 84.0% — 19th lowest
> Cost of living: 0.7% lower than nat’l avg. — 17th highest
[in-text-ad-2]

Source: Sean Pavone / Getty Images
6. Maryland
> Avg teacher salary, adjusted to cost of living: $75,612
> Avg salary, all workers: $60,230 — 6th highest
> 2017 school spending per student: $23,283 — 14th highest
> Teacher employment: 60,650 (47.2% elementary, 24.6% middle, 28.3% high school)
> High school graduation rate: 87.1% — 19th highest
> Cost of living: 8.4% greater than nat’l avg. — 6th highest
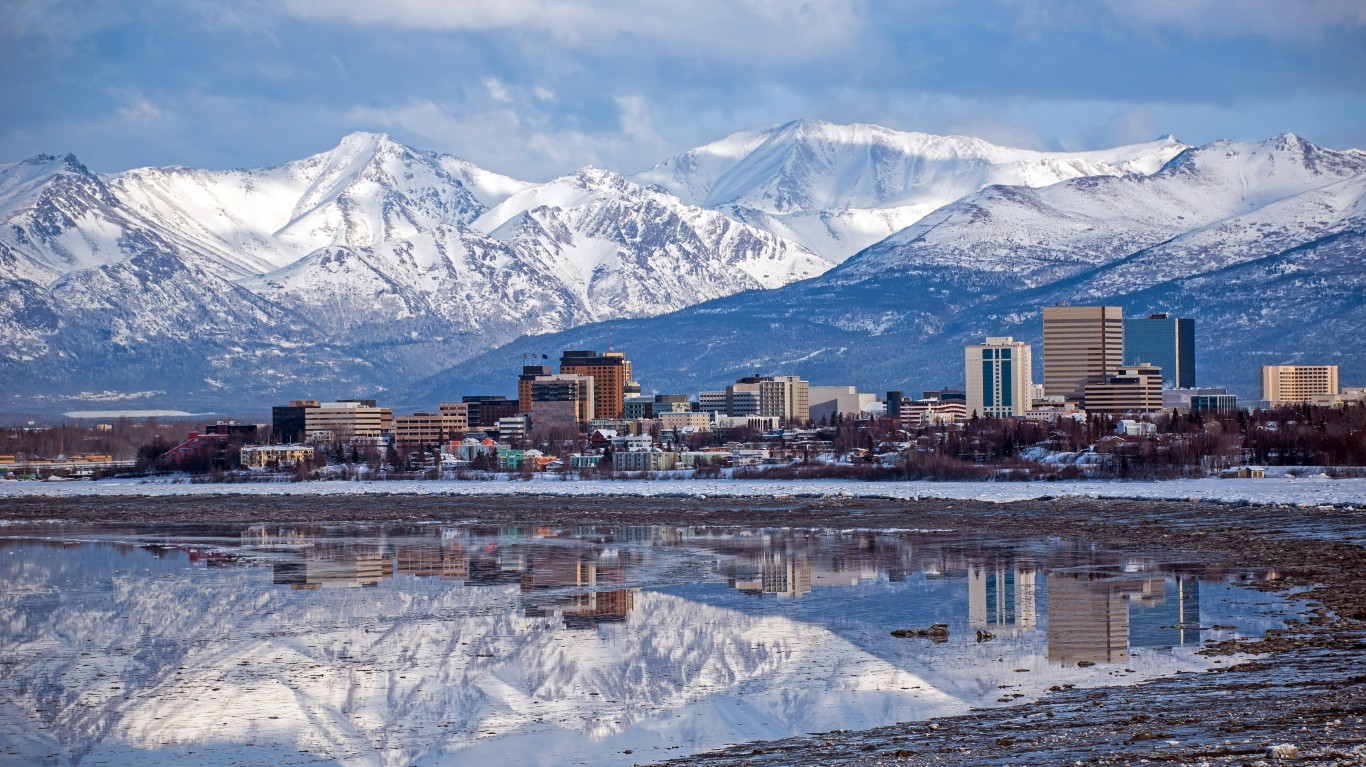
Source: Chilkoot / Getty Images
5. Alaska
> Avg teacher salary, adjusted to cost of living: $76,573
> Avg salary, all workers: $59,290 — 8th highest
> 2017 school spending per student: $24,680 — 9th highest
> Teacher employment: 7,770 (49.2% elementary, 14.9% middle, 35.9% high school)
> High school graduation rate: 78.5% — 2nd lowest
> Cost of living: 4.8% greater than nat’l avg. — 10th highest
[in-text-ad]

Source: SeanPavonePhoto / Getty Images
4. Connecticut
> Avg teacher salary, adjusted to cost of living: $78,555
> Avg salary, all workers: $62,350 — 3rd highest
> 2017 school spending per student: $25,940 — 7th highest
> Teacher employment: 40,070 (39.8% elementary, 20.8% middle, 39.5% high school)
> High school graduation rate: 88.4% — 13th highest
> Cost of living: 6.1% greater than nat’l avg. — 8th highest
 24/7 Wall St.
Source: SeanPavonePhoto / Getty Images
3. Massachusetts
> Avg teacher salary, adjusted to cost of living: $81,535
> Avg salary, all workers: $65,680 — the highest
> 2017 school spending per student: $24,282 — 11th highest
> Teacher employment: 74,460 (42.2% elementary, 21.4% middle, 36.4% high school)
> High school graduation rate: 87.8% — 16th highest
> Cost of living: 9.7% greater than nat’l avg. — 5th highest

Source: GerardoBrucker / Getty Images
2. California
> Avg teacher salary, adjusted to cost of living: $83,136
> Avg salary, all workers: $61,290 — 5th highest
> 2017 school spending per student: $21,146 — 20th highest
> Teacher employment: 314,530 (52.4% elementary, 12.6% middle, 34.9% high school)
> High school graduation rate: 83.0% — 15th lowest
> Cost of living: 15.4% greater than nat’l avg. — 3rd highest
[in-text-ad-2]

Source: Sean Pavone / iStock via Getty Images
1. New York
> Avg teacher salary, adjusted to cost of living: $85,258
> Avg salary, all workers: $63,970 — 2nd highest
> 2017 school spending per student: $31,572 — 3rd highest
> Teacher employment: 209,930 (44.1% elementary, 20.0% middle, 35.9% high school)
> High school graduation rate: 82.3% — 14th lowest
> Cost of living: 16.4% greater than nat’l avg. — 2nd highest
Methodology
To identify the states where teachers are paid the most and the least, 24/7 Wall St. reviewed the weighted cost of living adjusted average for elementary, middle, and secondary schools teachers in every state from the Occupational Employment Statistics (OES) program produced by the U.S. Labor Department. Average salaries for all workers in each state are also from the OES.
We calculated the weighted average for teacher pay using the percentage of primary, middle, and secondary teacher employment, then adjusted for cost of living using the 2018 Regional Price Parity (RPP) from the Bureau of Economic Analysis. Data are as of the latest years for which this data is available.
Statewide per-pupil expenditures in every state as of 2017 are for public schools only, and came from the U.S. Census Bureau’s survey of school finances.
Of the different high school graduation rates, we chose the newer adjusted cohort graduation rate, which measures the percentage of public school students who attain a regular high school diploma within four years of starting ninth grade. The cohort is adjusted by adding students who transfer in during those four years and by subtracting students who transfer out. The average cohort graduation rate (ACGR) for the 2017-2018 school year is from the National Center for Education Statistics (NCES).
Cost of living figures and came from the Bureau of Economic Analysis and are for 2018, the latest year for which data is available.
Take This Retirement Quiz To Get Matched With A Financial Advisor (Sponsored)
Take the quiz below to get matched with a financial advisor today.
Each advisor has been vetted by SmartAsset and is held to a fiduciary standard to act in your best interests.
Here’s how it works:
1. Answer SmartAsset advisor match quiz
2. Review your pre-screened matches at your leisure. Check out the
advisors’ profiles.
3. Speak with advisors at no cost to you. Have an introductory call on the phone or introduction in person and choose whom to work with in the future
Take the retirement quiz right here.
Thank you for reading! Have some feedback for us?
Contact the 24/7 Wall St. editorial team.
Editors' Picks