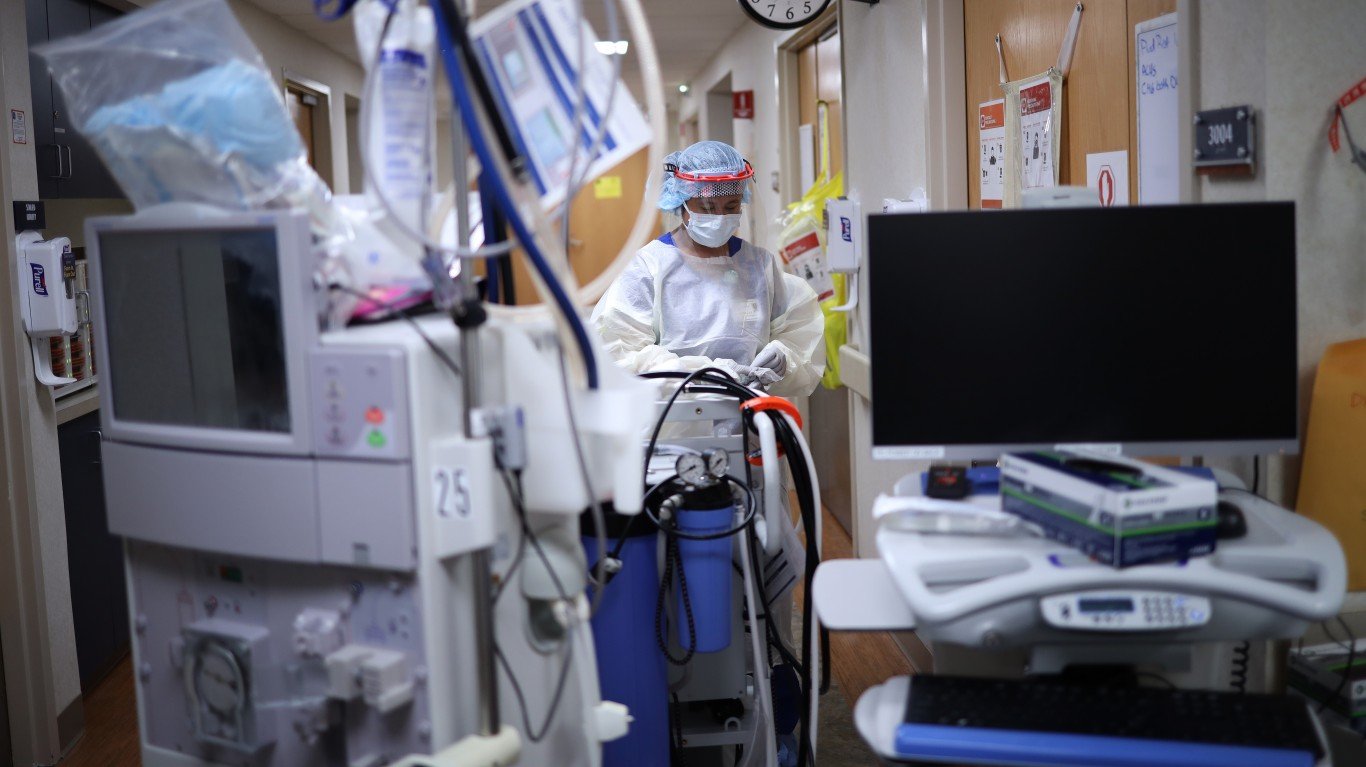
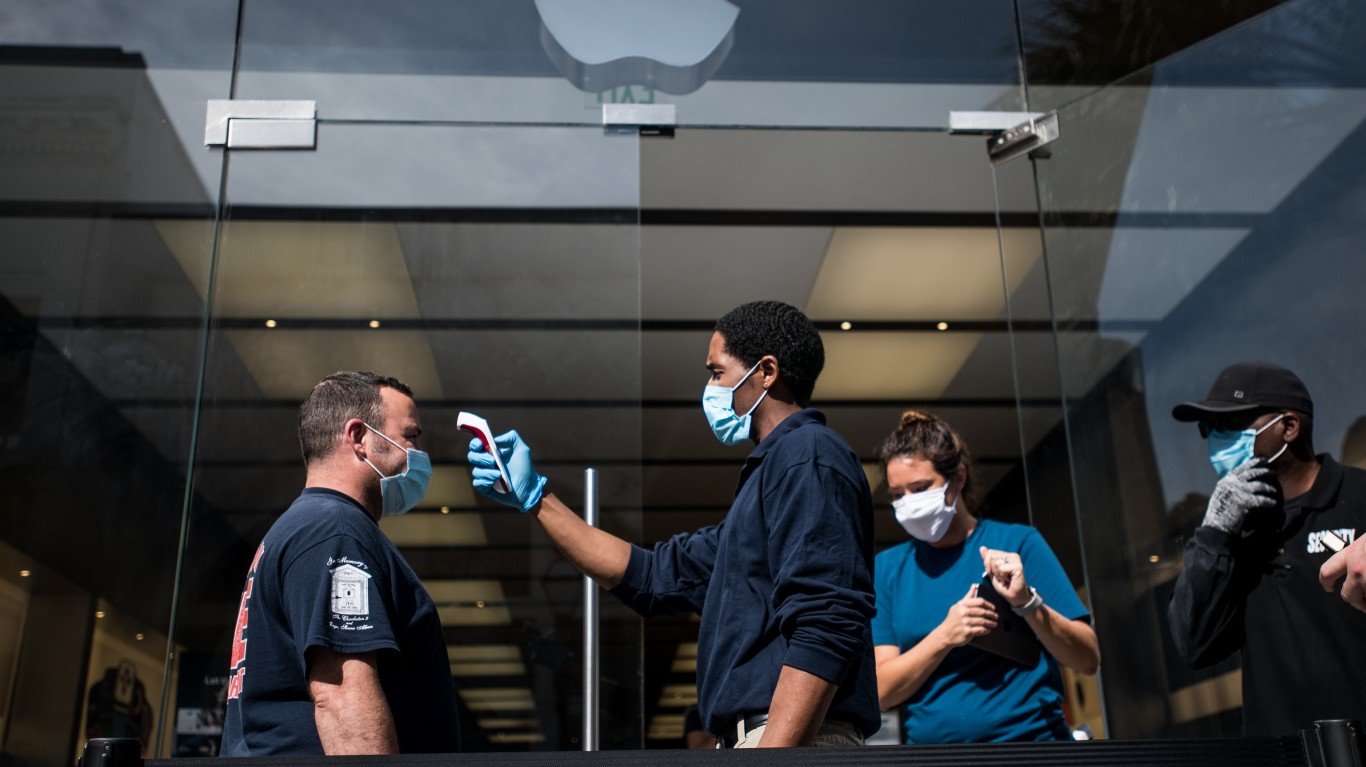
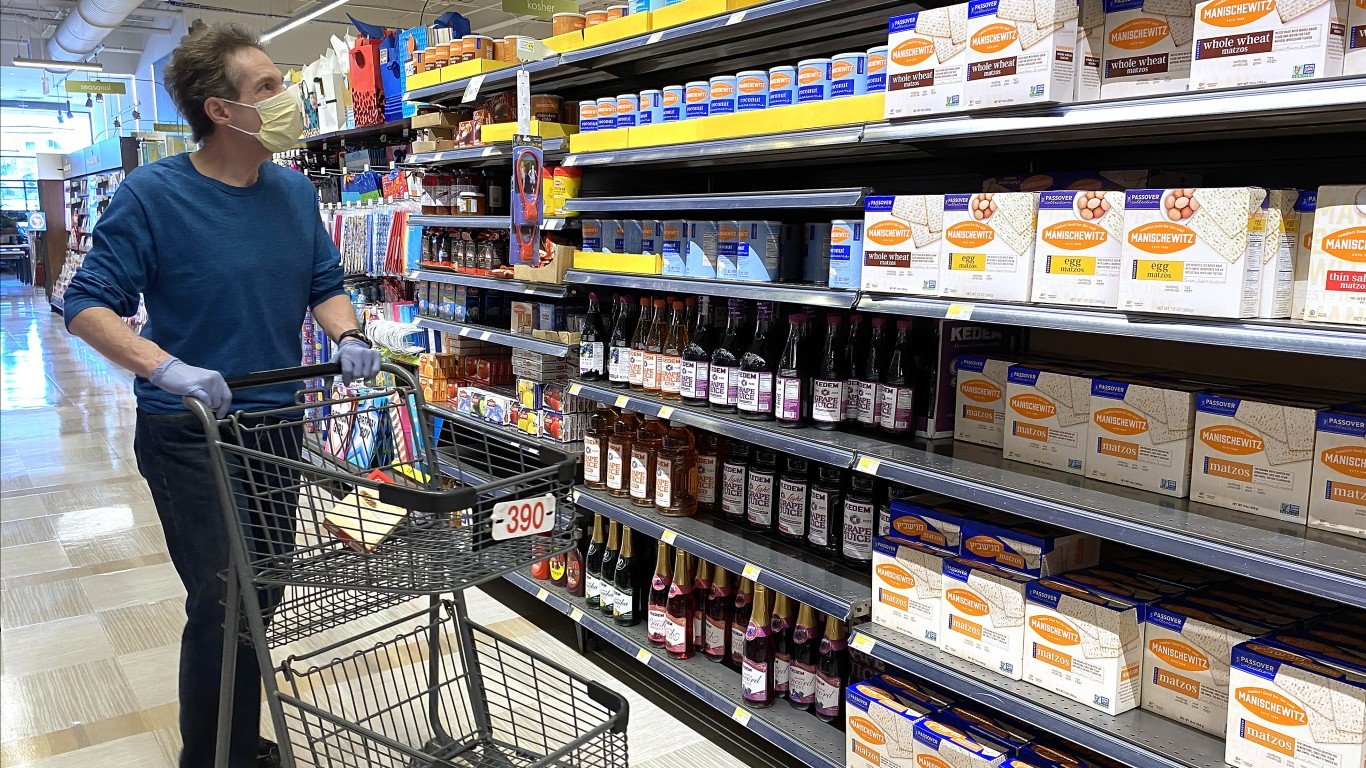
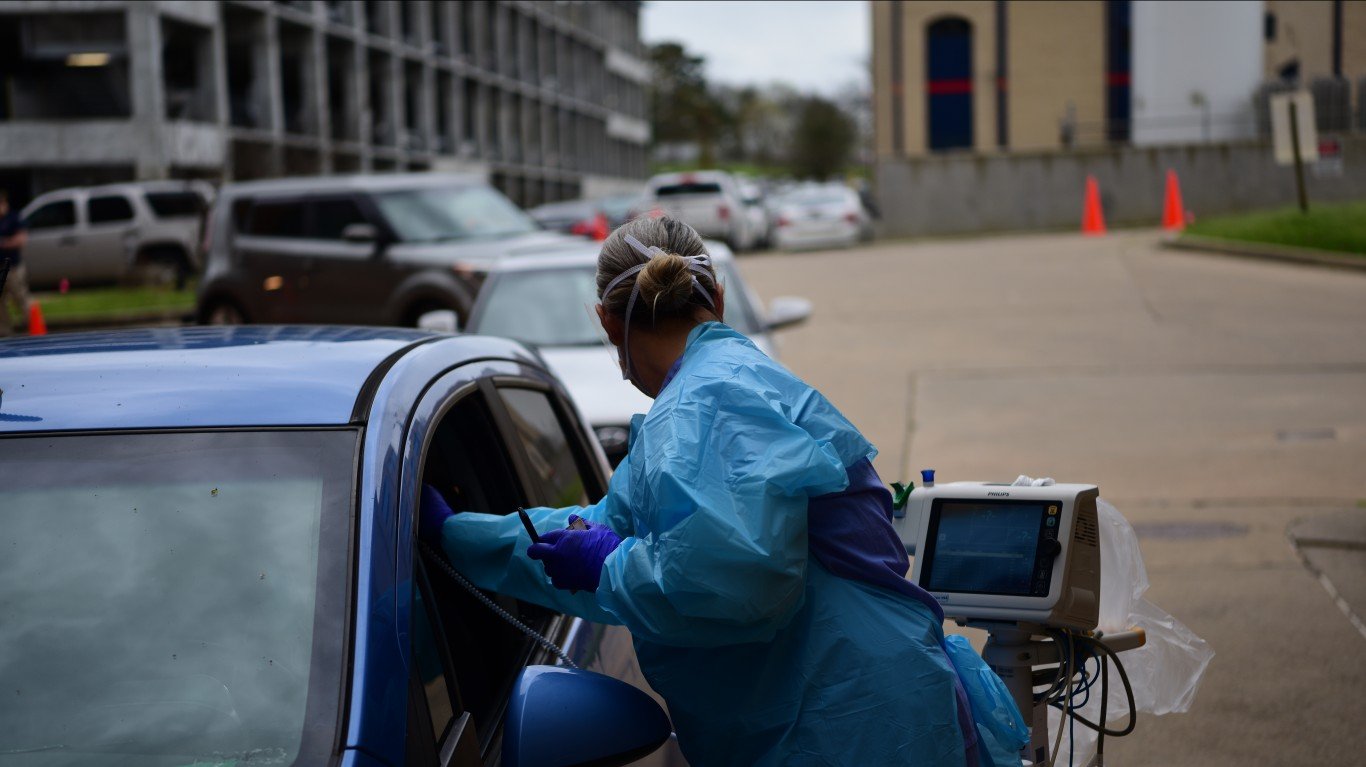
In the United States, a variety of respiratory viruses circulate, causing infections across the country — influenza, rhinovirus (one cause of the “common cold”), respiratory syncytial virus (RSV), respiratory adenovirus, to name a few — and now, the novel coronavirus.
While flu infection and death rates can vary dramatically from one year to the next depending on the dominant strain, flu-like illnesses tend to be most common during the fall and winter. This year, it remains to be seen if SARS-CoV2 — the virus that causes COVID-19 and that has devastated the U.S. since spring — will also peak during the flu season.
To help answer this question and identify where in the United States there may be the highest likelihood of a convergence of severe COVID-19 and flu cases, 24/7 Wall St. constructed an index of the following measures:
1) Flu vaccination rates during recent flu seasons.
2) Hospital visits for flu-like illnesses during recent flu seasons.
3) Average COVID-19 cases per day from Sept. 28, 2020 to Oct. 4, 2020.
4) Average projected COVID-19 hospital beds that will be needed this fall and winter as a percentage of total bed capacity.
States with high vaccinations rates, low flu hospitalization rates, low COVID-19 cases per day, and low projected hospital beds needed were deemed to have a better chance to weather the upcoming flu season.
Click here to see our full methodology.
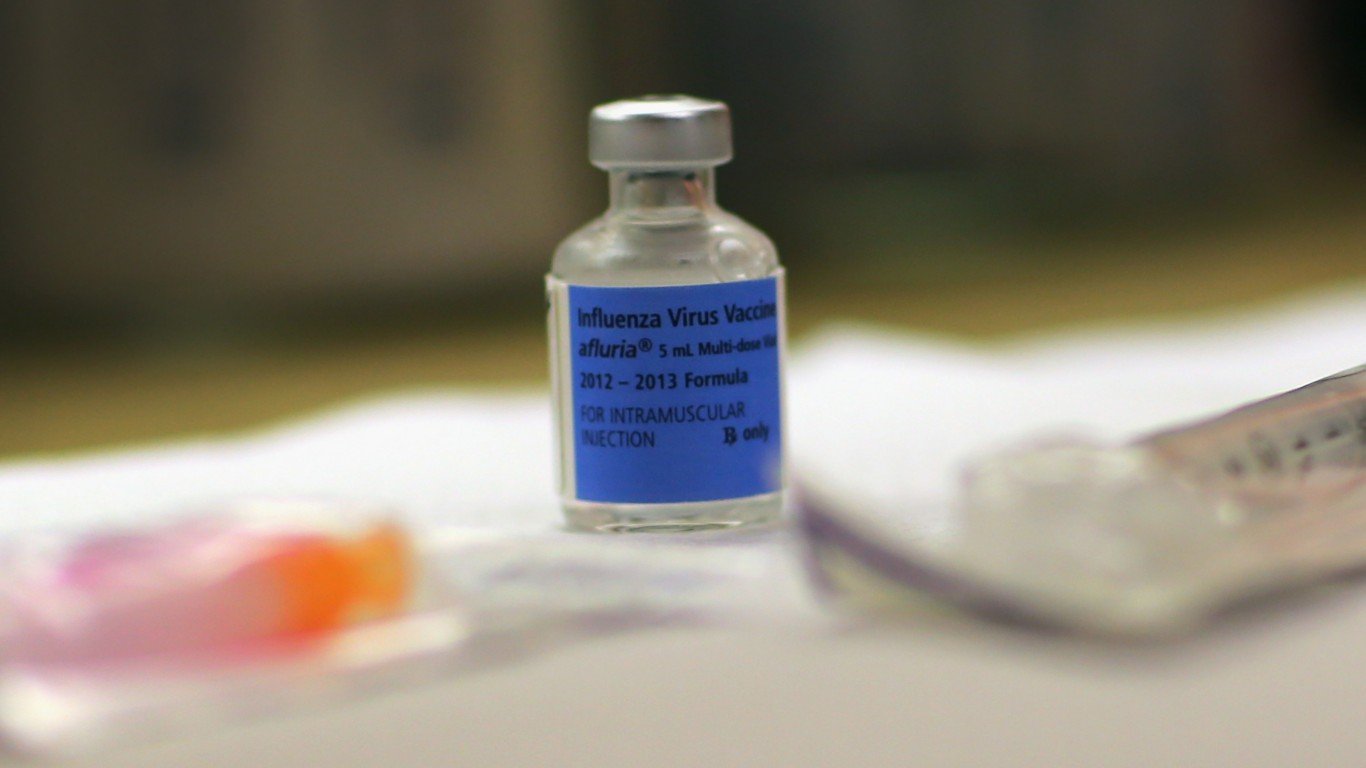
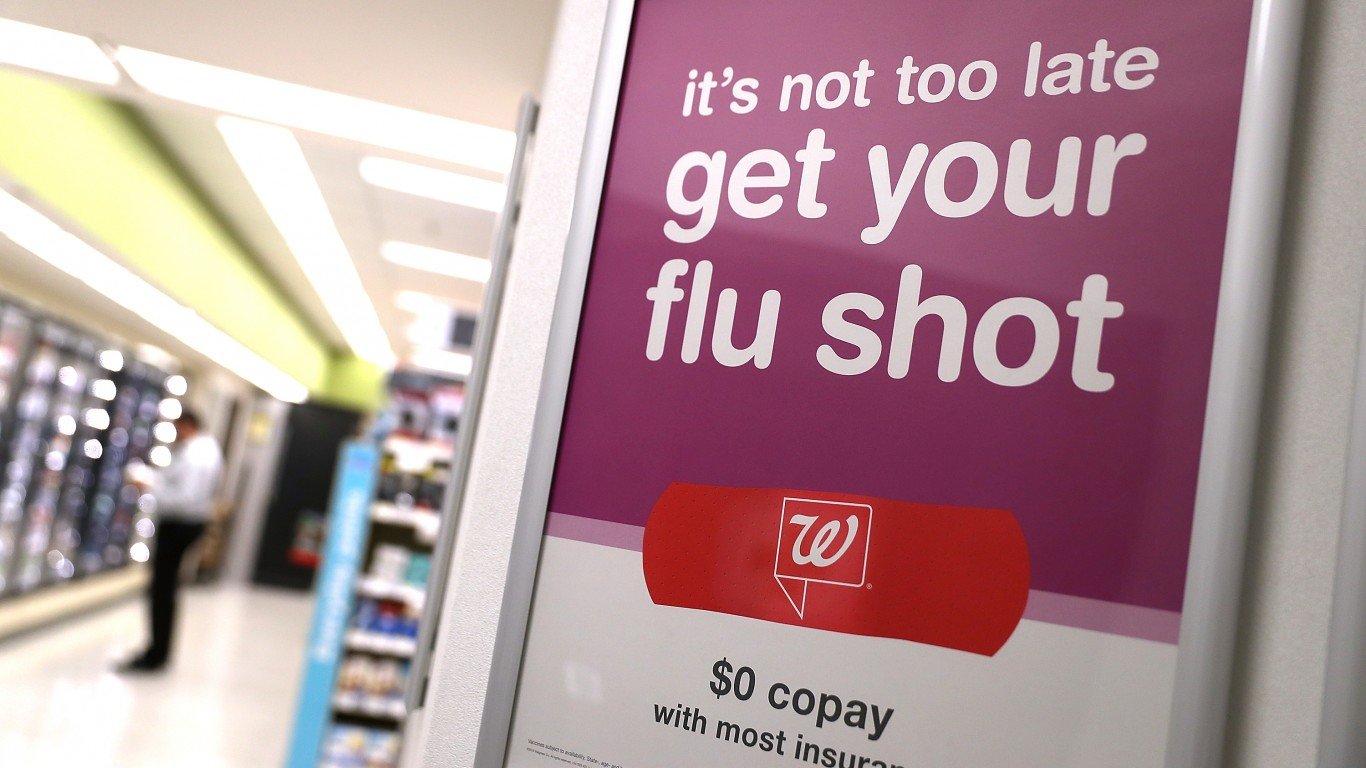
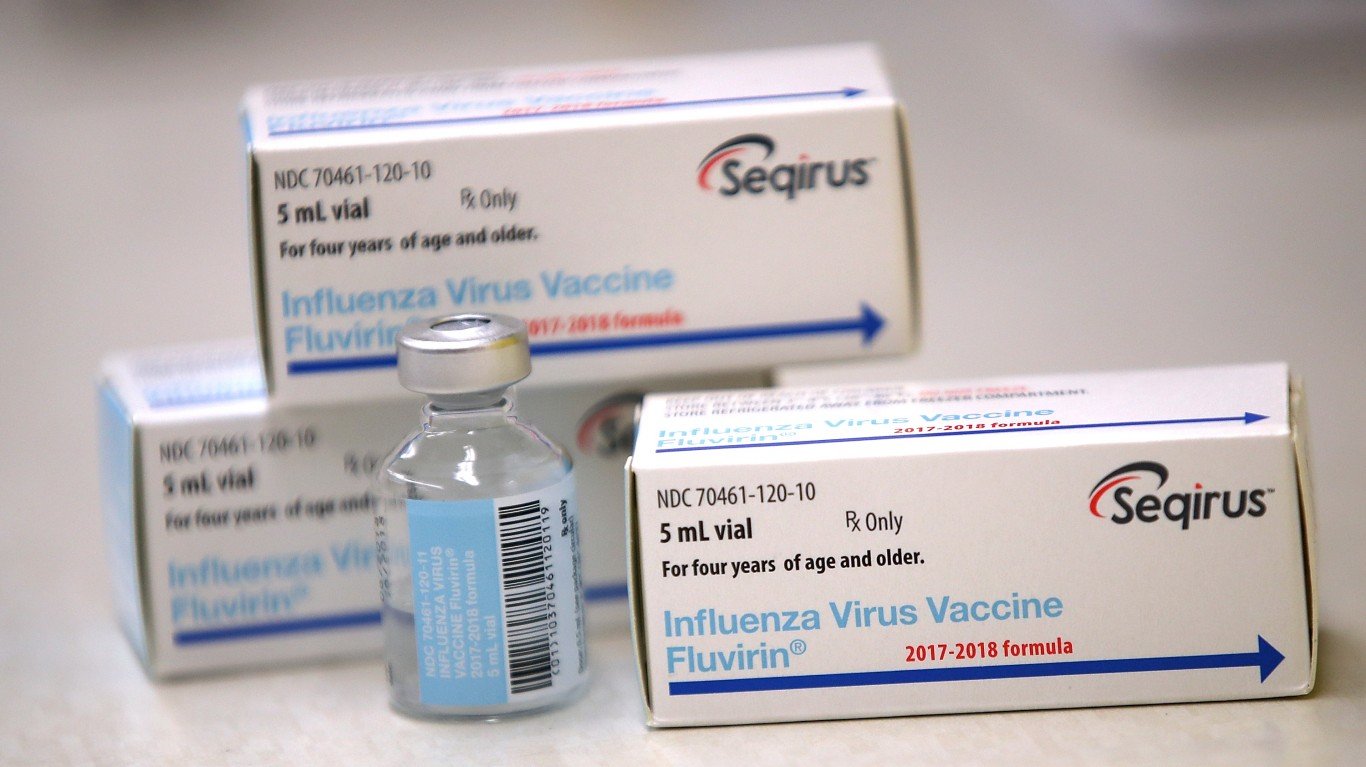
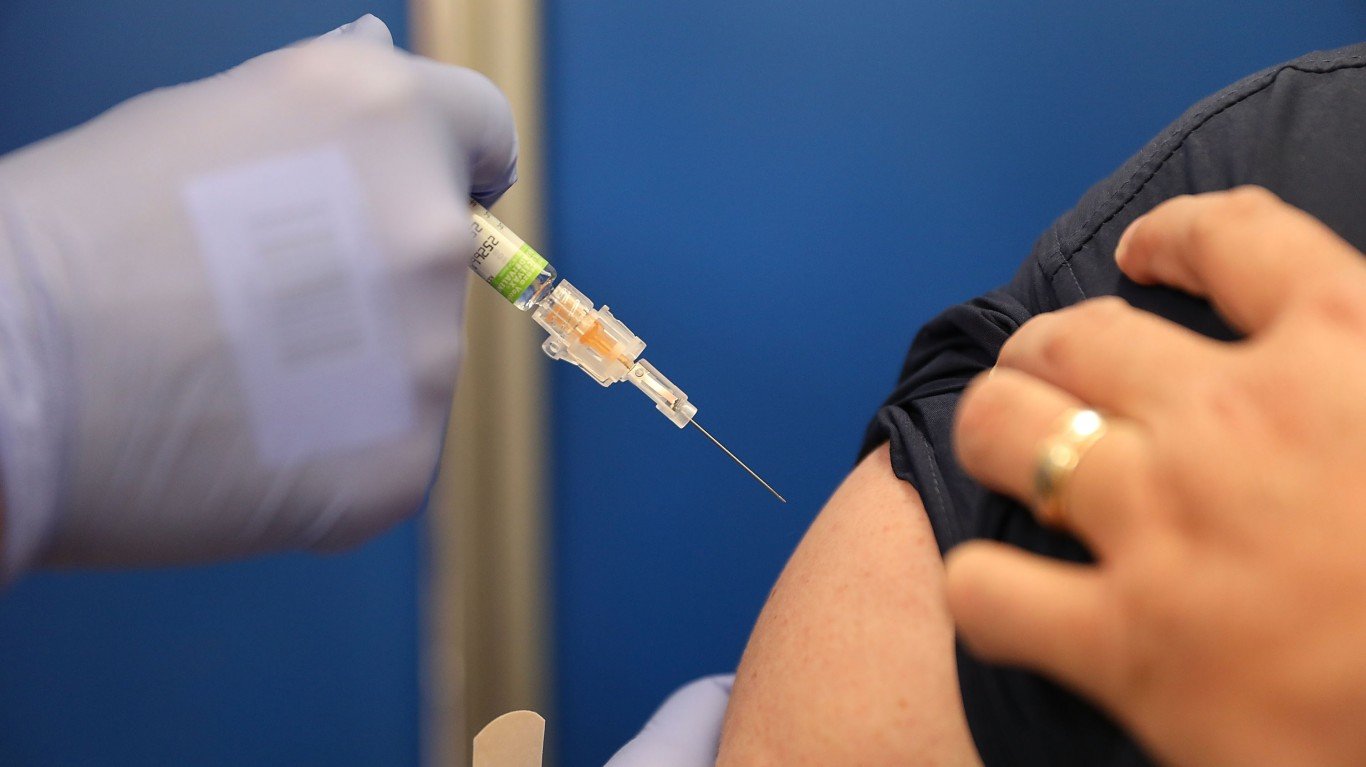
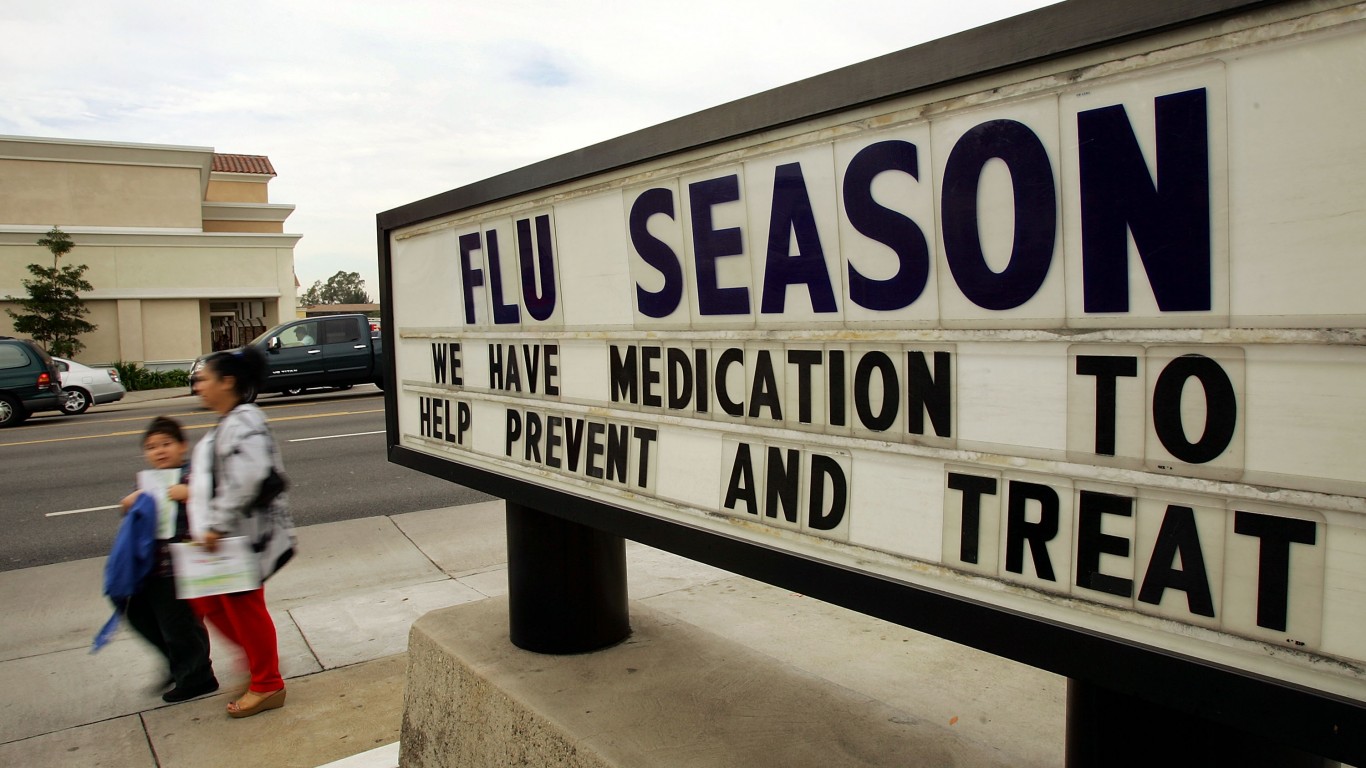
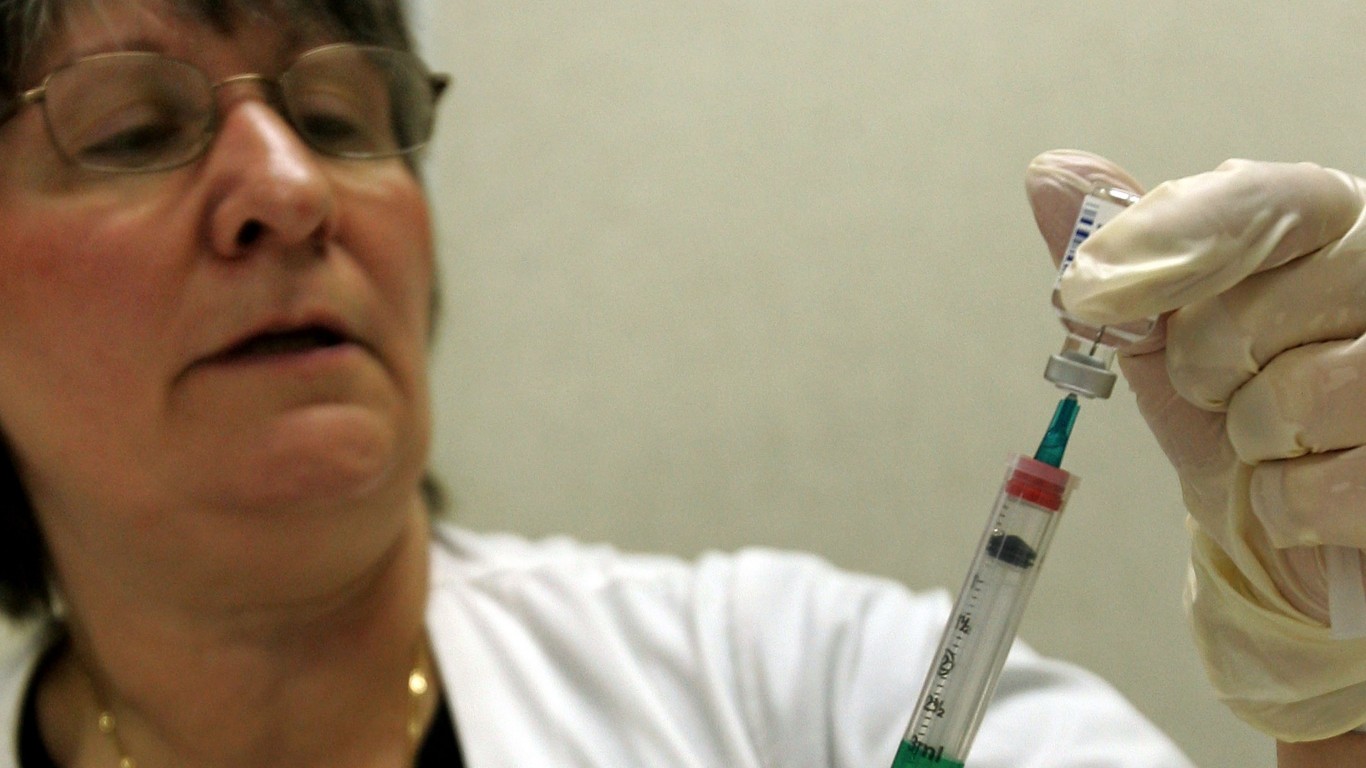
Getting a flu vaccine may be more important this year than ever before amid the pandemic, according to the Centers for Disease Control and Prevention (CDC). Approximately 42% of adults have been vaccinated against the flu every year since the 2010-2011 season. With one exception, South Dakota, most adults in every state do not get a flu vaccine.
Vaccination rates for children are higher, with an average of 57.3% of 6 month to 17 year olds receiving flu vaccinations in an average year.
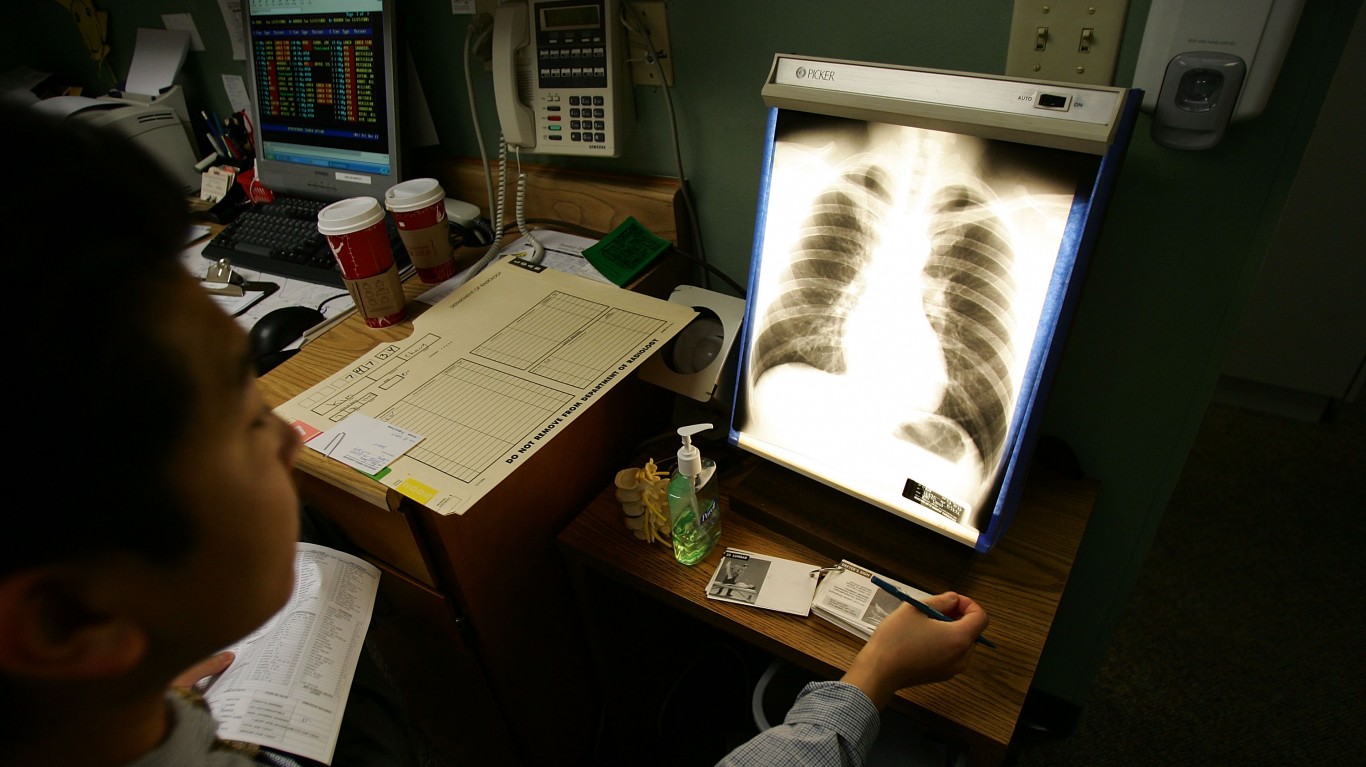
Last year’s flu season started off considerably worse than usual and ended April 4 as one of the worst in a decade. Preliminary data show that as many as 56 million illnesses, 18 million to 26 million doctor visits, 740,000 hospitalizations, and 62,000 deaths were associated with influenza across the United States.
An estimated 35.5 million illnesses, 16.5 million doctor visits, 490,600 hospitalizations, and 34,200 deaths were associated with influenza in the United States during the 2018-2019 flu season. Deaths were lower than during the two preceding flu seasons, but worse than in 2015-2016, when relatively few 22,705 flu-related deaths were reported. COVID-19 cases will no doubt add to the load of the health care system — the question is by how much.
With more than 7.5 million confirmed COVID-19 cases, more than 210,000 related deaths have been documented in the U.S. since March. Based on projections by the Institute for Health Metrics and Evaluation (IMHE), there will be an average of 1,641 COVID-19 deaths every day during the fall and winter of this year.
Click here to see the states where COVID and flu will likely hit at the same time.

Source: DenisTangneyJr / Getty Images
50. New Hampshire
> Annual flu vaccination rate: children: 62.4%, adults: 44.6%
> Annual flu-related deaths (2016-2018): 2.3 per 100,000 — 15th highest (121 total)
> COVID-19 deaths as of Oct 4: 32.7 per 100,000 — 17th lowest (443 total)
> COVID-19 cases per day Sep 28 – Oct 4: 3.7 per 100,000 — 3rd lowest (50 total)
> Total hospital beds in state: 3,052
> Projected peak resource use: Dec 31 (0.8% of total capacity — 2nd lowest)
> Population 65 and older: 18.6% — 9th highest
> Population without health insurance: 6.3 — 13th lowest
[in-text-ad]

Source: Chinnapong / iStock via Getty Images
49. Maine
> Annual flu vaccination rate: children: 60.8%, adults: 44.4%
> Annual flu-related deaths (2016-2018): 2.6 per 100,000 — 8th highest (157 total)
> COVID-19 deaths as of Oct 4: 10.6 per 100,000 — 5th lowest (142 total)
> COVID-19 cases per day Sep 28 – Oct 4: 2.3 per 100,000 — 2nd lowest (31 total)
> Total hospital beds in state: 3,814
> Projected peak resource use: Dec 31 (0.5% of total capacity — the lowest)
> Population 65 and older: 21.3% — the highest
> Population without health insurance: 8.0% — 25th highest
 24/7 Wall St.
Source: vermontalm / iStock via Getty Images
48. Vermont
> Annual flu vaccination rate: children: 58.2%, adults: 45.6%
> Annual flu-related deaths (2016-2018): 2.3 per 100,000 — 15th highest (59 total)
> COVID-19 deaths as of Oct 4: 9.3 per 100,000 — 4th lowest (58 total)
> COVID-19 cases per day Sep 28 – Oct 4: .8 per 100,000 — the lowest (05 total)
> Total hospital beds in state: 1,525
> Projected peak resource use: Dec 31 (2.5% of total capacity — 5th lowest)
> Population 65 and older: 20.1% — 4th highest
> Population without health insurance: 4.5% — 4th lowest
Source: Maddie Meyer / Getty Images News via Getty Images
47. Rhode Island
> Annual flu vaccination rate: children: 77.1%, adults: 49.8%
> Annual flu-related deaths (2016-2018): 2.4 per 100,000 — 12th highest (102 total)
> COVID-19 deaths as of Oct 4: 105.7 per 100,000 — 6th highest (1,118 total)
> COVID-19 cases per day Sep 28 – Oct 4: 9.4 per 100,000 — 17th lowest (99 total)
> Total hospital beds in state: 2,757
> Projected peak resource use: Dec 1 (12.9% of total capacity — 24th highest)
> Population 65 and older: 17.7% — 14th highest
> Population without health insurance: 4.1% — 2nd lowest
[in-text-ad-2]

Source: stresstensor / Getty Images
46. Massachusetts
> Annual flu vaccination rate: children: 72.6%, adults: 48.0%
> Annual flu-related deaths (2016-2018): 1.9 per 100,000 — 22nd lowest (499 total)
> COVID-19 deaths as of Oct 4: 134.7 per 100,000 — 2nd highest (9,295 total)
> COVID-19 cases per day Sep 28 – Oct 4: 7.5 per 100,000 — 12th lowest (516 total)
> Total hospital beds in state: 20,197
> Projected peak resource use: Dec 28 (9.8% of total capacity — 18th lowest)
> Population 65 and older: 17.0% — 25th highest
> Population without health insurance: 3.0% — the lowest
Source: John Moore / Getty Images News via Getty Images
45. Washington
> Annual flu vaccination rate: children: 56.8%, adults: 45.0%
> Annual flu-related deaths (2016-2018): 2.8 per 100,000 — 4th highest (702 total)
> COVID-19 deaths as of Oct 4: 28.4 per 100,000 — 16th lowest (2,142 total)
> COVID-19 cases per day Sep 28 – Oct 4: 7.2 per 100,000 — 9th lowest (539 total)
> Total hospital beds in state: 15,235
> Projected peak resource use: Dec 31 (12.2% of total capacity — 25th lowest)
> Population 65 and older: 15.9% — 10th lowest
> Population without health insurance: 6.6% — 17th lowest
[in-text-ad]

Source: benedek / Getty Images
44. West Virginia
> Annual flu vaccination rate: children: 54.1%, adults: 48.0%
> Annual flu-related deaths (2016-2018): 2.6 per 100,000 — 8th highest (190 total)
> COVID-19 deaths as of Oct 4: 19.8 per 100,000 — 10th lowest (358 total)
> COVID-19 cases per day Sep 28 – Oct 4: 10.5 per 100,000 — 21st lowest (189 total)
> Total hospital beds in state: 8,403
> Projected peak resource use: Dec 31 (7.8% of total capacity — 16th lowest)
> Population 65 and older: 20.5% — 3rd highest
> Population without health insurance: 6.7% — 18th lowest

43. Delaware
> Annual flu vaccination rate: children: 63.7%, adults: 45.9%
> Annual flu-related deaths (2016-2018): 1.5 per 100,000 — 9th lowest (58 total)
> COVID-19 deaths as of Oct 4: 66.7 per 100,000 — 14th highest (645 total)
> COVID-19 cases per day Sep 28 – Oct 4: 12.6 per 100,000 — 25th lowest (122 total)
> Total hospital beds in state: 2,633
> Projected peak resource use: Dec 18 (15.9% of total capacity — 20th highest)
> Population 65 and older: 19.5% — 5th highest
> Population without health insurance: 6.6% — 17th lowest

Source: pabradyphoto / iStock via Getty Images
42. Iowa
> Annual flu vaccination rate: children: 56.4%, adults: 48.9%
> Annual flu-related deaths (2016-2018): 2.7 per 100,000 — 6th highest (354 total)
> COVID-19 deaths as of Oct 4: 43.8 per 100,000 — 22nd highest (1,381 total)
> COVID-19 cases per day Sep 28 – Oct 4: 28.8 per 100,000 — 6th highest (910 total)
> Total hospital beds in state: 9,866
> Projected peak resource use: Dec 31 (5.6% of total capacity — 10th lowest)
> Population 65 and older: 17.5% — 17th highest
> Population without health insurance: 5.0% — 6th lowest
[in-text-ad-2]

41. Ohio
> Annual flu vaccination rate: children: 54.1%, adults: 42.5%
> Annual flu-related deaths (2016-2018): 1.9 per 100,000 — 22nd lowest (832 total)
> COVID-19 deaths as of Oct 4: 42.1 per 100,000 — 24th highest (4,925 total)
> COVID-19 cases per day Sep 28 – Oct 4: 9.2 per 100,000 — 15th lowest (1,071 total)
> Total hospital beds in state: 37,351
> Projected peak resource use: Dec 31 (10.1% of total capacity — 20th lowest)
> Population 65 and older: 17.5% — 17th highest
> Population without health insurance: 6.6% — 17th lowest

Source: ablokhin / Getty Images
40. Virginia
> Annual flu vaccination rate: children: 61.2%, adults: 46.9%
> Annual flu-related deaths (2016-2018): 1.4 per 100,000 — 8th lowest (397 total)
> COVID-19 deaths as of Oct 4: 38.4 per 100,000 — 24th lowest (3,273 total)
> COVID-19 cases per day Sep 28 – Oct 4: 9.2 per 100,000 — 16th lowest (781 total)
> Total hospital beds in state: 23,270
> Projected peak resource use: Dec 31 (5.5% of total capacity — 9th lowest)
> Population 65 and older: 15.9% — 10th lowest
> Population without health insurance: 7.9% — 24th lowest
[in-text-ad]
Source: Jessica Kourkounis / Getty Images News via Getty Images
39. Pennsylvania
> Annual flu vaccination rate: children: 62.2%, adults: 44.2%
> Annual flu-related deaths (2016-2018): 1.7 per 100,000 — 15th lowest (905 total)
> COVID-19 deaths as of Oct 4: 64.2 per 100,000 — 16th highest (8,216 total)
> COVID-19 cases per day Sep 28 – Oct 4: 7.3 per 100,000 — 10th lowest (936 total)
> Total hospital beds in state: 42,658
> Projected peak resource use: Dec 15 (7.9% of total capacity — 17th lowest)
> Population 65 and older: 18.7% — 8th highest
> Population without health insurance: 5.8% — 10th lowest
 24/7 Wall St.
Source: John Moore / Getty Images News via Getty Images
38. Connecticut
> Annual flu vaccination rate: children: 67.7%, adults: 45.6%
> Annual flu-related deaths (2016-2018): 1.8 per 100,000 — 18th lowest (269 total)
> COVID-19 deaths as of Oct 4: 126.3 per 100,000 — 4th highest (4,513 total)
> COVID-19 cases per day Sep 28 – Oct 4: 5.7 per 100,000 — 5th lowest (203 total)
> Total hospital beds in state: 8,501
> Projected peak resource use: Dec 31 (21.3% of total capacity — 10th highest)
> Population 65 and older: 17.6% — 16th highest
> Population without health insurance: 5.9% — 11th lowest
Source: oregonmildep / Flickr
37. Oregon
> Annual flu vaccination rate: children: 51.9%, adults: 38.7%
> Annual flu-related deaths (2016-2018): 3.2 per 100,000 — the highest (494 total)
> COVID-19 deaths as of Oct 4: 13.6 per 100,000 — 7th lowest (572 total)
> COVID-19 cases per day Sep 28 – Oct 4: 6.7 per 100,000 — 6th lowest (280 total)
> Total hospital beds in state: 7,900
> Projected peak resource use: Sep 27 (2.3% of total capacity — 4th lowest)
> Population 65 and older: 18.2% — 10th highest
> Population without health insurance: 7.2% — 20th lowest
[in-text-ad-2]

Source: Gian Lorenzo Ferretti Photography / Getty Images
36. Minnesota
> Annual flu vaccination rate: children: 60.2%, adults: 47.8%
> Annual flu-related deaths (2016-2018): 2.3 per 100,000 — 15th highest (468 total)
> COVID-19 deaths as of Oct 4: 37.1 per 100,000 — 22nd lowest (2,080 total)
> COVID-19 cases per day Sep 28 – Oct 4: 17.9 per 100,000 — 16th highest (1,007 total)
> Total hospital beds in state: 15,196
> Projected peak resource use: Dec 29 (13.6% of total capacity — 22nd highest)
> Population 65 and older: 16.3% — 18th lowest
> Population without health insurance: 4.9% — 5th lowest
Source: Win McNamee / Getty Images News via Getty Images
35. Maryland
> Annual flu vaccination rate: children: 67.6%, adults: 46.9%
> Annual flu-related deaths (2016-2018): 1.3 per 100,000 — 5th lowest (256 total)
> COVID-19 deaths as of Oct 4: 65.5 per 100,000 — 15th highest (3,958 total)
> COVID-19 cases per day Sep 28 – Oct 4: 8.6 per 100,000 — 14th lowest (519 total)
> Total hospital beds in state: 14,350
> Projected peak resource use: Dec 31 (25.2% of total capacity — 7th highest)
> Population 65 and older: 15.9% — 10th lowest
> Population without health insurance: 6.0% — 12th lowest
[in-text-ad]
Source: Joe Raedle / Getty Images News via Getty Images
34. Florida
> Annual flu vaccination rate: children: 48.1%, adults: 35.7%
> Annual flu-related deaths (2016-2018): 1.0 per 100,000 — the lowest (896 total)
> COVID-19 deaths as of Oct 4: 69.7 per 100,000 — 10th highest (14,845 total)
> COVID-19 cases per day Sep 28 – Oct 4: 10.8 per 100,000 — 23rd lowest (2,293 total)
> Total hospital beds in state: 60,546
> Projected peak resource use: Nov 25 (6.5% of total capacity — 12th lowest)
> Population 65 and older: 20.9% — 2nd highest
> Population without health insurance: 13.2% — 4th highest
 24/7 Wall St.
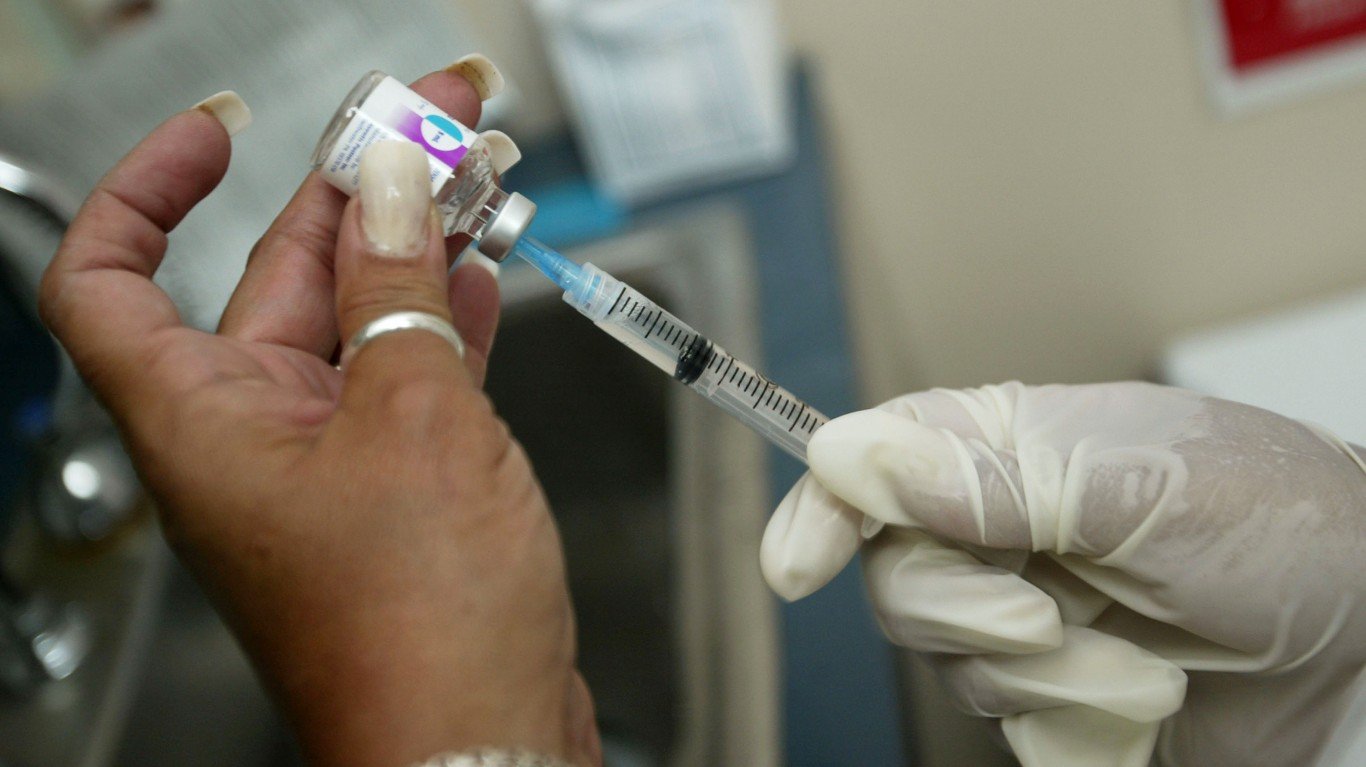
Source: Chris Hondros / Getty Images News via Getty Images
33. New York
> Annual flu vaccination rate: children: 63.1%, adults: 42.3%
> Annual flu-related deaths (2016-2018): 1.3 per 100,000 — 5th lowest (947 total)
> COVID-19 deaths as of Oct 4: 130.6 per 100,000 — 3rd highest (25,519 total)
> COVID-19 cases per day Sep 28 – Oct 4: 5.4 per 100,000 — 4th lowest (1,057 total)
> Total hospital beds in state: 62,232
> Projected peak resource use: Dec 31 (15.2% of total capacity — 21st highest)
> Population 65 and older: 16.9% — 25th lowest
> Population without health insurance: 5.2% — 7th lowest

Source: Imgorthand / E+ via Getty Images
32. South Dakota
> Annual flu vaccination rate: children: 64.8%, adults: 51.9%
> Annual flu-related deaths (2016-2018): 2.6 per 100,000 — 8th highest (94 total)
> COVID-19 deaths as of Oct 4: 28.1 per 100,000 — 15th lowest (248 total)
> COVID-19 cases per day Sep 28 – Oct 4: 46.7 per 100,000 — 2nd highest (412 total)
> Total hospital beds in state: 4,733
> Projected peak resource use: Dec 31 (7.5% of total capacity — 15th lowest)
> Population 65 and older: 17.4% — 20th highest
> Population without health insurance: 10.2% — 13th highest
[in-text-ad-2]
Source: Justin Sullivan / Getty Images News via Getty Images
31. Montana
> Annual flu vaccination rate: children: 47.4%, adults: 40.7%
> Annual flu-related deaths (2016-2018): 3.0 per 100,000 — 2nd highest (122 total)
> COVID-19 deaths as of Oct 4: 17.6 per 100,000 — 9th lowest (187 total)
> COVID-19 cases per day Sep 28 – Oct 4: 30.1 per 100,000 — 5th highest (320 total)
> Total hospital beds in state: 4,145
> Projected peak resource use: Dec 31 (4.7% of total capacity — 7th lowest)
> Population 65 and older: 19.5% — 5th highest
> Population without health insurance: 8.3% — 23rd highest

Source: jacksonvillenc.gov
30. North Carolina
> Annual flu vaccination rate: children: 59.2%, adults: 47.0%
> Annual flu-related deaths (2016-2018): 2.2 per 100,000 — 19th highest (785 total)
> COVID-19 deaths as of Oct 4: 35.0 per 100,000 — 19th lowest (3,634 total)
> COVID-19 cases per day Sep 28 – Oct 4: 17.2 per 100,000 — 19th highest (1,787 total)
> Total hospital beds in state: 24,713
> Projected peak resource use: Dec 31 (16.2% of total capacity — 18th highest)
> Population 65 and older: 16.7% — 23rd lowest
> Population without health insurance: 11.3% — 9th highest
[in-text-ad]

Source: Michael Ciaglo / Getty Images News via Getty Images
29. Colorado
> Annual flu vaccination rate: children: 60.3%, adults: 44.8%
> Annual flu-related deaths (2016-2018): 2.0 per 100,000 — 24th lowest (338 total)
> COVID-19 deaths as of Oct 4: 36.3 per 100,000 — 21st lowest (2,068 total)
> COVID-19 cases per day Sep 28 – Oct 4: 10.4 per 100,000 — 20th lowest (594 total)
> Total hospital beds in state: 12,485
> Projected peak resource use: Dec 31 (33.1% of total capacity — the highest)
> Population 65 and older: 14.7% — 5th lowest
> Population without health insurance: 8.0% — 25th highest

28. Kentucky
> Annual flu vaccination rate: children: 54.1%, adults: 43.7%
> Annual flu-related deaths (2016-2018): 2.5 per 100,000 — 11th highest (393 total)
> COVID-19 deaths as of Oct 4: 27.0 per 100,000 — 14th lowest (1,205 total)
> COVID-19 cases per day Sep 28 – Oct 4: 17.6 per 100,000 — 17th highest (788 total)
> Total hospital beds in state: 16,156
> Projected peak resource use: Dec 31 (19.0% of total capacity — 12th highest)
> Population 65 and older: 16.9% — 25th lowest
> Population without health insurance: 6.4% — 14th lowest
Source: Justin Sullivan / Getty Images News via Getty Images
27. Wyoming
> Annual flu vaccination rate: children: 44.6%, adults: 37.0%
> Annual flu-related deaths (2016-2018): 2.1 per 100,000 — 23rd highest (41 total)
> COVID-19 deaths as of Oct 4: 9.2 per 100,000 — 3rd lowest (53 total)
> COVID-19 cases per day Sep 28 – Oct 4: 20.0 per 100,000 — 14th highest (116 total)
> Total hospital beds in state: 2,453
> Projected peak resource use: Sep 27 (0.9% of total capacity — 3rd lowest)
> Population 65 and older: 17.1% — 24th highest
> Population without health insurance: 12.3% — 6th highest
[in-text-ad-2]

Source: okimo / iStock via Getty Images
26. Hawaii
> Annual flu vaccination rate: children: 67.4%, adults: 46.0%
> Annual flu-related deaths (2016-2018): 1.4 per 100,000 — 8th lowest (86 total)
> COVID-19 deaths as of Oct 4: 10.8 per 100,000 — 6th lowest (153 total)
> COVID-19 cases per day Sep 28 – Oct 4: 7.3 per 100,000 — 11th lowest (104 total)
> Total hospital beds in state: 3,467
> Projected peak resource use: Dec 31 (18.6% of total capacity — 14th highest)
> Population 65 and older: 19.0% — 7th highest
> Population without health insurance: 4.2% — 3rd lowest

Source: pawel.gaul / Getty Images
25. Michigan
> Annual flu vaccination rate: children: 52.3%, adults: 39.3%
> Annual flu-related deaths (2016-2018): 1.8 per 100,000 — 18th lowest (682 total)
> COVID-19 deaths as of Oct 4: 71.3 per 100,000 — 9th highest (7,124 total)
> COVID-19 cases per day Sep 28 – Oct 4: 9.5 per 100,000 — 18th lowest (946 total)
> Total hospital beds in state: 28,300
> Projected peak resource use: Dec 23 (16.6% of total capacity — 17th highest)
> Population 65 and older: 17.7% — 14th highest
> Population without health insurance: 5.8% — 10th lowest
[in-text-ad]

Source: Brett Carlsen / Getty Images News via Getty Images
24. Tennessee
> Annual flu vaccination rate: children: 58.7%, adults: 43.6%
> Annual flu-related deaths (2016-2018): 2.1 per 100,000 — 22nd highest (479 total)
> COVID-19 deaths as of Oct 4: 37.8 per 100,000 — 24th lowest (2,560 total)
> COVID-19 cases per day Sep 28 – Oct 4: 20.2 per 100,000 — 13th highest (1,371 total)
> Total hospital beds in state: 21,784
> Projected peak resource use: Dec 31 (10.5% of total capacity — 22nd lowest)
> Population 65 and older: 16.7% — 23rd lowest
> Population without health insurance: 10.1% — 14th highest
Source: David McNew / Getty Images News via Getty Images
23. New Mexico
> Annual flu vaccination rate: children: 64.4%, adults: 42.0%
> Annual flu-related deaths (2016-2018): 1.7 per 100,000 — 15th lowest (120 total)
> COVID-19 deaths as of Oct 4: 42.6 per 100,000 — 23rd highest (892 total)
> COVID-19 cases per day Sep 28 – Oct 4: 10.0 per 100,000 — 19th lowest (210 total)
> Total hospital beds in state: 4,756
> Projected peak resource use: Dec 27 (11.0% of total capacity — 24th lowest)
> Population 65 and older: 18.0% — 12th highest
> Population without health insurance: 10.0% — 15th highest
Source: ChrisBoswell / Getty Images
22. Nebraska
> Annual flu vaccination rate: children: 60.5%, adults: 46.7%
> Annual flu-related deaths (2016-2018): 2.4 per 100,000 — 12th highest (172 total)
> COVID-19 deaths as of Oct 4: 25.8 per 100,000 — 13th lowest (497 total)
> COVID-19 cases per day Sep 28 – Oct 4: 25.2 per 100,000 — 10th highest (486 total)
> Total hospital beds in state: 7,413
> Projected peak resource use: Dec 31 (21.6% of total capacity — 9th highest)
> Population 65 and older: 16.1% — 15th lowest
> Population without health insurance: 8.3% — 23rd highest
[in-text-ad-2]
Source: Sean Rayford / Getty Images News via Getty Images
21. South Carolina
> Annual flu vaccination rate: children: 55.7%, adults: 42.9%
> Annual flu-related deaths (2016-2018): 2.2 per 100,000 — 19th highest (387 total)
> COVID-19 deaths as of Oct 4: 67.9 per 100,000 — 13th highest (3,453 total)
> COVID-19 cases per day Sep 28 – Oct 4: 17.5 per 100,000 — 18th highest (891 total)
> Total hospital beds in state: 13,707
> Projected peak resource use: Dec 20 (10.4% of total capacity — 21st lowest)
> Population 65 and older: 18.2% — 10th highest
> Population without health insurance: 10.8% — 11th highest
Source: Jamie Squire / Getty Images News via Getty Images
20. Kansas
> Annual flu vaccination rate: children: 53.4%, adults: 42.6%
> Annual flu-related deaths (2016-2018): 3.0 per 100,000 — 2nd highest (321 total)
> COVID-19 deaths as of Oct 4: 24.0 per 100,000 — 12th lowest (698 total)
> COVID-19 cases per day Sep 28 – Oct 4: 22.4 per 100,000 — 11th highest (652 total)
> Total hospital beds in state: 11,329
> Projected peak resource use: Dec 31 (13.2% of total capacity — 23rd highest)
> Population 65 and older: 16.4% — 20th lowest
> Population without health insurance: 9.2% — 19th highest
[in-text-ad]
Source: Joe Raedle / Getty Images News via Getty Images
19. Utah
> Annual flu vaccination rate: children: 51.3%, adults: 40.1%
> Annual flu-related deaths (2016-2018): 2.1 per 100,000 — 23rd highest (162 total)
> COVID-19 deaths as of Oct 4: 15.1 per 100,000 — 8th lowest (478 total)
> COVID-19 cases per day Sep 28 – Oct 4: 31.3 per 100,000 — 4th highest (990 total)
> Total hospital beds in state: 6,726
> Projected peak resource use: Dec 31 (3.6% of total capacity — 6th lowest)
> Population 65 and older: 11.4% — the lowest
> Population without health insurance: 9.7% — 17th highest
 24/7 Wall St.
Source: U.S. Indo-Pacific Command / Flickr
18. Alaska
> Annual flu vaccination rate: children: 48.2%, adults: 37.1%
> Annual flu-related deaths (2016-2018): 2.4 per 100,000 — 12th highest (41 total)
> COVID-19 deaths as of Oct 4: 7.9 per 100,000 — 2nd lowest (58 total)
> COVID-19 cases per day Sep 28 – Oct 4: 16.5 per 100,000 — 21st highest (122 total)
> Total hospital beds in state: 2,034
> Projected peak resource use: Dec 9 (9.9% of total capacity — 19th lowest)
> Population 65 and older: 12.4% — 2nd lowest
> Population without health insurance: 12.2% — 7th highest

17. North Dakota
> Annual flu vaccination rate: children: 61.2%, adults: 44.3%
> Annual flu-related deaths (2016-2018): 1.8 per 100,000 — 18th lowest (49 total)
> COVID-19 deaths as of Oct 4: 36.0 per 100,000 — 20th lowest (274 total)
> COVID-19 cases per day Sep 28 – Oct 4: 52.8 per 100,000 — the highest (401 total)
> Total hospital beds in state: 3,779
> Projected peak resource use: Oct 19 (4.8% of total capacity — 8th lowest)
> Population 65 and older: 15.8% — 7th lowest
> Population without health insurance: 6.9% — 19th lowest
[in-text-ad-2]
Source: JTGrafix / Getty Images
16. Missouri
> Annual flu vaccination rate: children: 52.6%, adults: 44.2%
> Annual flu-related deaths (2016-2018): 2.7 per 100,000 — 6th highest (643 total)
> COVID-19 deaths as of Oct 4: 33.7 per 100,000 — 18th lowest (2,064 total)
> COVID-19 cases per day Sep 28 – Oct 4: 19.3 per 100,000 — 15th highest (1,183 total)
> Total hospital beds in state: 21,575
> Projected peak resource use: Nov 11 (16.8% of total capacity — 16th highest)
> Population 65 and older: 17.2% — 23rd highest
> Population without health insurance: 10.0% — 15th highest

Source: Kena Betancur / Getty Images News via Getty Images
15. New Jersey
> Annual flu vaccination rate: children: 66.5%, adults: 40.1%
> Annual flu-related deaths (2016-2018): 1.0 per 100,000 — the lowest (353 total)
> COVID-19 deaths as of Oct 4: 181.1 per 100,000 — the highest (16,136 total)
> COVID-19 cases per day Sep 28 – Oct 4: 7.0 per 100,000 — 8th lowest (622 total)
> Total hospital beds in state: 25,996
> Projected peak resource use: Dec 31 (24.1% of total capacity — 8th highest)
> Population 65 and older: 16.6% — 21st lowest
> Population without health insurance: 7.9% — 24th lowest
[in-text-ad]
Source: arkansasnationalguard / Flickr
14. Arkansas
> Annual flu vaccination rate: children: 63.4%, adults: 41.6%
> Annual flu-related deaths (2016-2018): 2.1 per 100,000 — 23rd highest (230 total)
> COVID-19 deaths as of Oct 4: 47.3 per 100,000 — 21st highest (1,425 total)
> COVID-19 cases per day Sep 28 – Oct 4: 27.3 per 100,000 — 8th highest (823 total)
> Total hospital beds in state: 11,243
> Projected peak resource use: Oct 28 (6.5% of total capacity — 13th lowest)
> Population 65 and older: 17.4% — 20th highest
> Population without health insurance: 9.1% — 20th highest
Source: David McNew / Getty Images News via Getty Images
13. California
> Annual flu vaccination rate: children: 58.5%, adults: 39.0%
> Annual flu-related deaths (2016-2018): 1.7 per 100,000 — 15th lowest (2,205 total)
> COVID-19 deaths as of Oct 4: 40.8 per 100,000 — 25th highest (16,120 total)
> COVID-19 cases per day Sep 28 – Oct 4: 8.2 per 100,000 — 13th lowest (3,239 total)
> Total hospital beds in state: 85,724
> Projected peak resource use: Dec 31 (25.3% of total capacity — 6th highest)
> Population 65 and older: 14.8% — 6th lowest
> Population without health insurance: 7.7% — 22nd lowest

Source: Mario Villafuerte / Getty Images News via Getty Images
12. Louisiana
> Annual flu vaccination rate: children: 56.1%, adults: 39.4%
> Annual flu-related deaths (2016-2018): 1.6 per 100,000 — 11th lowest (250 total)
> COVID-19 deaths as of Oct 4: 115.6 per 100,000 — 5th highest (5,387 total)
> COVID-19 cases per day Sep 28 – Oct 4: 10.6 per 100,000 — 22nd lowest (493 total)
> Total hospital beds in state: 18,060
> Projected peak resource use: Dec 31 (7.5% of total capacity — 14th lowest)
> Population 65 and older: 16.0% — 11th lowest
> Population without health insurance: 8.9% — 21st highest
[in-text-ad-2]
Source: MelissaAnneGalleries / iStock
11. Indiana
> Annual flu vaccination rate: children: 51.5%, adults: 39.3%
> Annual flu-related deaths (2016-2018): 2.2 per 100,000 — 19th highest (522 total)
> COVID-19 deaths as of Oct 4: 51.5 per 100,000 — 20th highest (3,447 total)
> COVID-19 cases per day Sep 28 – Oct 4: 14.9 per 100,000 — 25th highest (996 total)
> Total hospital beds in state: 20,450
> Projected peak resource use: Dec 26 (28.6% of total capacity — 2nd highest)
> Population 65 and older: 16.1% — 15th lowest
> Population without health insurance: 8.7% — 22nd highest

Source: Ethan Miller / Getty Images News via Getty Images
10. Nevada
> Annual flu vaccination rate: children: 49.3%, adults: 33.6%
> Annual flu-related deaths (2016-2018): 1.2 per 100,000 — 3rd lowest (116 total)
> COVID-19 deaths as of Oct 4: 53.5 per 100,000 — 18th highest (1,623 total)
> COVID-19 cases per day Sep 28 – Oct 4: 15.5 per 100,000 — 23rd highest (469 total)
> Total hospital beds in state: 8,006
> Projected peak resource use: Dec 31 (18.5% of total capacity — 15th highest)
> Population 65 and older: 16.2% — 17th lowest
> Population without health insurance: 11.4% — 8th highest
[in-text-ad]

Source: vkbhat / Getty Images
9. Idaho
> Annual flu vaccination rate: children: 46.2%, adults: 36.2%
> Annual flu-related deaths (2016-2018): 2.8 per 100,000 — 4th highest (160 total)
> COVID-19 deaths as of Oct 4: 2.3 per 100,000 — the lowest (40 total)
> COVID-19 cases per day Sep 28 – Oct 4: 27.3 per 100,000 — 7th highest (479 total)
> Total hospital beds in state: 3,951
> Projected peak resource use: Dec 31 (12.8% of total capacity — 25th highest)
> Population 65 and older: 16.2% — 17th lowest
> Population without health insurance: 10.8% — 11th highest
Source: Zereshk / Wikimedia Commons
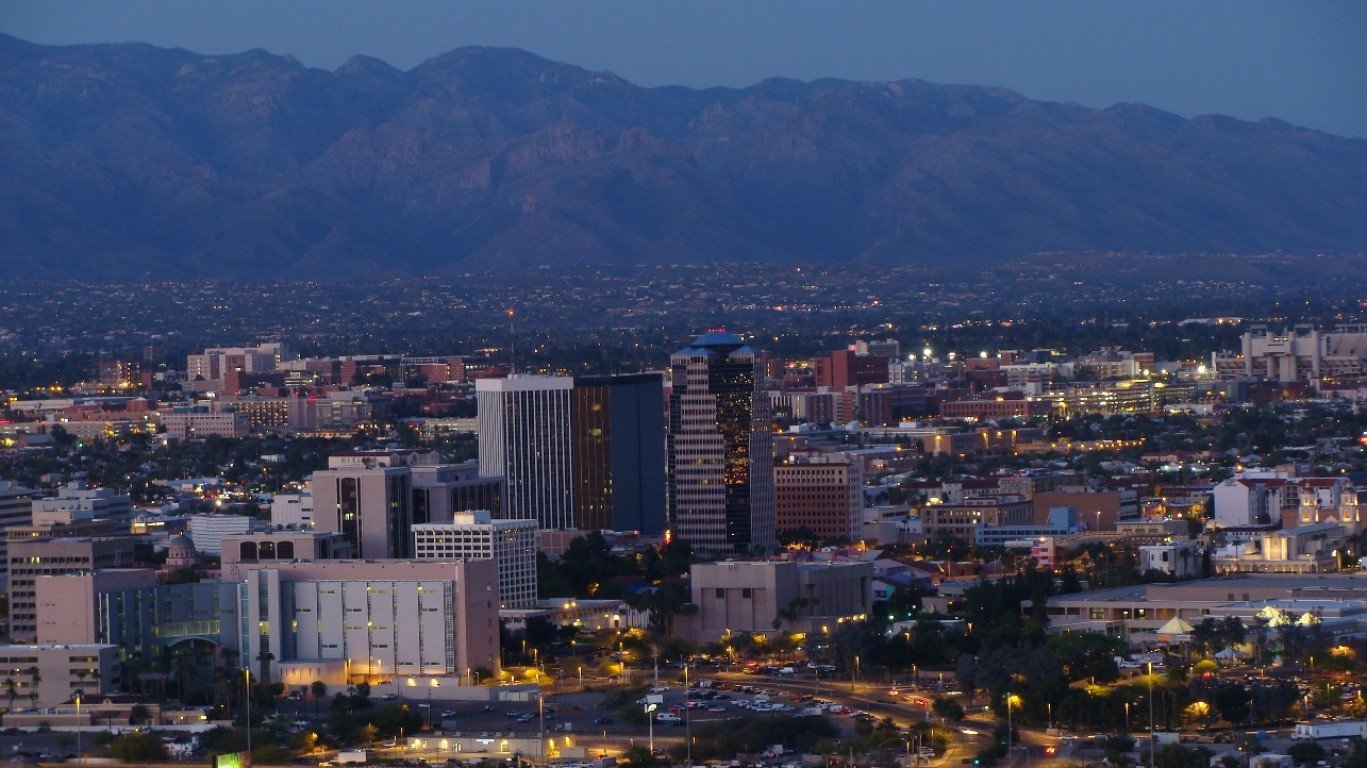
8. Arizona
> Annual flu vaccination rate: children: 50.7%, adults: 37.6%
> Annual flu-related deaths (2016-2018): 1.9 per 100,000 — 22nd lowest (497 total)
> COVID-19 deaths as of Oct 4: 79.6 per 100,000 — 8th highest (5,706 total)
> COVID-19 cases per day Sep 28 – Oct 4: 6.7 per 100,000 — 7th lowest (483 total)
> Total hospital beds in state: 16,342
> Projected peak resource use: Nov 27 (20.0% of total capacity — 11th highest)
> Population 65 and older: 18.0% — 12th highest
> Population without health insurance: 11.3% — 9th highest
Source: Tim Boyle / Getty Images News via Getty Images
7. Illinois
> Annual flu vaccination rate: children: 53.4%, adults: 38.3%
> Annual flu-related deaths (2016-2018): 1.6 per 100,000 — 11th lowest (757 total)
> COVID-19 deaths as of Oct 4: 69.0 per 100,000 — 11th highest (8,791 total)
> COVID-19 cases per day Sep 28 – Oct 4: 15.5 per 100,000 — 22nd highest (1,980 total)
> Total hospital beds in state: 36,072
> Projected peak resource use: Dec 19 (27.0% of total capacity — 5th highest)
> Population 65 and older: 16.1% — 15th lowest
> Population without health insurance: 7.4% — 21st lowest
[in-text-ad-2]

Source: thenationalguard / Flickr
6. Mississippi
> Annual flu vaccination rate: children: 47.8%, adults: 39.6%
> Annual flu-related deaths (2016-2018): 1.6 per 100,000 — 11th lowest (165 total)
> COVID-19 deaths as of Oct 4: 100.9 per 100,000 — 7th highest (3,013 total)
> COVID-19 cases per day Sep 28 – Oct 4: 17.0 per 100,000 — 20th highest (509 total)
> Total hospital beds in state: 14,005
> Projected peak resource use: Oct 20 (6.1% of total capacity — 11th lowest)
> Population 65 and older: 16.4% — 20th lowest
> Population without health insurance: 13.0% — 5th highest

5. Texas
> Annual flu vaccination rate: children: 58.2%, adults: 39.6%
> Annual flu-related deaths (2016-2018): 1.5 per 100,000 — 9th lowest (1,236 total)
> COVID-19 deaths as of Oct 4: 55.8 per 100,000 — 17th highest (16,025 total)
> COVID-19 cases per day Sep 28 – Oct 4: 15.2 per 100,000 — 24th highest (4,360 total)
> Total hospital beds in state: 77,428
> Projected peak resource use: Dec 31 (10.5% of total capacity — 23rd lowest)
> Population 65 and older: 12.9% — 3rd lowest
> Population without health insurance: 18.4% — the highest
[in-text-ad]

Source: Sean Pavone / Getty Images
4. Wisconsin
> Annual flu vaccination rate: children: 57.5%, adults: 39.0%
> Annual flu-related deaths (2016-2018): 2.2 per 100,000 — 19th highest (500 total)
> COVID-19 deaths as of Oct 4: 23.7 per 100,000 — 11th lowest (1,377 total)
> COVID-19 cases per day Sep 28 – Oct 4: 40.4 per 100,000 — 3rd highest (2,349 total)
> Total hospital beds in state: 14,232
> Projected peak resource use: Dec 31 (28.5% of total capacity — 3rd highest)
> Population 65 and older: 17.5% — 17th highest
> Population without health insurance: 5.7% — 8th lowest
Source: Joe Raedle / Getty Images News via Getty Images
3. Oklahoma
> Annual flu vaccination rate: children: 53.3%, adults: 44.9%
> Annual flu-related deaths (2016-2018): 2.3 per 100,000 — 15th highest (309 total)
> COVID-19 deaths as of Oct 4: Not available
> COVID-19 cases per day Sep 28 – Oct 4: 26.1 per 100,000 — 9th highest (1,029 total)
> Total hospital beds in state: 13,153
> Projected peak resource use: Dec 17 (18.8% of total capacity — 13th highest)
> Population 65 and older: 16.1% — 15th lowest
> Population without health insurance: 14.3% — 2nd highest

2. Alabama
> Annual flu vaccination rate: children: 55.1%, adults: 41.7%
> Annual flu-related deaths (2016-2018): 1.6 per 100,000 — 11th lowest (263 total)
> COVID-19 deaths as of Oct 4: 52.3 per 100,000 — 19th highest (2,558 total)
> COVID-19 cases per day Sep 28 – Oct 4: 21.5 per 100,000 — 12th highest (1,049 total)
> Total hospital beds in state: 17,537
> Projected peak resource use: Dec 31 (16.1% of total capacity — 19th highest)
> Population 65 and older: 17.4% — 20th highest
> Population without health insurance: 9.7% — 17th highest
[in-text-ad-2]
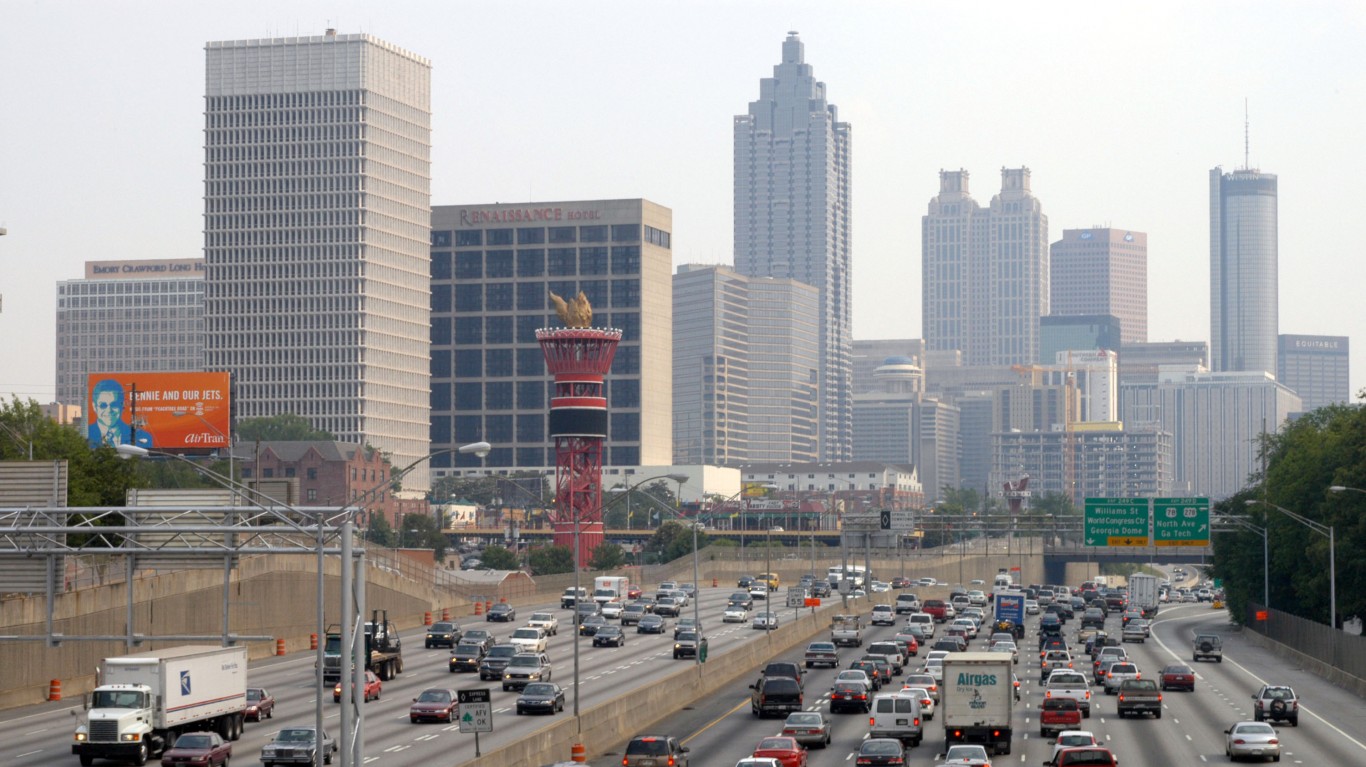
Source: Barry Williams / Getty Images
1. Georgia
> Annual flu vaccination rate: children: 51.9%, adults: 37.8%
> Annual flu-related deaths (2016-2018): 1.2 per 100,000 — 3rd lowest (375 total)
> COVID-19 deaths as of Oct 4: 68.1 per 100,000 — 12th highest (7,162 total)
> COVID-19 cases per day Sep 28 – Oct 4: 11.1 per 100,000 — 24th lowest (1,168 total)
> Total hospital beds in state: 11,817
> Projected peak resource use: Dec 17 (27.5% of total capacity — 4th highest)
> Population 65 and older: 14.3% — 4th lowest
> Population without health insurance: 13.4% — 3rd highest
Methodology
To determine the states where COVID-19 and flu will hit hard at the same time, 24/7 Wall St. constructed an index based on several measures related to COVID-19 infection, influenza infections, and hospital capacity. The index included the following four measures:
>The average percentage of adults 18 and over who received a flu vaccination during the 2010-11 to 2018-19 flu seasons was calculated using data from the Centers for Disease Control and Prevention (CDC) and was included in the index.
>The average number of visits for influenza-like-illnesses as a percentage of all outpatient visits during the 2010-11 to 2019-20 flu seasons was calculated using data from the CDC and was included in the index.
>Data on the average number of new COVID-19 cases per day per 100,000 residents from Sept. 28, 2020 to Oct. 4, 2020 was calculated using data from state and local health departments and was included in the index.
>Data on the average number of COVID-19 hospital beds that will be needed from Sept. 28, 2020 through the rest of the year as a percentage of total bed capacity was calculated from COVID-19 projections data from the Institute for Health Metrics and Evaluation, an independent global health research center at the University of Washington, and was included in the index.
Data on population came from the 2019 American Community Survey of the U.S. Census Bureau.
Sponsored: Want to Retire Early? Here’s a Great First Step
Want retirement to come a few years earlier than you’d planned? Or are you ready to retire now, but want an extra set of eyes on your finances?
Now you can speak with up to 3 financial experts in your area for FREE. By simply clicking here you can begin to match with financial professionals who can help you build your plan to retire early. And the best part? The first conversation with them is free.
Click here to match with up to 3 financial pros who would be excited to help you make financial decisions.
Thank you for reading! Have some feedback for us?
Contact the 24/7 Wall St. editorial team.
Editors' Picks