
It has been seven months since COVID-19 was declared a national emergency in the United States, and in that time, nearly 220,000 Americans died from the novel coronavirus — by far the highest death toll of any country. A study published earlier this week in the Journal of the American Medical Association estimated that the American death toll could reach as high as 400,000 by the end of 2020. The virus has spread throughout the country in a way that has been difficult to predict, surging in one region, then showing signs of improvement, and then reappearing in other regions. Many states where the outbreak appeared to be largely under control have experienced resurgences in cases in recent months.
The extent of the spread of the novel coronavirus continues to vary considerably from state to state, and even from county to county. Even as the number of daily new cases is flattening or even declining in some parts of the country, new cases are surging at a growing rate in others.
Since Sept. 9, the number of new daily cases across the country has fluctuated between 30,000 and 56,000 per day, fewer than during the alarming surge that occurred this summer, but more than during the initial months of the pandemic. And though some states continue to report relatively low figures compared to their peaks this spring and summer, every state but one has at least one county in which cases have been growing.
Using data from state and local health departments, 24/7 Wall St. compiled and reviewed the average of daily new confirmed COVID-19 cases for the week ending Oct. 12 and compared it to the previous week to determine the county in each state where the virus is spreading the fastest, adjusted for the population. We excluded counties with populations of fewer than 5,000 people, as well as those with fewer than 20 reported new cases in the past 14 days. Because up-to-date data was not available for Missouri, that state was excluded from our list.
Though every state, for which there is sufficient data, had at least one county or county equivalent with a week-over-week increase in COVID-19 cases, the virus is spreading much faster in some of these counties compared to others. For instance, in nine states, the county where COVID-19 is growing fastest recorded an increase of over 50 daily average new cases per 100,000 residents in the week ending Oct. 12 as compared to the week ending Oct. 4. Nationwide, for comparison, the number of average daily new cases increased by 1.2 cases, from 13.1 per 100,000 to 14.3 per 100,000.
Conversely, in 12 states, no county recorded an increase of more than 10 average daily new cases per 100,000 residents week-over-week. The majority of these states are on the West Coast or in the Northeast. Unsurprisingly, nearly all of these states had among the lowest average daily new cases per 100,000 residents in the past week. These are the states where the spread of the virus is slowing, and where it is getting worse.
Click here to see the counties in every state where COVID 19 is growing the fastest right now.

Source: Jacqueline Nix / iStock Editorial via Getty Images
Alabama: Marengo County
> Change in daily avg. new COVID-19 cases, week over week: +23.2 per 100,000 people
> Avg. new daily cases in Marengo County in 7 days ending Oct. 12: 64.3 per 100,000
> Avg. new daily cases in Marengo County in 7 days ending Oct. 5: 41.2 per 100,000
> Week-over-week change in daily avg. new cases, Alabama: -2.4
> Cumulative confirmed COVID-19 cases in Marengo County as of Oct. 12: 4,596 per 100,000 people (total: 898)
> Population: 19,538
> Largest place in Marengo County: Demopolis
[in-text-ad]
Source: marco antonio torres / Wikimedia Commons
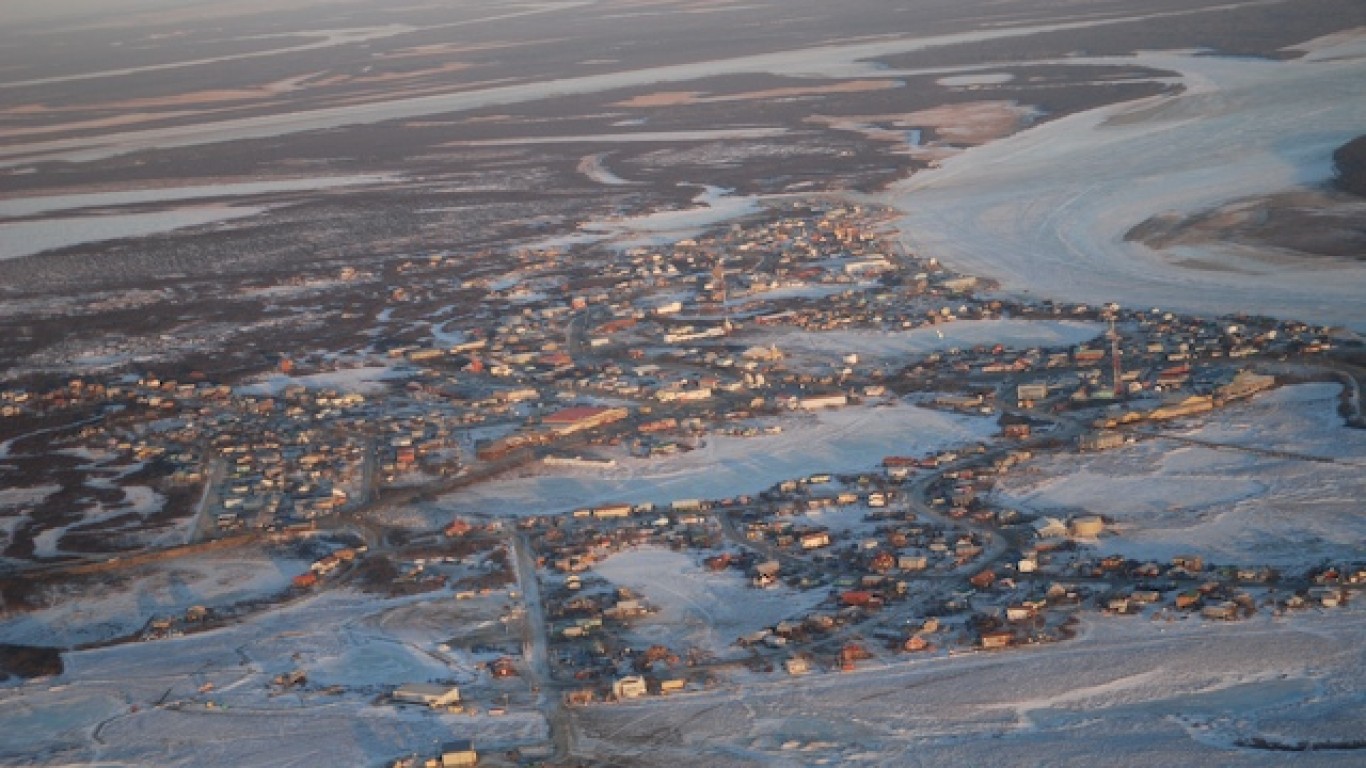
Alaska: Bethel Census Area
> Change in daily avg. new COVID-19 cases, week over week: +24.7 per 100,000 people
> Avg. new daily cases in Bethel Census Area in 7 days ending Oct. 12: 34.7 per 100,000
> Avg. new daily cases in Bethel Census Area in 7 days ending Oct. 5: 10.1 per 100,000
> Week-over-week change in daily avg. new cases, Alaska: +5.2
> Cumulative confirmed COVID-19 cases in Bethel Census Area as of Oct. 12: 1,053 per 100,000 people (total: 190)
> Population: 18,040
> Largest place in Bethel Census Area: Bethel
Source: Bill Eichelberger / Flickr
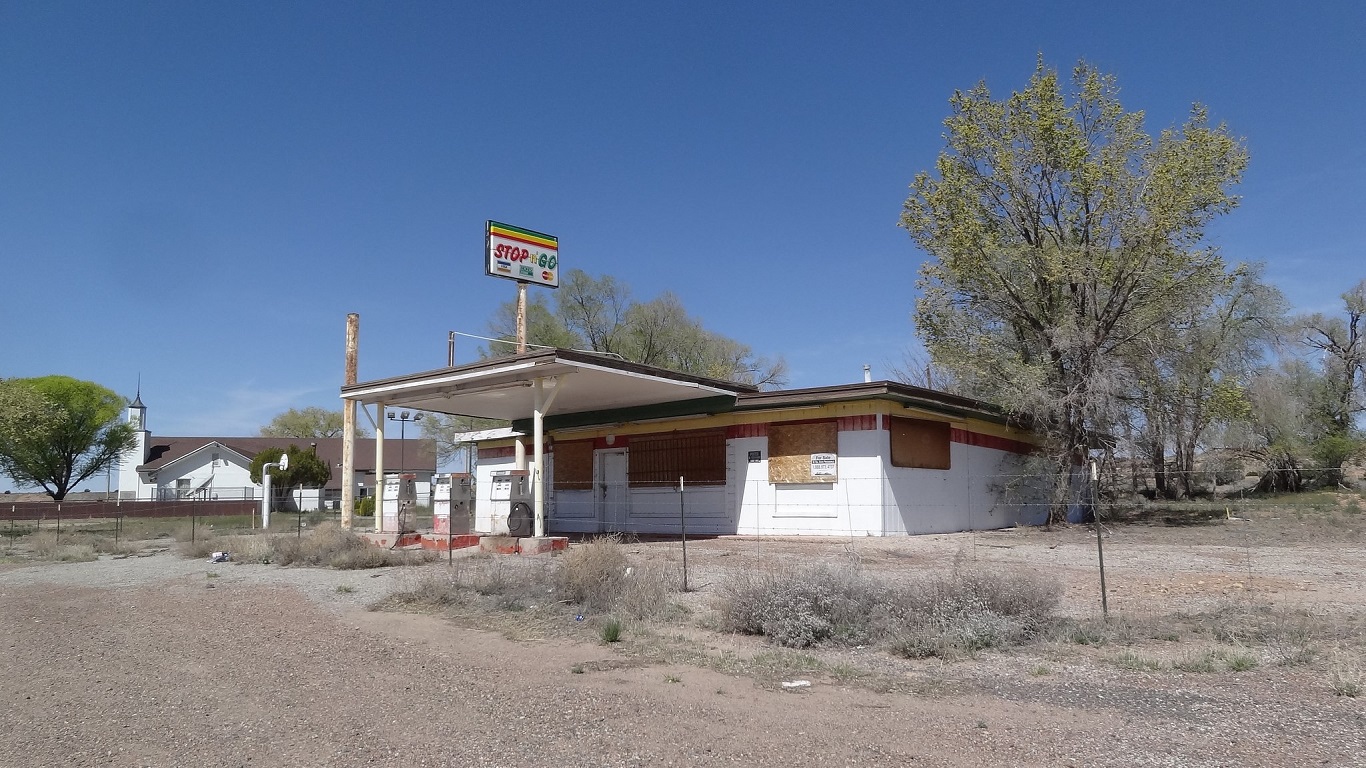
Arizona: Apache County
> Change in daily avg. new COVID-19 cases, week over week: +8.3 per 100,000 people
> Avg. new daily cases in Apache County in 7 days ending Oct. 12: 20.9 per 100,000
> Avg. new daily cases in Apache County in 7 days ending Oct. 5: 12.7 per 100,000
> Week-over-week change in daily avg. new cases, Arizona: +2.1
> Cumulative confirmed COVID-19 cases in Apache County as of Oct. 12: 5,182 per 100,000 people (total: 3,706)
> Population: 71,522
> Largest place in Apache County: Chinle CDP
Source: StuttgartChamber / Wikimedia Commons
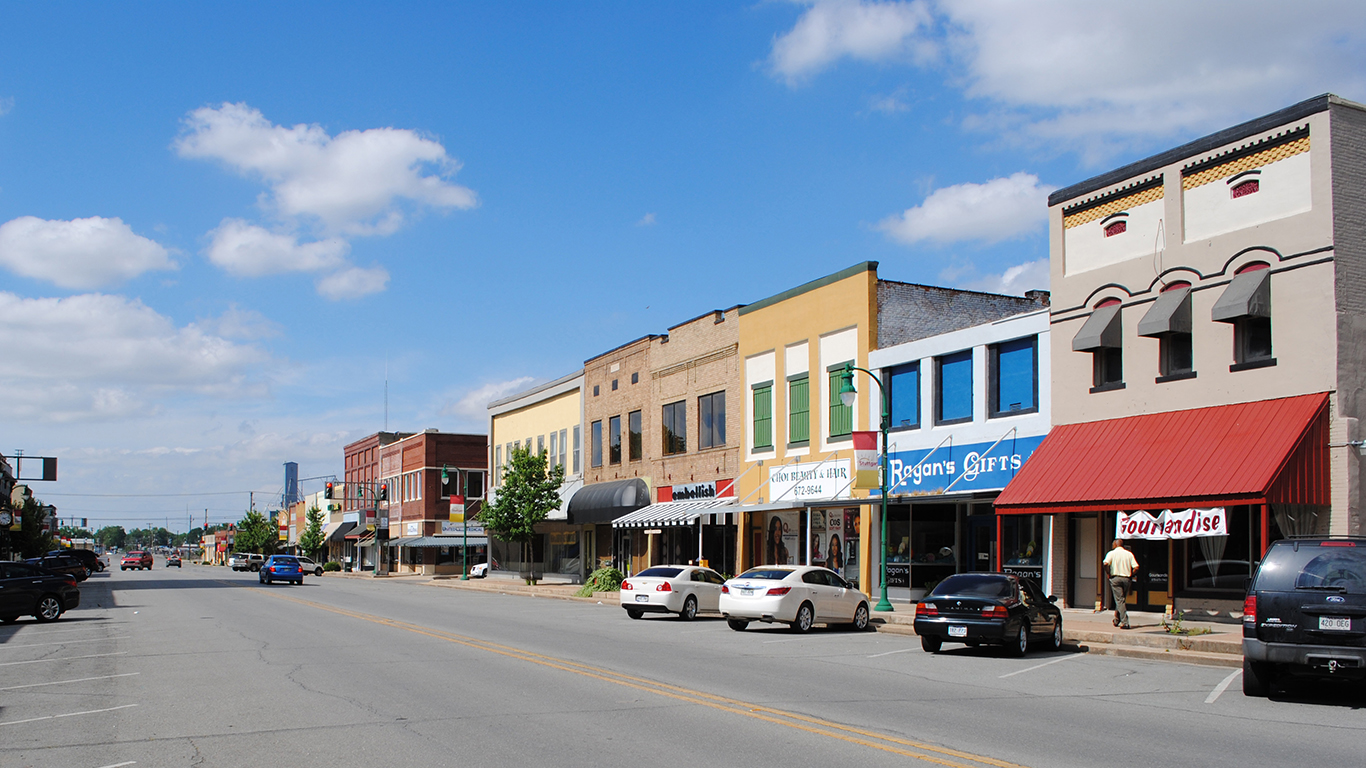
Arkansas: Arkansas County
> Change in daily avg. new COVID-19 cases, week over week: +37.9 per 100,000 people
> Avg. new daily cases in Arkansas County in 7 days ending Oct. 12: 85.2 per 100,000
> Avg. new daily cases in Arkansas County in 7 days ending Oct. 5: 47.3 per 100,000
> Week-over-week change in daily avg. new cases, Arkansas: +0.1
> Cumulative confirmed COVID-19 cases in Arkansas County as of Oct. 12: 3,399 per 100,000 people (total: 616)
> Population: 18,124
> Largest place in Arkansas County: Stuttgart
[in-text-ad-2]

Source: Cbl62 / Wikimedia Commons
California: Imperial County
> Change in daily avg. new COVID-19 cases, week over week: +10.6 per 100,000 people
> Avg. new daily cases in Imperial County in 7 days ending Oct. 12: 35.7 per 100,000
> Avg. new daily cases in Imperial County in 7 days ending Oct. 5: 25.2 per 100,000
> Week-over-week change in daily avg. new cases, California: +0.1
> Cumulative confirmed COVID-19 cases in Imperial County as of Oct. 12: 6,444 per 100,000 people (total: 11,614)
> Population: 180,216
> Largest place in Imperial County: El Centro

Source: chapin31 / iStock via Getty Images
Colorado: Grand County
> Change in daily avg. new COVID-19 cases, week over week: +19.4 per 100,000 people
> Avg. new daily cases in Grand County in 7 days ending Oct. 12: 27.0 per 100,000
> Avg. new daily cases in Grand County in 7 days ending Oct. 5: 7.6 per 100,000
> Week-over-week change in daily avg. new cases, Colorado: +1.9
> Cumulative confirmed COVID-19 cases in Grand County as of Oct. 12: 777 per 100,000 people (total: 117)
> Population: 15,066
> Largest place in Grand County: Granby
[in-text-ad]

Source: connerscott1 / Getty Images
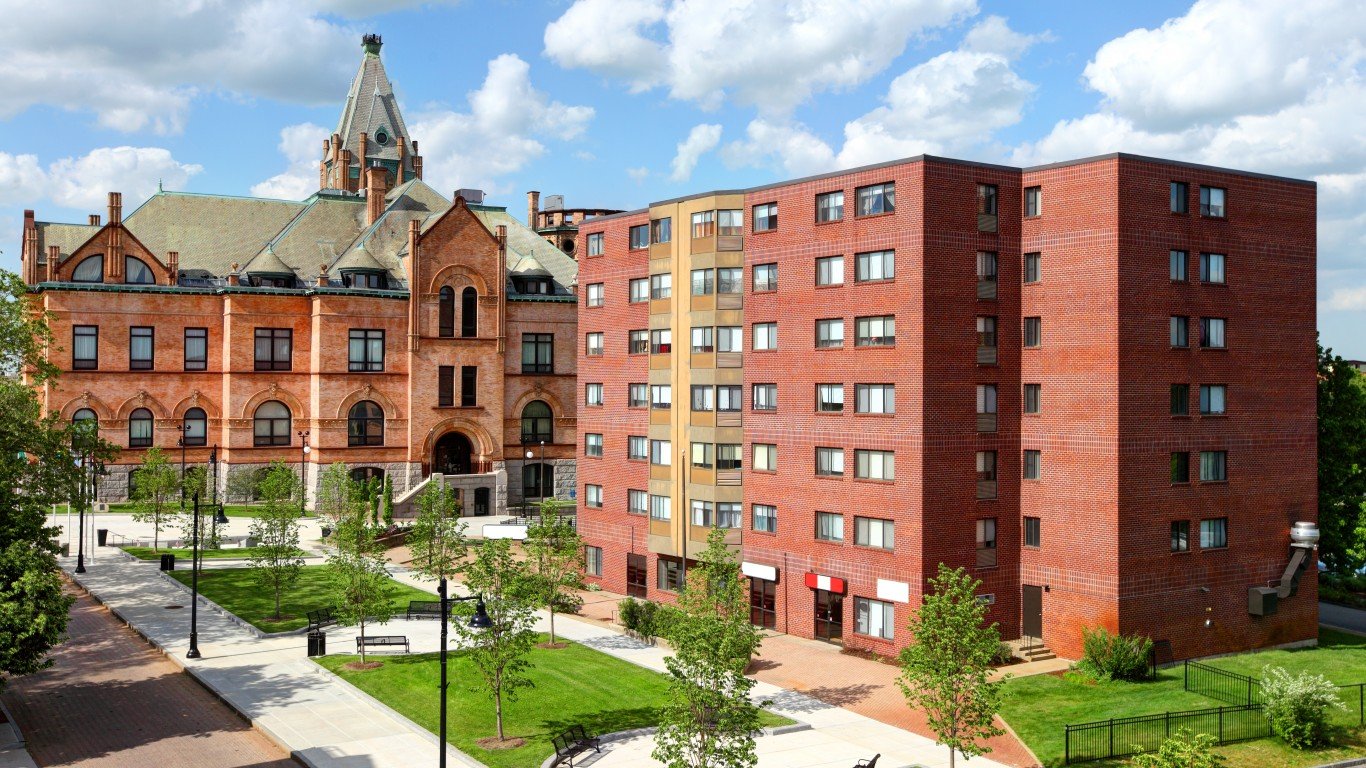
Connecticut: New London County
> Change in daily avg. new COVID-19 cases, week over week: +4.6 per 100,000 people
> Avg. new daily cases in New London County in 7 days ending Oct. 12: 21.3 per 100,000
> Avg. new daily cases in New London County in 7 days ending Oct. 5: 16.7 per 100,000
> Week-over-week change in daily avg. new cases, Connecticut: +1.3
> Cumulative confirmed COVID-19 cases in New London County as of Oct. 12: 1,055 per 100,000 people (total: 2,837)
> Population: 268,881
> Largest place in New London County: Norwich

Source: Levelhead / Wikimedia Commons
Delaware: Sussex County
> Change in daily avg. new COVID-19 cases, week over week: +4.1 per 100,000 people
> Avg. new daily cases in Sussex County in 7 days ending Oct. 12: 16.2 per 100,000
> Avg. new daily cases in Sussex County in 7 days ending Oct. 5: 12.1 per 100,000
> Week-over-week change in daily avg. new cases, Delaware: -0.4
> Cumulative confirmed COVID-19 cases in Sussex County as of Oct. 12: 3,310 per 100,000 people (total: 7,267)
> Population: 219,540
> Largest place in Sussex County: Seaford

Source: Public Domain / Wikimedia Commons
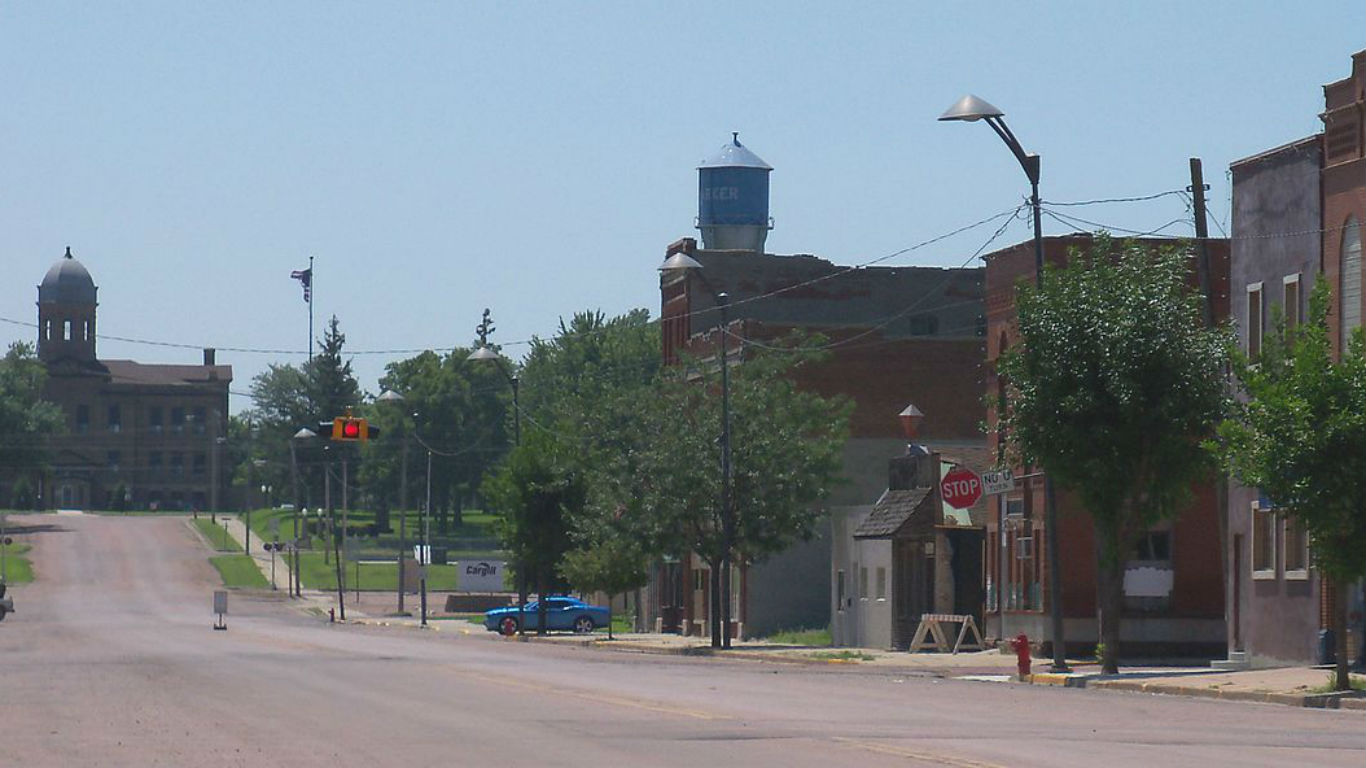
Florida: Baker County
> Change in daily avg. new COVID-19 cases, week over week: +15.1 per 100,000 people
> Avg. new daily cases in Baker County in 7 days ending Oct. 12: 44.1 per 100,000
> Avg. new daily cases in Baker County in 7 days ending Oct. 5: 29.0 per 100,000
> Week-over-week change in daily avg. new cases, Florida: +0.7
> Cumulative confirmed COVID-19 cases in Baker County as of Oct. 12: 5,838 per 100,000 people (total: 1,622)
> Population: 27,785
> Largest place in Baker County: Macclenny
[in-text-ad-2]

Source: BOB WESTON / iStock via Getty Images
Georgia: Laurens County
> Change in daily avg. new COVID-19 cases, week over week: +15.8 per 100,000 people
> Avg. new daily cases in Laurens County in 7 days ending Oct. 12: 34.0 per 100,000
> Avg. new daily cases in Laurens County in 7 days ending Oct. 5: 18.2 per 100,000
> Week-over-week change in daily avg. new cases, Georgia: +0.1
> Cumulative confirmed COVID-19 cases in Laurens County as of Oct. 12: 3,895 per 100,000 people (total: 1,847)
> Population: 47,418
> Largest place in Laurens County: Dublin

Hawaii: Hawaii County
> Change in daily avg. new COVID-19 cases, week over week: +4.0 per 100,000 people
> Avg. new daily cases in Hawaii County in 7 days ending Oct. 12: 9.7 per 100,000
> Avg. new daily cases in Hawaii County in 7 days ending Oct. 5: 5.7 per 100,000
> Week-over-week change in daily avg. new cases, Hawaii: -0.2
> Cumulative confirmed COVID-19 cases in Hawaii County as of Oct. 12: 482 per 100,000 people (total: 953)
> Population: 197,658
> Largest place in Hawaii County: Hilo CDP
[in-text-ad]

Source: Bret-Barton / Getty Images
Idaho: Madison County
> Change in daily avg. new COVID-19 cases, week over week: +40.3 per 100,000 people
> Avg. new daily cases in Madison County in 7 days ending Oct. 12: 148.4 per 100,000
> Avg. new daily cases in Madison County in 7 days ending Oct. 5: 108.1 per 100,000
> Week-over-week change in daily avg. new cases, Idaho: +4.0
> Cumulative confirmed COVID-19 cases in Madison County as of Oct. 12: 4,178 per 100,000 people (total: 1,617)
> Population: 38,705
> Largest place in Madison County: Rexburg

Source: Nyttend / Wikimedia Commons
Illinois: Union County
> Change in daily avg. new COVID-19 cases, week over week: +52.9 per 100,000 people
> Avg. new daily cases in Union County in 7 days ending Oct. 12: 73.9 per 100,000
> Avg. new daily cases in Union County in 7 days ending Oct. 5: 21.0 per 100,000
> Week-over-week change in daily avg. new cases, Illinois: +3.3
> Cumulative confirmed COVID-19 cases in Union County as of Oct. 12: 3,848 per 100,000 people (total: 659)
> Population: 17,127
> Largest place in Union County: Anna

Source: Public Domain / Wikimedia Commons
Indiana: Fountain County
> Change in daily avg. new COVID-19 cases, week over week: +40.1 per 100,000 people
> Avg. new daily cases in Fountain County in 7 days ending Oct. 12: 49.3 per 100,000
> Avg. new daily cases in Fountain County in 7 days ending Oct. 5: 9.2 per 100,000
> Week-over-week change in daily avg. new cases, Indiana: +4.5
> Cumulative confirmed COVID-19 cases in Fountain County as of Oct. 12: 1,365 per 100,000 people (total: 225)
> Population: 16,486
> Largest place in Fountain County: Attica
[in-text-ad-2]

Iowa: Carroll County
> Change in daily avg. new COVID-19 cases, week over week: +38.7 per 100,000 people
> Avg. new daily cases in Carroll County in 7 days ending Oct. 12: 88.0 per 100,000
> Avg. new daily cases in Carroll County in 7 days ending Oct. 5: 49.3 per 100,000
> Week-over-week change in daily avg. new cases, Iowa: +1.6
> Cumulative confirmed COVID-19 cases in Carroll County as of Oct. 12: 4,493 per 100,000 people (total: 914)
> Population: 20,344
> Largest place in Carroll County: Carroll

Source: Smallbones / Wikimedia Commons
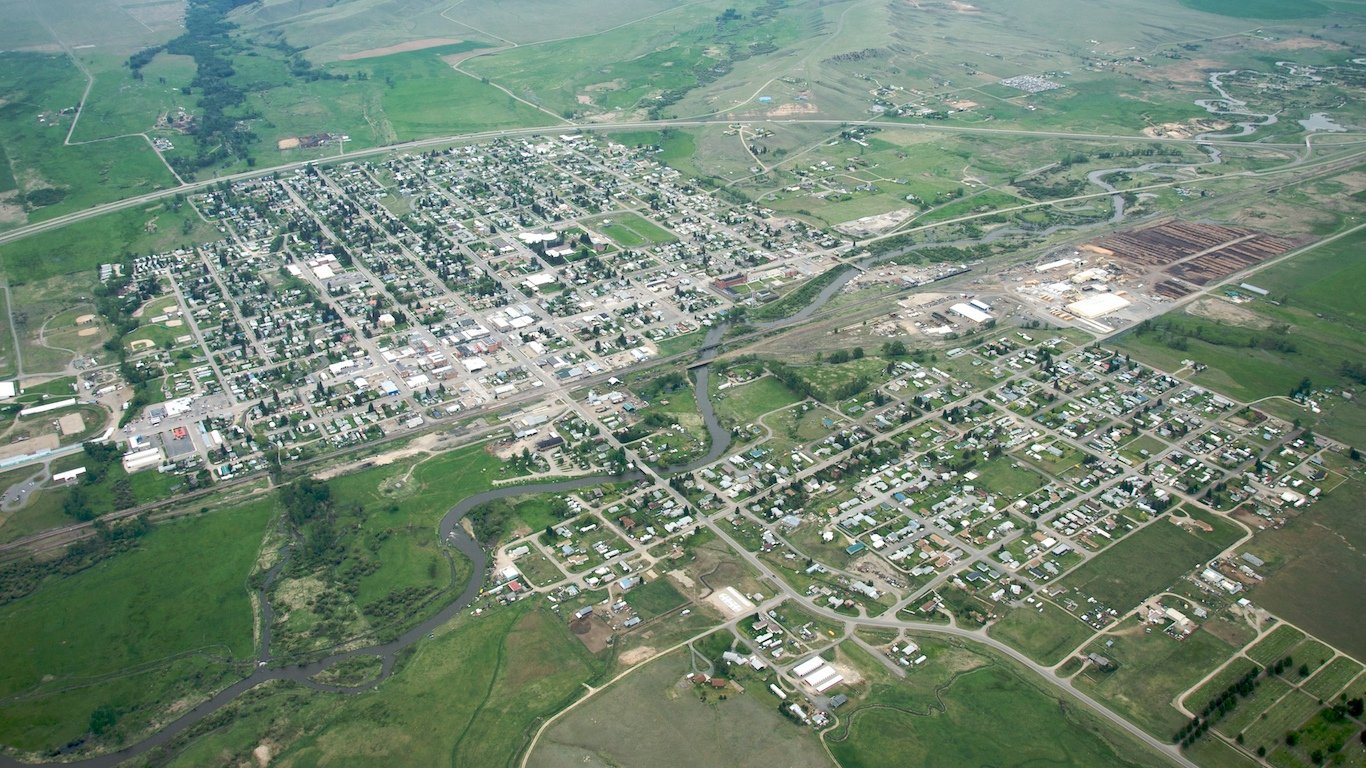
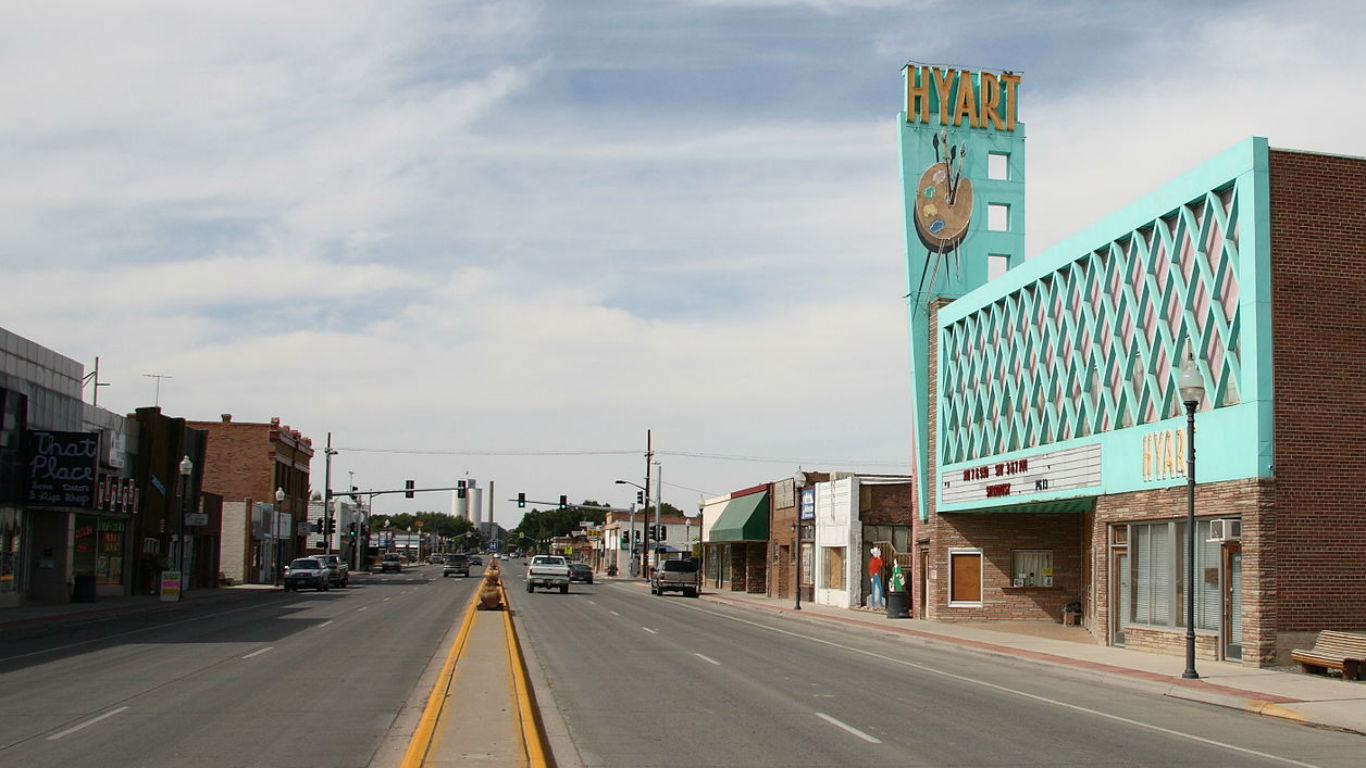
Kansas: Norton County
> Change in daily avg. new COVID-19 cases, week over week: +149.5 per 100,000 people
> Avg. new daily cases in Norton County in 7 days ending Oct. 12: 170.4 per 100,000
> Avg. new daily cases in Norton County in 7 days ending Oct. 5: 20.8 per 100,000
> Week-over-week change in daily avg. new cases, Kansas: +1.4
> Cumulative confirmed COVID-19 cases in Norton County as of Oct. 12: 3,117 per 100,000 people (total: 171)
> Population: 5,486
> Largest place in Norton County: Norton
[in-text-ad]

Source: Daderot / Wikimedia Commons
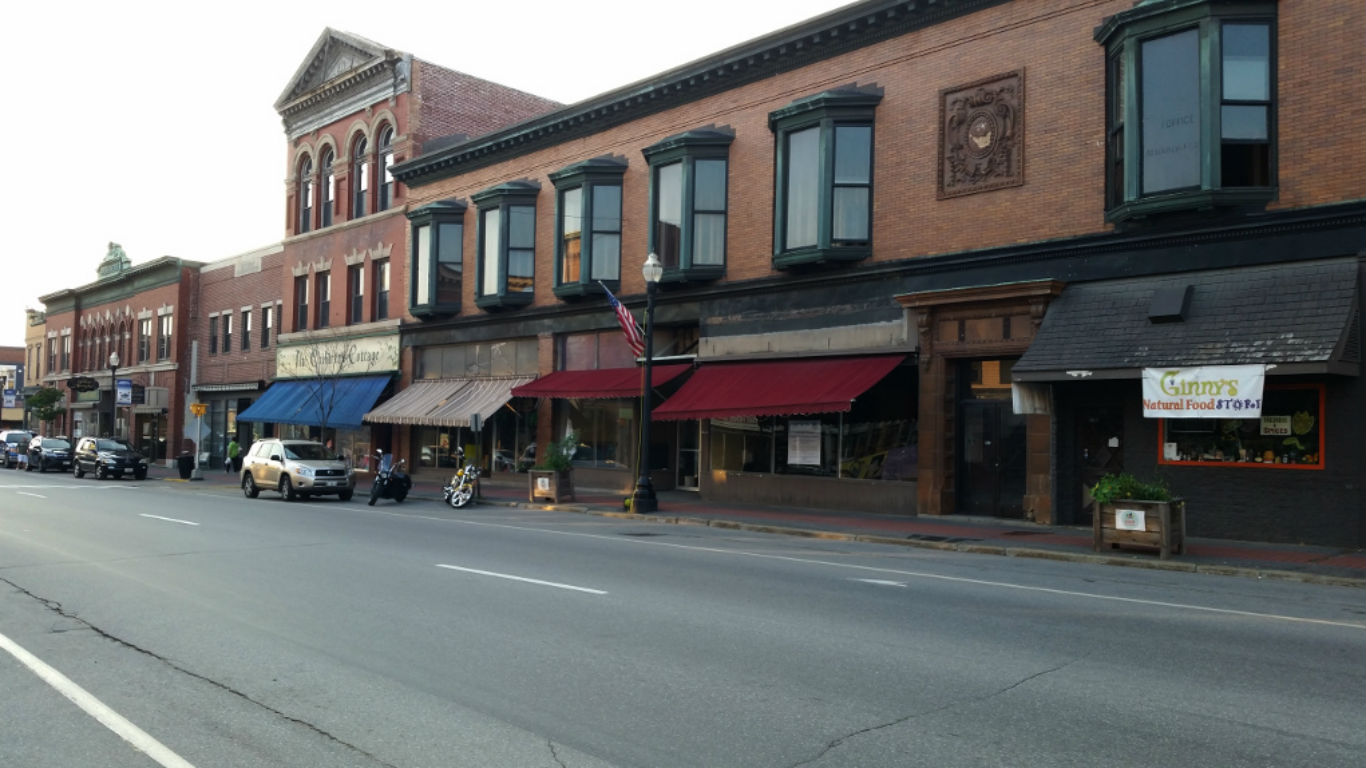
Kentucky: Fayette County
> Change in daily avg. new COVID-19 cases, week over week: +53.9 per 100,000 people
> Avg. new daily cases in Fayette County in 7 days ending Oct. 12: 92.8 per 100,000
> Avg. new daily cases in Fayette County in 7 days ending Oct. 5: 38.9 per 100,000
> Week-over-week change in daily avg. new cases, Kentucky: +5.6
> Cumulative confirmed COVID-19 cases in Fayette County as of Oct. 12: 2,910 per 100,000 people (total: 9,274)
> Population: 318,734
> Largest place in Fayette County: Lexington-Fayette
 24/7 Wall St.
Source: Billy Hathorn / Wikimedia Commons
Louisiana: Caldwell Parish
> Change in daily avg. new COVID-19 cases, week over week: +19.6 per 100,000 people
> Avg. new daily cases in Caldwell Parish in 7 days ending Oct. 12: 22.5 per 100,000
> Avg. new daily cases in Caldwell Parish in 7 days ending Oct. 5: 2.9 per 100,000
> Week-over-week change in daily avg. new cases, Louisiana: +1.0
> Cumulative confirmed COVID-19 cases in Caldwell Parish as of Oct. 12: 3,241 per 100,000 people (total: 324)
> Population: 9,996
> Largest place in Caldwell Parish: Clarks
Source: Magicpiano / Wikimedia Commons
Maine: Somerset County
> Change in daily avg. new COVID-19 cases, week over week: +4.7 per 100,000 people
> Avg. new daily cases in Somerset County in 7 days ending Oct. 12: 5.0 per 100,000
> Avg. new daily cases in Somerset County in 7 days ending Oct. 5: 0.3 per 100,000
> Week-over-week change in daily avg. new cases, Maine: -0.2
> Cumulative confirmed COVID-19 cases in Somerset County as of Oct. 12: 233 per 100,000 people (total: 118)
> Population: 50,710
> Largest place in Somerset County: Skowhegan CDP
[in-text-ad-2]

Maryland: Somerset County
> Change in daily avg. new COVID-19 cases, week over week: +9.4 per 100,000 people
> Avg. new daily cases in Somerset County in 7 days ending Oct. 12: 24.5 per 100,000
> Avg. new daily cases in Somerset County in 7 days ending Oct. 5: 15.1 per 100,000
> Week-over-week change in daily avg. new cases, Maryland: +0.5
> Cumulative confirmed COVID-19 cases in Somerset County as of Oct. 12: 1,333 per 100,000 people (total: 343)
> Population: 25,737
> Largest place in Somerset County: Princess Anne
Source: DenisTangneyJr / iStock via Getty Images
Massachusetts: Plymouth County
> Change in daily avg. new COVID-19 cases, week over week: +1.4 per 100,000 people
> Avg. new daily cases in Plymouth County in 7 days ending Oct. 12: 7.9 per 100,000
> Avg. new daily cases in Plymouth County in 7 days ending Oct. 5: 6.5 per 100,000
> Week-over-week change in daily avg. new cases, Massachusetts: +0.1
> Cumulative confirmed COVID-19 cases in Plymouth County as of Oct. 12: 2,016 per 100,000 people (total: 10,324)
> Population: 512,135
> Largest place in Plymouth County: Brockton
[in-text-ad]

Source: ehrlif / iStock via Getty Images
Michigan: Mackinac County
> Change in daily avg. new COVID-19 cases, week over week: +13.8 per 100,000 people
> Avg. new daily cases in Mackinac County in 7 days ending Oct. 12: 31.5 per 100,000
> Avg. new daily cases in Mackinac County in 7 days ending Oct. 5: 17.7 per 100,000
> Week-over-week change in daily avg. new cases, Michigan: +1.7
> Cumulative confirmed COVID-19 cases in Mackinac County as of Oct. 12: 989 per 100,000 people (total: 107)
> Population: 10,817
> Largest place in Mackinac County: St. Ignace

Minnesota: Mahnomen County
> Change in daily avg. new COVID-19 cases, week over week: +31.5 per 100,000 people
> Avg. new daily cases in Mahnomen County in 7 days ending Oct. 12: 43.0 per 100,000
> Avg. new daily cases in Mahnomen County in 7 days ending Oct. 5: 11.5 per 100,000
> Week-over-week change in daily avg. new cases, Minnesota: +2.6
> Cumulative confirmed COVID-19 cases in Mahnomen County as of Oct. 12: 1,380 per 100,000 people (total: 76)
> Population: 5,506
> Largest place in Mahnomen County: Mahnomen

Source: C5Media / iStock Editorial via Getty Images
Mississippi: Claiborne County
> Change in daily avg. new COVID-19 cases, week over week: +47.9 per 100,000 people
> Avg. new daily cases in Claiborne County in 7 days ending Oct. 12: 59.7 per 100,000
> Avg. new daily cases in Claiborne County in 7 days ending Oct. 5: 11.9 per 100,000
> Week-over-week change in daily avg. new cases, Mississippi: +4.3
> Cumulative confirmed COVID-19 cases in Claiborne County as of Oct. 12: 5,691 per 100,000 people (total: 519)
> Population: 9,120
> Largest place in Claiborne County: Port Gibson
[in-text-ad-2]
Source: https://www.flickr.com/photos/sbeebe/
Montana: Deer Lodge County
> Change in daily avg. new COVID-19 cases, week over week: +93.7 per 100,000 people
> Avg. new daily cases in Deer Lodge County in 7 days ending Oct. 12: 136.4 per 100,000
> Avg. new daily cases in Deer Lodge County in 7 days ending Oct. 5: 42.6 per 100,000
> Week-over-week change in daily avg. new cases, Montana: +17.9
> Cumulative confirmed COVID-19 cases in Deer Lodge County as of Oct. 12: 2,934 per 100,000 people (total: 267)
> Population: 9,100
> Largest place in Deer Lodge County: Anaconda-Deer Lodge County

Nebraska: Polk County
> Change in daily avg. new COVID-19 cases, week over week: +60.2 per 100,000 people
> Avg. new daily cases in Polk County in 7 days ending Oct. 12: 101.7 per 100,000
> Avg. new daily cases in Polk County in 7 days ending Oct. 5: 41.6 per 100,000
> Week-over-week change in daily avg. new cases, Nebraska: +4.4
> Cumulative confirmed COVID-19 cases in Polk County as of Oct. 12: 2,455 per 100,000 people (total: 129)
> Population: 5,255
> Largest place in Polk County: Stromsburg
[in-text-ad]

Source: kenlund / Flickr
Nevada: Lyon County
> Change in daily avg. new COVID-19 cases, week over week: +5.7 per 100,000 people
> Avg. new daily cases in Lyon County in 7 days ending Oct. 12: 10.5 per 100,000
> Avg. new daily cases in Lyon County in 7 days ending Oct. 5: 4.8 per 100,000
> Week-over-week change in daily avg. new cases, Nevada: +1.5
> Cumulative confirmed COVID-19 cases in Lyon County as of Oct. 12: 967 per 100,000 people (total: 514)
> Population: 53,155
> Largest place in Lyon County: Fernley

Source: DenisTangneyJr / Getty Images
New Hampshire: Belknap County
> Change in daily avg. new COVID-19 cases, week over week: +2.8 per 100,000 people
> Avg. new daily cases in Belknap County in 7 days ending Oct. 12: 4.1 per 100,000
> Avg. new daily cases in Belknap County in 7 days ending Oct. 5: 1.3 per 100,000
> Week-over-week change in daily avg. new cases, New Hampshire: +1.1
> Cumulative confirmed COVID-19 cases in Belknap County as of Oct. 12: 298 per 100,000 people (total: 181)
> Population: 60,640
> Largest place in Belknap County: Laconia

Source: David Shankbone / Wikimedia Commons
New Jersey: Monmouth County
> Change in daily avg. new COVID-19 cases, week over week: +4.2 per 100,000 people
> Avg. new daily cases in Monmouth County in 7 days ending Oct. 12: 12.8 per 100,000
> Avg. new daily cases in Monmouth County in 7 days ending Oct. 5: 8.6 per 100,000
> Week-over-week change in daily avg. new cases, New Jersey: +1.2
> Cumulative confirmed COVID-19 cases in Monmouth County as of Oct. 12: 2,061 per 100,000 people (total: 12,851)
> Population: 623,387
> Largest place in Monmouth County: Long Branch
[in-text-ad-2]

Source: Wordbuilder / Wikimedia Commons
New Mexico: Roosevelt County
> Change in daily avg. new COVID-19 cases, week over week: +17.5 per 100,000 people
> Avg. new daily cases in Roosevelt County in 7 days ending Oct. 12: 28.6 per 100,000
> Avg. new daily cases in Roosevelt County in 7 days ending Oct. 5: 11.1 per 100,000
> Week-over-week change in daily avg. new cases, New Mexico: +5.5
> Cumulative confirmed COVID-19 cases in Roosevelt County as of Oct. 12: 1,799 per 100,000 people (total: 344)
> Population: 19,117
> Largest place in Roosevelt County: Portales

Source: traveler1116 / Getty Images
New York: Broome County
> Change in daily avg. new COVID-19 cases, week over week: +15.1 per 100,000 people
> Avg. new daily cases in Broome County in 7 days ending Oct. 12: 35.6 per 100,000
> Avg. new daily cases in Broome County in 7 days ending Oct. 5: 20.5 per 100,000
> Week-over-week change in daily avg. new cases, New York: +1.2
> Cumulative confirmed COVID-19 cases in Broome County as of Oct. 12: 1,278 per 100,000 people (total: 2,485)
> Population: 194,402
> Largest place in Broome County: Binghamton
[in-text-ad]

Source: Mark Clifton / Wikimedia Commons
North Carolina: Avery County
> Change in daily avg. new COVID-19 cases, week over week: +36.7 per 100,000 people
> Avg. new daily cases in Avery County in 7 days ending Oct. 12: 62.3 per 100,000
> Avg. new daily cases in Avery County in 7 days ending Oct. 5: 25.5 per 100,000
> Week-over-week change in daily avg. new cases, North Carolina: +1.4
> Cumulative confirmed COVID-19 cases in Avery County as of Oct. 12: 2,686 per 100,000 people (total: 470)
> Population: 17,501
> Largest place in Avery County: Banner Elk

North Dakota: Mercer County
> Change in daily avg. new COVID-19 cases, week over week: +35.2 per 100,000 people
> Avg. new daily cases in Mercer County in 7 days ending Oct. 12: 101.0 per 100,000
> Avg. new daily cases in Mercer County in 7 days ending Oct. 5: 65.7 per 100,000
> Week-over-week change in daily avg. new cases, North Dakota: +12.4
> Cumulative confirmed COVID-19 cases in Mercer County as of Oct. 12: 3,232 per 100,000 people (total: 277)
> Population: 8,570
> Largest place in Mercer County: Beulah

Source: Wikimedia Commons / Bwsmith84
Ohio: Fayette County
> Change in daily avg. new COVID-19 cases, week over week: +19.7 per 100,000 people
> Avg. new daily cases in Fayette County in 7 days ending Oct. 12: 36.1 per 100,000
> Avg. new daily cases in Fayette County in 7 days ending Oct. 5: 16.4 per 100,000
> Week-over-week change in daily avg. new cases, Ohio: +2.0
> Cumulative confirmed COVID-19 cases in Fayette County as of Oct. 12: 1,257 per 100,000 people (total: 360)
> Population: 28,645
> Largest place in Fayette County: Washington
[in-text-ad-2]

Oklahoma: Okfuskee County
> Change in daily avg. new COVID-19 cases, week over week: +31.7 per 100,000 people
> Avg. new daily cases in Okfuskee County in 7 days ending Oct. 12: 51.4 per 100,000
> Avg. new daily cases in Okfuskee County in 7 days ending Oct. 5: 19.7 per 100,000
> Week-over-week change in daily avg. new cases, Oklahoma: +1.2
> Cumulative confirmed COVID-19 cases in Okfuskee County as of Oct. 12: 1,775 per 100,000 people (total: 215)
> Population: 12,115
> Largest place in Okfuskee County: Okemah

Source: Rex_Wholster / iStock via Getty Images
Oregon: Klamath County
> Change in daily avg. new COVID-19 cases, week over week: +9.4 per 100,000 people
> Avg. new daily cases in Klamath County in 7 days ending Oct. 12: 13.1 per 100,000
> Avg. new daily cases in Klamath County in 7 days ending Oct. 5: 3.7 per 100,000
> Week-over-week change in daily avg. new cases, Oregon: +1.3
> Cumulative confirmed COVID-19 cases in Klamath County as of Oct. 12: 581 per 100,000 people (total: 385)
> Population: 66,310
> Largest place in Klamath County: Klamath Falls
[in-text-ad]

Source: Courtesy of Joe Calzarette via Wikimedia Commons
Pennsylvania: Huntingdon County
> Change in daily avg. new COVID-19 cases, week over week: +19.0 per 100,000 people
> Avg. new daily cases in Huntingdon County in 7 days ending Oct. 12: 27.5 per 100,000
> Avg. new daily cases in Huntingdon County in 7 days ending Oct. 5: 8.4 per 100,000
> Week-over-week change in daily avg. new cases, Pennsylvania: +1.9
> Cumulative confirmed COVID-19 cases in Huntingdon County as of Oct. 12: 1,262 per 100,000 people (total: 573)
> Population: 45,421
> Largest place in Huntingdon County: Huntingdon

Source: SeanPavonePhoto / Getty Images
Rhode Island: no county with increase
> Week-over-week change in daily avg. new cases, Rhode Island: +4.2
Source: Curtis and Eric from Crawfordville, FL, USA / Wikimedia Commons
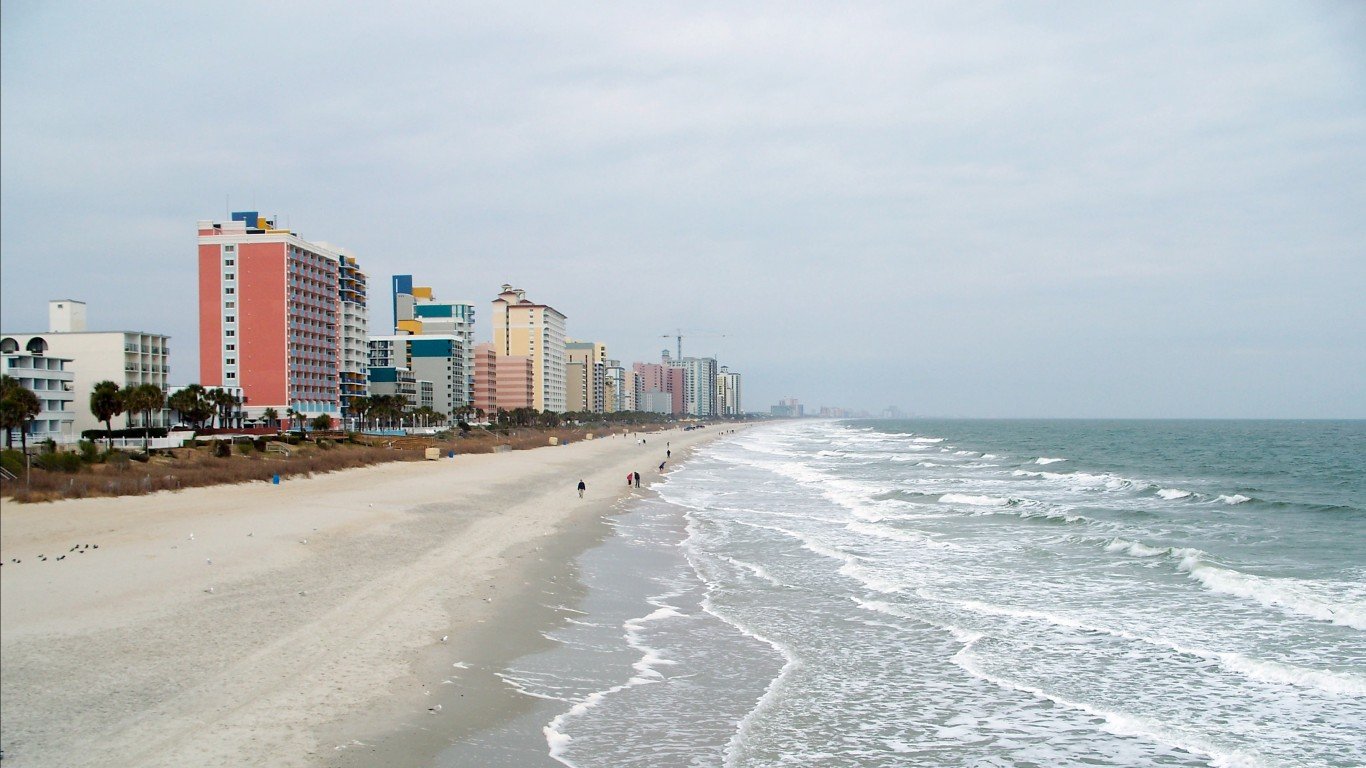
South Carolina: Horry County
> Change in daily avg. new COVID-19 cases, week over week: +14.2 per 100,000 people
> Avg. new daily cases in Horry County in 7 days ending Oct. 12: 24.8 per 100,000
> Avg. new daily cases in Horry County in 7 days ending Oct. 5: 10.6 per 100,000
> Week-over-week change in daily avg. new cases, South Carolina: +1.0
> Cumulative confirmed COVID-19 cases in Horry County as of Oct. 12: 3,533 per 100,000 people (total: 11,337)
> Population: 320,915
> Largest place in Horry County: Myrtle Beach
[in-text-ad-2]
Source: AlexiusHoratius / Wikimedia Commons
South Dakota: Turner County
> Change in daily avg. new COVID-19 cases, week over week: +79.5 per 100,000 people
> Avg. new daily cases in Turner County in 7 days ending Oct. 12: 122.0 per 100,000
> Avg. new daily cases in Turner County in 7 days ending Oct. 5: 42.5 per 100,000
> Week-over-week change in daily avg. new cases, South Dakota: +14.2
> Cumulative confirmed COVID-19 cases in Turner County as of Oct. 12: 3,509 per 100,000 people (total: 290)
> Population: 8,264
> Largest place in Turner County: Parker

Tennessee: Johnson County
> Change in daily avg. new COVID-19 cases, week over week: +136.2 per 100,000 people
> Avg. new daily cases in Johnson County in 7 days ending Oct. 12: 191.1 per 100,000
> Avg. new daily cases in Johnson County in 7 days ending Oct. 5: 55.0 per 100,000
> Week-over-week change in daily avg. new cases, Tennessee: +6.5
> Cumulative confirmed COVID-19 cases in Johnson County as of Oct. 12: 5,886 per 100,000 people (total: 1,047)
> Population: 17,789
> Largest place in Johnson County: Mountain City
[in-text-ad]

Source: https://www.flickr.com/photos/denisemattox/
Texas: Falls County
> Change in daily avg. new COVID-19 cases, week over week: +167.0 per 100,000 people
> Avg. new daily cases in Falls County in 7 days ending Oct. 12: 216.2 per 100,000
> Avg. new daily cases in Falls County in 7 days ending Oct. 5: 49.2 per 100,000
> Week-over-week change in daily avg. new cases, Texas: -0.8
> Cumulative confirmed COVID-19 cases in Falls County as of Oct. 12: 3,416 per 100,000 people (total: 591)
> Population: 17,299
> Largest place in Falls County: Marlin

Source: Jeremy Christensen / Getty Images
Utah: Tooele County
> Change in daily avg. new COVID-19 cases, week over week: +10.1 per 100,000 people
> Avg. new daily cases in Tooele County in 7 days ending Oct. 12: 22.3 per 100,000
> Avg. new daily cases in Tooele County in 7 days ending Oct. 5: 12.2 per 100,000
> Week-over-week change in daily avg. new cases, Utah: +4.9
> Cumulative confirmed COVID-19 cases in Tooele County as of Oct. 12: 1,661 per 100,000 people (total: 1,083)
> Population: 65,185
> Largest place in Tooele County: Tooele

Source: cogdog / Flickr
Vermont: Addison County
> Change in daily avg. new COVID-19 cases, week over week: +7.2 per 100,000 people
> Avg. new daily cases in Addison County in 7 days ending Oct. 12: 9.2 per 100,000
> Avg. new daily cases in Addison County in 7 days ending Oct. 5: 2.0 per 100,000
> Week-over-week change in daily avg. new cases, Vermont: +0.6
> Cumulative confirmed COVID-19 cases in Addison County as of Oct. 12: 306 per 100,000 people (total: 113)
> Population: 36,939
> Largest place in Addison County: Middlebury CDP
[in-text-ad-2]

Source: Commander Shepard247 / Wikimedia Commons
Virginia: Charlotte County
> Change in daily avg. new COVID-19 cases, week over week: +28.3 per 100,000 people
> Avg. new daily cases in Charlotte County in 7 days ending Oct. 12: 49.1 per 100,000
> Avg. new daily cases in Charlotte County in 7 days ending Oct. 5: 20.8 per 100,000
> Week-over-week change in daily avg. new cases, Virginia: +2.1
> Cumulative confirmed COVID-19 cases in Charlotte County as of Oct. 12: 1,521 per 100,000 people (total: 184)
> Population: 12,095
> Largest place in Charlotte County: Keysville

Source: Kirk Bailey / Wikimedia Commons
Washington: Pend Oreille County
> Change in daily avg. new COVID-19 cases, week over week: +11.4 per 100,000 people
> Avg. new daily cases in Pend Oreille County in 7 days ending Oct. 12: 25.3 per 100,000
> Avg. new daily cases in Pend Oreille County in 7 days ending Oct. 5: 13.9 per 100,000
> Week-over-week change in daily avg. new cases, Washington: -0.2
> Cumulative confirmed COVID-19 cases in Pend Oreille County as of Oct. 12: 787 per 100,000 people (total: 104)
> Population: 13,219
> Largest place in Pend Oreille County: Newport
[in-text-ad]
Source: Roberto Galan / iStock Editorial via Getty Images
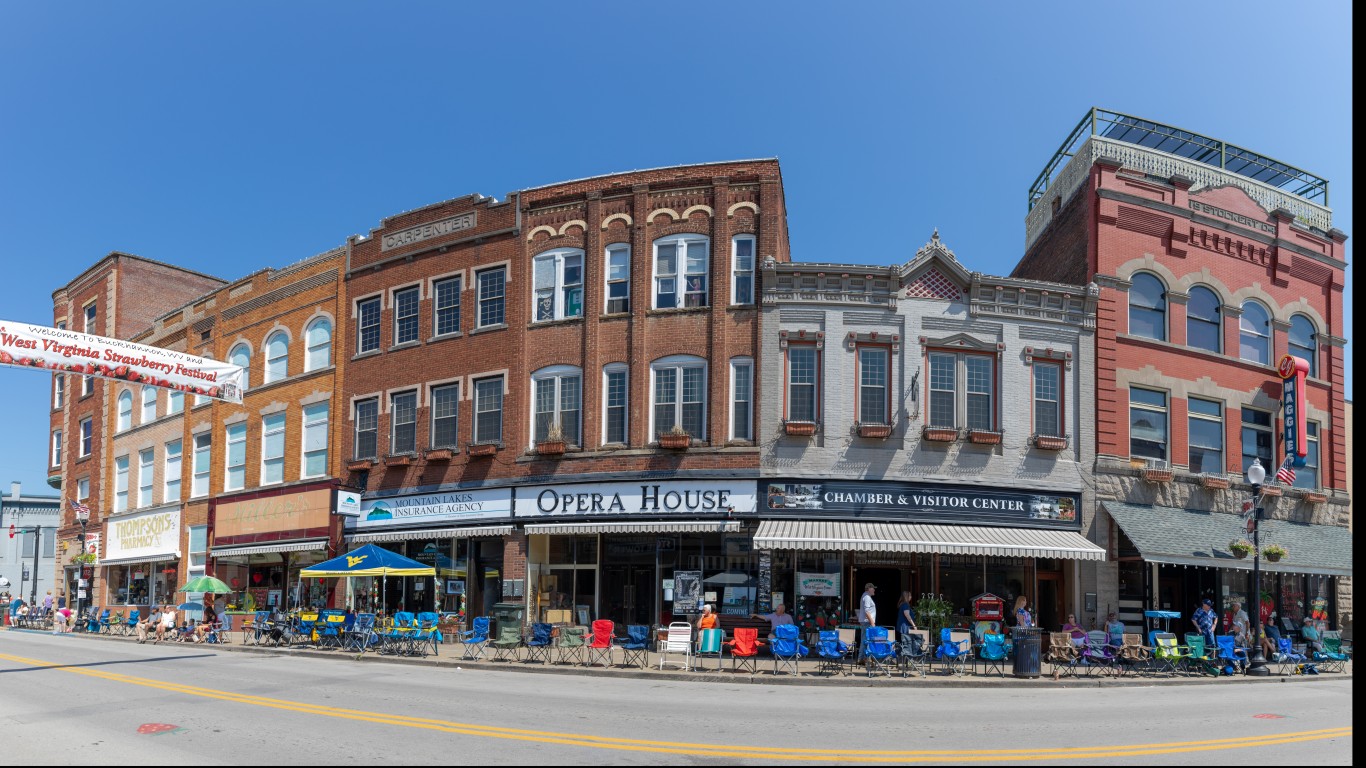
West Virginia: Upshur County
> Change in daily avg. new COVID-19 cases, week over week: +16.8 per 100,000 people
> Avg. new daily cases in Upshur County in 7 days ending Oct. 12: 35.3 per 100,000
> Avg. new daily cases in Upshur County in 7 days ending Oct. 5: 18.4 per 100,000
> Week-over-week change in daily avg. new cases, West Virginia: +1.1
> Cumulative confirmed COVID-19 cases in Upshur County as of Oct. 12: 744 per 100,000 people (total: 183)
> Population: 24,605
> Largest place in Upshur County: Buckhannon

Wisconsin: Langlade County
> Change in daily avg. new COVID-19 cases, week over week: +41.3 per 100,000 people
> Avg. new daily cases in Langlade County in 7 days ending Oct. 12: 108.8 per 100,000
> Avg. new daily cases in Langlade County in 7 days ending Oct. 5: 67.5 per 100,000
> Week-over-week change in daily avg. new cases, Wisconsin: +1.4
> Cumulative confirmed COVID-19 cases in Langlade County as of Oct. 12: 2,520 per 100,000 people (total: 483)
> Population: 19,164
> Largest place in Langlade County: Antigo
Source: Acroterion / Wikimedia Commons
Wyoming: Big Horn County
> Change in daily avg. new COVID-19 cases, week over week: +17.7 per 100,000 people
> Avg. new daily cases in Big Horn County in 7 days ending Oct. 12: 35.0 per 100,000
> Avg. new daily cases in Big Horn County in 7 days ending Oct. 5: 17.3 per 100,000
> Week-over-week change in daily avg. new cases, Wyoming: +5.8
> Cumulative confirmed COVID-19 cases in Big Horn County as of Oct. 12: 966 per 100,000 people (total: 115)
> Population: 11,901
> Largest place in Big Horn County: Lovell
Take This Retirement Quiz To Get Matched With An Advisor Now (Sponsored)
Are you ready for retirement? Planning for retirement can be overwhelming, that’s why it could be a good idea to speak to a fiduciary financial advisor about your goals today.
Start by taking this retirement quiz right here from SmartAsset that will match you with up to 3 financial advisors that serve your area and beyond in 5 minutes. Smart Asset is now matching over 50,000 people a month.
Click here now to get started.
Thank you for reading! Have some feedback for us?
Contact the 24/7 Wall St. editorial team.
Editors' Picks


