
Since COVID-19 was declared a national emergency, the American job market has struggled. The August 2020 unemployment rate of 8.4% was more than double the August 2019 rate of just 3.7%. While job losses in some of American cities are mostly attributed to the recent economic fallout, in some areas of the country, job losses have been ongoing for years.
To identify the American cities losing the most jobs, 24/7 Wall St. ranked U.S. metropolitan statistical areas by the percent decline in the total number of people employed over the five years from August 2015 to August 2020.
Though just about every industry has been affected by the COVID-19 pandemic, leisure and hospitality workers have been hit the hardest. There were over 2.6 million fewer jobs in this industry in August 2020 than five years before as hotels, amusement parks, and other nonessential services nearly ground to a halt. Many of the cities losing the most jobs shed more leisure and hospitality jobs than those of any other sector.
Many large retailers have also struggled to deal with the fallout from COVID-19 as consumers have spent less on clothing and nonessential items. Thousands of Americans working in retail have been furloughed or laid off as major national brands shutter dozens of locations, or cease operations altogether. These are the American businesses that may not survive coronavirus.
Though the cities experiencing the largest employment declines were spread all across the country, roughly one-third are in the Rust Belt area. The region, once known for its manufacturing, has experienced economic contraction for many years as many manufacturing jobs have been lost to automation or gone overseas. Many Rust Belt cities experienced high job losses even before the pandemic, a trend that continued as COVID-19 hit. The lack of jobs has driven many people out of these cities in search of employment in other areas. These are the cities Americans are abandoning.
Click here to see 29 American cities losing the most jobs.
Click here to read our detailed methodology.

Source: miroslav_1 / Getty Images
29. Flagstaff, AZ
> 5 yr. employment change: -10.2% (-6,990 jobs)
> August 2020 unemployment rate: 7.7%
> Median household income: $58,085
> Poverty rate: 15.8%
> 2019 population (pct. change from 2015): 143,476 (3.2%)
Flagstaff, Arizona, is one of 29 U.S. metro areas in which the total employment has declined by more than 10% from August 2015 to August 2020. There were 68,251 workers in Flagstaff in August 2015, and nearly 7,000 fewer workers five years later.
Like nearly every other city on this list, the majority of job losses can be attributed to the COVID-19 pandemic and resulting economic downturn. Flagstaff actually added nearly 5,000 jobs from August 2015 to August 2019, before losing nearly 12,000 jobs from August 2019 to August 2020. The majority of all jobs lost during the past year were in the leisure and hospitality sector as travel nearly ground to a halt amid the pandemic.
[in-text-ad]

Source: https://www.flickr.com/photos/roadgeek/
28. Altoona, PA
> 5 yr. employment change: -10.3% (-5,956 jobs)
> August 2020 unemployment rate: 9.4%
> Median household income: $51,004
> Poverty rate: 15.6%
> 2019 population (pct. change from 2015): 121,829 (-2.2%)
Altoona is one of five Pennsylvania cities in which employment declined by more than 10% in the last five years — no other state has as many cities with such large employment decreases. Though the COVID-19 pandemic hit Altoona hard, it was already struggling. The city had already lost over 1,000 jobs between 2015 and 2019. Employment further decreased by nearly 5,000 from August 2019 to August 2020.

Source: Ashley Freiheit / Getty Images
27. Glens Falls, NY
> 5 yr. employment change: -10.4% (-5,984 jobs)
> August 2020 unemployment rate: 9.5%
> Median household income: $61,255
> Poverty rate: 10.8%
> 2019 population (pct. change from 2015): 125,148 (-1.2%)
Glens Falls, located about 50 miles North of Albany along the Hudson River, is one of two New York metro areas in which employment fell by over 10% over the past five years. The largest share of lost jobs were in the leisure and hospitality industry. Though many of the nearly 6,000 jobs lost in Glens Falls since 2015 were lost due to COVID-19, the area’s job market was already in decline before the pandemic. The metro area lost around 1,300 jobs between August 2015 and August 2019.

Source: DenisTangneyJr / iStock via Getty Images
26. Visalia-Porterville, CA
> 5 yr. employment change: -10.4% (-18,559 jobs)
> August 2020 unemployment rate: 13.9%
> Median household income: $57,692
> Poverty rate: 18.8%
> 2019 population (pct. change from 2015): 466,195 (2.0%)
Though the Visalia-Porterville area lost more jobs in the leisure and hospitality industry than any other industry, like many other cities on this list, a large number of its industries have struggled as well. The area has lost hundreds of jobs in the manufacturing, finance, and retail trade sectors over the past five years. As of August 2020, the area had the seventh highest unemployment rate of any major U.S. metro area, with 13.9% of the labor force out of work, compared to the overall nationwide unemployment rate of 8.4%.
[in-text-ad-2]
Source: David McNew / Getty Images News via Getty Images
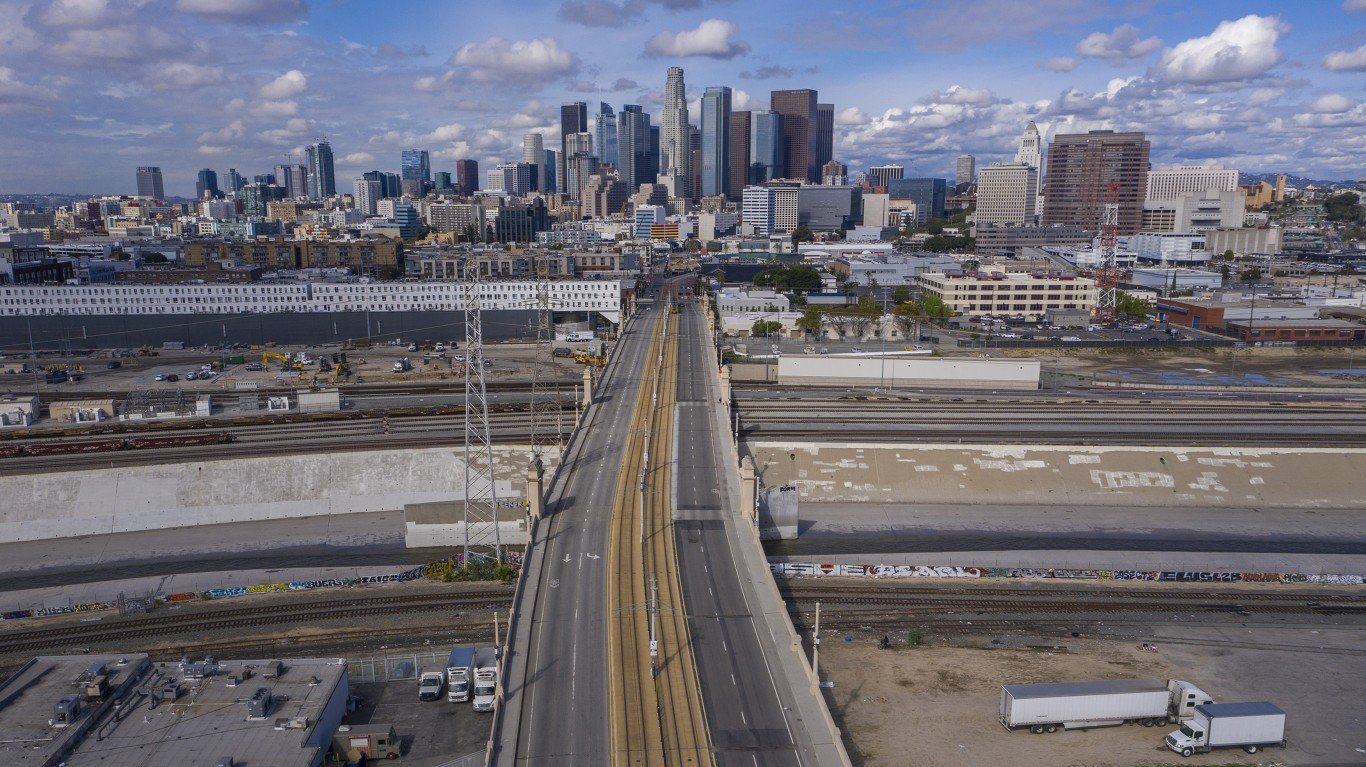
25. Los Angeles-Long Beach-Anaheim, CA
> 5 yr. employment change: -10.4% (-644,367 jobs)
> August 2020 unemployment rate: 14.4%
> Median household income: $77,774
> Poverty rate: 12.4%
> 2019 population (pct. change from 2015): 13,214,799 (-0.2%)
With the Los Angeles metro area losing more than 644,000 jobs over the past five years, L.A. trails only the New York City metro area in total job losses in that time. The 10.4% employment decline from 2015 to 2020 ranks 25th highest in the nation. Before the pandemic, the Los Angeles economy appeared strong, adding over 310,000 jobs from 2015 to 2019, with the unemployment rate falling from 5.8% to 3.9% in that time. Yet the pandemic wiped out those gains. In fact, employment fell by over 955,000 from August 2019 to August 2020, with the leisure and hospitality industry shedding the most jobs.
Source: StanRohrer / Getty Images
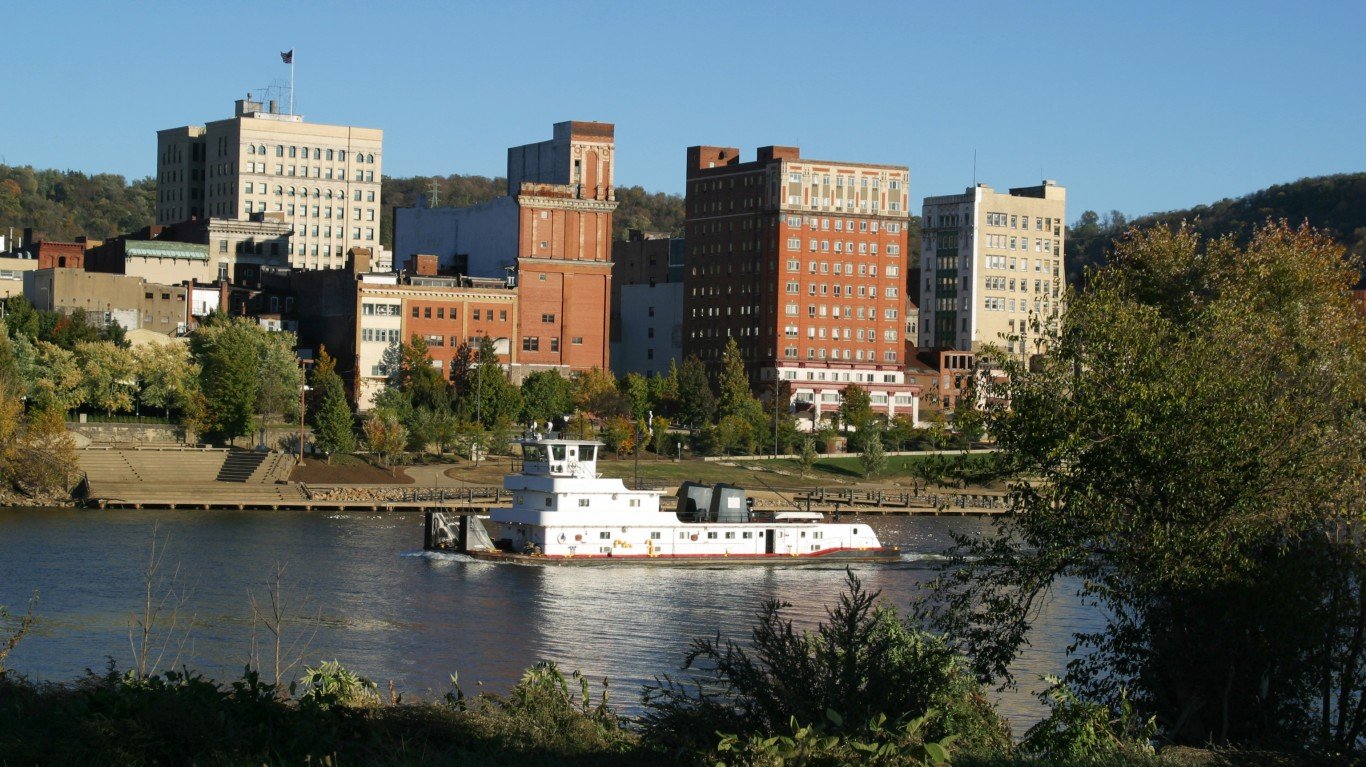
24. Wheeling, WV-OH
> 5 yr. employment change: -10.5% (-6,406 jobs)
> August 2020 unemployment rate: 10.8%
> Median household income: $50,440
> Poverty rate: 11.4%
> 2019 population (pct. change from 2015): 138,948 (-3.6%)
The Wheeling, West Virginia, metro area, toward the northern tip of the state between Ohio and Pennsylvania, reported a 10.5% decline in employment from August 2015 to August 2020 — a loss of over 6,400 jobs. Most of those jobs were shed during the COVID-19 pandemic, when events that serve as economic drivers for the area, like the rodeo at WesBanco Arena, were cancelled or postponed, impacting hotels, restaurants, and more.
[in-text-ad]

Source: faungg's photos / Flickr
23. Houma-Thibodaux, LA
> 5 yr. employment change: -10.6% (-9,814 jobs)
> August 2020 unemployment rate: 6.4%
> Median household income: $49,874
> Poverty rate: 19.5%
> 2019 population (pct. change from 2015): 208,075 (-1.9%)
Unlike virtually every other metro area on this list, the job market in the Houma-Thibodaux, Louisiana, area fared relatively well amid the economic fallout from the COVID-19 pandemic. Area employment declined by fewer than 1,500 people, or around 1.7%, from August 2019 to August 2020, the lowest decline of cities on the list. Meanwhile, most metro areas on this list shed well over 10% of their workforce over the past year.
This part of southeastern Louisiana appears on this list largely because the number of jobs declined by around 8,400 from 2015 to 2019. Though the metro area’s unemployment rate was relatively high from 2015 to 2019, it was 6.4% in August 2020 — 2 percentage points lower than the national unemployment rate.
 24/7 Wall St.
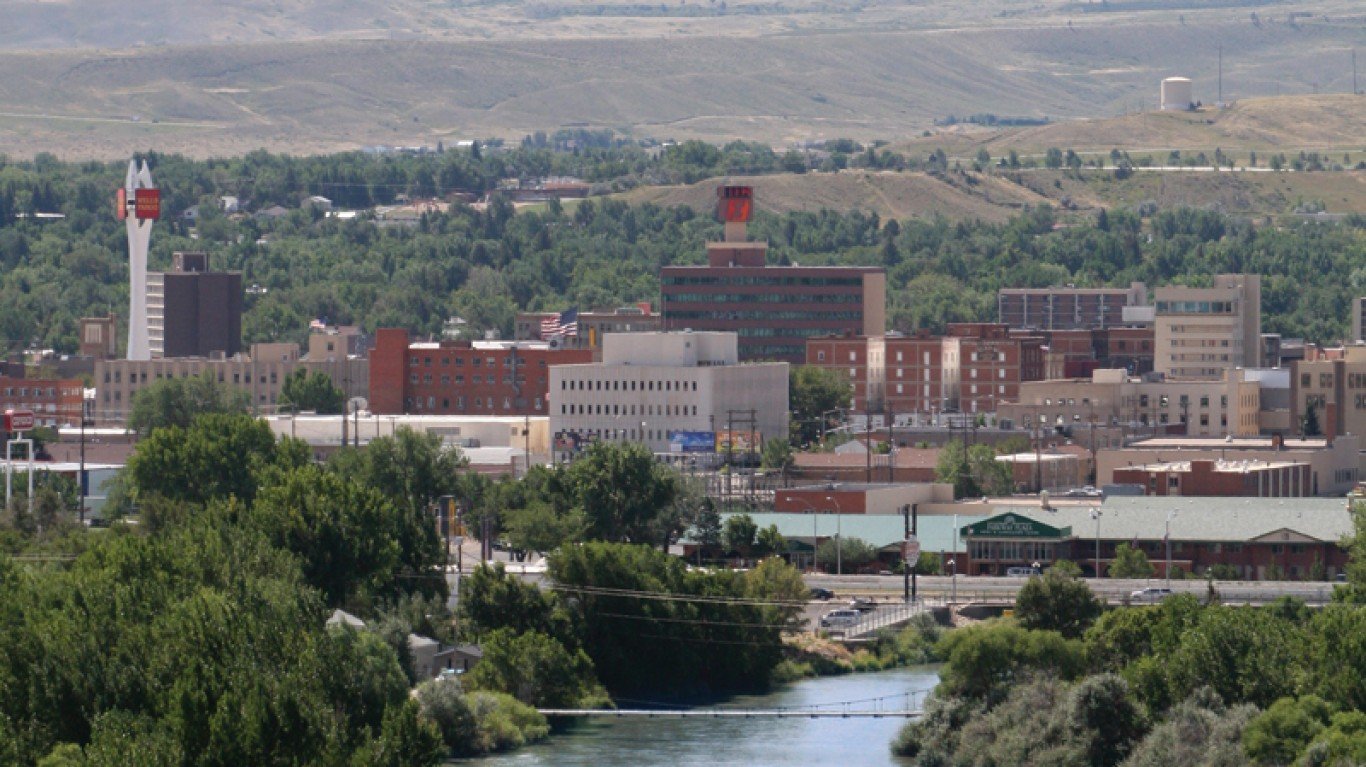
Source: Public Domain / Wikimedia Commons
22. Casper, WY
> 5 yr. employment change: -10.6% (-4,249 jobs)
> August 2020 unemployment rate: 10.2%
> Median household income: $65,034
> Poverty rate: 8.6%
> 2019 population (pct. change from 2015): 79,858 (-2.8%)
Between 2015 and 2020, Casper reported job losses in nearly every employment sector, including construction, leisure and hospitality, and retail trade. Yet the sector with the largest employment decline was mining and logging, accounting for approximately 1,700 of the 4,249 jobs lost over the past five years. Wyoming is one of the top coal, oil, and gas-producing states, all of which fall under the mining and logging employment sector. A dip in prices and demand for energy has led to layoffs and site closures.

Source: benkrut / Getty Images
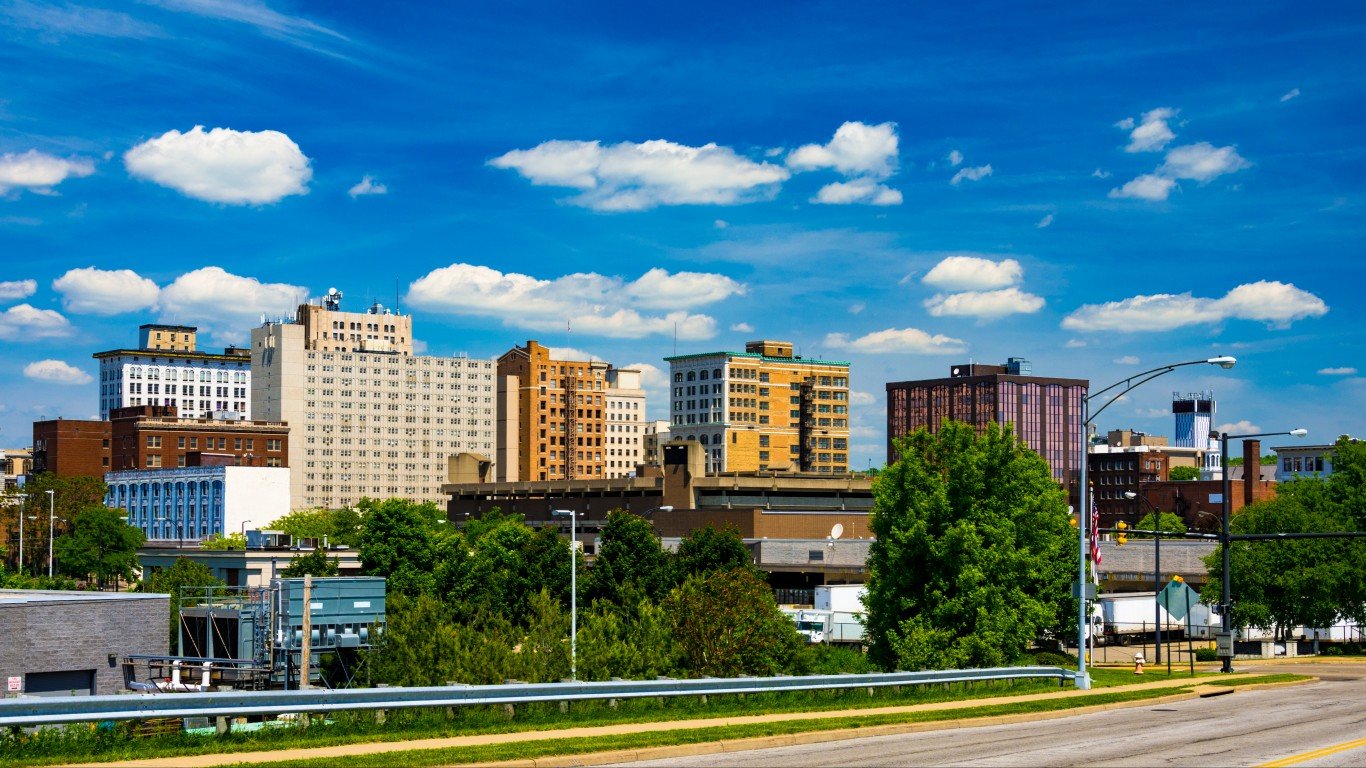
21. Peoria, IL
> 5 yr. employment change: -10.7% (-18,443 jobs)
> August 2020 unemployment rate: 9.7%
> Median household income: $60,372
> Poverty rate: 11.3%
> 2019 population (pct. change from 2015): 400,561 (-3.0%)
The employment decline brought on by COVID-19 was a continuation of a trend of declining employment in Peoria, Illinois. There were nearly 173,000 people working in the metro area in August 2015, 168,411 in August 2019, and just 154,503 in August 2020. From August 2019 to August 2020, the unemployment rate in Peoria more than doubled, from 4.5% to 9.7%. Though Peoria’s August 2020 unemployment rate is higher than the comparable national 8.4% rate, it is actually lower than the 11.0% rate in Illinois overall.
[in-text-ad-2]

Source: Sean Pavone / Getty Images
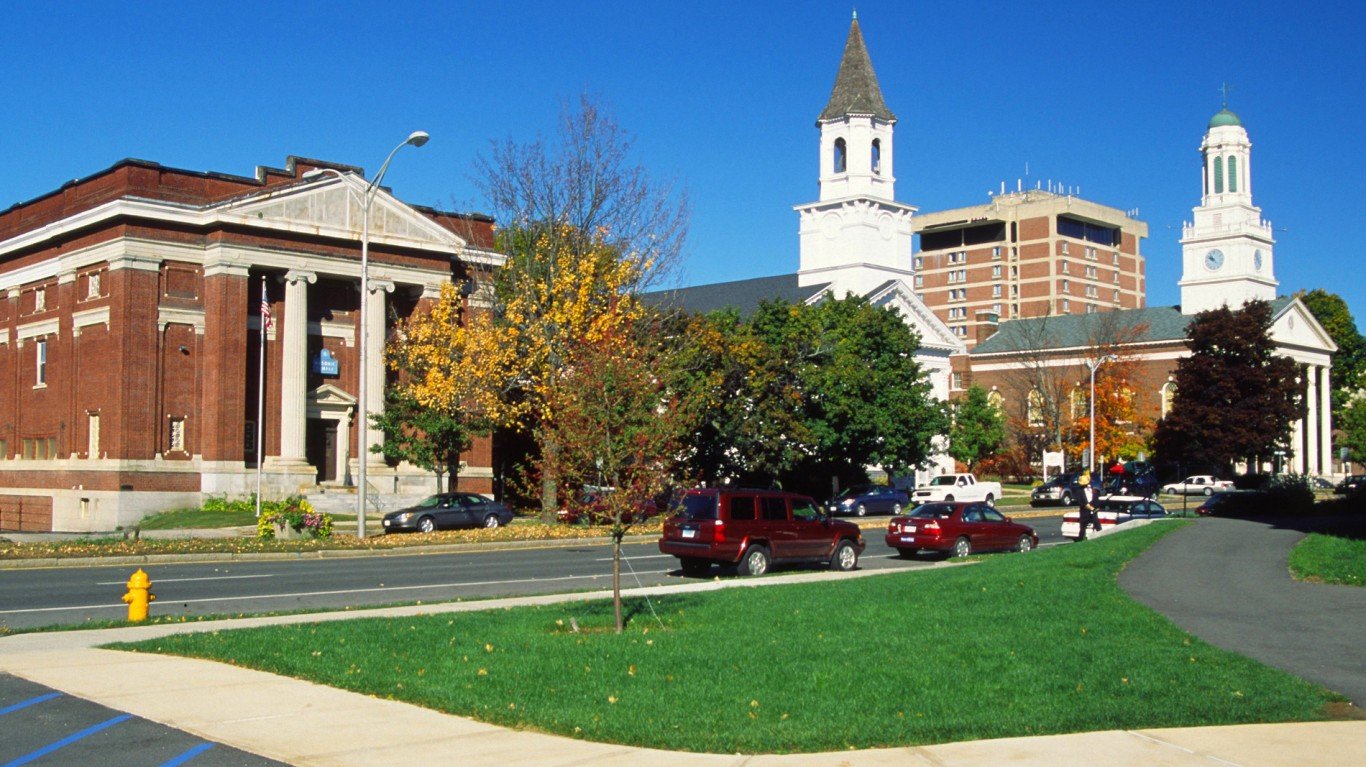
20. Springfield, MA-CT
> 5 yr. employment change: -10.7% (-36,794 jobs)
> August 2020 unemployment rate: 11.4%
> Median household income: $62,346
> Poverty rate: 12.6%
> 2019 population (pct. change from 2015): 697,382 (-0.5%)
Springfield, Massachusetts, had one of the 20 largest employment declines over the last five years of any U.S. metro area, driven by a substantial employment decline from August 2019 to August 2020. The city lost over 57,500 jobs, or 15.8% of all jobs, over the past year. At 11.4%, Springfield’s August 2020 unemployment rate is 3 percentage points higher than the national rate of 8.4%.
Source: DenisTangneyJr / iStock via Getty Images
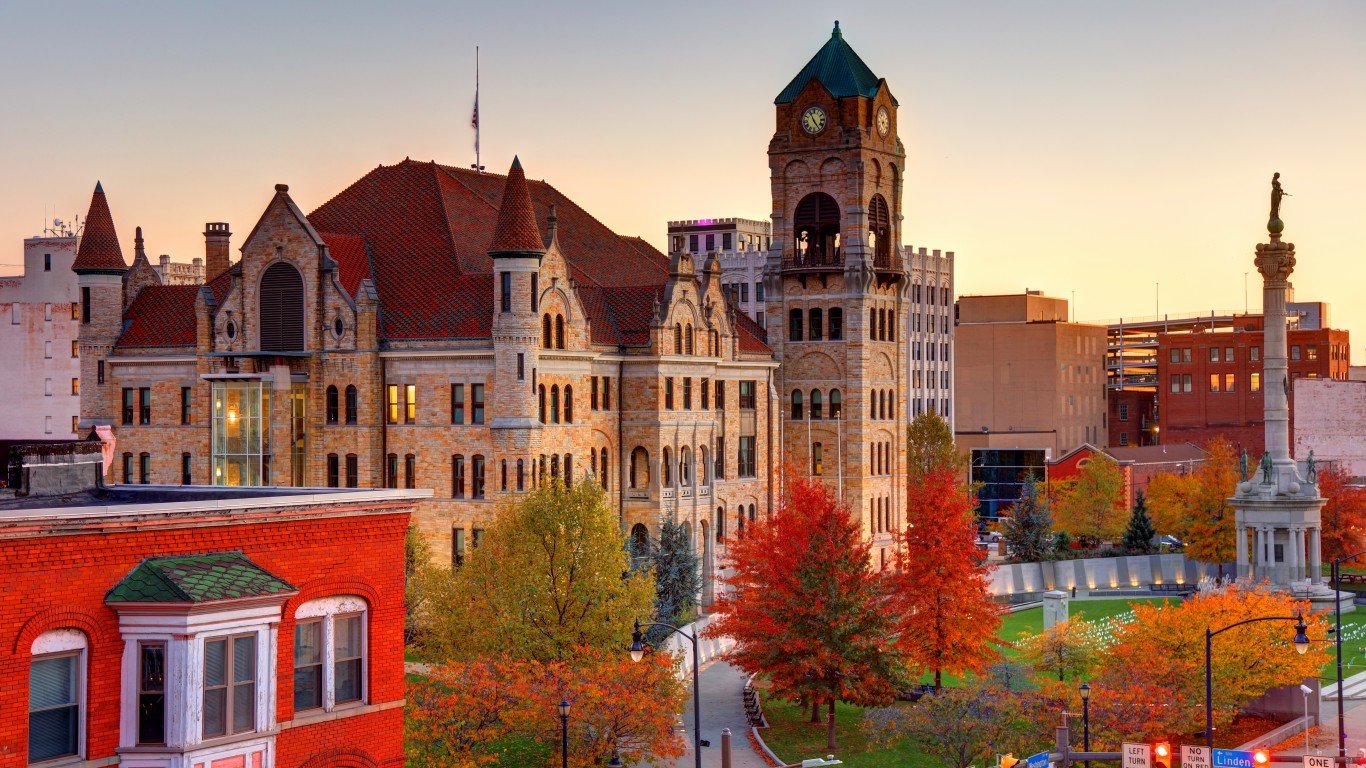
19. Scranton–Wilkes-Barre–Hazleton, PA
> 5 yr. employment change: -11.3% (-29,567 jobs)
> August 2020 unemployment rate: 11.5%
> Median household income: $54,304
> Poverty rate: 14.9%
> 2019 population (pct. change from 2015): 553,885 (-0.7%)
Over the last five years, the Scranton, Pennsylvania, area lost nearly 30,000 jobs, or 11.3% of all jobs. Every job sector for which there is data reported job losses during that time, including leisure and hospitality, business services, retail trade, manufacturing, and more. More than 30,000 workers in the Scranton area are unemployed, accounting for an unemployment rate of 11.5%, one of the 30 highest among all major U.S. cities.
[in-text-ad]
Source: renal / Getty Images
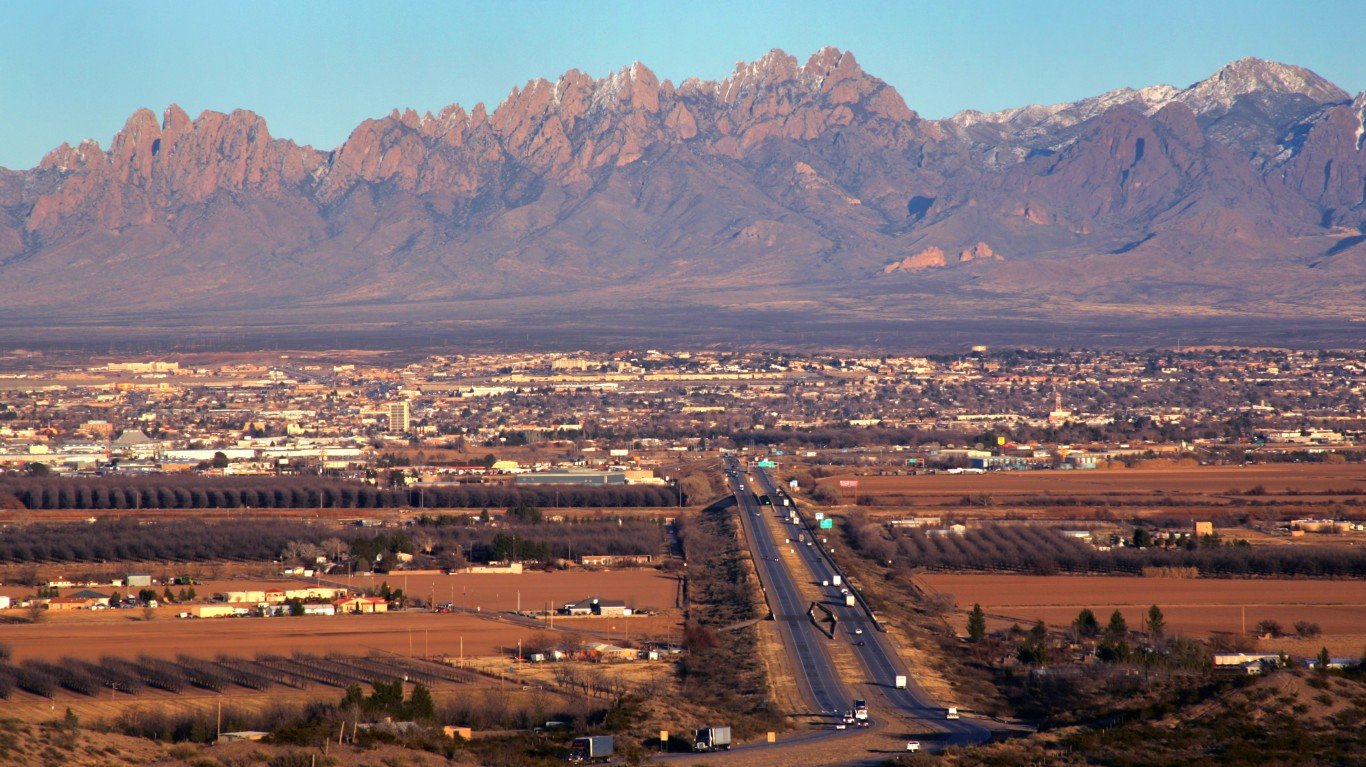
18. Las Cruces, NM
> 5 yr. employment change: -11.4% (-9,993 jobs)
> August 2020 unemployment rate: 11.3%
> Median household income: $43,038
> Poverty rate: 25.9%
> 2019 population (pct. change from 2015): 218,195 (1.9%)
Las Cruces is one of three major New Mexico cities that have lost the most jobs in the past five years. From August 2015 to August 2020, the city lost nearly 10,000 jobs, or 11.4% of total employment. The metro area’s August 2020 unemployment rate of 11.3% was well beyond the 8.4% national rate. Though it lost thousands of jobs across the leisure and hospitality, retail trade, and government sectors, Las Cruces actually added some jobs in manufacturing and wholesale trade.

Source: Ed-Ni-Photo / iStock via Getty Images
17. Santa Cruz-Watsonville, CA
> 5 yr. employment change: -11.9% (-15,766 jobs)
> August 2020 unemployment rate: 9.8%
> Median household income: $89,269
> Poverty rate: 10.1%
> 2019 population (pct. change from 2015): 273,213 (-0.1%)
The Santa Cruz metro area on the coast of Central California lost nearly 19,000 jobs from August 2019 to August 2020, erasing the job market gains of the four years prior. Though the metro area’s August 2020 unemployment rate of 9.8% is higher than the national rate of 8.4%, it is better than California’s August 2020 unemployment rate of 11.4%.

Source: oddharmonic / Flickr
16. Goldsboro, NC
> 5 yr. employment change: -12.8% (-6,467 jobs)
> August 2020 unemployment rate: 6.2%
> Median household income: $44,596
> Poverty rate: 19.4%
> 2019 population (pct. change from 2015): 123,131 (-1.0%)
Unlike nearly every other city on this list, Goldsboro, North Carolina, has a relatively low unemployment rate, at 6.2%. Nationwide, the unemployment rate is 8.4%, and in North Carolina it is 6.5%. Yet Goldsboro is still one of just 16 metro areas in which employment has declined by more than 12% over the last five years. As is often the case in the metro areas on this list, the vast majority of jobs were lost between August 2019 and August 2020, when COVID-19 led to a national unemployment crisis.
[in-text-ad-2]

Source: Art Wager / Getty Images
15. Urban Honolulu, HI
> 5 yr. employment change: -13.3% (-59,331 jobs)
> August 2020 unemployment rate: 10.5%
> Median household income: $87,470
> Poverty rate: 8.1%
> 2019 population (pct. change from 2015): 974,563 (-1.7%)
Honolulu is one of two Hawaiian cities with employment declines of more than 10% over the past five years. The metro area lost more than 59,000 jobs — most of them in the leisure and hospitality sector. Honolulu had a very low unemployment rate ahead of the pandemic, at 2.6% in August 2019. A year later, the jobless rate had spiked to 10.5%, higher than the U.S. unemployment rate by 2.1 percentage points.

Source: Joecho-16 / iStock via Getty Images
14. Atlantic City-Hammonton, NJ
> 5 yr. employment change: -13.5% (-15,277 jobs)
> August 2020 unemployment rate: 18.5%
> Median household income: $63,389
> Poverty rate: 11.1%
> 2019 population (pct. change from 2015): 263,670 (-2.4%)
Atlantic City is well known for its hotels and casinos. As these amenities were shut down because of the COVID-19 pandemic, more than 11,000 area workers lost their jobs in the leisure and hospitality sector, the majority of the 15,277 jobs shed in the area in the last five years. Atlantic city has been slow to recover — the metro area’s August 2020 unemployment rate is 18.5%, the third highest rate of any U.S. metro area and more than double the national unemployment rate for the month.
[in-text-ad]
Source: Davel5957 / Getty Images
13. Youngstown-Warren-Boardman, OH-PA
> 5 yr. employment change: -13.7% (-32,283 jobs)
> August 2020 unemployment rate: 11.1%
> Median household income: $48,558
> Poverty rate: 16.2%
> 2019 population (pct. change from 2015): 536,081 (-2.3%)
The Youngstown metro area along the Ohio-Pennsylvania border lost over 22,000 jobs from August 2019 to August 2020, or nearly 10% of its total employment. Yet the metro area has already been losing jobs, shedding more than 10,000 jobs from August 2015 to August 2019. In all, employment was down 13.7% over the past five years. Most metro areas on this list lost the most jobs in leisure and hospitality over the last half decade. But for this Rust Belt city, manufacturing has been hit the hardest. The Youngstown metro area has also lost thousands of jobs in retail trade, health care, and several other sectors.

Source: DenisTangneyJr / Getty Images
12. Santa Fe, NM
> 5 yr. employment change: -14.2% (-9,860 jobs)
> August 2020 unemployment rate: 11.4%
> Median household income: $61,298
> Poverty rate: 13.0%
> 2019 population (pct. change from 2015): 150,358 (1.5%)
As of August 2020, Santa Fe, New Mexico, had nearly 10,000 fewer jobs than it had five years prior. Though the area added thousands of jobs from 2015 to 2019, it lost 13,000 from August 2019 to August 2020, or 18% of all jobs — the fifth highest share of any city. The most affected sector in Santa Fe was leisure and hospitality, though the area’s job market also lost over 1,500 jobs in the government and retail trade sectors over the past five years.
Source: Jupiterimages / Getty Images
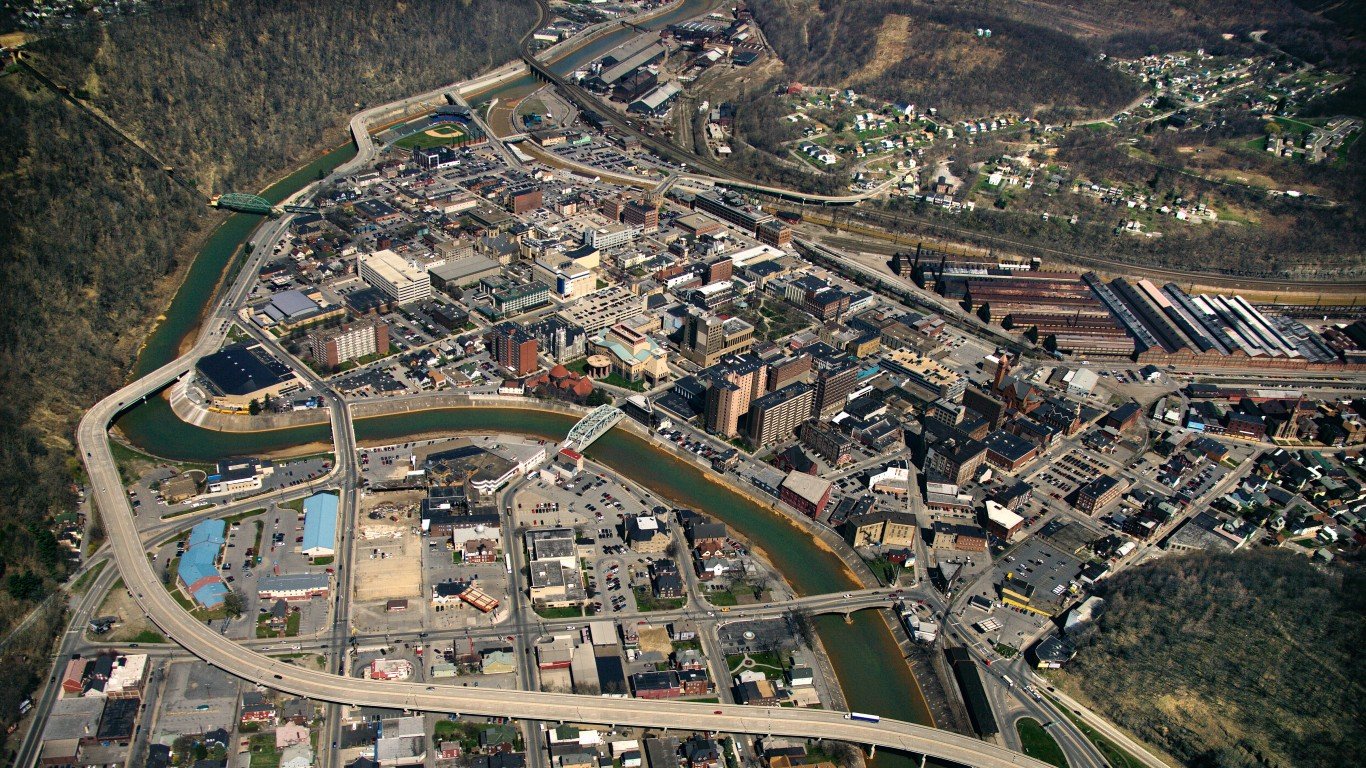
11. Johnstown, PA
> 5 yr. employment change: -14.6% (-8,485 jobs)
> August 2020 unemployment rate: 10.1%
> Median household income: $49,076
> Poverty rate: 15.3%
> 2019 population (pct. change from 2015): 130,192 (-4.3%)
Of the nearly 8,500 jobs lost in Johnstown, Pennsylvania, over the last five years, over 3,000 were lost from August 2015 through August 2019, indicating the area’s economy was in decline before COVID-19 hit. Of the cities that have lost the most jobs over the last five years, Johnstown is the only one in which the business services sector lost more jobs than any other sector.
[in-text-ad-2]

Source: Kiddo27 / Wikimedia Commons
10. Enid, OK
> 5 yr. employment change: -14.7% (-4,255 jobs)
> August 2020 unemployment rate: 5.3%
> Median household income: $64,929
> Poverty rate: 10.1%
> 2019 population (pct. change from 2015): 61,056 (-3.5%)
Employment in Enid, Oklahoma, declined by 14.7% over the last five years, the 10th highest decline of U.S. metro areas. Unlike most of the cities on this list, the bulk of the jobs lost in Enid were lost from 2015 to 2019 — before the COVID-19 pandemic. And during the pandemic, it seems the city has not suffered as much as most U.S. cities. In fact, the city’s unemployment rate increased by just 2.3 percentage points from August 2019 to August 2020 to 5.3%. Nationwide, the unemployment rate increased by 3.3 percentage points over that time to 8.4%.
Source: zrfphoto / Getty Images
9. Erie, PA
> 5 yr. employment change: -14.9% (-18,952 jobs)
> August 2020 unemployment rate: 11.2%
> Median household income: $51,818
> Poverty rate: 17.4%
> 2019 population (pct. change from 2015): 269,728 (-3.0%)
Though the majority of the Erie, Pennsylvania metro area’s nearly 19,000 jobs shed in the last half decade were lost amid the COVID-19 pandemic, the city’s job market was in decline for years. The manufacturing, retail trade, and professional services sectors in Erie each lost thousands of jobs over the past five years.
The city’s population declined by 3.0% from 2015 to 2019 as employment declined. Erie’s median household income of $51,818 is nearly $14,000 lower than the national median.
[in-text-ad]
Source: DenisTangneyJr / Getty Images
8. Pittsfield, MA
> 5 yr. employment change: -15.5% (-6,328 jobs)
> August 2020 unemployment rate: 12.6%
> Median household income: $58,895
> Poverty rate: 10.8%
> 2019 population (pct. change from 2015): 124,944 (-2.3%)
Pittsfield is one of just eight cities in which employment fell by more than 15% over the last five years. The metro area lost nearly 7,000 jobs from August 2019 through August 2020, wiping out modest gains of a few hundred jobs from the previous four years. Pittsfield, on the western edge of the state, now has a 12.6% unemployment rate, the 13th highest of nearly 400 U.S. metropolitan areas.

Source: Doug Kerr / Flickr
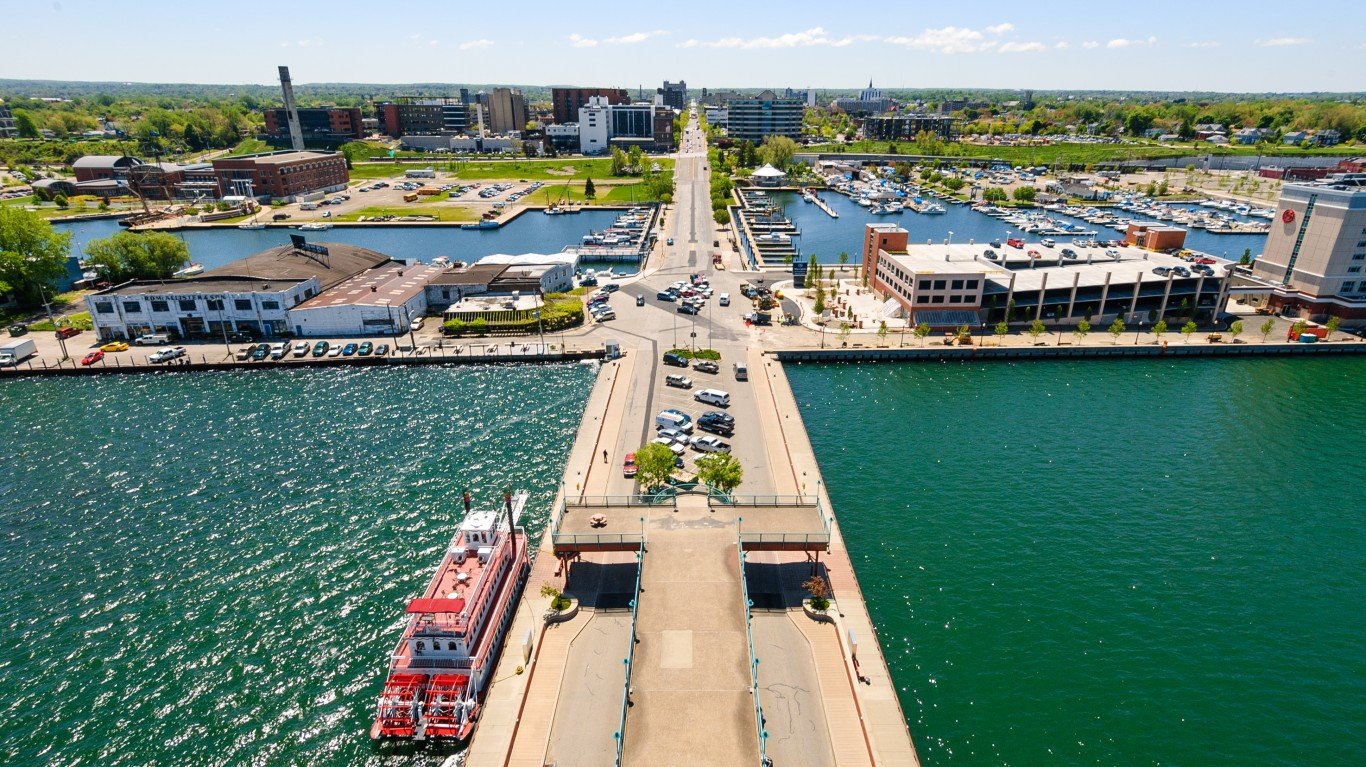
7. Watertown-Fort Drum, NY
> 5 yr. employment change: -15.6% (-6,797 jobs)
> August 2020 unemployment rate: 10.6%
> Median household income: $53,917
> Poverty rate: 15.5%
> 2019 population (pct. change from 2015): 109,834 (-5.6%)
The Watertown area in northern New York lost nearly 6,800 jobs over the last five years, an employment decline of 15.6%. Though much of this decline is at least partially attributable to the COVID-19 pandemic, employment declined from 2015 through 2019 as well.
As jobs declined, so did the population of the Watertown metro area. Even before the pandemic, the area’s population declined by over 6,500, or 5.6%, from 2015 to 2019 — the second largest percentage decline of any metro area during that time.

Source: OlegAlbinsky / iStock via Getty Images
6. Barnstable Town, MA
> 5 yr. employment change: -16.5% (-19,114 jobs)
> August 2020 unemployment rate: 12.5%
> Median household income: $85,042
> Poverty rate: 5.2%
> 2019 population (pct. change from 2015): 212,990 (-0.4%)
The Barnstable Town metro area, which makes up the entirety of Cape Cod, is one of three Massachusetts metro areas with large employment increases over the past five years. From August 2019 to August 2020, the metropolitan area shed over 26,000 jobs, wiping out the over 7,000 jobs the city added from August 2015 to August 2019. As travel nearly ground to a halt during the pandemic, leisure and hospitality workers were hit the hardest nationwide, and the metro area was no exception. Metro area employment in this sector fell by 8,600 over the past five years, a larger decline than in any other sector.
[in-text-ad-2]

Source: Kirkikis / iStock
5. Williamsport, PA
> 5 yr. employment change: -18.1% (-10,338 jobs)
> August 2020 unemployment rate: 10.4%
> Median household income: $53,881
> Poverty rate: 14.0%
> 2019 population (pct. change from 2015): 113,299 (-2.0%)
Employment in Williamsport, Pennsylvania declined 18.1% from August 2015 to August 2020, as the city lost over 10,000 jobs. Like the vast majority of other cities in the country, Williamsport lost many jobs in the last year amid the COVID-19 pandemic, but its job market was in decline in the four years before that as well. As was the case nationwide, the leisure and hospitality sector contributed the most to overall job losses in the Williamsport metro area.
Source: AllenS / Wikimedia Commons
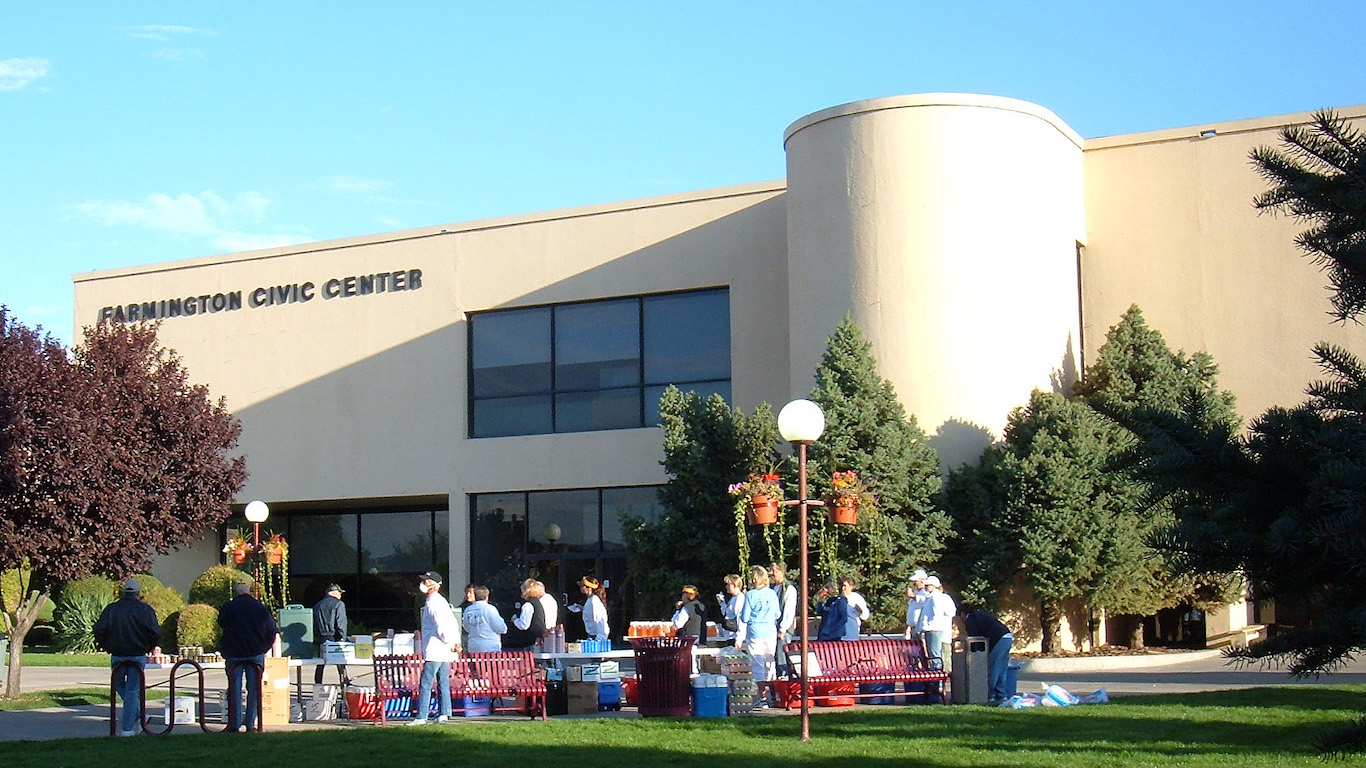
4. Farmington, NM
> 5 yr. employment change: -18.6% (-9,615 jobs)
> August 2020 unemployment rate: 13.1%
> Median household income: $44,321
> Poverty rate: 21.2%
> 2019 population (pct. change from 2015): 123,958 (-3.3%)
Farmington, New Mexico, has one of the 10 highest August 2020 unemployment rates among U.S. metro areas, at 13.1%. This is partly the result of the 9,615 jobs lost over the past five years. Though the majority of these jobs were lost over the past year amid the COVID-19 pandemic, the Farmington economy was struggling ahead of the pandemic.
From 2010- to 2019, over 10% of the population moved away. In 2019, Farmington’s median household income of $44,321 was over $21,000 lower than the U.S. median, and its poverty rate of 21.2% was one of the highest in the country.
[in-text-ad]

Source: Solidago / Getty Images
3. Salinas, CA
> 5 yr. employment change: -19.0% (-38,209 jobs)
> August 2020 unemployment rate: 12.1%
> Median household income: $77,514
> Poverty rate: 12.7%
> 2019 population (pct. change from 2015): 434,061 (0.8%)
There were over 38,000 fewer people working in Salinas, California, in August 2020 compared to August 2015, a 19% decline in employment. From August 2015 through August 2019, the city added nearly 7,000 jobs, but in the year after, amid the COVID-19 pandemic, the metro area lost more than 45,000 jobs.
Salinas, about 60 miles South of San Jose, reported an August 2020 unemployment rate of 12.1%, well above the 8.4% national rate, and slightly above California’s 11.4% unemployment rate for that month.
 24/7 Wall St.
Source: 7Michael / iStock / Getty Images Plus
2. Kahului-Wailuku-Lahaina, HI
> 5 yr. employment change: -22.7% (-18,700 jobs)
> August 2020 unemployment rate: 21.0%
> Median household income: $80,754
> Poverty rate: 11.9%
> 2019 population (pct. change from 2015): 167,417 (2.1%)
The Kahului-Wailuku-Lahaina metro area of Hawaii, on the island of Maui, is one of just two American metro areas that have experienced employment declines of over 20% over the past five years. Like many of the other cities on this list, the impact of the pandemic has had a devastating effect on the Kahului area’s leisure and hospitality sector. There were 16,000 fewer people working in that sector in August 2020 than there were five years prior, accounting for the vast majority of the lost jobs. As of August 2020, the Kahului area had the nation’s highest unemployment rate, at 21.0%. The U.S. unemployment rate for that month was 8.4%.

Source: Vladone / Getty Images
1. Ocean City, NJ
> 5 yr. employment change: -26.5% (-11,298 jobs)
> August 2020 unemployment rate: 17.7%
> Median household income: $69,980
> Poverty rate: 8.8%
> 2019 population (pct. change from 2015): 92,039 (-2.3%)
Ocean City, New Jersey, is the only metro area in America in which employment declined by more than 25% from 2015 to 2020. There were 31,284 workers in the metro area in August 2020, down over 11,000 workers from five years prior. The city, known for its boardwalk along the Atlantic Ocean, relies on the tourism industry, which was all but shut down in the earlier months of the pandemic. Ocean City’s August 2020 unemployment rate is 17.7% — more than double the national 8.4% unemployment rate.
Methodology:
To identify the American cities losing the most jobs, 24/7 Wall St. ranked U.S. metropolitan statistical areas by the percent decline in total employment over the five years from August 2015 to August 2020.
Employment (the number of people employed), the total size of the labor force (those working and looking for work), and the number of unemployed workers are all from the Bureau of Labor Statistics. The unemployment rate is also from the BLS and is as of August 2020. Employment by industry at the super sector level is also from the BLS, and five-year changes were calculated from August 2015 to August 2020. Population figures are from the U.S. Census Bureau’s American Community Survey and are through 2019. Median household income is for 2019 and is also from the ACS.
Take This Retirement Quiz To Get Matched With A Financial Advisor (Sponsored)
Take the quiz below to get matched with a financial advisor today.
Each advisor has been vetted by SmartAsset and is held to a fiduciary standard to act in your best interests.
Here’s how it works:
1. Answer SmartAsset advisor match quiz
2. Review your pre-screened matches at your leisure. Check out the
advisors’ profiles.
3. Speak with advisors at no cost to you. Have an introductory call on the phone or introduction in person and choose whom to work with in the future
Take the retirement quiz right here.
Thank you for reading! Have some feedback for us?
Contact the 24/7 Wall St. editorial team.
Editors' Picks