
Over 8.3 million COVID-19 infections have been reported in the United States since the pandemic first reached the country, equivalent to more than one in every 50 Americans. More than 220,000 Americans have died from the virus, and with many states showing a recent surge, many speculate this figure could get much higher before a vaccine is finally developed and widely distributed across the country.
The extent of the spread of the novel coronavirus continues to vary considerably from state to state, and even from county to county. Even as the number of daily new cases is flattening or even declining in some parts of the country, new cases are surging at a growing rate in others.
After hitting a several-month daily low of just 22,000 new cases on Sept. 8, the number of new daily cases across the country has been on the rise, with more than 50,000 cases reported daily for a week straight. Most states have reported a rise in daily new cases in the past week, and all but one state has at least one county in which cases have been reported at a growing rate.
Using data from state and local health departments, 24/7 Wall St. compiled and reviewed the average of daily new confirmed COVID-19 cases for the week ending Oct. 20 and compared it to the previous week to determine the county in each state where the virus is spreading the fastest, adjusted for the population. We excluded counties with populations of fewer than 5,000 people, as well as those with fewer than 20 reported new cases in the past 14 days. Because up-to-date data was not available for Missouri, that state was excluded from our list.
Other than Missouri, there is only one state — Hawaii — that did not have at least one county or county equivalent with a week-over-week increase in COVID-19 cases.
However, while all counties on the list are those where the virus is spreading the fastest in their respective states, the virus is spreading much faster in some of them compared to others. For instance, in eight states, the county where COVID-19 is growing fastest recorded an increase of over 50 average daily new cases per 100,000 residents in the week ending Oct. 20 as compared to the week ending Oct. 13. Nationwide, for comparison, the average daily new cases increased by 2.3 cases, from 14.6 per 100,000 to 16.9 per 100,000 in those weeks.
Conversely, in 11 states, no county recorded an increase of more than 10 average daily new cases per 100,000 residents week-over-week. The majority of these states are on the West Coast or in the Northeast. Unsurprisingly, many of these states had among the lowest average daily new cases per 100,000 residents in the past week. These are the states where the spread of the virus is slowing, and where it is getting worse.
Click here to see the counties in every state where COVID 19 is growing the fastest right now.

Alabama: Pickens County
> Change in daily avg. new COVID-19 cases, week over week: +26.1 per 100,000 people
> Avg. new daily cases in Pickens County in 7 days ending Oct. 20: 48.6 per 100,000
> Avg. new daily cases in Pickens County in 7 days ending Oct. 13: 22.4 per 100,000
> Avg. new daily cases in Alabama in 7 days ending Oct. 20: 21 per 100,000 (22nd most)
> Cumulative confirmed COVID-19 cases in Pickens County as of Oct. 20: 3,966 per 100,000 people (total: 805)
> Population: 20,298
> Largest place in Pickens County: Aliceville
[in-text-ad]

Source: marco antonio torres / Wikimedia Commons
Alaska: Bethel Census Area
> Change in daily avg. new COVID-19 cases, week over week: +16.1 per 100,000 people
> Avg. new daily cases in Bethel Census Area in 7 days ending Oct. 20: 53.5 per 100,000
> Avg. new daily cases in Bethel Census Area in 7 days ending Oct. 13: 37.4 per 100,000
> Avg. new daily cases in Alaska in 7 days ending Oct. 20: 26 per 100,000 (14th most)
> Cumulative confirmed COVID-19 cases in Bethel Census Area as of Oct. 20: 1,524 per 100,000 people (total: 275)
> Population: 18,040
> Largest place in Bethel Census Area: Bethel
 24/7 Wall St.
Source: Norm Lane / iStock via Getty Images
Arizona: Gila County
> Change in daily avg. new COVID-19 cases, week over week: +28.0 per 100,000 people
> Avg. new daily cases in Gila County in 7 days ending Oct. 20: 51.4 per 100,000
> Avg. new daily cases in Gila County in 7 days ending Oct. 13: 23.4 per 100,000
> Avg. new daily cases in Arizona in 7 days ending Oct. 20: 11 per 100,000 (15th fewest)
> Cumulative confirmed COVID-19 cases in Gila County as of Oct. 20: 3,318 per 100,000 people (total: 1,772)
> Population: 53,400
> Largest place in Gila County: Payson

Arkansas: Lawrence County
> Change in daily avg. new COVID-19 cases, week over week: +43.0 per 100,000 people
> Avg. new daily cases in Lawrence County in 7 days ending Oct. 20: 128.7 per 100,000
> Avg. new daily cases in Lawrence County in 7 days ending Oct. 13: 85.7 per 100,000
> Avg. new daily cases in Arkansas in 7 days ending Oct. 20: 30 per 100,000 (11th most)
> Cumulative confirmed COVID-19 cases in Lawrence County as of Oct. 20: 4,907 per 100,000 people (total: 818)
> Population: 16,669
> Largest place in Lawrence County: Walnut Ridge
[in-text-ad-2]

Source: DenisTangneyJr / Getty Images
California: Fresno County
> Change in daily avg. new COVID-19 cases, week over week: +3.6 per 100,000 people
> Avg. new daily cases in Fresno County in 7 days ending Oct. 20: 8.8 per 100,000
> Avg. new daily cases in Fresno County in 7 days ending Oct. 13: 5.2 per 100,000
> Avg. new daily cases in California in 7 days ending Oct. 20: 8 per 100,000 (6th fewest)
> Cumulative confirmed COVID-19 cases in Fresno County as of Oct. 20: 3,083 per 100,000 people (total: 30,152)
> Population: 978,130
> Largest place in Fresno County: Fresno

Colorado: Fremont County
> Change in daily avg. new COVID-19 cases, week over week: +54.8 per 100,000 people
> Avg. new daily cases in Fremont County in 7 days ending Oct. 20: 62.3 per 100,000
> Avg. new daily cases in Fremont County in 7 days ending Oct. 13: 7.5 per 100,000
> Avg. new daily cases in Colorado in 7 days ending Oct. 20: 17 per 100,000 (24th fewest)
> Cumulative confirmed COVID-19 cases in Fremont County as of Oct. 20: 1,140 per 100,000 people (total: 536)
> Population: 47,002
> Largest place in Fremont County: Cañon City
[in-text-ad]

Source: Alexander Farnsworth / iStock Editorial via Getty Images
Connecticut: Litchfield County
> Change in daily avg. new COVID-19 cases, week over week: +3.5 per 100,000 people
> Avg. new daily cases in Litchfield County in 7 days ending Oct. 20: 5.5 per 100,000
> Avg. new daily cases in Litchfield County in 7 days ending Oct. 13: 2.0 per 100,000
> Avg. new daily cases in Connecticut in 7 days ending Oct. 20: 11 per 100,000 (12th fewest)
> Cumulative confirmed COVID-19 cases in Litchfield County as of Oct. 20: 1,121 per 100,000 people (total: 2,051)
> Population: 183,031
> Largest place in Litchfield County: Torrington
 24/7 Wall St.
Source: aimintang / Getty Images
Delaware: Sussex County
> Change in daily avg. new COVID-19 cases, week over week: +2.0 per 100,000 people
> Avg. new daily cases in Sussex County in 7 days ending Oct. 20: 18.0 per 100,000
> Avg. new daily cases in Sussex County in 7 days ending Oct. 13: 16.1 per 100,000
> Avg. new daily cases in Delaware in 7 days ending Oct. 20: 14 per 100,000 (19th fewest)
> Cumulative confirmed COVID-19 cases in Sussex County as of Oct. 20: 3,459 per 100,000 people (total: 7,593)
> Population: 219,540
> Largest place in Sussex County: Seaford

Source: Ebyabe / Wikimedia Commons
Florida: Union County
> Change in daily avg. new COVID-19 cases, week over week: +15.0 per 100,000 people
> Avg. new daily cases in Union County in 7 days ending Oct. 20: 45.9 per 100,000
> Avg. new daily cases in Union County in 7 days ending Oct. 13: 30.9 per 100,000
> Avg. new daily cases in Florida in 7 days ending Oct. 20: 14 per 100,000 (18th fewest)
> Cumulative confirmed COVID-19 cases in Union County as of Oct. 20: 7,126 per 100,000 people (total: 1,086)
> Population: 15,239
> Largest place in Union County: Lake Butler
[in-text-ad-2]

Source: J. Stephen Conn / Flickr
Georgia: Dodge County
> Change in daily avg. new COVID-19 cases, week over week: +30.3 per 100,000 people
> Avg. new daily cases in Dodge County in 7 days ending Oct. 20: 41.6 per 100,000
> Avg. new daily cases in Dodge County in 7 days ending Oct. 13: 11.2 per 100,000
> Avg. new daily cases in Georgia in 7 days ending Oct. 20: 12 per 100,000 (16th fewest)
> Cumulative confirmed COVID-19 cases in Dodge County as of Oct. 20: 2,534 per 100,000 people (total: 530)
> Population: 20,919
> Largest place in Dodge County: Eastman

Source: Adam-Springer / Getty Images
Hawaii: no county with increase
> Avg. new daily cases in Hawaii in 7 days ending Oct. 20: 6 per 100,000 (4th fewest)
[in-text-ad]

Idaho: Caribou County
> Change in daily avg. new COVID-19 cases, week over week: +52.2 per 100,000 people
> Avg. new daily cases in Caribou County in 7 days ending Oct. 20: 83.8 per 100,000
> Avg. new daily cases in Caribou County in 7 days ending Oct. 13: 31.6 per 100,000
> Avg. new daily cases in Idaho in 7 days ending Oct. 20: 39 per 100,000 (7th most)
> Cumulative confirmed COVID-19 cases in Caribou County as of Oct. 20: 3,079 per 100,000 people (total: 213)
> Population: 6,918
> Largest place in Caribou County: Soda Springs
 24/7 Wall St.
Source: 129679309@N05 / Flickr
Illinois: Douglas County
> Change in daily avg. new COVID-19 cases, week over week: +63.7 per 100,000 people
> Avg. new daily cases in Douglas County in 7 days ending Oct. 20: 90.1 per 100,000
> Avg. new daily cases in Douglas County in 7 days ending Oct. 13: 26.4 per 100,000
> Avg. new daily cases in Illinois in 7 days ending Oct. 20: 26 per 100,000 (15th most)
> Cumulative confirmed COVID-19 cases in Douglas County as of Oct. 20: 2,856 per 100,000 people (total: 563)
> Population: 19,714
> Largest place in Douglas County: Tuscola

Indiana: Ohio County
> Change in daily avg. new COVID-19 cases, week over week: +48.2 per 100,000 people
> Avg. new daily cases in Ohio County in 7 days ending Oct. 20: 61.4 per 100,000
> Avg. new daily cases in Ohio County in 7 days ending Oct. 13: 13.2 per 100,000
> Avg. new daily cases in Indiana in 7 days ending Oct. 20: 26 per 100,000 (16th most)
> Cumulative confirmed COVID-19 cases in Ohio County as of Oct. 20: 2,072 per 100,000 people (total: 122)
> Population: 5,887
> Largest place in Ohio County: Rising Sun
[in-text-ad-2]

Iowa: Monroe County
> Change in daily avg. new COVID-19 cases, week over week: +40.0 per 100,000 people
> Avg. new daily cases in Monroe County in 7 days ending Oct. 20: 79.2 per 100,000
> Avg. new daily cases in Monroe County in 7 days ending Oct. 13: 39.2 per 100,000
> Avg. new daily cases in Iowa in 7 days ending Oct. 20: 34 per 100,000 (9th most)
> Cumulative confirmed COVID-19 cases in Monroe County as of Oct. 20: 3,065 per 100,000 people (total: 241)
> Population: 7,863
> Largest place in Monroe County: Albia

Source: Smallbones / Wikimedia Commons
Kansas: Norton County
> Change in daily avg. new COVID-19 cases, week over week: +73.3 per 100,000 people
> Avg. new daily cases in Norton County in 7 days ending Oct. 20: 285.3 per 100,000
> Avg. new daily cases in Norton County in 7 days ending Oct. 13: 212.0 per 100,000
> Avg. new daily cases in Kansas in 7 days ending Oct. 20: 25 per 100,000 (18th most)
> Cumulative confirmed COVID-19 cases in Norton County as of Oct. 20: 6,125 per 100,000 people (total: 336)
> Population: 5,486
> Largest place in Norton County: Norton
[in-text-ad]

Source: BOB WESTON / Getty Images
Kentucky: Lee County
> Change in daily avg. new COVID-19 cases, week over week: +33.9 per 100,000 people
> Avg. new daily cases in Lee County in 7 days ending Oct. 20: 36.0 per 100,000
> Avg. new daily cases in Lee County in 7 days ending Oct. 13: 2.1 per 100,000
> Avg. new daily cases in Kentucky in 7 days ending Oct. 20: 23 per 100,000 (21st most)
> Cumulative confirmed COVID-19 cases in Lee County as of Oct. 20: 681 per 100,000 people (total: 46)
> Population: 6,751
> Largest place in Lee County: Beattyville
 24/7 Wall St.
Source: Billy Hathorn / Wikimedia Commons
Louisiana: Red River Parish
> Change in daily avg. new COVID-19 cases, week over week: +18.7 per 100,000 people
> Avg. new daily cases in Red River Parish in 7 days ending Oct. 20: 30.8 per 100,000
> Avg. new daily cases in Red River Parish in 7 days ending Oct. 13: 12.1 per 100,000
> Avg. new daily cases in Louisiana in 7 days ending Oct. 20: 11 per 100,000 (14th fewest)
> Cumulative confirmed COVID-19 cases in Red River Parish as of Oct. 20: 4,676 per 100,000 people (total: 403)
> Population: 8,618
> Largest place in Red River Parish: Coushatta

Maine: Waldo County
> Change in daily avg. new COVID-19 cases, week over week: +8.1 per 100,000 people
> Avg. new daily cases in Waldo County in 7 days ending Oct. 20: 9.0 per 100,000
> Avg. new daily cases in Waldo County in 7 days ending Oct. 13: .9 per 100,000
> Avg. new daily cases in Maine in 7 days ending Oct. 20: 2 per 100,000 (2nd fewest)
> Cumulative confirmed COVID-19 cases in Waldo County as of Oct. 20: 322 per 100,000 people (total: 127)
> Population: 39,418
> Largest place in Waldo County: Belfast
[in-text-ad-2]

Source: drnadig / iStock via Getty Images
Maryland: Dorchester County
> Change in daily avg. new COVID-19 cases, week over week: +9.4 per 100,000 people
> Avg. new daily cases in Dorchester County in 7 days ending Oct. 20: 19.6 per 100,000
> Avg. new daily cases in Dorchester County in 7 days ending Oct. 13: 10.2 per 100,000
> Avg. new daily cases in Maryland in 7 days ending Oct. 20: 10 per 100,000 (10th fewest)
> Cumulative confirmed COVID-19 cases in Dorchester County as of Oct. 20: 2,204 per 100,000 people (total: 711)
> Population: 32,261
> Largest place in Dorchester County: Cambridge

Source: DenisTangneyJr / iStock via Getty Images
Massachusetts: Plymouth County
> Change in daily avg. new COVID-19 cases, week over week: +3.0 per 100,000 people
> Avg. new daily cases in Plymouth County in 7 days ending Oct. 20: 11.2 per 100,000
> Avg. new daily cases in Plymouth County in 7 days ending Oct. 13: 8.2 per 100,000
> Avg. new daily cases in Massachusetts in 7 days ending Oct. 20: 9 per 100,000 (9th fewest)
> Cumulative confirmed COVID-19 cases in Plymouth County as of Oct. 20: 2,106 per 100,000 people (total: 10,786)
> Population: 512,135
> Largest place in Plymouth County: Brockton
[in-text-ad]

Source: Stratosphere / Wikimedia Commons
Michigan: Gogebic County
> Change in daily avg. new COVID-19 cases, week over week: +37.1 per 100,000 people
> Avg. new daily cases in Gogebic County in 7 days ending Oct. 20: 52.0 per 100,000
> Avg. new daily cases in Gogebic County in 7 days ending Oct. 13: 15.0 per 100,000
> Avg. new daily cases in Michigan in 7 days ending Oct. 20: 16 per 100,000 (23rd fewest)
> Cumulative confirmed COVID-19 cases in Gogebic County as of Oct. 20: 1,959 per 100,000 people (total: 302)
> Population: 15,414
> Largest place in Gogebic County: Ironwood
Source: Jacob Boomsma / iStock via Getty Images
Minnesota: Rock County
> Change in daily avg. new COVID-19 cases, week over week: +42.3 per 100,000 people
> Avg. new daily cases in Rock County in 7 days ending Oct. 20: 93.7 per 100,000
> Avg. new daily cases in Rock County in 7 days ending Oct. 13: 51.4 per 100,000
> Avg. new daily cases in Minnesota in 7 days ending Oct. 20: 25 per 100,000 (17th most)
> Cumulative confirmed COVID-19 cases in Rock County as of Oct. 20: 3,198 per 100,000 people (total: 301)
> Population: 9,413
> Largest place in Rock County: Luverne

Mississippi: Carroll County
> Change in daily avg. new COVID-19 cases, week over week: +128.5 per 100,000 people
> Avg. new daily cases in Carroll County in 7 days ending Oct. 20: 141.2 per 100,000
> Avg. new daily cases in Carroll County in 7 days ending Oct. 13: 12.7 per 100,000
> Avg. new daily cases in Mississippi in 7 days ending Oct. 20: 25 per 100,000 (19th most)
> Cumulative confirmed COVID-19 cases in Carroll County as of Oct. 20: 4,571 per 100,000 people (total: 463)
> Population: 10,129
> Largest place in Carroll County: Vaiden
[in-text-ad-2]

Source: Robstutz / Wikimedia Commons
Montana: Hill County
> Change in daily avg. new COVID-19 cases, week over week: +43.9 per 100,000 people
> Avg. new daily cases in Hill County in 7 days ending Oct. 20: 148.5 per 100,000
> Avg. new daily cases in Hill County in 7 days ending Oct. 13: 104.5 per 100,000
> Avg. new daily cases in Montana in 7 days ending Oct. 20: 57 per 100,000 (3rd most)
> Cumulative confirmed COVID-19 cases in Hill County as of Oct. 20: 3,607 per 100,000 people (total: 593)
> Population: 16,439
> Largest place in Hill County: Havre

Source: Public Domain / Wikimedia Commons
Nebraska: Pierce County
> Change in daily avg. new COVID-19 cases, week over week: +44.8 per 100,000 people
> Avg. new daily cases in Pierce County in 7 days ending Oct. 20: 59.3 per 100,000
> Avg. new daily cases in Pierce County in 7 days ending Oct. 13: 14.5 per 100,000
> Avg. new daily cases in Nebraska in 7 days ending Oct. 20: 40 per 100,000 (5th most)
> Cumulative confirmed COVID-19 cases in Pierce County as of Oct. 20: 2,222 per 100,000 people (total: 159)
> Population: 7,157
> Largest place in Pierce County: Pierce
[in-text-ad]
Source: Public Domain / Wikimedia Commons
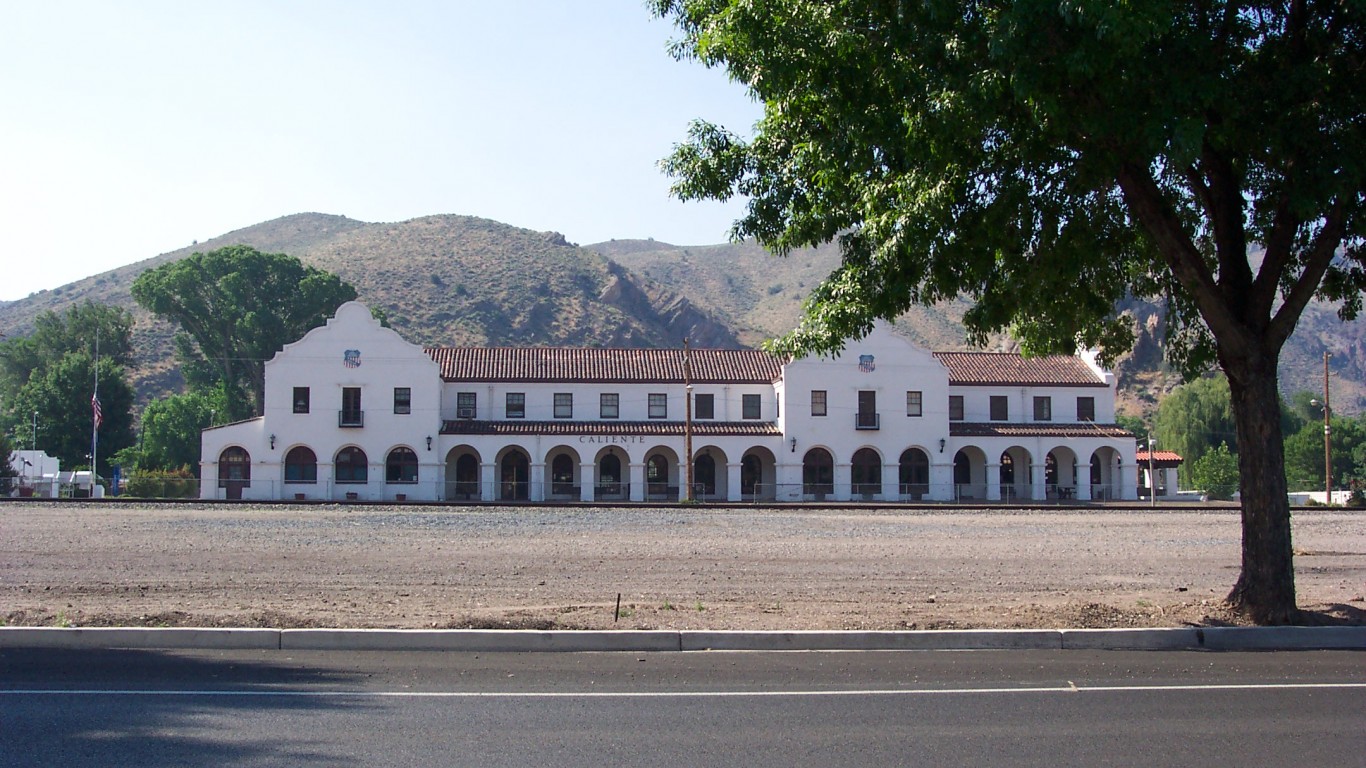
Nevada: Lincoln County
> Change in daily avg. new COVID-19 cases, week over week: +27.2 per 100,000 people
> Avg. new daily cases in Lincoln County in 7 days ending Oct. 20: 41.8 per 100,000
> Avg. new daily cases in Lincoln County in 7 days ending Oct. 13: 14.6 per 100,000
> Avg. new daily cases in Nevada in 7 days ending Oct. 20: 20 per 100,000 (24th most)
> Cumulative confirmed COVID-19 cases in Lincoln County as of Oct. 20: 696 per 100,000 people (total: 36)
> Population: 5,174
> Largest place in Lincoln County: Caliente

New Hampshire: Merrimack County
> Change in daily avg. new COVID-19 cases, week over week: +2.4 per 100,000 people
> Avg. new daily cases in Merrimack County in 7 days ending Oct. 20: 7.9 per 100,000
> Avg. new daily cases in Merrimack County in 7 days ending Oct. 13: 5.5 per 100,000
> Avg. new daily cases in New Hampshire in 7 days ending Oct. 20: 6 per 100,000 (3rd fewest)
> Cumulative confirmed COVID-19 cases in Merrimack County as of Oct. 20: 527 per 100,000 people (total: 788)
> Population: 149,452
> Largest place in Merrimack County: Concord

Source: ChrisBoswell / iStock via Getty Images
New Jersey: Essex County
> Change in daily avg. new COVID-19 cases, week over week: +4.7 per 100,000 people
> Avg. new daily cases in Essex County in 7 days ending Oct. 20: 12.3 per 100,000
> Avg. new daily cases in Essex County in 7 days ending Oct. 13: 7.6 per 100,000
> Avg. new daily cases in New Jersey in 7 days ending Oct. 20: 10 per 100,000 (11th fewest)
> Cumulative confirmed COVID-19 cases in Essex County as of Oct. 20: 2,865 per 100,000 people (total: 22,735)
> Population: 793,555
> Largest place in Essex County: Newark
[in-text-ad-2]

Source: https://www.flickr.com/photos/fredmikerudy/
New Mexico: Luna County
> Change in daily avg. new COVID-19 cases, week over week: +28.8 per 100,000 people
> Avg. new daily cases in Luna County in 7 days ending Oct. 20: 56.1 per 100,000
> Avg. new daily cases in Luna County in 7 days ending Oct. 13: 27.3 per 100,000
> Avg. new daily cases in New Mexico in 7 days ending Oct. 20: 25 per 100,000 (20th most)
> Cumulative confirmed COVID-19 cases in Luna County as of Oct. 20: 2,671 per 100,000 people (total: 648)
> Population: 24,264
> Largest place in Luna County: Deming

Source: ChrisBoswell / iStock via Getty Images
New York: Greene County
> Change in daily avg. new COVID-19 cases, week over week: +10.2 per 100,000 people
> Avg. new daily cases in Greene County in 7 days ending Oct. 20: 23.9 per 100,000
> Avg. new daily cases in Greene County in 7 days ending Oct. 13: 13.7 per 100,000
> Avg. new daily cases in New York in 7 days ending Oct. 20: 7 per 100,000 (5th fewest)
> Cumulative confirmed COVID-19 cases in Greene County as of Oct. 20: 1,002 per 100,000 people (total: 477)
> Population: 47,617
> Largest place in Greene County: Catskill
[in-text-ad]

Source: KenThomas.us / Wikimedia Commons
North Carolina: Alexander County
> Change in daily avg. new COVID-19 cases, week over week: +19.7 per 100,000 people
> Avg. new daily cases in Alexander County in 7 days ending Oct. 20: 33.9 per 100,000
> Avg. new daily cases in Alexander County in 7 days ending Oct. 13: 14.1 per 100,000
> Avg. new daily cases in North Carolina in 7 days ending Oct. 20: 19 per 100,000 (25th most)
> Cumulative confirmed COVID-19 cases in Alexander County as of Oct. 20: 1,967 per 100,000 people (total: 730)
> Population: 37,119
> Largest place in Alexander County: Bethlehem CDP

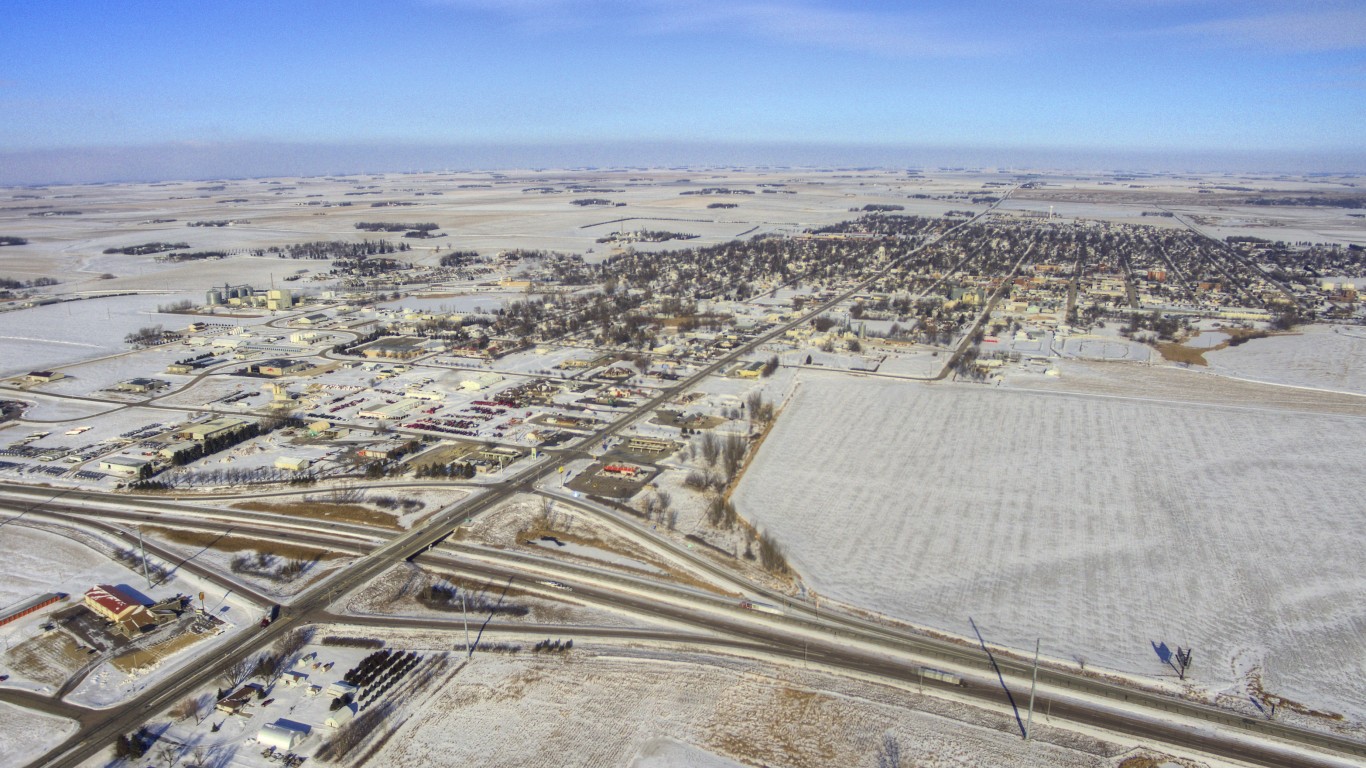
North Dakota: Mercer County
> Change in daily avg. new COVID-19 cases, week over week: +62.4 per 100,000 people
> Avg. new daily cases in Mercer County in 7 days ending Oct. 20: 167.6 per 100,000
> Avg. new daily cases in Mercer County in 7 days ending Oct. 13: 105.3 per 100,000
> Avg. new daily cases in North Dakota in 7 days ending Oct. 20: 87 per 100,000 (the most)
> Cumulative confirmed COVID-19 cases in Mercer County as of Oct. 20: 4,422 per 100,000 people (total: 379)
> Population: 8,570
> Largest place in Mercer County: Beulah

Source: Jacqueline Nix / iStock Editorial via Getty Images
Ohio: Pickaway County
> Change in daily avg. new COVID-19 cases, week over week: +21.0 per 100,000 people
> Avg. new daily cases in Pickaway County in 7 days ending Oct. 20: 37.5 per 100,000
> Avg. new daily cases in Pickaway County in 7 days ending Oct. 13: 16.5 per 100,000
> Avg. new daily cases in Ohio in 7 days ending Oct. 20: 15 per 100,000 (22nd fewest)
> Cumulative confirmed COVID-19 cases in Pickaway County as of Oct. 20: 5,171 per 100,000 people (total: 2,969)
> Population: 57,420
> Largest place in Pickaway County: Circleville
[in-text-ad-2]

Oklahoma: Okfuskee County
> Change in daily avg. new COVID-19 cases, week over week: +24.3 per 100,000 people
> Avg. new daily cases in Okfuskee County in 7 days ending Oct. 20: 75.6 per 100,000
> Avg. new daily cases in Okfuskee County in 7 days ending Oct. 13: 51.4 per 100,000
> Avg. new daily cases in Oklahoma in 7 days ending Oct. 20: 29 per 100,000 (12th most)
> Cumulative confirmed COVID-19 cases in Okfuskee County as of Oct. 20: 2,559 per 100,000 people (total: 310)
> Population: 12,115
> Largest place in Okfuskee County: Okemah

Source: libre de droit / iStock via Getty Images
Oregon: Crook County
> Change in daily avg. new COVID-19 cases, week over week: +4.7 per 100,000 people
> Avg. new daily cases in Crook County in 7 days ending Oct. 20: 7.5 per 100,000
> Avg. new daily cases in Crook County in 7 days ending Oct. 13: 2.8 per 100,000
> Avg. new daily cases in Oregon in 7 days ending Oct. 20: 8 per 100,000 (7th fewest)
> Cumulative confirmed COVID-19 cases in Crook County as of Oct. 20: 385 per 100,000 people (total: 86)
> Population: 22,337
> Largest place in Crook County: Prineville
[in-text-ad]

Source: JERRYE and ROY KLOTZ MD / Wikimedia Commons
Pennsylvania: Westmoreland County
> Change in daily avg. new COVID-19 cases, week over week: +10.5 per 100,000 people
> Avg. new daily cases in Westmoreland County in 7 days ending Oct. 20: 25.3 per 100,000
> Avg. new daily cases in Westmoreland County in 7 days ending Oct. 13: 14.8 per 100,000
> Avg. new daily cases in Pennsylvania in 7 days ending Oct. 20: 11 per 100,000 (13th fewest)
> Cumulative confirmed COVID-19 cases in Westmoreland County as of Oct. 20: 1,019 per 100,000 people (total: 3,614)
> Population: 354,751
> Largest place in Westmoreland County: Municipality of Murrysville

Source: DenisTangneyJr / Getty Images
Rhode Island: Providence County
> Change in daily avg. new COVID-19 cases, week over week: +34.0 per 100,000 people
> Avg. new daily cases in Providence County in 7 days ending Oct. 20: 34.0 per 100,000
> Avg. new daily cases in Providence County in 7 days ending Oct. 13: .0 per 100,000
> Avg. new daily cases in Rhode Island in 7 days ending Oct. 20: 21 per 100,000 (23rd most)
> Cumulative confirmed COVID-19 cases in Providence County as of Oct. 20: 3,221 per 100,000 people (total: 20,439)
> Population: 634,533
> Largest place in Providence County: Providence
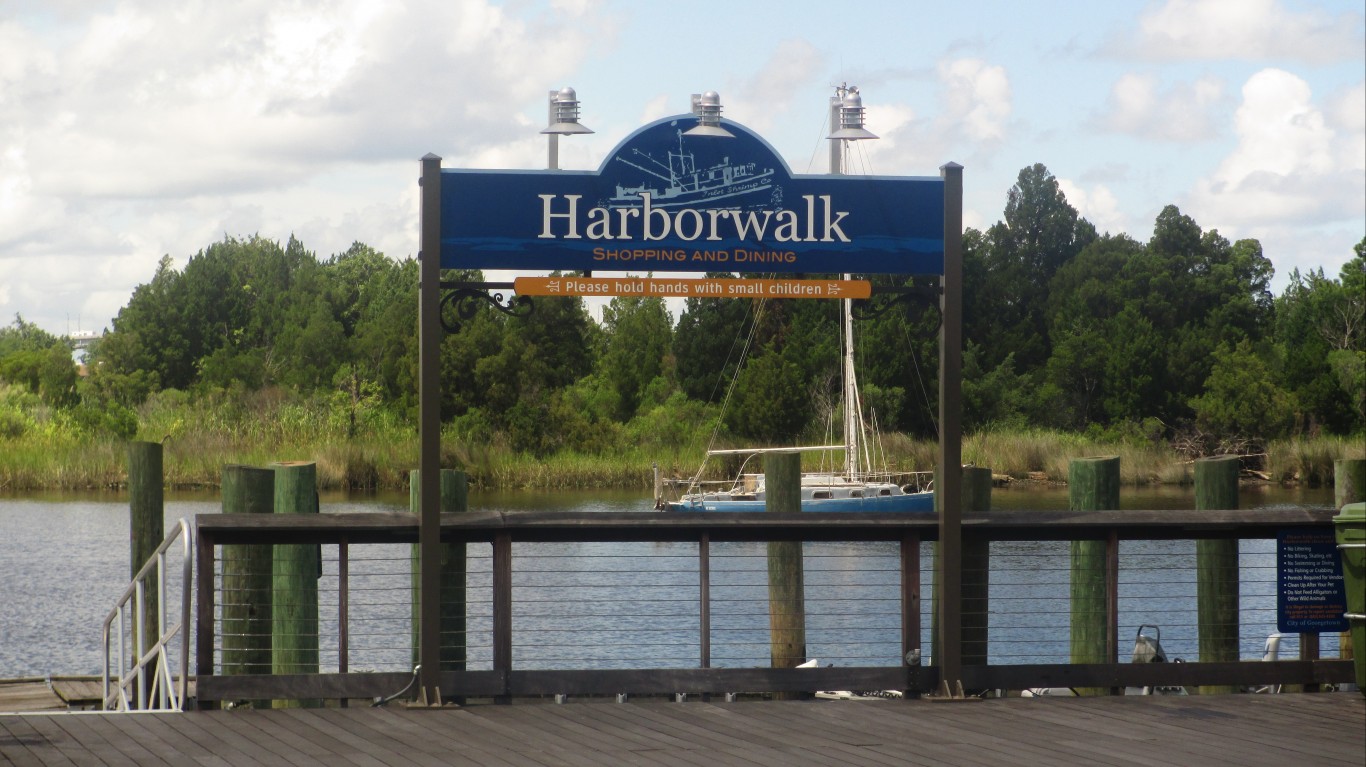
Source: Billy Hathorn / Wikimedia Commons
South Carolina: Georgetown County
> Change in daily avg. new COVID-19 cases, week over week: +17.8 per 100,000 people
> Avg. new daily cases in Georgetown County in 7 days ending Oct. 20: 35.1 per 100,000
> Avg. new daily cases in Georgetown County in 7 days ending Oct. 13: 17.3 per 100,000
> Avg. new daily cases in South Carolina in 7 days ending Oct. 20: 18 per 100,000 (25th fewest)
> Cumulative confirmed COVID-19 cases in Georgetown County as of Oct. 20: 3,587 per 100,000 people (total: 2,210)
> Population: 61,605
> Largest place in Georgetown County: Georgetown
[in-text-ad-2]

Source: Ammodramus / Wikimedia Commons
South Dakota: Bon Homme County
> Change in daily avg. new COVID-19 cases, week over week: +149.9 per 100,000 people
> Avg. new daily cases in Bon Homme County in 7 days ending Oct. 20: 233.1 per 100,000
> Avg. new daily cases in Bon Homme County in 7 days ending Oct. 13: 83.2 per 100,000
> Avg. new daily cases in South Dakota in 7 days ending Oct. 20: 77 per 100,000 (2nd most)
> Cumulative confirmed COVID-19 cases in Bon Homme County as of Oct. 20: 4,549 per 100,000 people (total: 317)
> Population: 6,969
> Largest place in Bon Homme County: Tyndall

Source: Brian Stansberry / Wikimedia Commons
Tennessee: Crockett County
> Change in daily avg. new COVID-19 cases, week over week: +28.0 per 100,000 people
> Avg. new daily cases in Crockett County in 7 days ending Oct. 20: 92.8 per 100,000
> Avg. new daily cases in Crockett County in 7 days ending Oct. 13: 64.7 per 100,000
> Avg. new daily cases in Tennessee in 7 days ending Oct. 20: 28 per 100,000 (13th most)
> Cumulative confirmed COVID-19 cases in Crockett County as of Oct. 20: 5,400 per 100,000 people (total: 783)
> Population: 14,499
> Largest place in Crockett County: Bells
[in-text-ad]

Source: RoschetzkyIstockPhoto / iStock via Getty Images
Texas: Parmer County
> Change in daily avg. new COVID-19 cases, week over week: +67.7 per 100,000 people
> Avg. new daily cases in Parmer County in 7 days ending Oct. 20: 92.4 per 100,000
> Avg. new daily cases in Parmer County in 7 days ending Oct. 13: 24.7 per 100,000
> Avg. new daily cases in Texas in 7 days ending Oct. 20: 15 per 100,000 (21st fewest)
> Cumulative confirmed COVID-19 cases in Parmer County as of Oct. 20: 5,400 per 100,000 people (total: 532)
> Population: 9,852
> Largest place in Parmer County: Friona

Utah: San Juan County
> Change in daily avg. new COVID-19 cases, week over week: +16.8 per 100,000 people
> Avg. new daily cases in San Juan County in 7 days ending Oct. 20: 29.1 per 100,000
> Avg. new daily cases in San Juan County in 7 days ending Oct. 13: 12.3 per 100,000
> Avg. new daily cases in Utah in 7 days ending Oct. 20: 39 per 100,000 (6th most)
> Cumulative confirmed COVID-19 cases in San Juan County as of Oct. 20: 5,032 per 100,000 people (total: 769)
> Population: 15,281
> Largest place in San Juan County: Blanding

Source: John Phelan / Wikimedia Commons
Vermont: Washington County
> Change in daily avg. new COVID-19 cases, week over week: +2.2 per 100,000 people
> Avg. new daily cases in Washington County in 7 days ending Oct. 20: 3.4 per 100,000
> Avg. new daily cases in Washington County in 7 days ending Oct. 13: 1.2 per 100,000
> Avg. new daily cases in Vermont in 7 days ending Oct. 20: 2 per 100,000 (the fewest)
> Cumulative confirmed COVID-19 cases in Washington County as of Oct. 20: 178 per 100,000 people (total: 104)
> Population: 58,477
> Largest place in Washington County: Barre
[in-text-ad-2]

Virginia: Southampton County
> Change in daily avg. new COVID-19 cases, week over week: +42.9 per 100,000 people
> Avg. new daily cases in Southampton County in 7 days ending Oct. 20: 63.6 per 100,000
> Avg. new daily cases in Southampton County in 7 days ending Oct. 13: 20.7 per 100,000
> Avg. new daily cases in Virginia in 7 days ending Oct. 20: 12 per 100,000 (17th fewest)
> Cumulative confirmed COVID-19 cases in Southampton County as of Oct. 20: 5,039 per 100,000 people (total: 904)
> Population: 17,939
> Largest place in Southampton County: Courtland
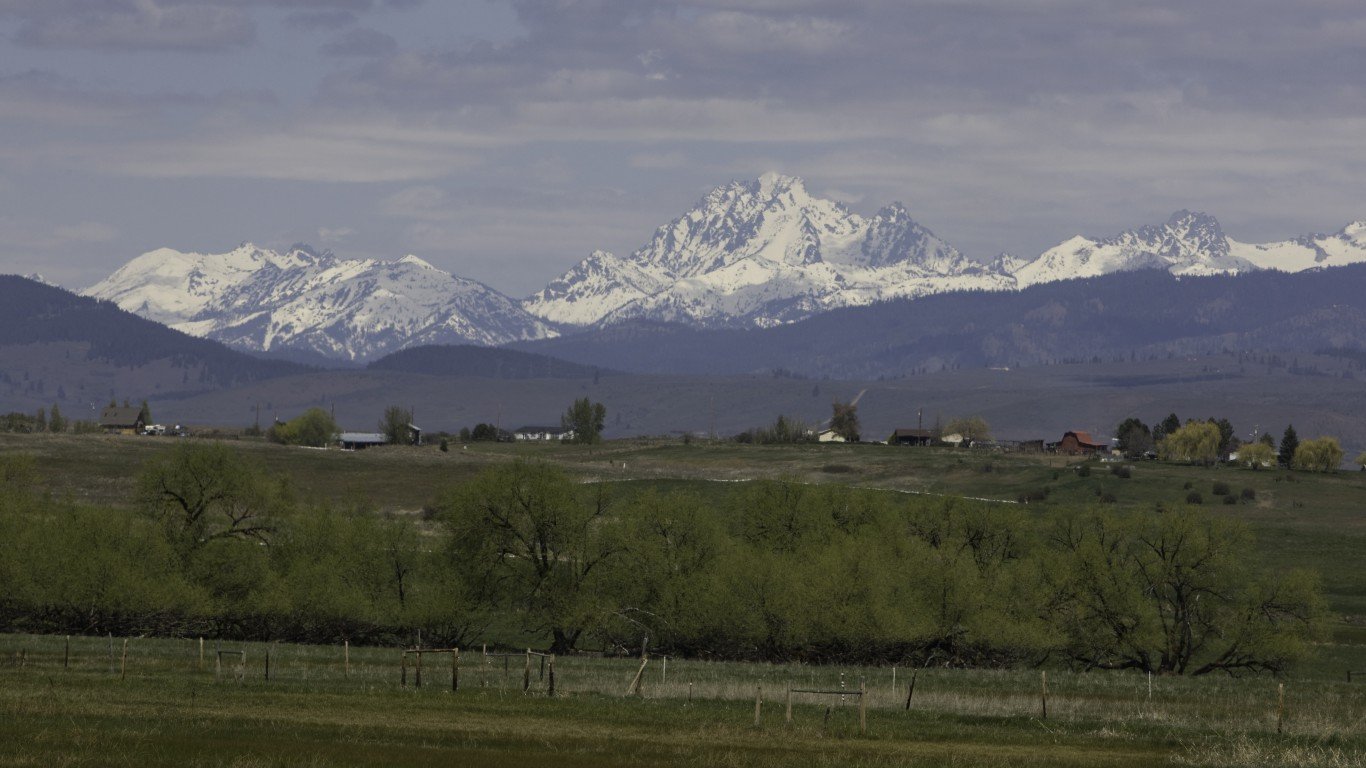
Source: lightasafeather / E+ via Getty Images
Washington: Kittitas County
> Change in daily avg. new COVID-19 cases, week over week: +10.3 per 100,000 people
> Avg. new daily cases in Kittitas County in 7 days ending Oct. 20: 22.2 per 100,000
> Avg. new daily cases in Kittitas County in 7 days ending Oct. 13: 11.9 per 100,000
> Avg. new daily cases in Washington in 7 days ending Oct. 20: 9 per 100,000 (8th fewest)
> Cumulative confirmed COVID-19 cases in Kittitas County as of Oct. 20: 1,506 per 100,000 people (total: 675)
> Population: 44,825
> Largest place in Kittitas County: Ellensburg
[in-text-ad]

Source: Jon Dawson / Flickr
West Virginia: Brooke County
> Change in daily avg. new COVID-19 cases, week over week: +19.9 per 100,000 people
> Avg. new daily cases in Brooke County in 7 days ending Oct. 20: 28.9 per 100,000
> Avg. new daily cases in Brooke County in 7 days ending Oct. 13: 9.1 per 100,000
> Avg. new daily cases in West Virginia in 7 days ending Oct. 20: 15 per 100,000 (20th fewest)
> Cumulative confirmed COVID-19 cases in Brooke County as of Oct. 20: 874 per 100,000 people (total: 199)
> Population: 22,772
> Largest place in Brooke County: Weirton

Wisconsin: Langlade County
> Change in daily avg. new COVID-19 cases, week over week: +34.4 per 100,000 people
> Avg. new daily cases in Langlade County in 7 days ending Oct. 20: 150.5 per 100,000
> Avg. new daily cases in Langlade County in 7 days ending Oct. 13: 116.1 per 100,000
> Avg. new daily cases in Wisconsin in 7 days ending Oct. 20: 50 per 100,000 (4th most)
> Cumulative confirmed COVID-19 cases in Langlade County as of Oct. 20: 3,674 per 100,000 people (total: 704)
> Population: 19,164
> Largest place in Langlade County: Antigo

Wyoming: Weston County
> Change in daily avg. new COVID-19 cases, week over week: +30.8 per 100,000 people
> Avg. new daily cases in Weston County in 7 days ending Oct. 20: 59.8 per 100,000
> Avg. new daily cases in Weston County in 7 days ending Oct. 13: 29.0 per 100,000
> Avg. new daily cases in Wyoming in 7 days ending Oct. 20: 34 per 100,000 (8th most)
> Cumulative confirmed COVID-19 cases in Weston County as of Oct. 20: 1,423 per 100,000 people (total: 101)
> Population: 7,100
> Largest place in Weston County: Newcastle
Sponsored: Want to Retire Early? Here’s a Great First Step
Want retirement to come a few years earlier than you’d planned? Or are you ready to retire now, but want an extra set of eyes on your finances?
Now you can speak with up to 3 financial experts in your area for FREE. By simply clicking here you can begin to match with financial professionals who can help you build your plan to retire early. And the best part? The first conversation with them is free.
Click here to match with up to 3 financial pros who would be excited to help you make financial decisions.
Thank you for reading! Have some feedback for us?
Contact the 24/7 Wall St. editorial team.
Editors' Picks


