Prior to the COVID-19 pandemic, nearly 85% of American workers drove to work on a daily basis. This commute, which for some takes the better part of an hour each way, can be stressful. The typical American commuter spends about 54 hours a year waiting in traffic, spending over $1,000 in wasted fuel and lost time, according to a recent report. And with tens of thousands of traffic fatalities in America each year, daily commutes can be dangerous.
While traffic problems can occur anywhere, there are certain major American cities where gridlock, accidents, long commutes, and high gas prices make driving especially frustrating.
24/7 Wall St. created an index composed of several driving-related measures from the U.S. Census Bureau, the National Insurance Crime Bureau, Texas A&M’s Transportation Institute, and more, to identify the worst metropolitan statistical areas for drivers. The components of the index — which include average commute time, regional gas prices, drunk driving death rates, overall driving fatality rates, time and money lost due to congestion, and auto theft rates — were selected to capture an area’s safety, convenience, and cost of driving.
The 50 worst cities to drive in are spread out among 16 states, with 31 located in the South, 18 in the West, and just one in the Midwest. California has by far the most cities on this list, at 11, followed by Texas with seven. Alabama and Florida are tied with five cities apiece.
In addition to paying for gas and insurance, drivers also have to handle repairs and routine maintenance. The roads these cars drive on also need routine maintenance, yet many major roads, highways, and bridges have fallen into disrepair across the country. This declining infrastructure can damage cars and even pose a threat to the safety of drivers and their passengers. These are the states that are falling apart.
Click here to see the 50 worst cities to drive in.
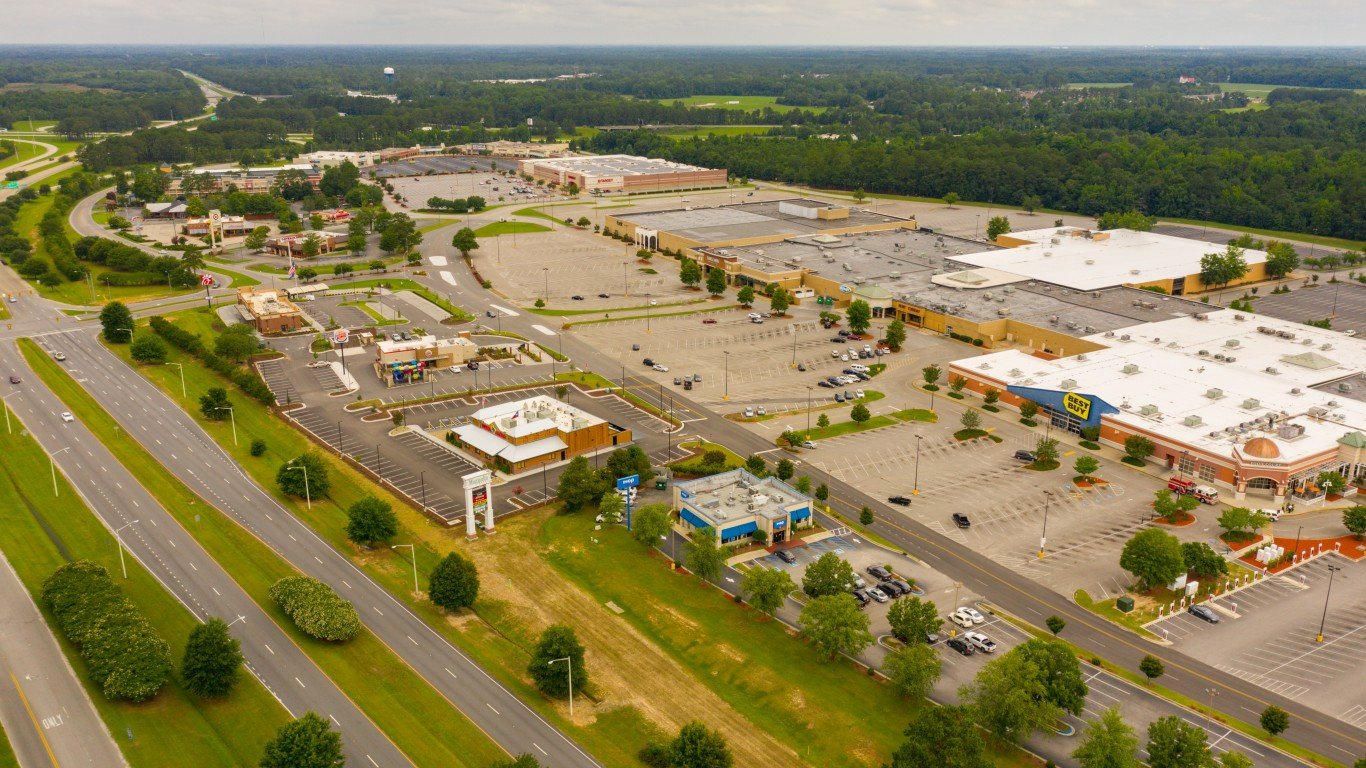
Click here to see our methodology.
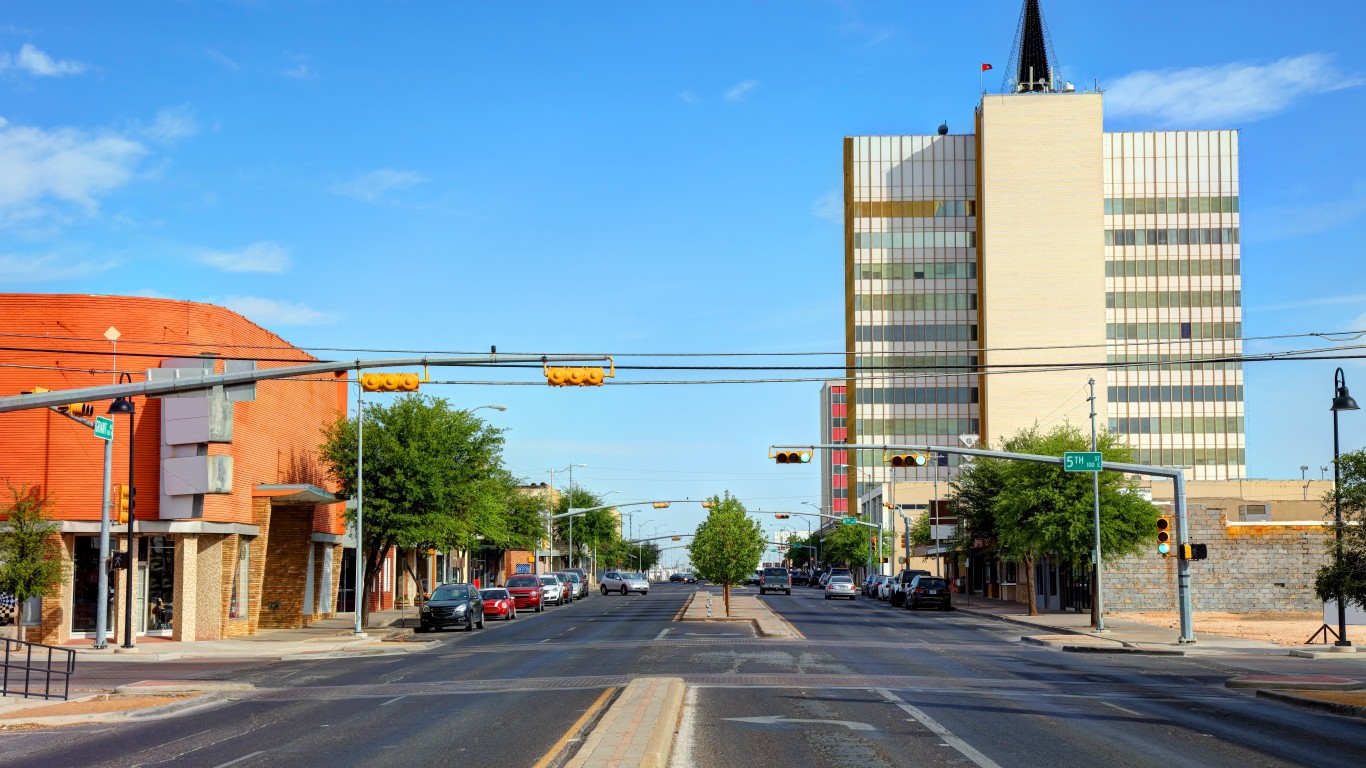
Source: dszc / E+ via Getty Images
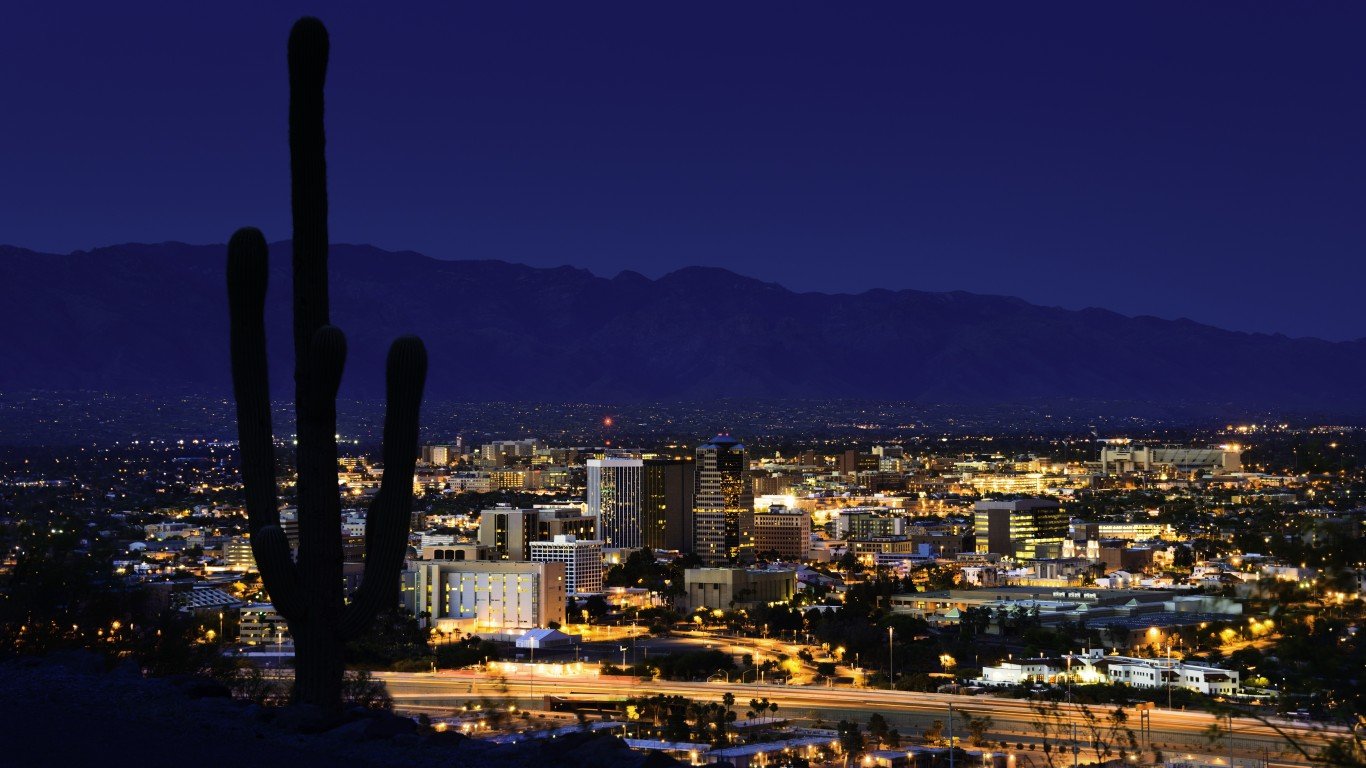
50. Tucson, AZ
> 2018 traffic fatalities per 100,000 people: 11.9 (state: 13.9)
> Avg. commute time: 25.1 mins.
> 2017 hours lost due to congestion per car: 52.0 hours
> Most dangerous road: I-10
[in-text-ad]
Source: Sean Pavone / iStock via Getty Images
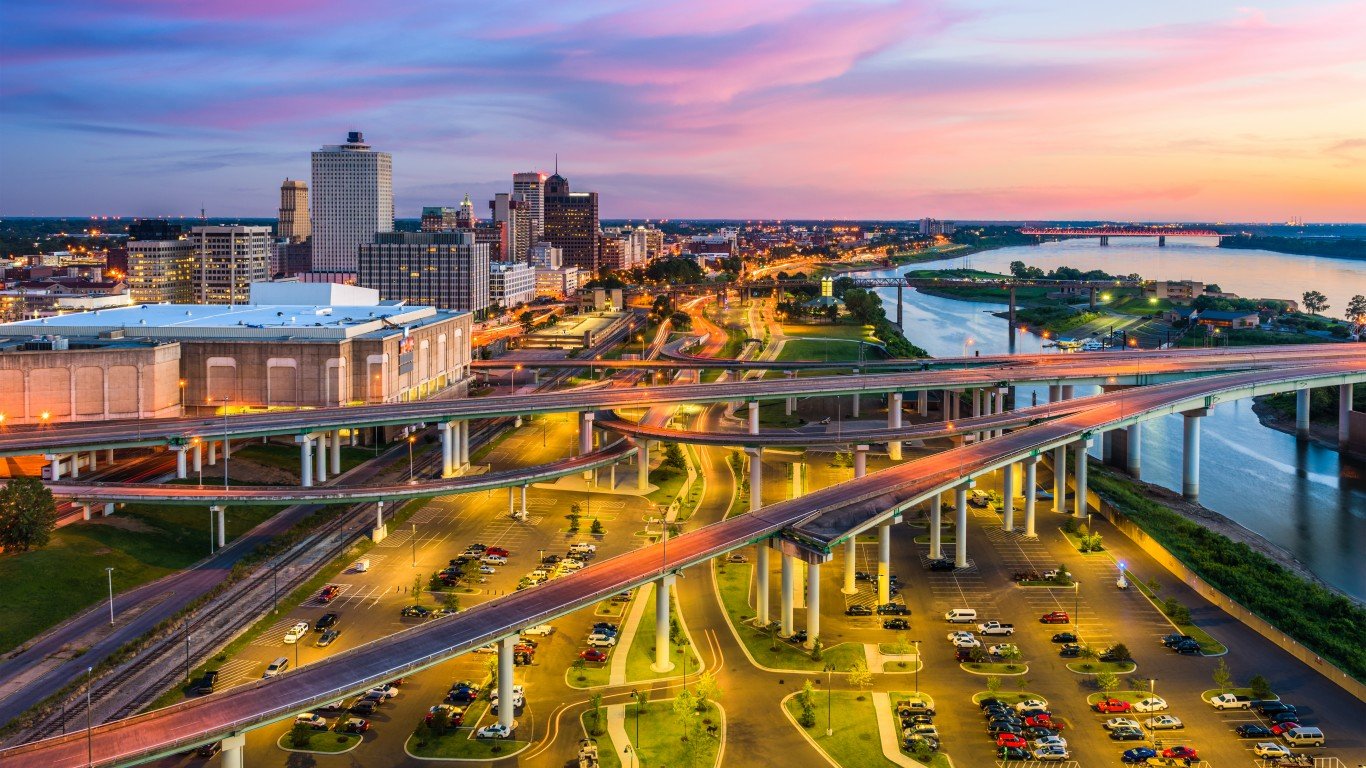
49. Memphis, TN-MS-AR
> 2018 traffic fatalities per 100,000 people: 18.8 (state: 15.2)
> Avg. commute time: 24.8 mins.
> 2017 hours lost due to congestion per car: N/A
> Most dangerous road: I-40
Source: peeterv / iStock Unreleased via Getty Images
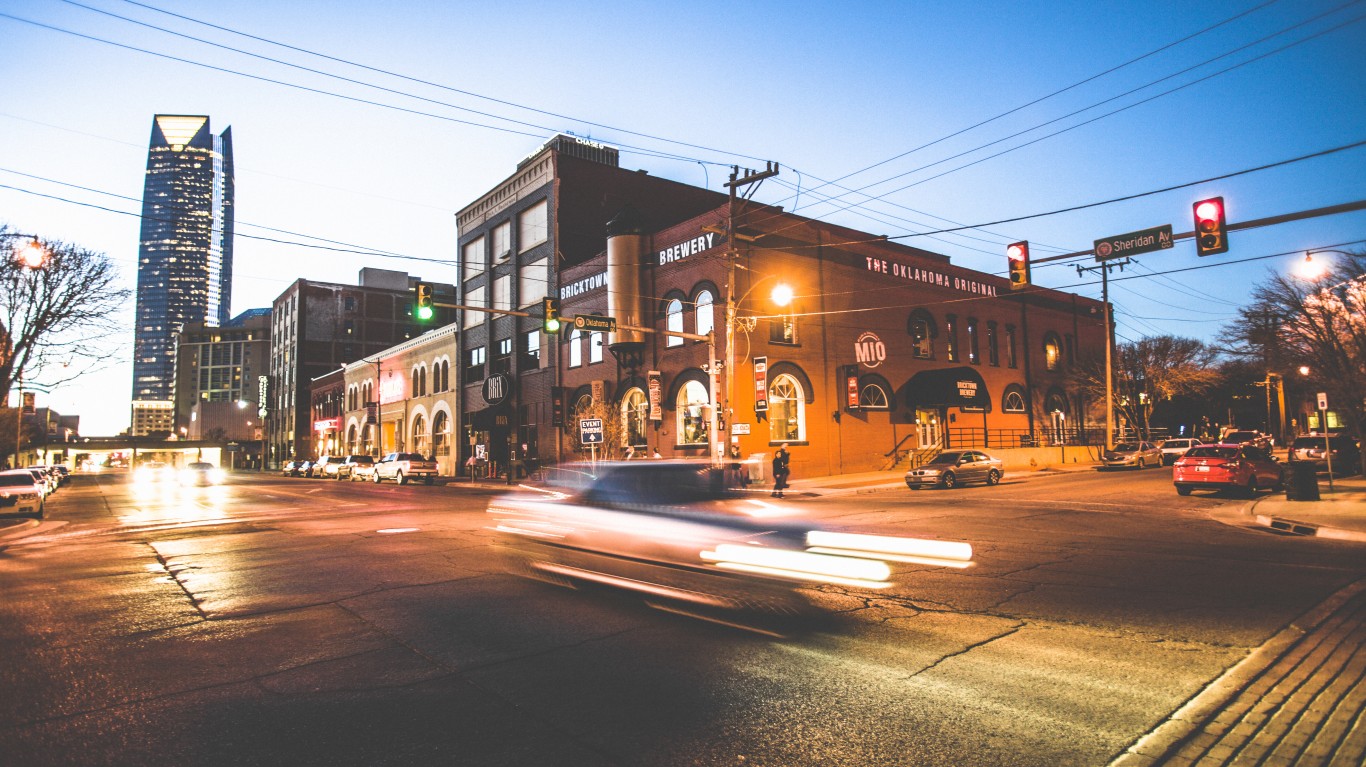
48. Oklahoma City, OK
> 2018 traffic fatalities per 100,000 people: 12.6 (state: 16.6)
> Avg. commute time: 23.7 mins.
> 2017 hours lost due to congestion per car: 50.0 hours
> Most dangerous road: US-62
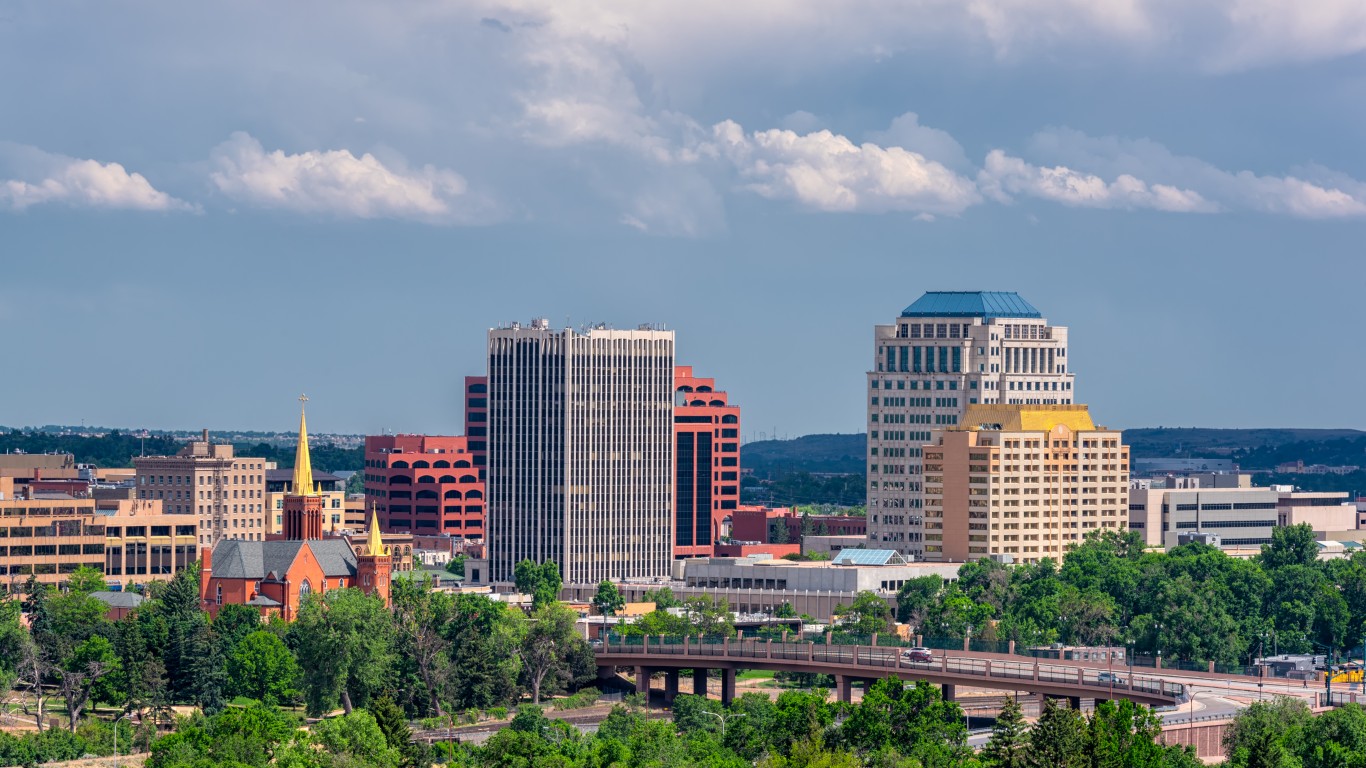
Source: Richard Bittles / iStock via Getty Images
47. Colorado Springs, CO
> 2018 traffic fatalities per 100,000 people: 11.5 (state: 11.0)
> Avg. commute time: 24.5 mins.
> 2017 hours lost due to congestion per car: 43.0 hours
> Most dangerous road: I-25
[in-text-ad-2]
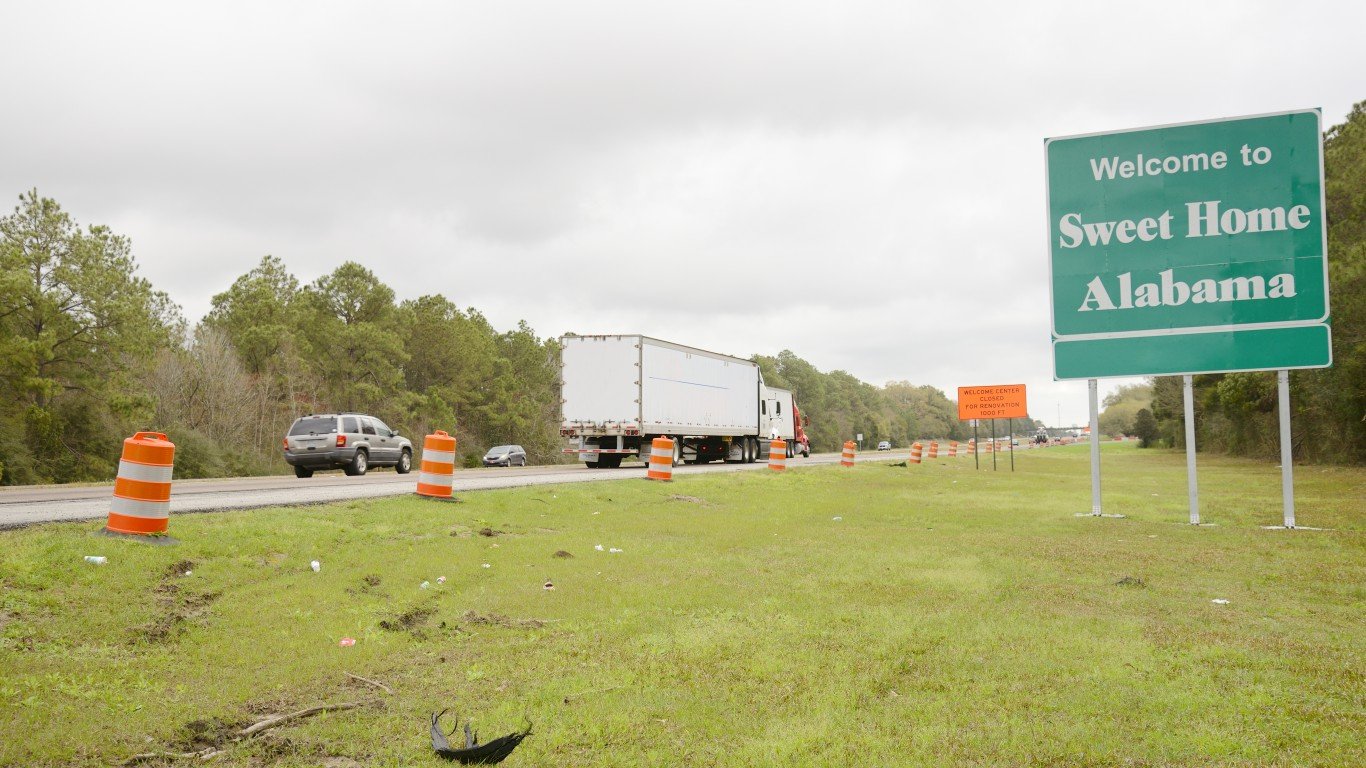
Source: Lisa-Blue / iStock via Getty Images
46. Anniston-Oxford-Jacksonville, AL
> 2018 traffic fatalities per 100,000 people: 18.5 (state: 19.4)
> Avg. commute time: N/A
> 2017 hours lost due to congestion per car: N/A
> Most dangerous road: SR-21
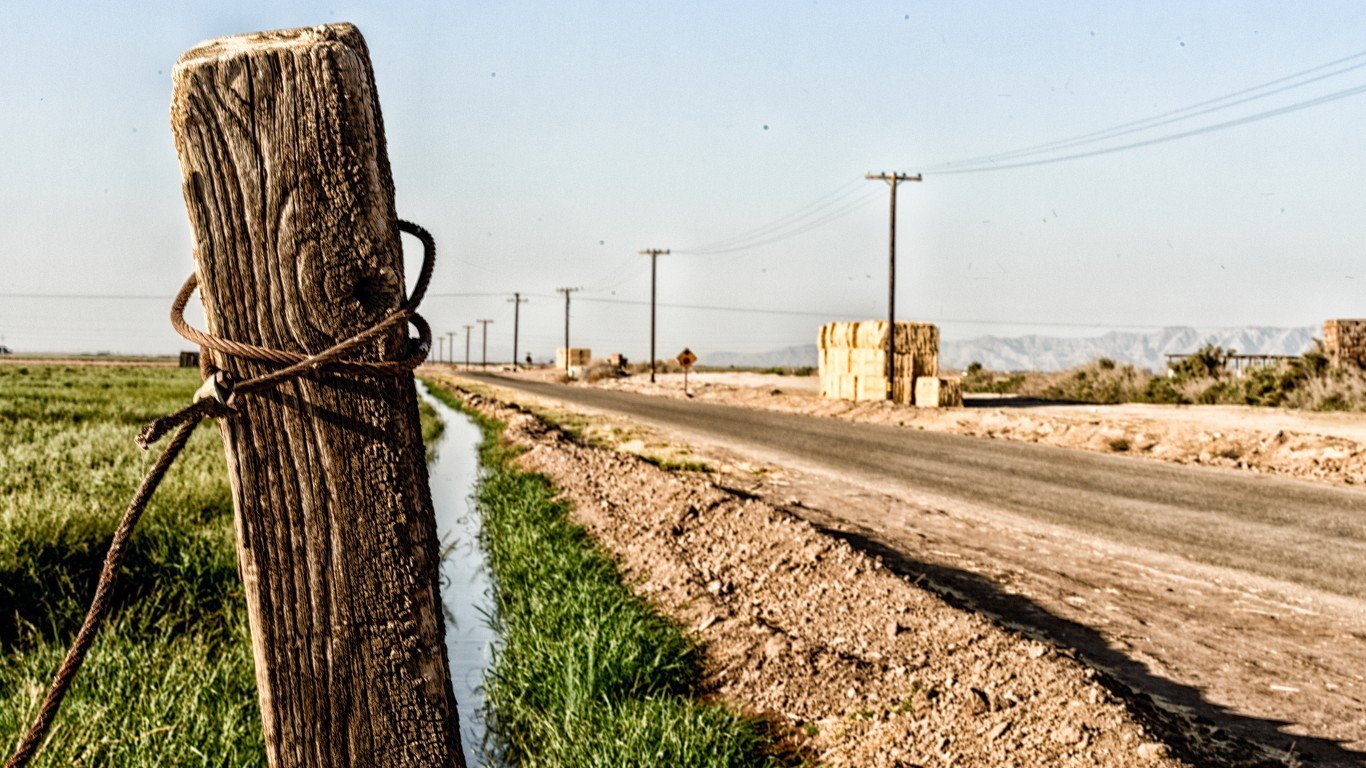
Source: DavidPool / iStock via Getty Images
45. El Centro, CA
> 2018 traffic fatalities per 100,000 people: 20.4 (state: 9.0)
> Avg. commute time: 23.7 mins.
> 2017 hours lost due to congestion per car: N/A
> Most dangerous road: I-8
[in-text-ad]
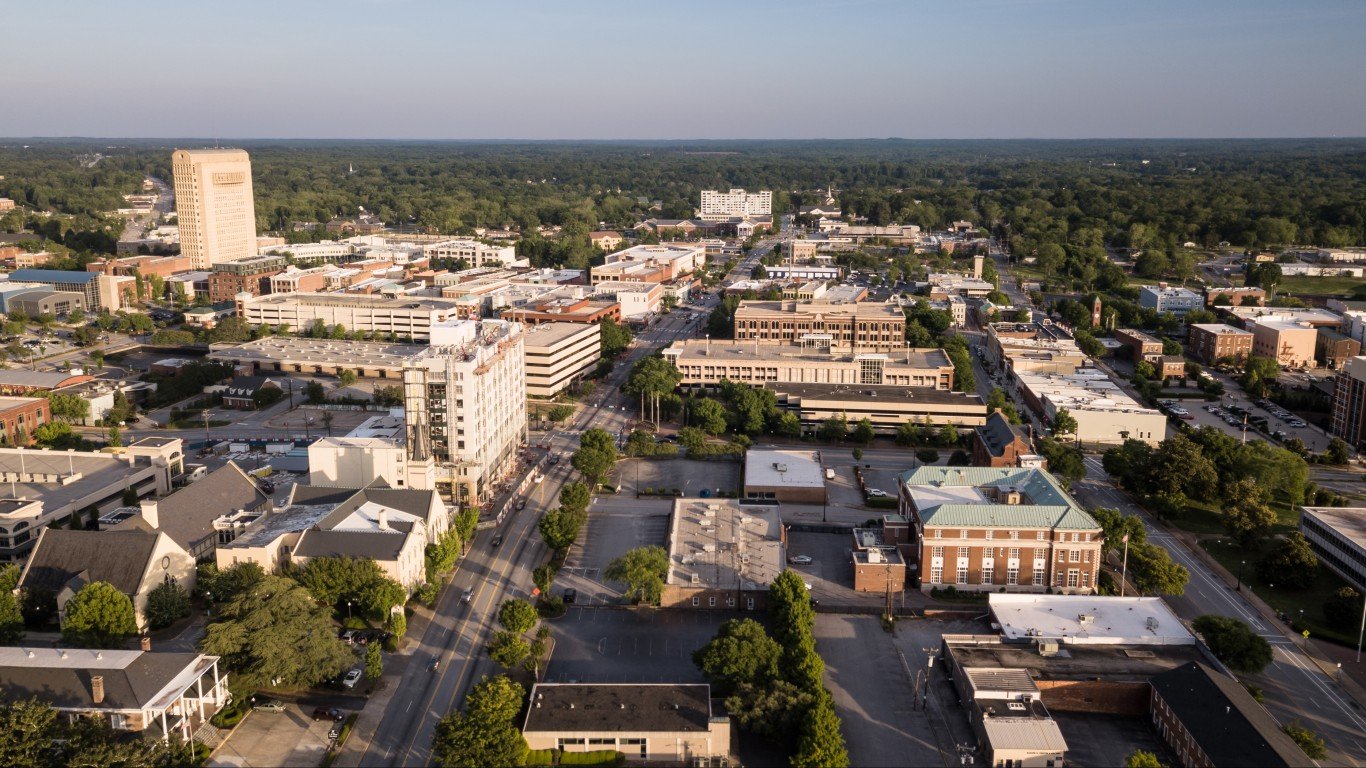
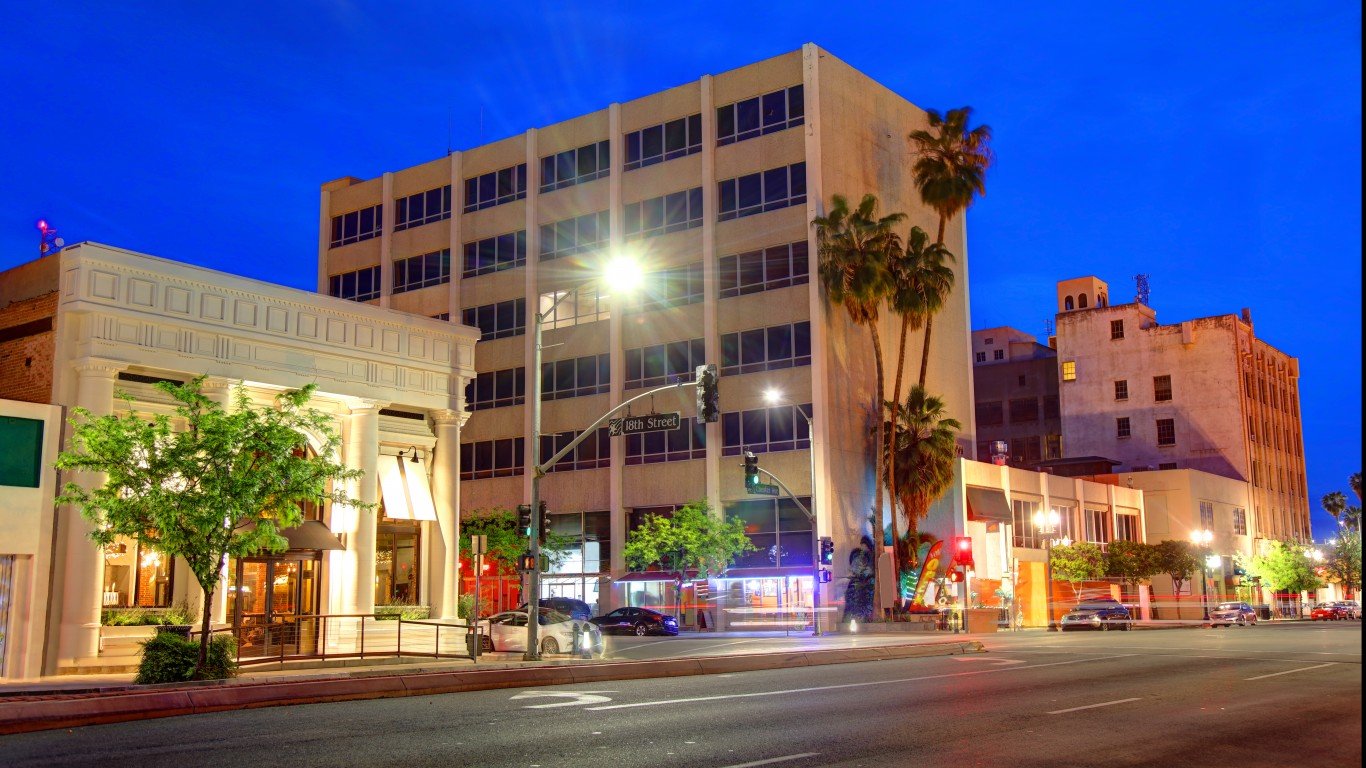
Source: ChrisBoswell / iStock via Getty Images
44. Spartanburg, SC
> 2018 traffic fatalities per 100,000 people: 22.5 (state: 20.1)
> Avg. commute time: 23.9 mins.
> 2017 hours lost due to congestion per car: 26.0 hours
> Most dangerous road: I-85
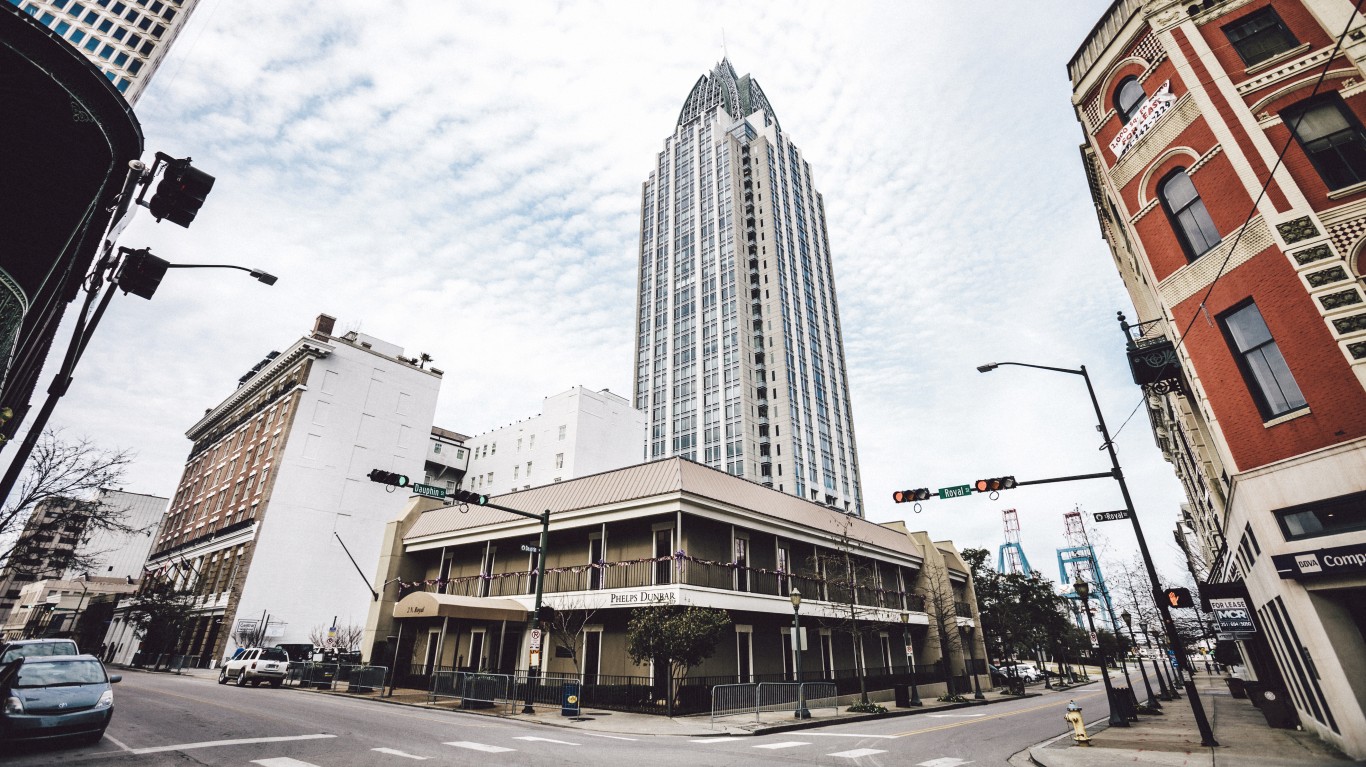
Source: peeterv / iStock via Getty Images
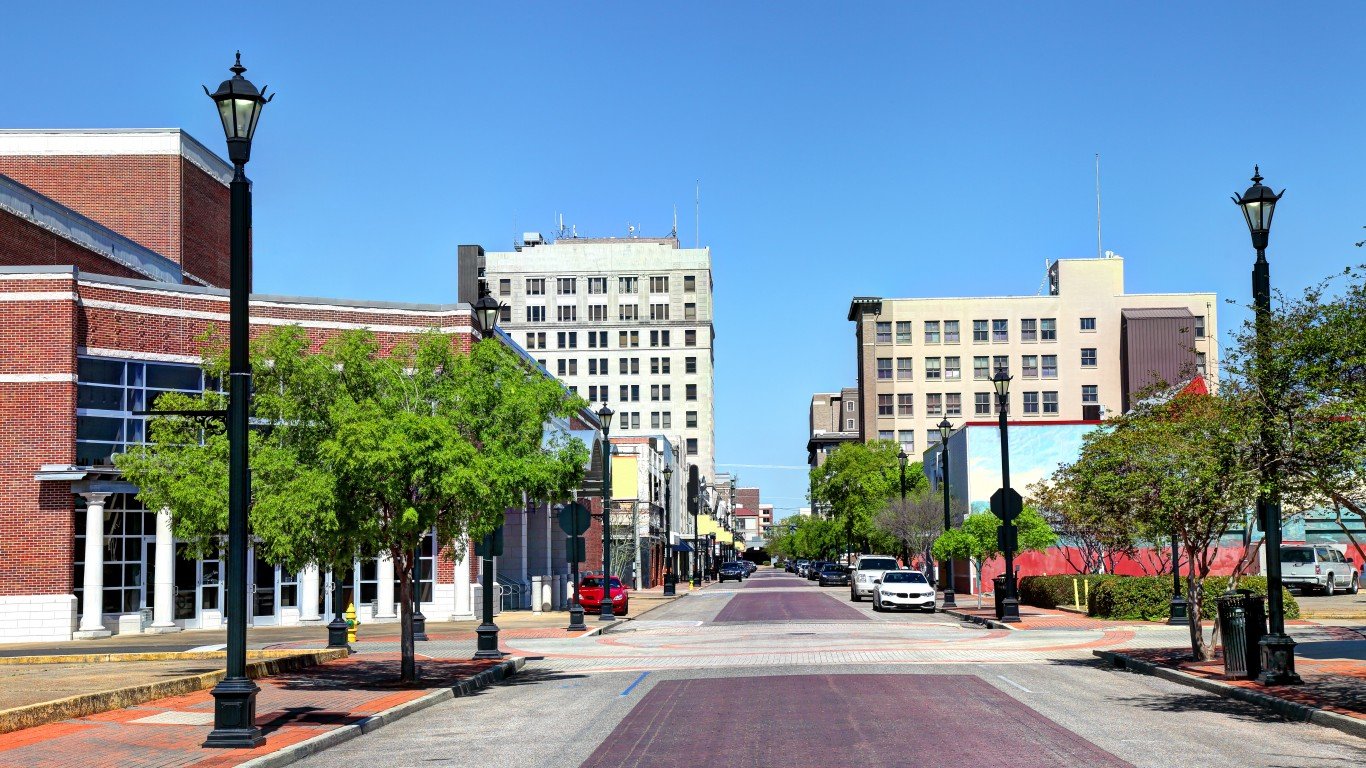
43. Mobile, AL
> 2018 traffic fatalities per 100,000 people: 17.8 (state: 19.4)
> Avg. commute time: 24.9 mins.
> 2017 hours lost due to congestion per car: 28.0 hours
> Most dangerous road: I-65
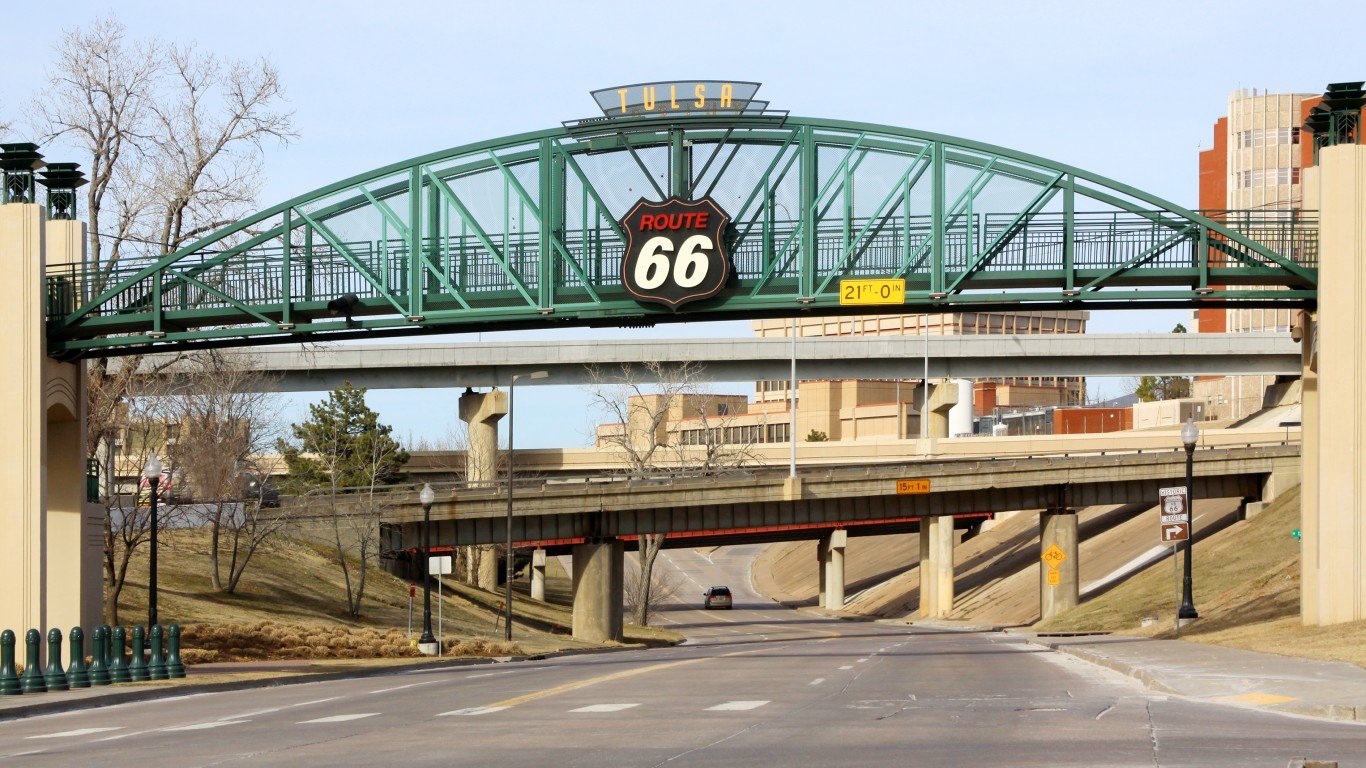
Source: JTGrafix / iStock via Getty Images
42. Tulsa, OK
> 2018 traffic fatalities per 100,000 people: 14.3 (state: 16.6)
> Avg. commute time: 22.2 mins.
> 2017 hours lost due to congestion per car: 46.0 hours
> Most dangerous road: I-44
[in-text-ad-2]

41. San Antonio-New Braunfels, TX
> 2018 traffic fatalities per 100,000 people: 10.2 (state: 12.6)
> Avg. commute time: 27.4 mins.
> 2017 hours lost due to congestion per car: 51.0 hours
> Most dangerous road: I-10
Source: peeterv / iStock via Getty Images
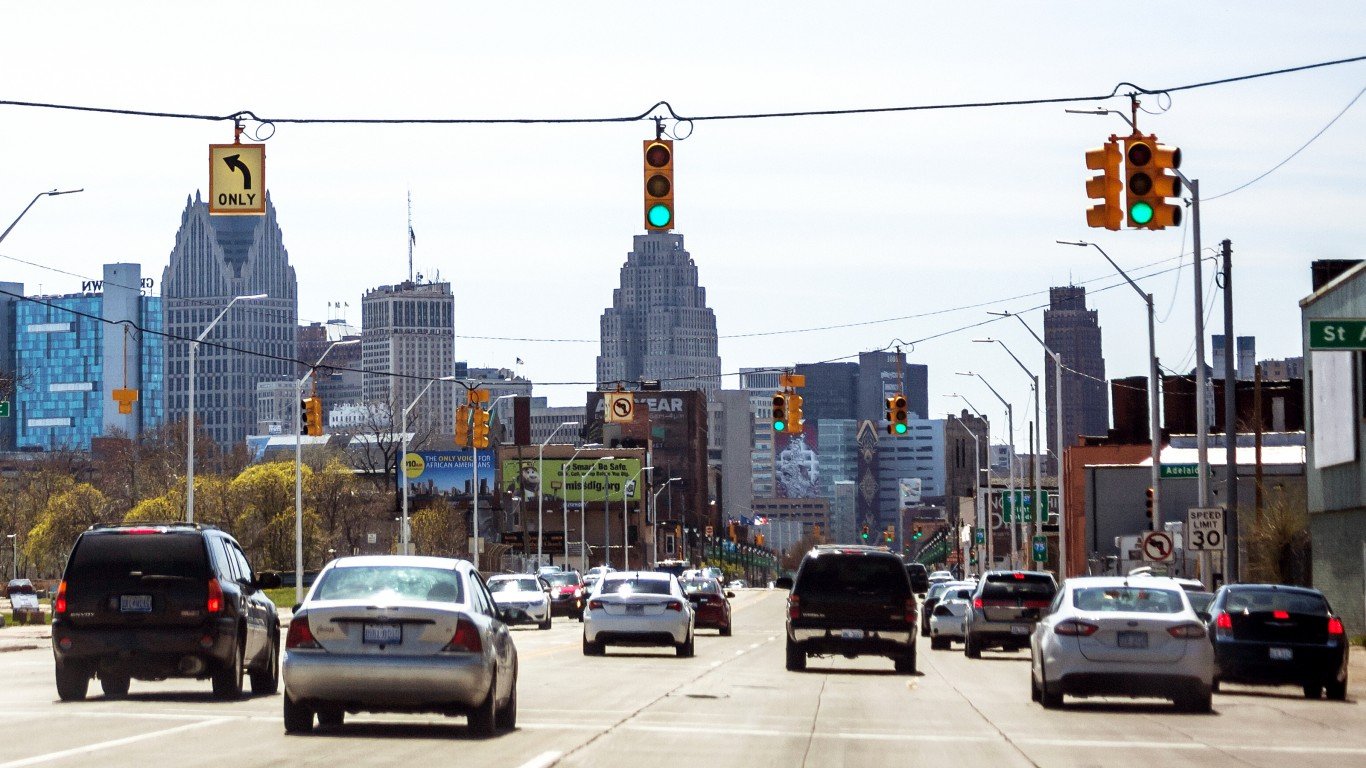
40. Detroit-Warren-Dearborn, MI
> 2018 traffic fatalities per 100,000 people: 7.3 (state: 9.8)
> Avg. commute time: 27.5 mins.
> 2017 hours lost due to congestion per car: 60.0 hours
> Most dangerous road: I-94
[in-text-ad]
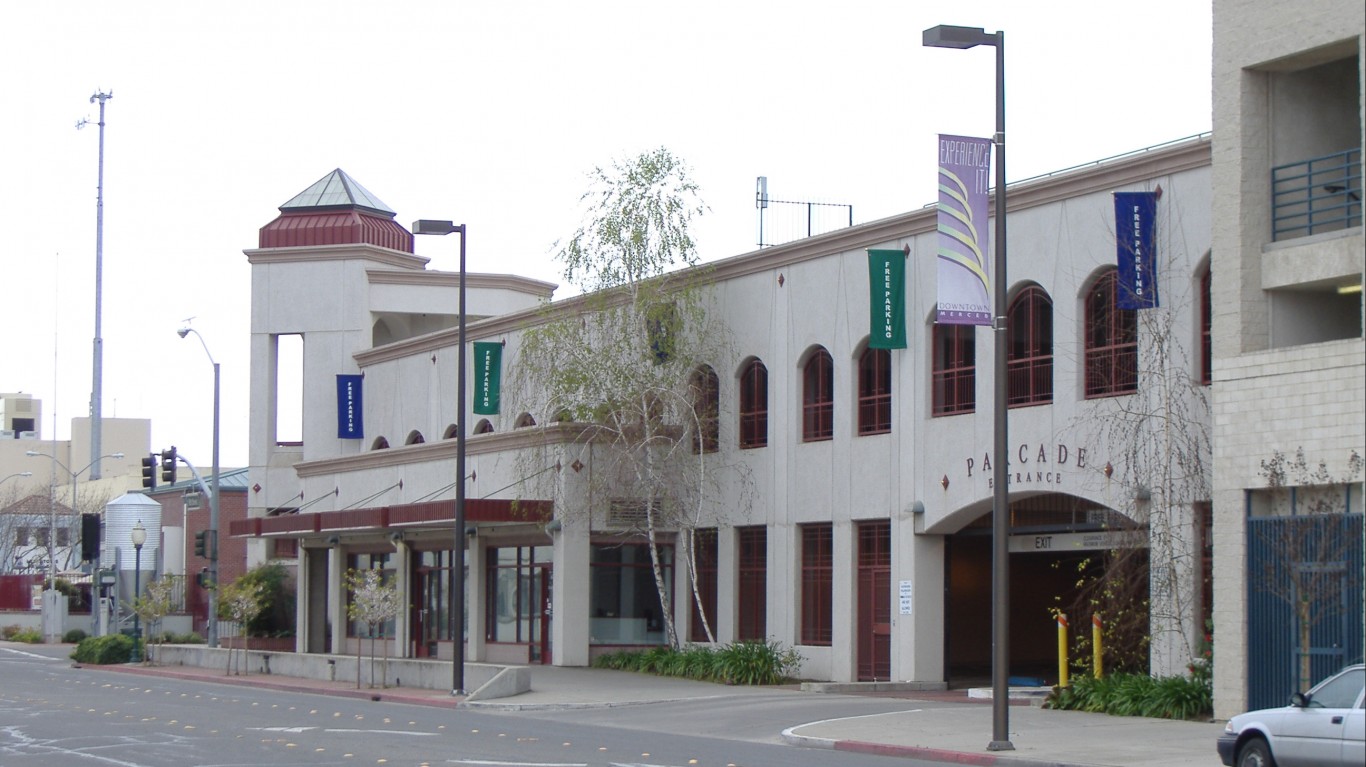
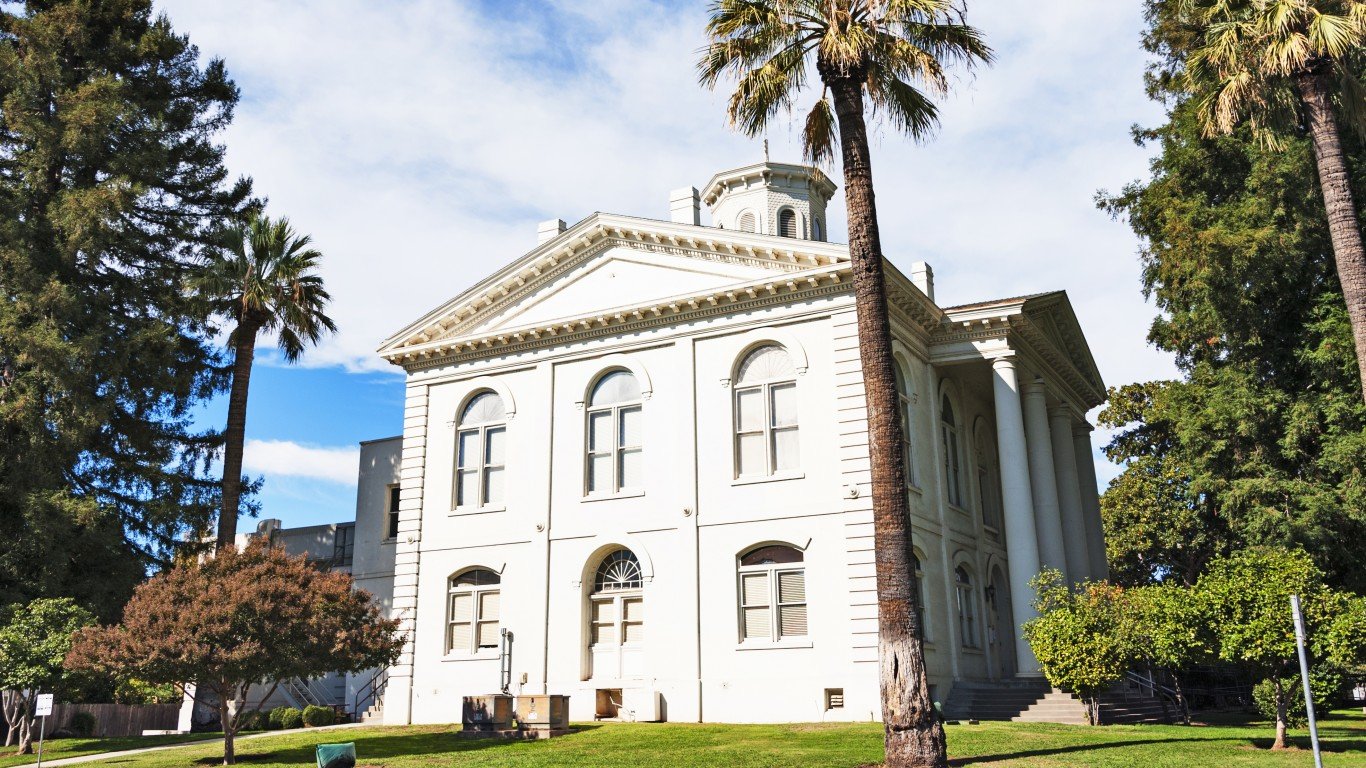
Source: Ron Johnson / Wikimedia Commons
39. Merced, CA
> 2018 traffic fatalities per 100,000 people: 19.8 (state: 9.0)
> Avg. commute time: 31.1 mins.
> 2017 hours lost due to congestion per car: 14.0 hours
> Most dangerous road: I-5
 24/7 Wall St.
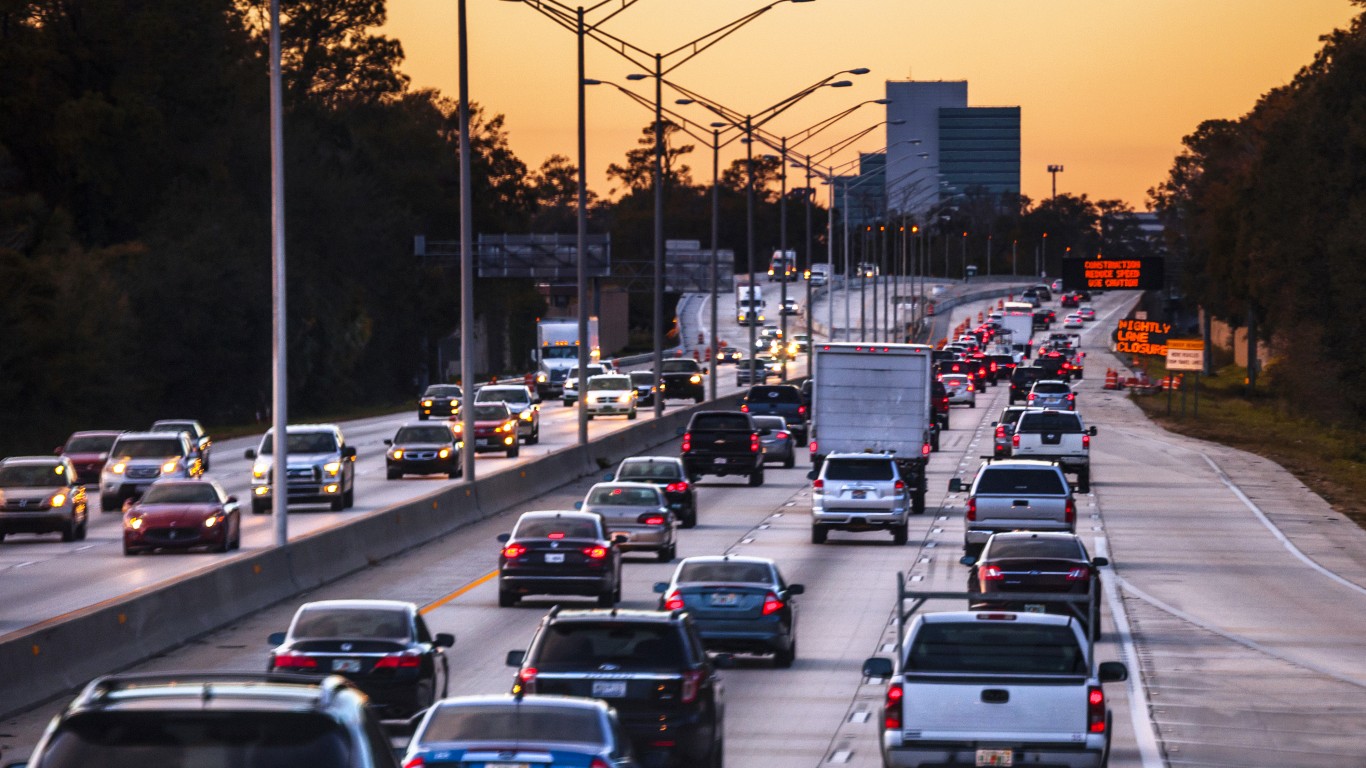
Source: peeterv / iStock via Getty Images
38. Jacksonville, FL
> 2018 traffic fatalities per 100,000 people: 14.0 (state: 14.6)
> Avg. commute time: 27.3 mins.
> 2017 hours lost due to congestion per car: 44.9 hours
> Most dangerous road: US-90
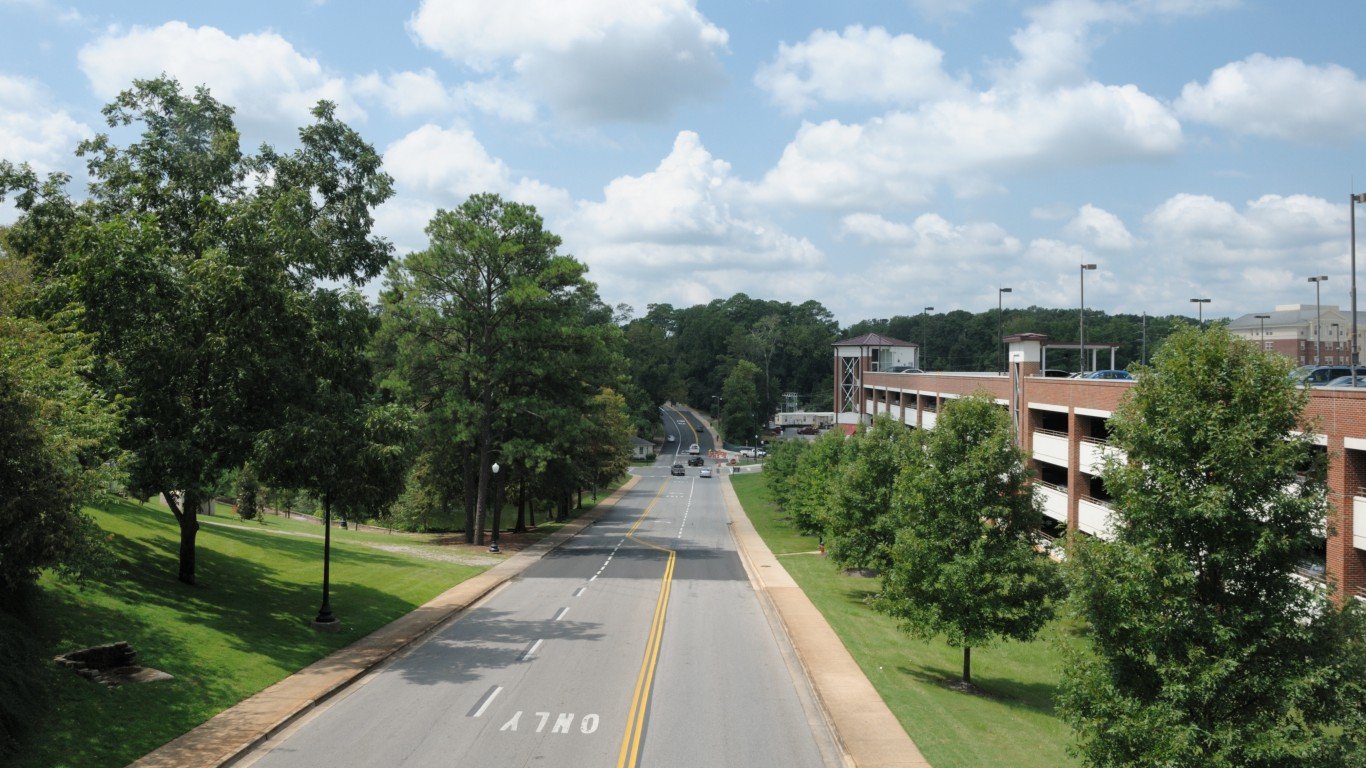
Source: sshepard / iStock via Getty Images
37. Tuscaloosa, AL
> 2018 traffic fatalities per 100,000 people: 21.0 (state: 19.4)
> Avg. commute time: 24.3 mins.
> 2017 hours lost due to congestion per car: 30.0 hours
> Most dangerous road: I-59
[in-text-ad-2]

36. Birmingham-Hoover, AL
> 2018 traffic fatalities per 100,000 people: 16.9 (state: 19.4)
> Avg. commute time: 28.1 mins.
> 2017 hours lost due to congestion per car: 40.0 hours
> Most dangerous road: I-65
Source: DenisTangneyJr / iStock via Getty Images
35. Bakersfield, CA
> 2018 traffic fatalities per 100,000 people: 16.0 (state: 9.0)
> Avg. commute time: 24.2 mins.
> 2017 hours lost due to congestion per car: 23.6 hours
> Most dangerous road: I-5
[in-text-ad]
Source: DenisTangneyJr / iStock via Getty Images
34. Texarkana, TX-AR
> 2018 traffic fatalities per 100,000 people: 20.1 (state: 12.6)
> Avg. commute time: N/A
> 2017 hours lost due to congestion per car: N/A
> Most dangerous road: US-71-040
Source: MichaelWarrenPix / iStock via Getty Images
33. Ocala, FL
> 2018 traffic fatalities per 100,000 people: 23.0 (state: 14.6)
> Avg. commute time: 25.7 mins.
> 2017 hours lost due to congestion per car: 24.0 hours
> Most dangerous road: SR-40
Source: James-Allen / Getty Images
32. Florence-Muscle Shoals, AL
> 2018 traffic fatalities per 100,000 people: 27.7 (state: 19.4)
> Avg. commute time: N/A
> 2017 hours lost due to congestion per car: 26.0 hours
> Most dangerous road: SR-20
[in-text-ad-2]
Source: Courtesy of John Terning via Flickr
31. Farmington, NM
> 2018 traffic fatalities per 100,000 people: 26.6 (state: 18.6)
> Avg. commute time: N/A
> 2017 hours lost due to congestion per car: 12.0 hours
> Most dangerous road: US-550

30. Charleston-North Charleston, SC
> 2018 traffic fatalities per 100,000 people: 15.3 (state: 20.1)
> Avg. commute time: 27.6 mins.
> 2017 hours lost due to congestion per car: N/A
> Most dangerous road: US-17
[in-text-ad]
Source: jmoor17 / iStock via Getty Images
29. Yuba City, CA
> 2018 traffic fatalities per 100,000 people: 26.2 (state: 9.0)
> Avg. commute time: 27.9 mins.
> 2017 hours lost due to congestion per car: 20.0 hours
> Most dangerous road: SR-99
 24/7 Wall St.
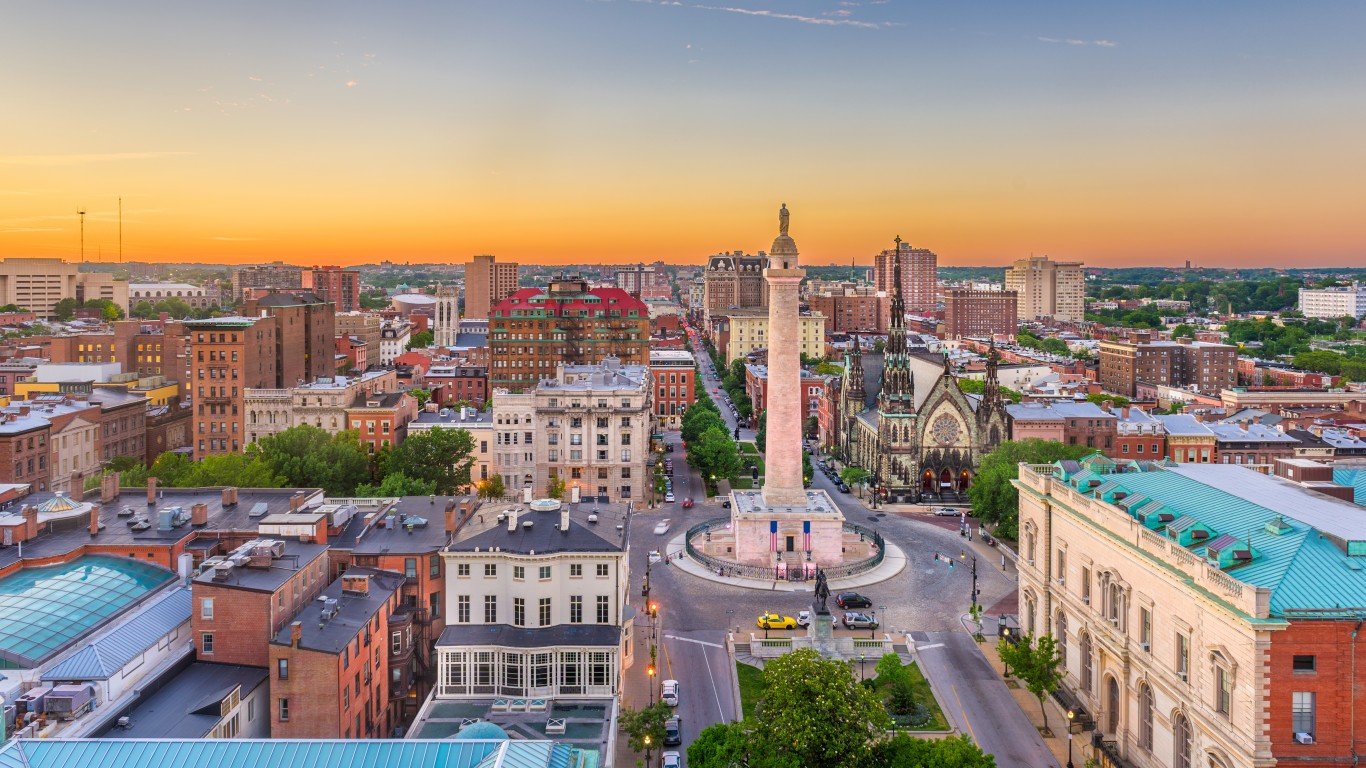
Source: Sean Pavone / iStock via Getty Images
28. Baltimore-Columbia-Towson, MD
> 2018 traffic fatalities per 100,000 people: 7.9 (state: 8.3)
> Avg. commute time: 31.7 mins.
> 2017 hours lost due to congestion per car: 59.0 hours
> Most dangerous road: I-695
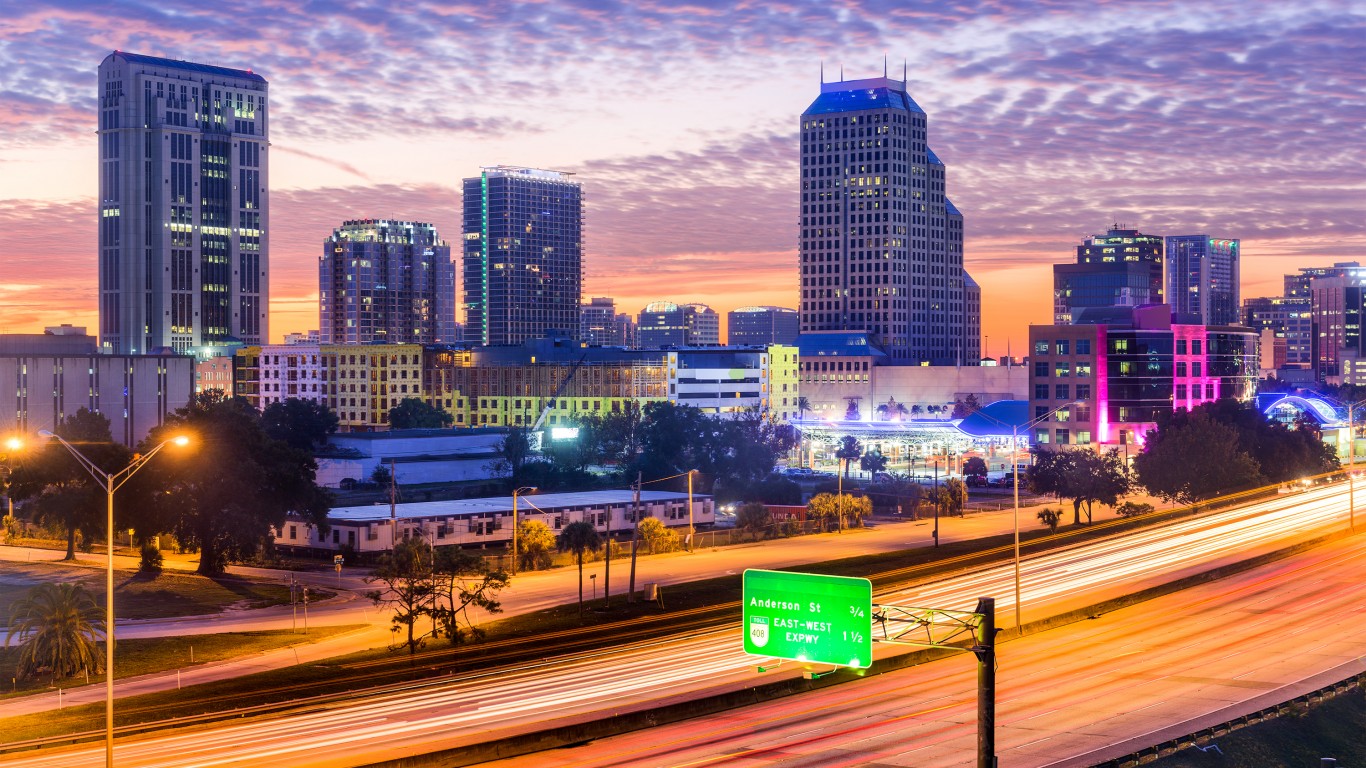
Source: SeanPavonePhoto / iStock via Getty Images
27. Orlando-Kissimmee-Sanford, FL
> 2018 traffic fatalities per 100,000 people: 13.1 (state: 14.6)
> Avg. commute time: 30.2 mins.
> 2017 hours lost due to congestion per car: 52.7 hours
> Most dangerous road: US-441
[in-text-ad-2]
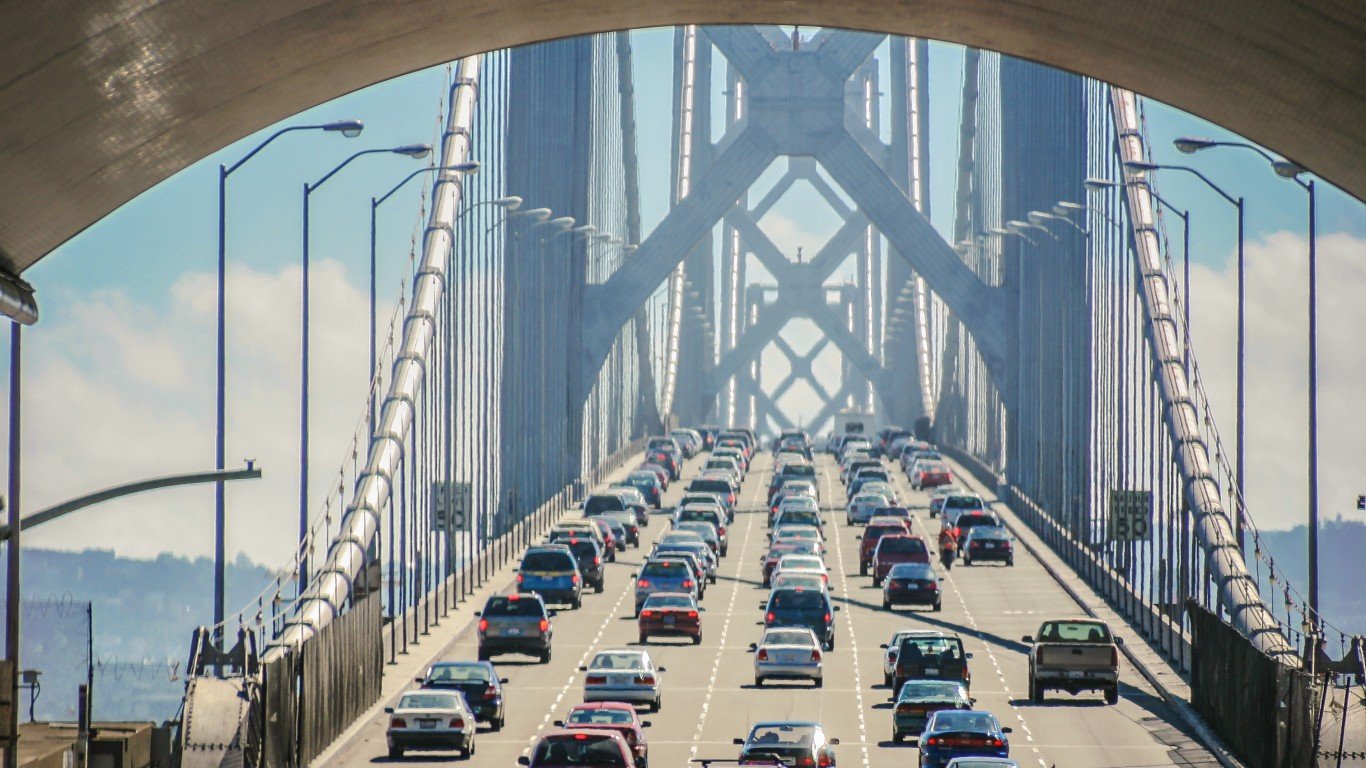
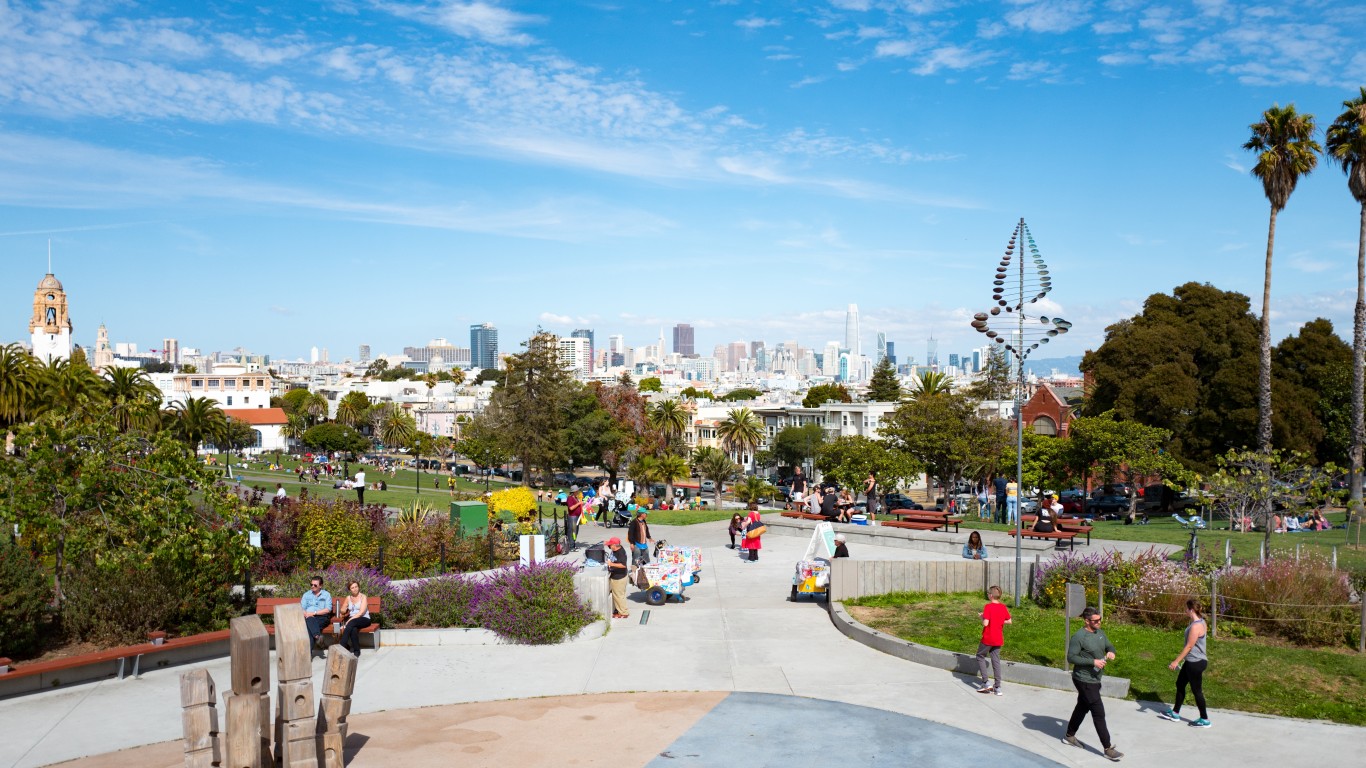
Source: MasaoTaira / iStock via Getty Images
26. San Francisco-Oakland-Hayward, CA
> 2018 traffic fatalities per 100,000 people: 4.5 (state: 9.0)
> Avg. commute time: 35.2 mins.
> 2017 hours lost due to congestion per car: 44.8 hours
> Most dangerous road: US-101
Source: DenisTangneyJr / iStock via Getty Images
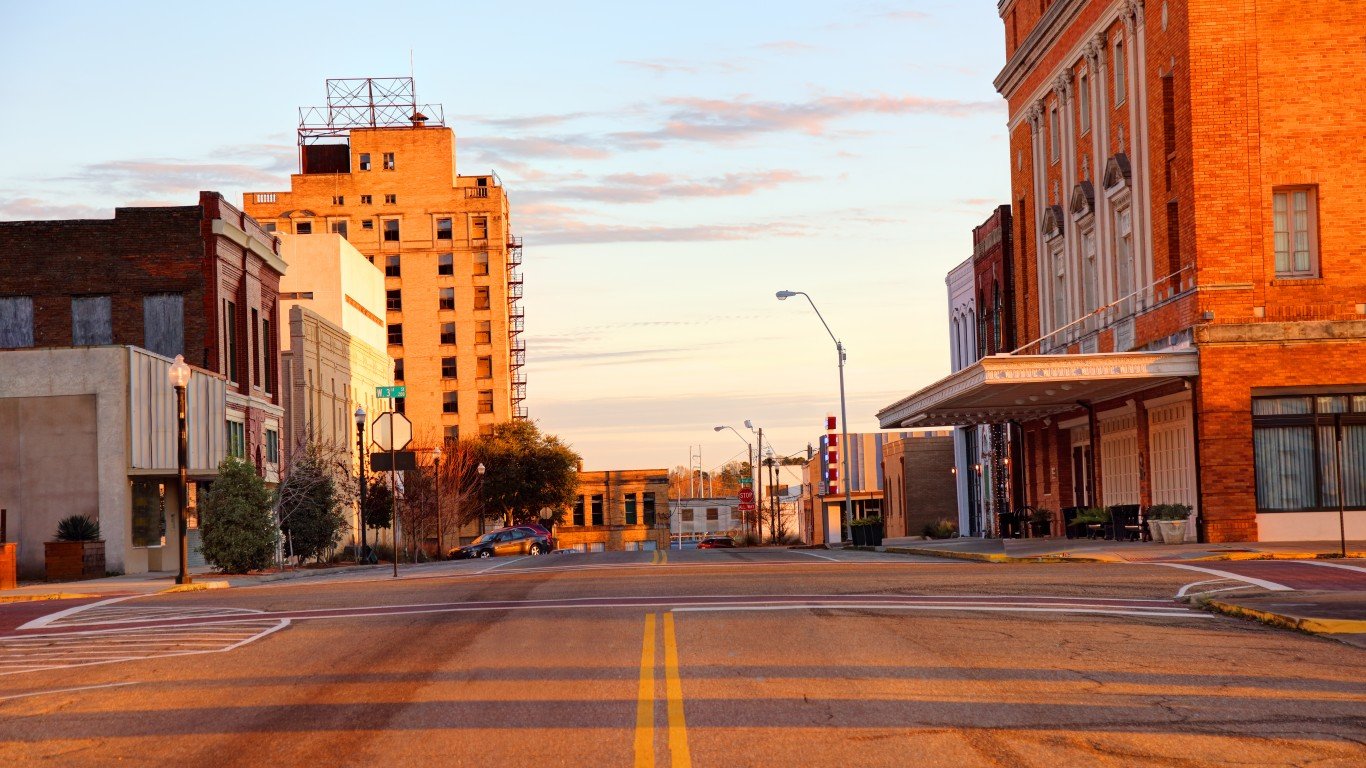
25. Alexandria, LA
> 2018 traffic fatalities per 100,000 people: 22.4 (state: 16.5)
> Avg. commute time: 27.9 mins.
> 2017 hours lost due to congestion per car: 27.0 hours
> Most dangerous road: US-71
[in-text-ad]
Source: photoquest7 / iStock via Getty Images
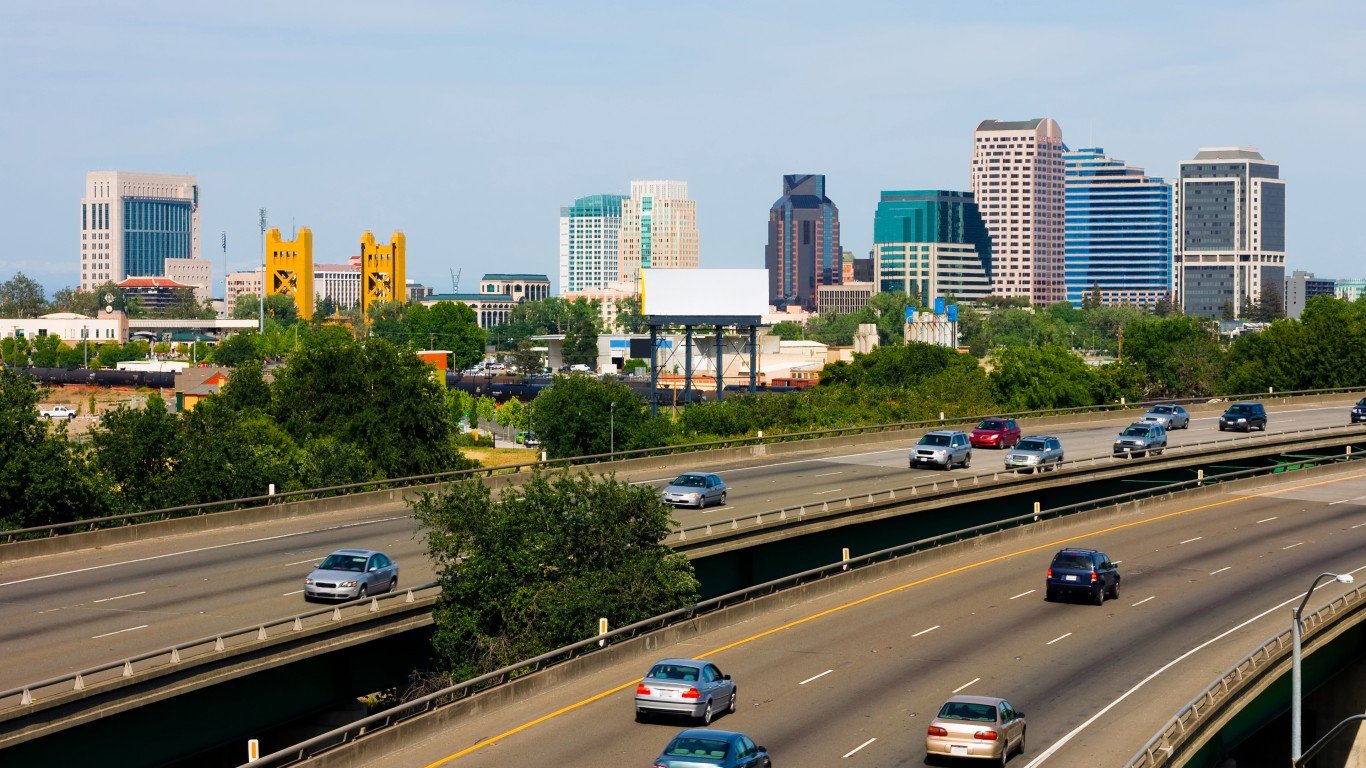
24. Sacramento–Roseville–Arden-Arcade, CA
> 2018 traffic fatalities per 100,000 people: 9.4 (state: 9.0)
> Avg. commute time: 28.2 mins.
> 2017 hours lost due to congestion per car: 56.9 hours
> Most dangerous road: I-5

Source: csfotoimages / iStock Editorial via Getty Images
23. Homosassa Springs, FL
> 2018 traffic fatalities per 100,000 people: 24.7 (state: 14.6)
> Avg. commute time: N/A
> 2017 hours lost due to congestion per car: N/A
> Most dangerous road: SR-44

22. Longview, TX
> 2018 traffic fatalities per 100,000 people: 28.6 (state: 12.6)
> Avg. commute time: 24.1 mins.
> 2017 hours lost due to congestion per car: 29.0 hours
> Most dangerous road: I-20
[in-text-ad-2]
Source: Sean Pavone / iStock via Getty Images
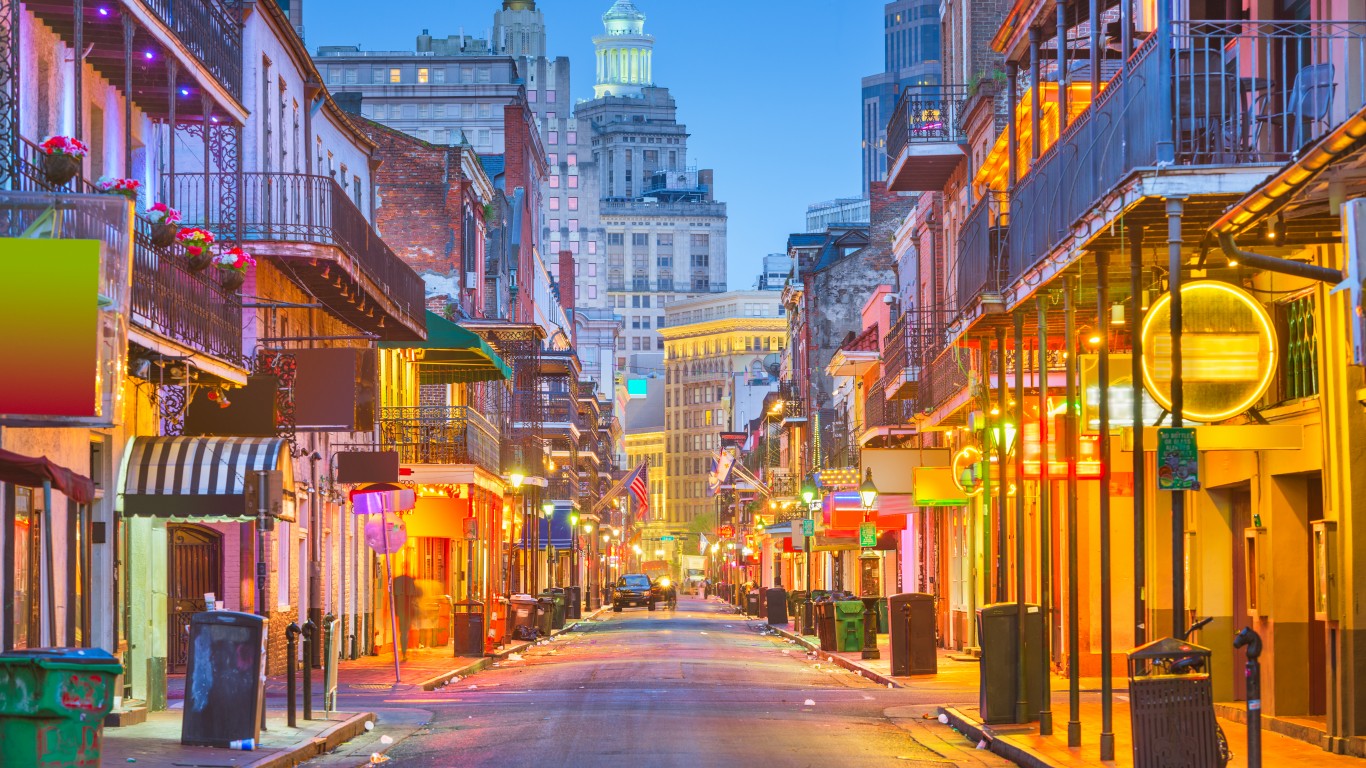
21. New Orleans-Metairie, LA
> 2018 traffic fatalities per 100,000 people: 10.8 (state: 16.5)
> Avg. commute time: 26.5 mins.
> 2017 hours lost due to congestion per car: 54.0 hours
> Most dangerous road: I-10
Source: RoschetzkyIstockPhoto / iStock via Getty Images
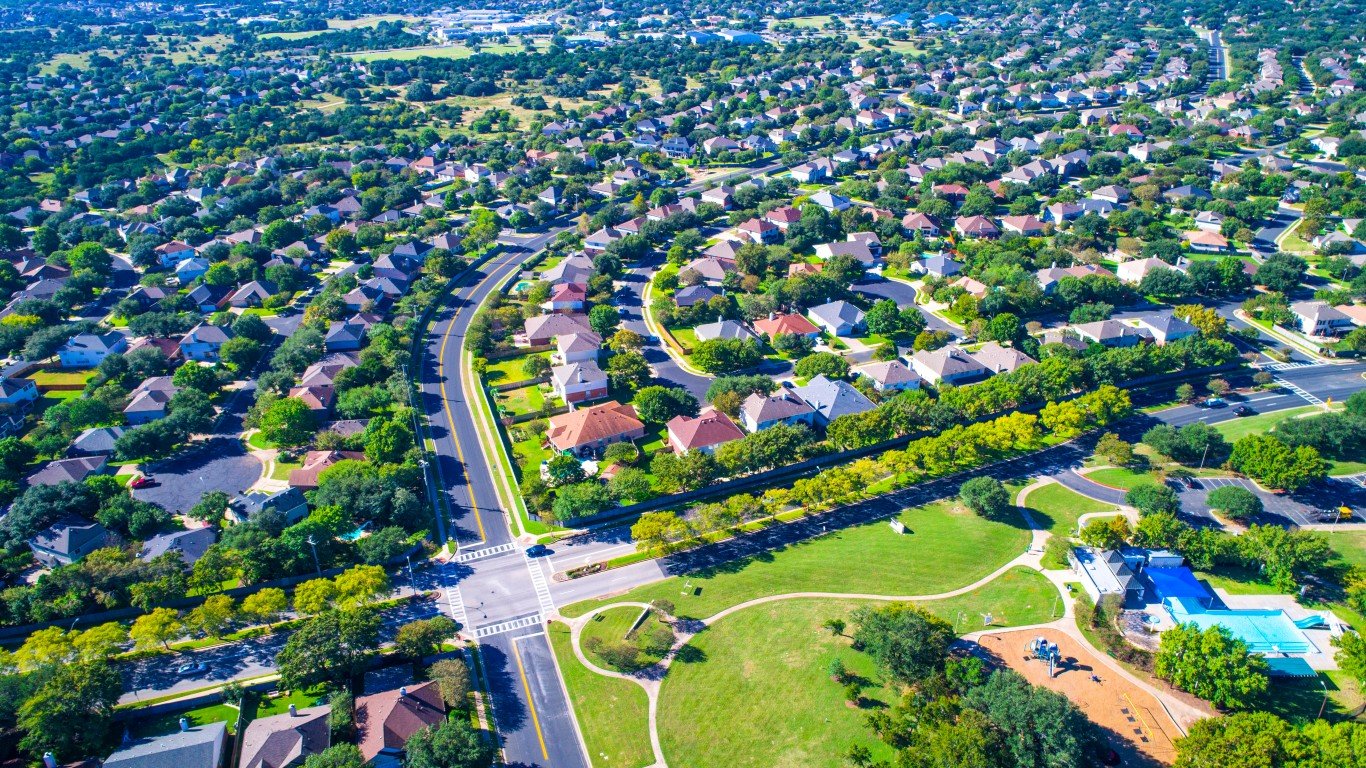
20. Austin-Round Rock, TX
> 2018 traffic fatalities per 100,000 people: 10.2 (state: 12.6)
> Avg. commute time: 27.7 mins.
> 2017 hours lost due to congestion per car: 64.2 hours
> Most dangerous road: I-35
[in-text-ad]
Source: Jupiterimages / Stockbyte via Getty Images
19. Lake Charles, LA
> 2018 traffic fatalities per 100,000 people: 17.2 (state: 16.5)
> Avg. commute time: N/A
> 2017 hours lost due to congestion per car: 32.0 hours
> Most dangerous road: I-10
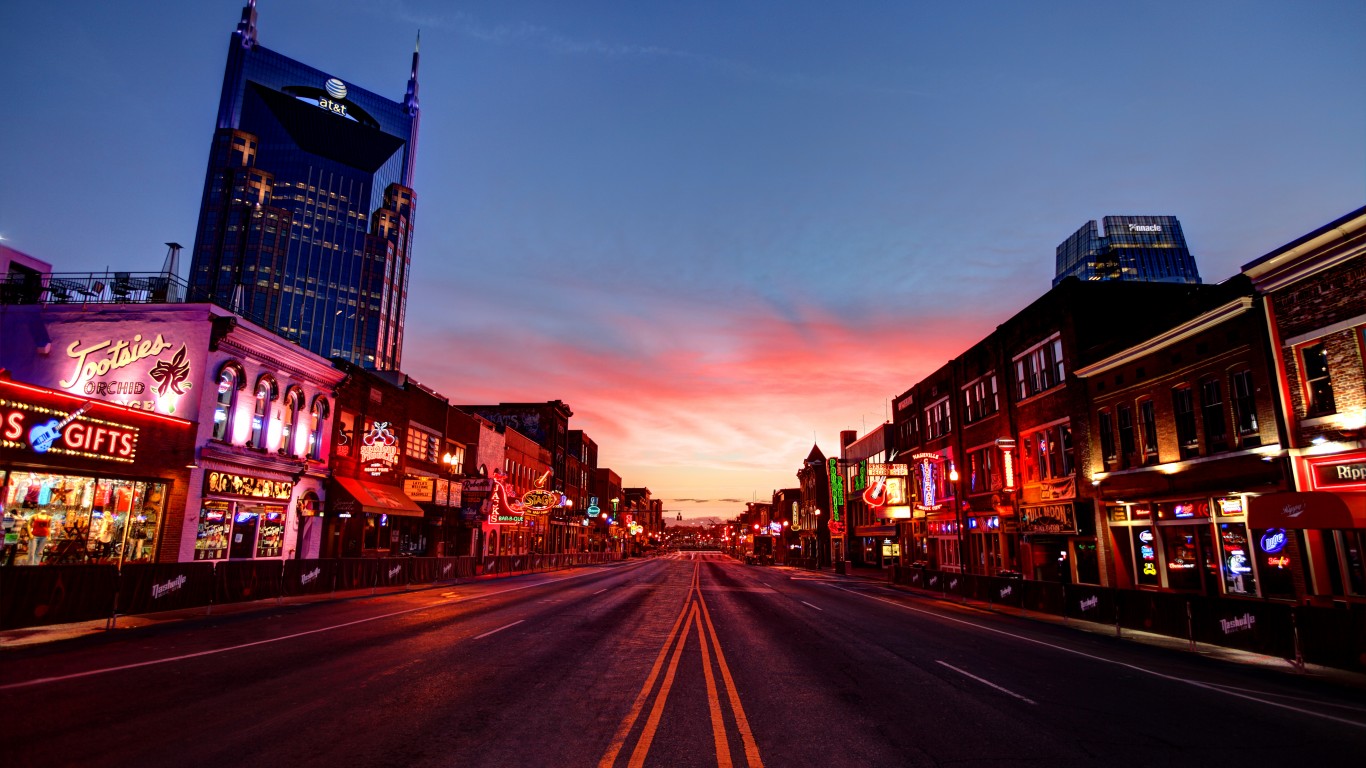
Source: DenisTangneyJr / E+ via Getty Images
18. Nashville-Davidson–Murfreesboro–Franklin, TN
> 2018 traffic fatalities per 100,000 people: 11.5 (state: 15.2)
> Avg. commute time: 28.5 mins.
> 2017 hours lost due to congestion per car: 58.0 hours
> Most dangerous road: I-24
Source: Peeter Viisimaa / Getty Images
17. Columbia, SC
> 2018 traffic fatalities per 100,000 people: 18.8 (state: 20.1)
> Avg. commute time: 25.1 mins.
> 2017 hours lost due to congestion per car: 44.0 hours
> Most dangerous road: I-20
[in-text-ad-2]
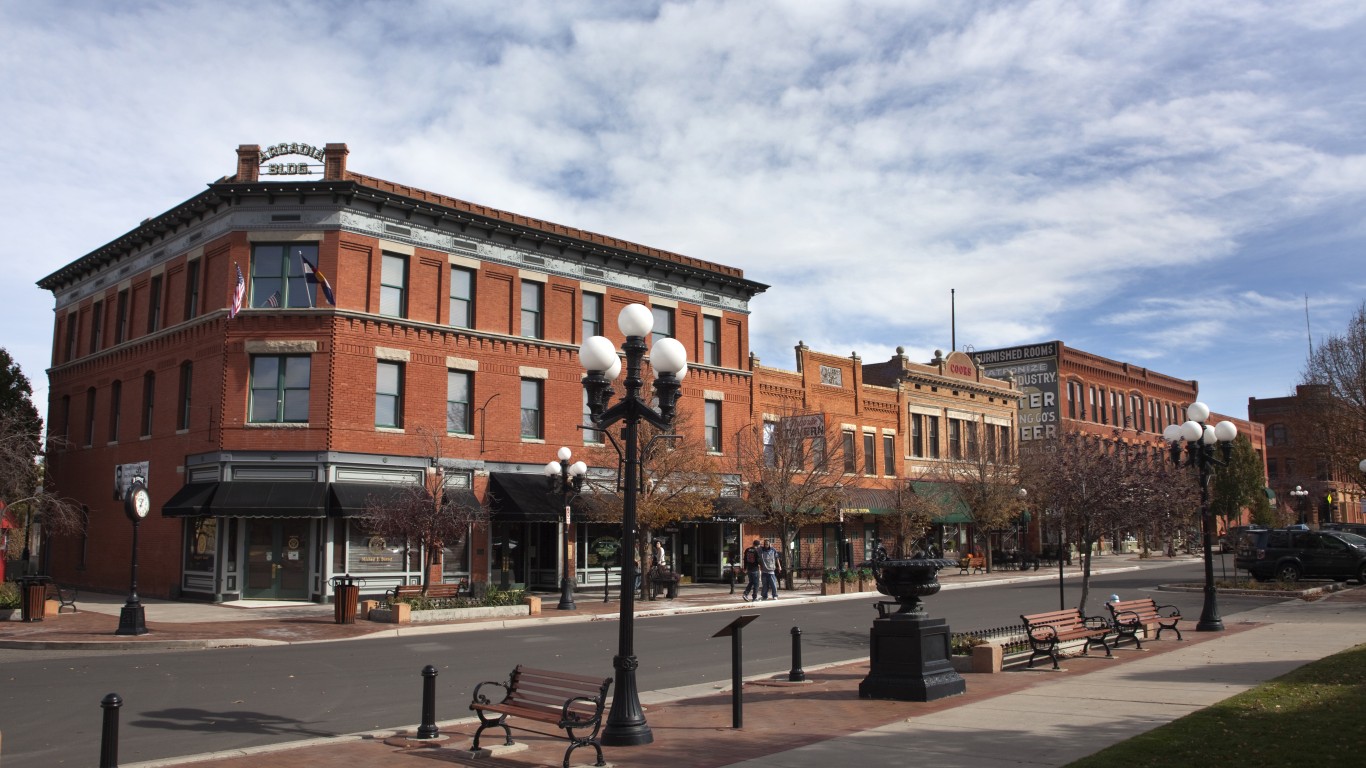
Source: milehightraveler / iStock via Getty Images
16. Pueblo, CO
> 2018 traffic fatalities per 100,000 people: 21.4 (state: 11.0)
> Avg. commute time: 21.9 mins.
> 2017 hours lost due to congestion per car: 20.0 hours
> Most dangerous road: I-25
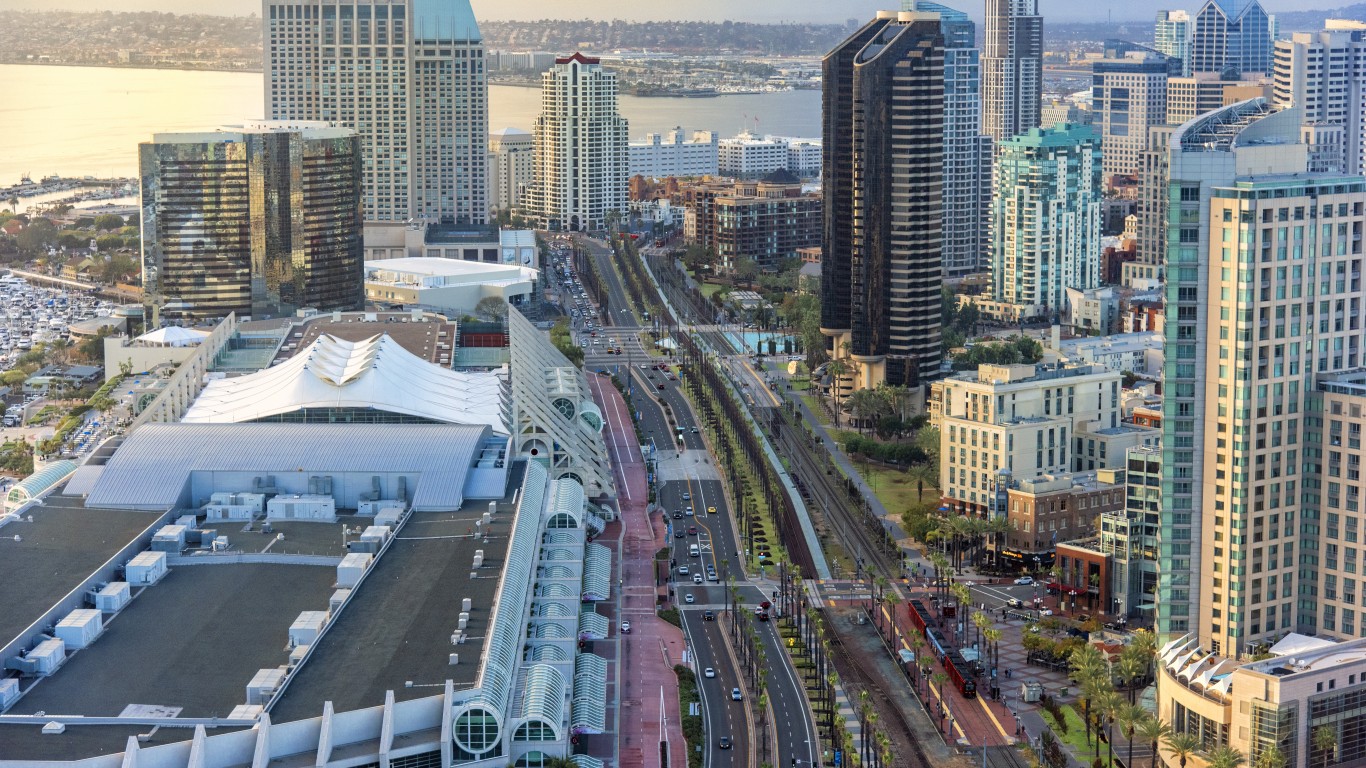
Source: Art Wager / E+ via Getty Images
15. San Diego-Carlsbad, CA
> 2018 traffic fatalities per 100,000 people: 7.6 (state: 9.0)
> Avg. commute time: 27.2 mins.
> 2017 hours lost due to congestion per car: 64.0 hours
> Most dangerous road: I-8
[in-text-ad]
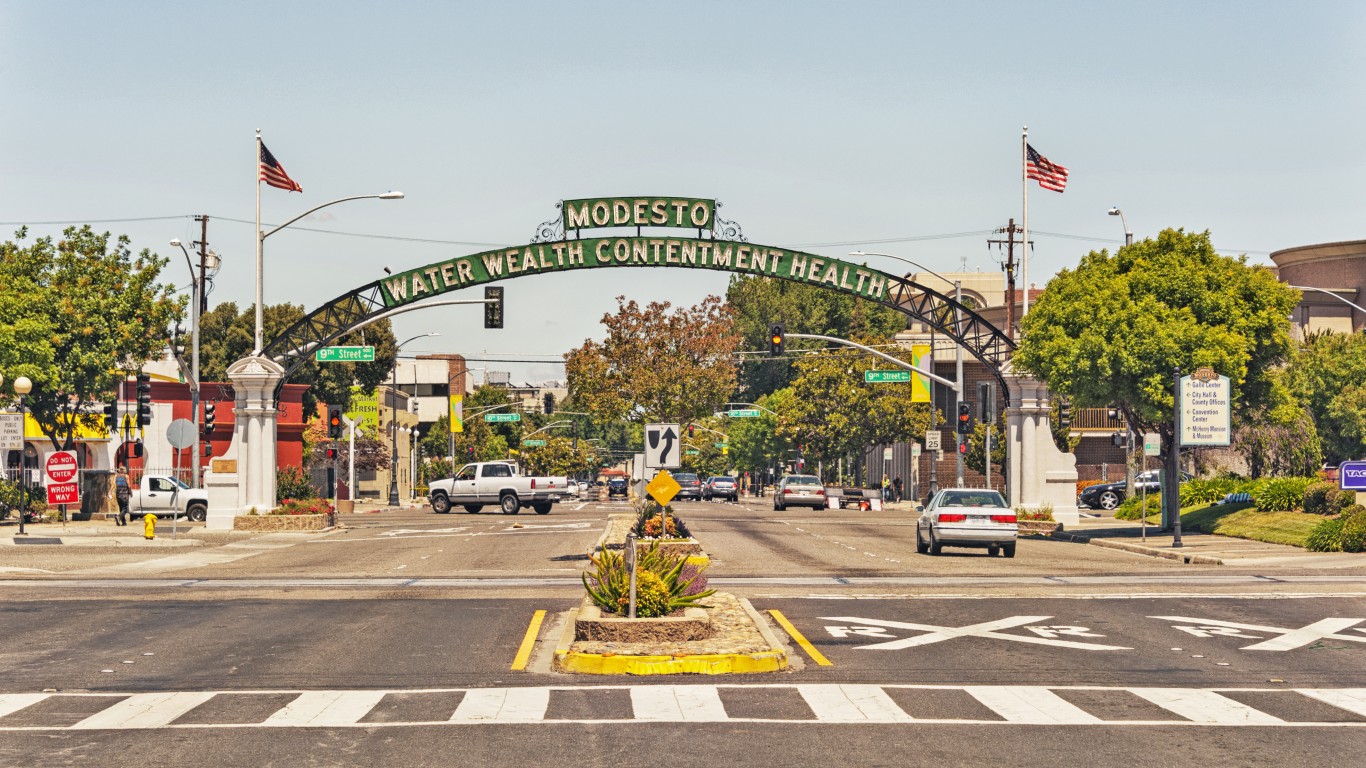
Source: jmoor17 / iStock Unreleased via Getty Images
14. Modesto, CA
> 2018 traffic fatalities per 100,000 people: 15.1 (state: 9.0)
> Avg. commute time: 31.7 mins.
> 2017 hours lost due to congestion per car: 29.8 hours
> Most dangerous road: SR-99

13. Albuquerque, NM
> 2018 traffic fatalities per 100,000 people: 15.0 (state: 18.6)
> Avg. commute time: 24.4 mins.
> 2017 hours lost due to congestion per car: 41.1 hours
> Most dangerous road: I-25
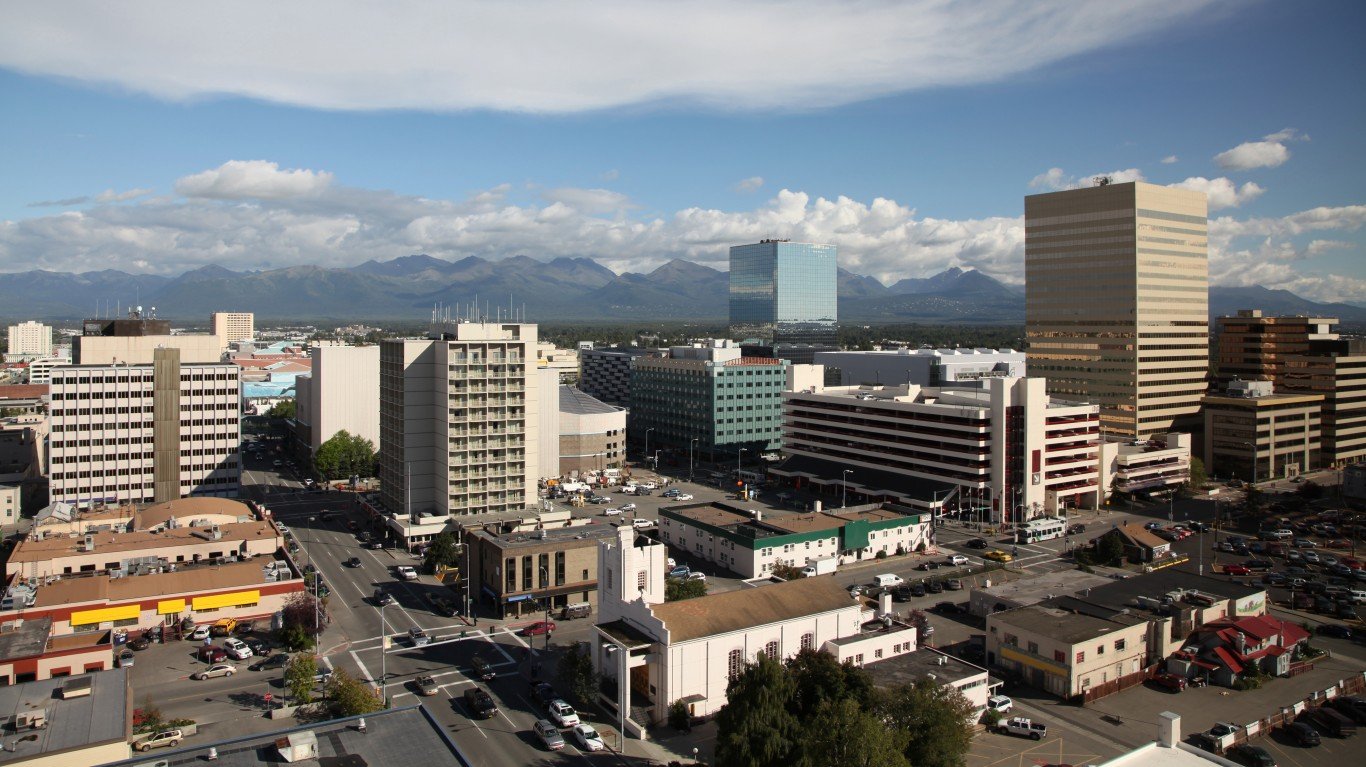
Source: yenwen / E+ via Getty Images
12. Anchorage, AK
> 2018 traffic fatalities per 100,000 people: 12.1 (state: 10.9)
> Avg. commute time: 23.1 mins.
> 2017 hours lost due to congestion per car: 42.0 hours
> Most dangerous road: SR-3 PARKS HWY
[in-text-ad-2]
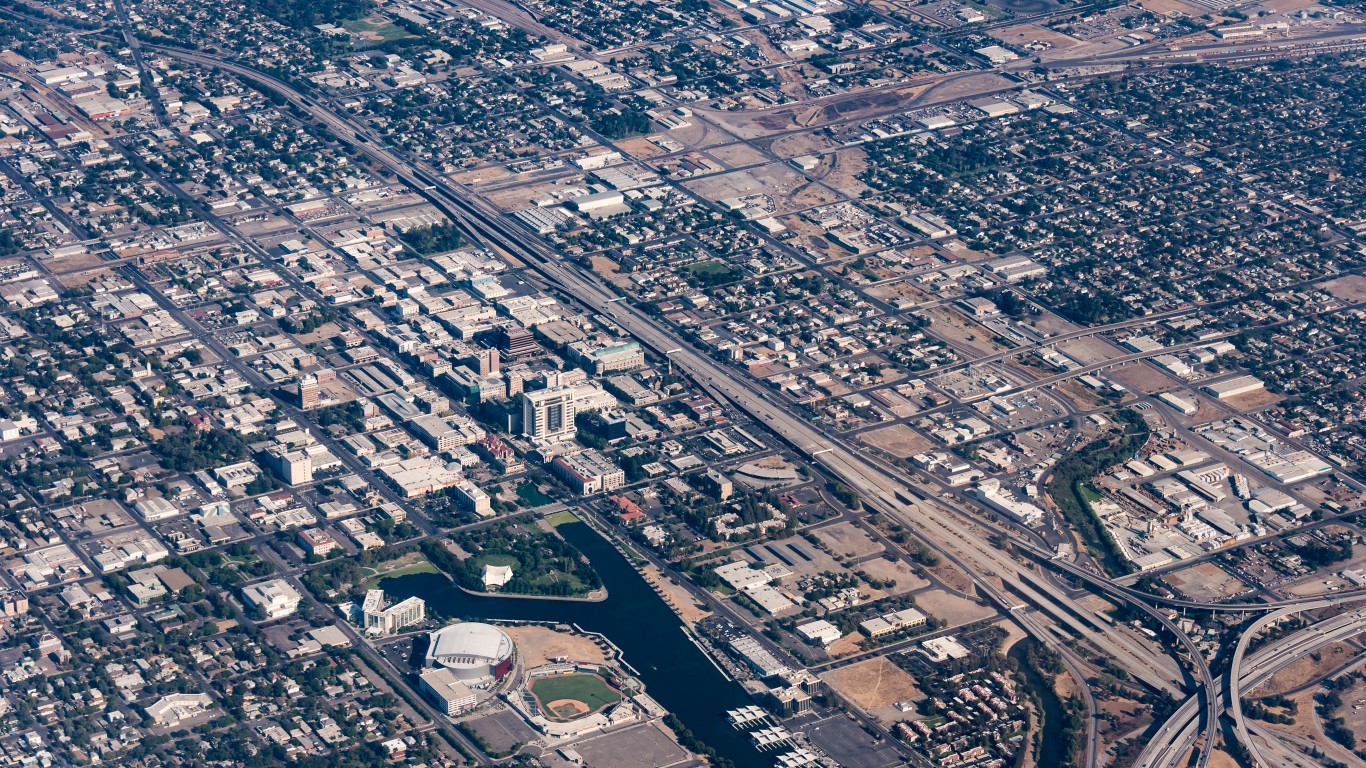
Source: Bill_Dally / Getty Images
11. Stockton-Lodi, CA
> 2018 traffic fatalities per 100,000 people: 14.0 (state: 9.0)
> Avg. commute time: 36.3 mins.
> 2017 hours lost due to congestion per car: 33.7 hours
> Most dangerous road: I-5
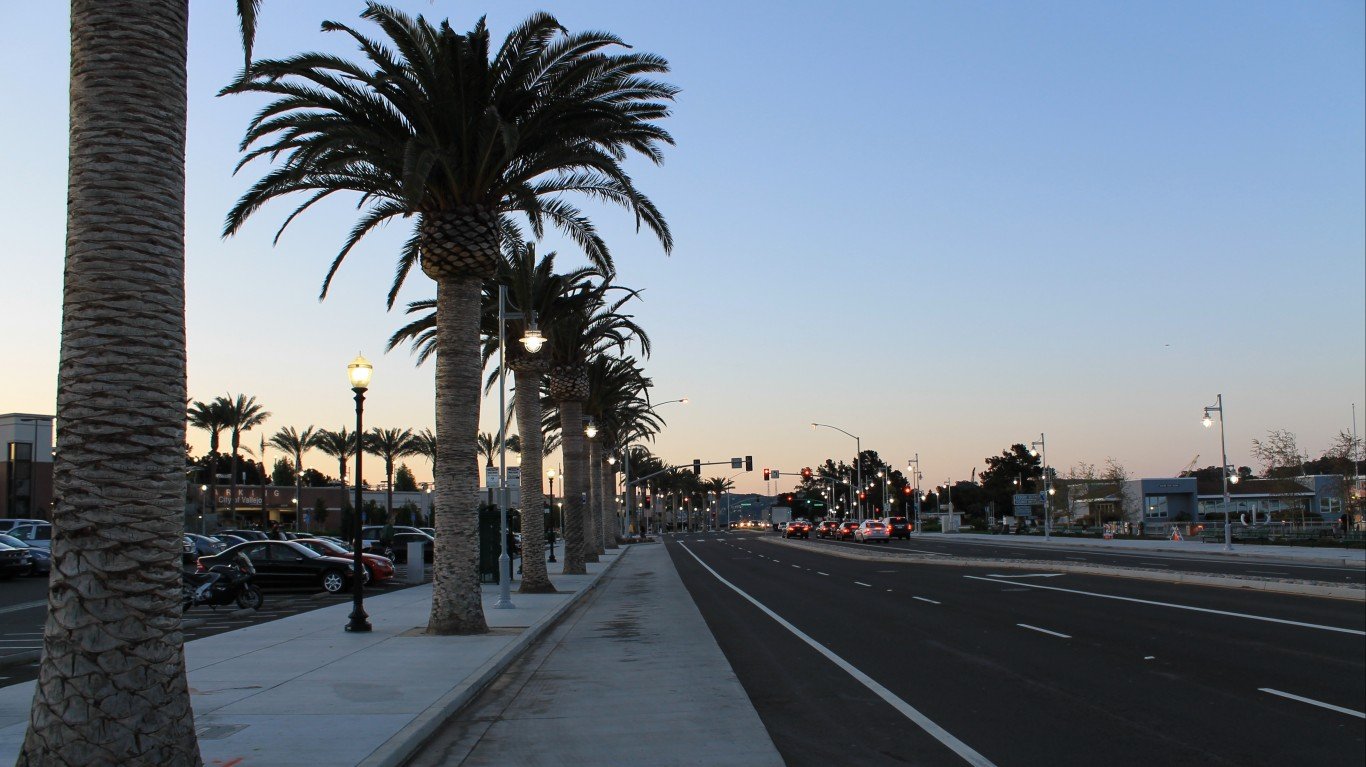
Source: patrick_nouhailler / Flickr
10. Vallejo-Fairfield, CA
> 2018 traffic fatalities per 100,000 people: 12.5 (state: 9.0)
> Avg. commute time: 34.7 mins.
> 2017 hours lost due to congestion per car: 37.6 hours
> Most dangerous road: I-80
[in-text-ad]
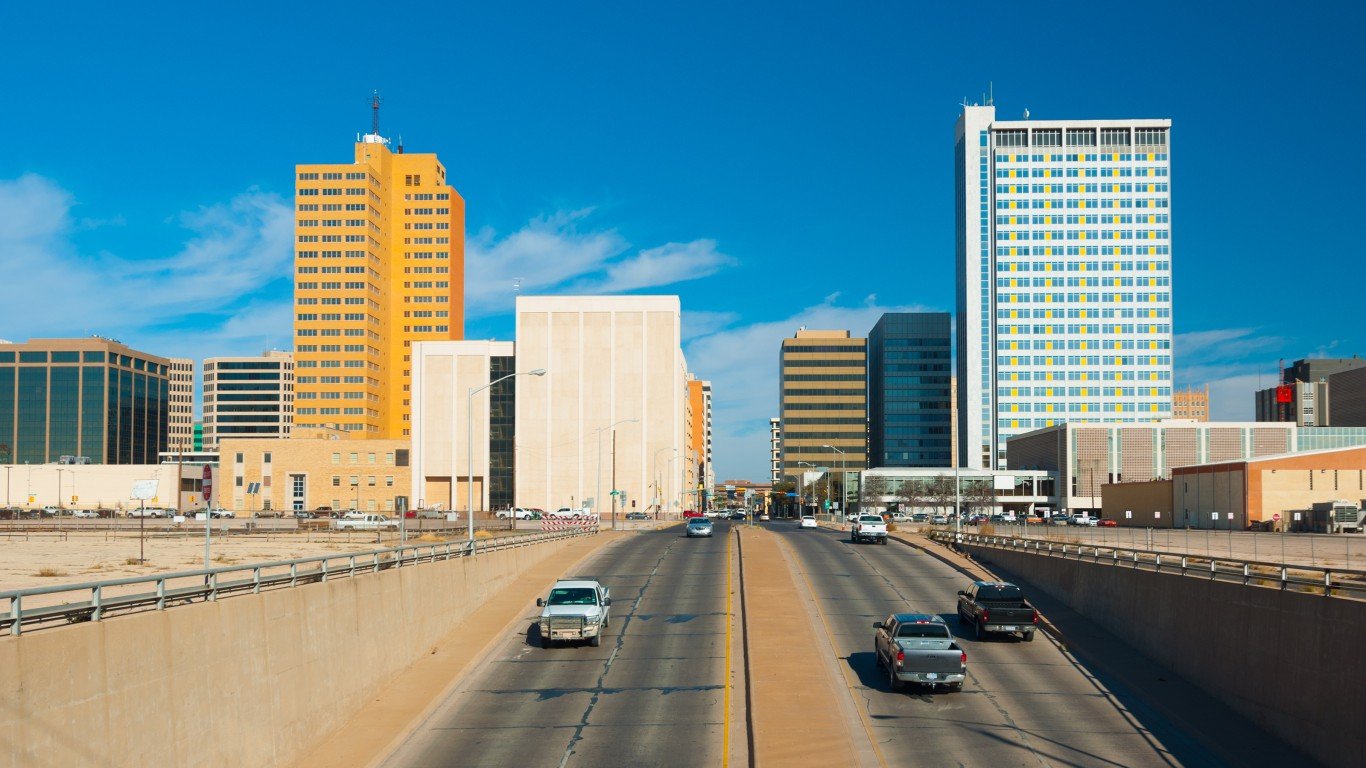
Source: Davel5957 / iStock via Getty Images
9. Midland, TX
> 2018 traffic fatalities per 100,000 people: 32.3 (state: 12.6)
> Avg. commute time: N/A
> 2017 hours lost due to congestion per car: 22.0 hours
> Most dangerous road: SR-191
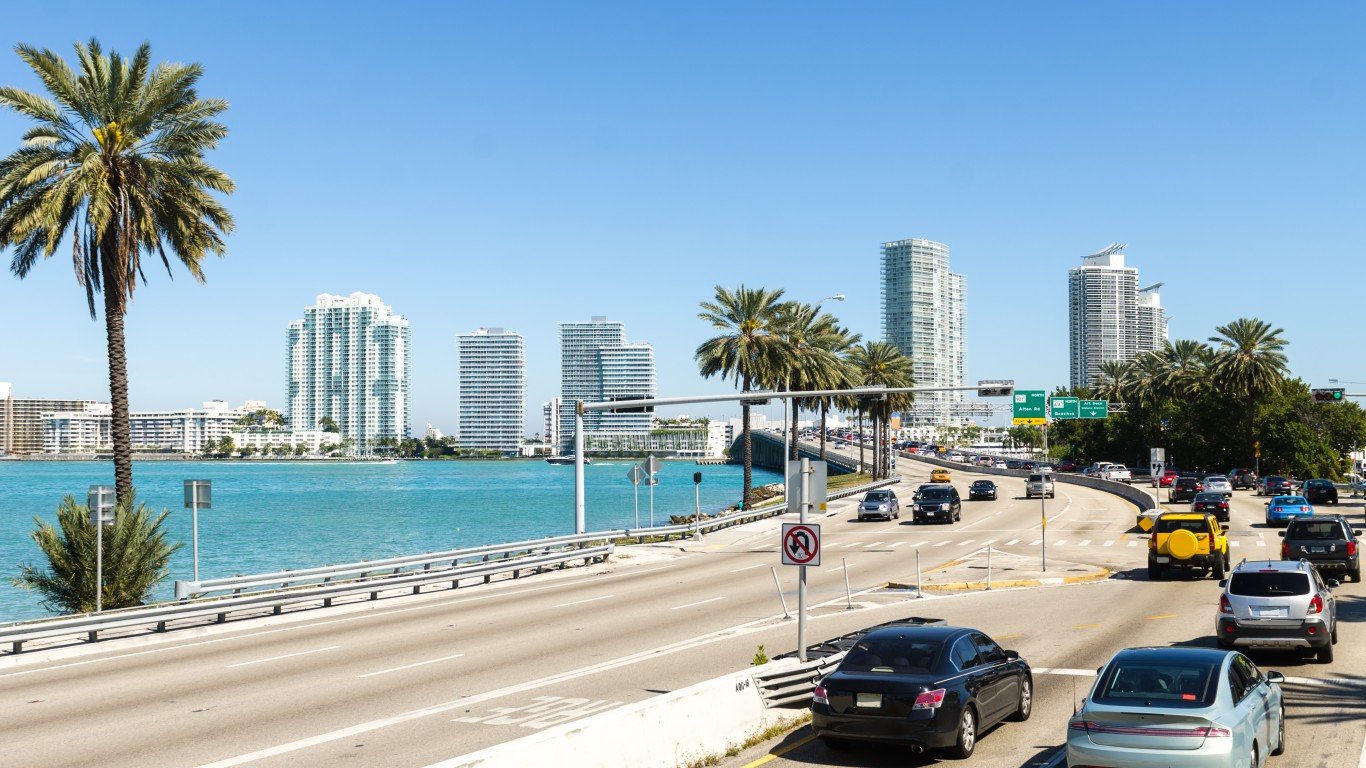
Source: Flory / iStock via Getty Images
8. Miami-Fort Lauderdale-West Palm Beach, FL
> 2018 traffic fatalities per 100,000 people: 11.5 (state: 14.6)
> Avg. commute time: 30.3 mins.
> 2017 hours lost due to congestion per car: 69.0 hours
> Most dangerous road: I-95
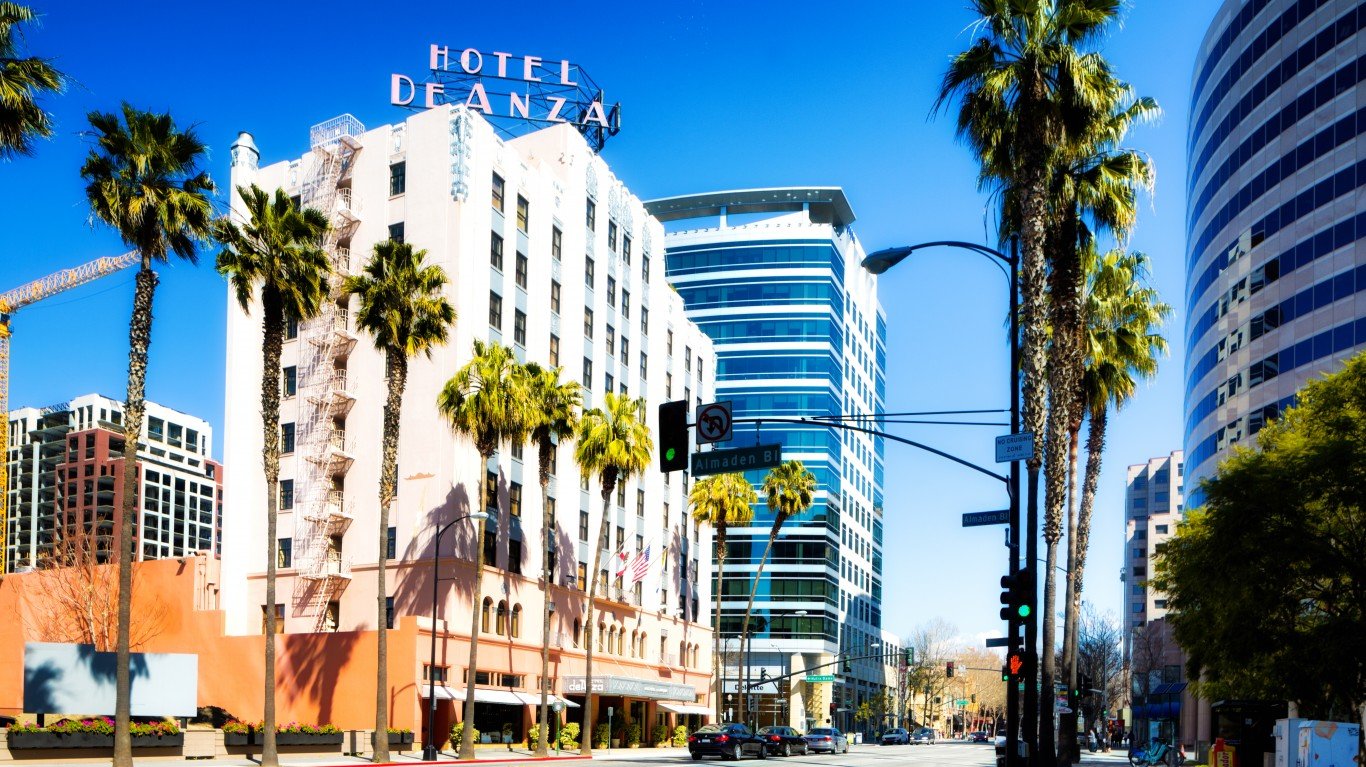
Source: NicolasMcComber / Getty Images
7. San Jose-Sunnyvale-Santa Clara, CA
> 2018 traffic fatalities per 100,000 people: 6.2 (state: 9.0)
> Avg. commute time: 30.3 mins.
> 2017 hours lost due to congestion per car: 81.0 hours
> Most dangerous road: US-101
[in-text-ad-2]
Source: felixmizioznikov / Getty Images
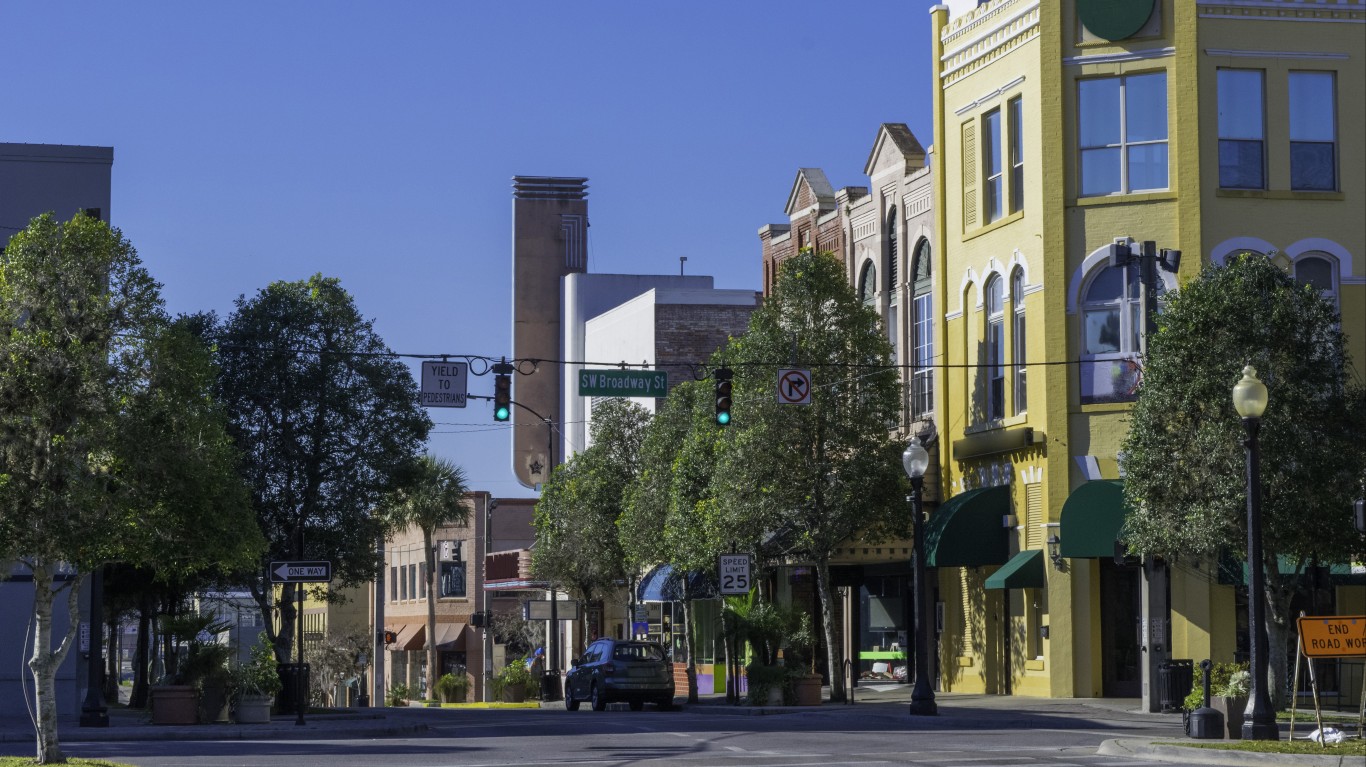
6. Florence, SC
> 2018 traffic fatalities per 100,000 people: 30.7 (state: 20.1)
> Avg. commute time: N/A
> 2017 hours lost due to congestion per car: 27.0 hours
> Most dangerous road: US-52

5. Houston-The Woodlands-Sugar Land, TX
> 2018 traffic fatalities per 100,000 people: 8.4 (state: 12.6)
> Avg. commute time: 30.7 mins.
> 2017 hours lost due to congestion per car: 73.3 hours
> Most dangerous road: I-45
[in-text-ad]
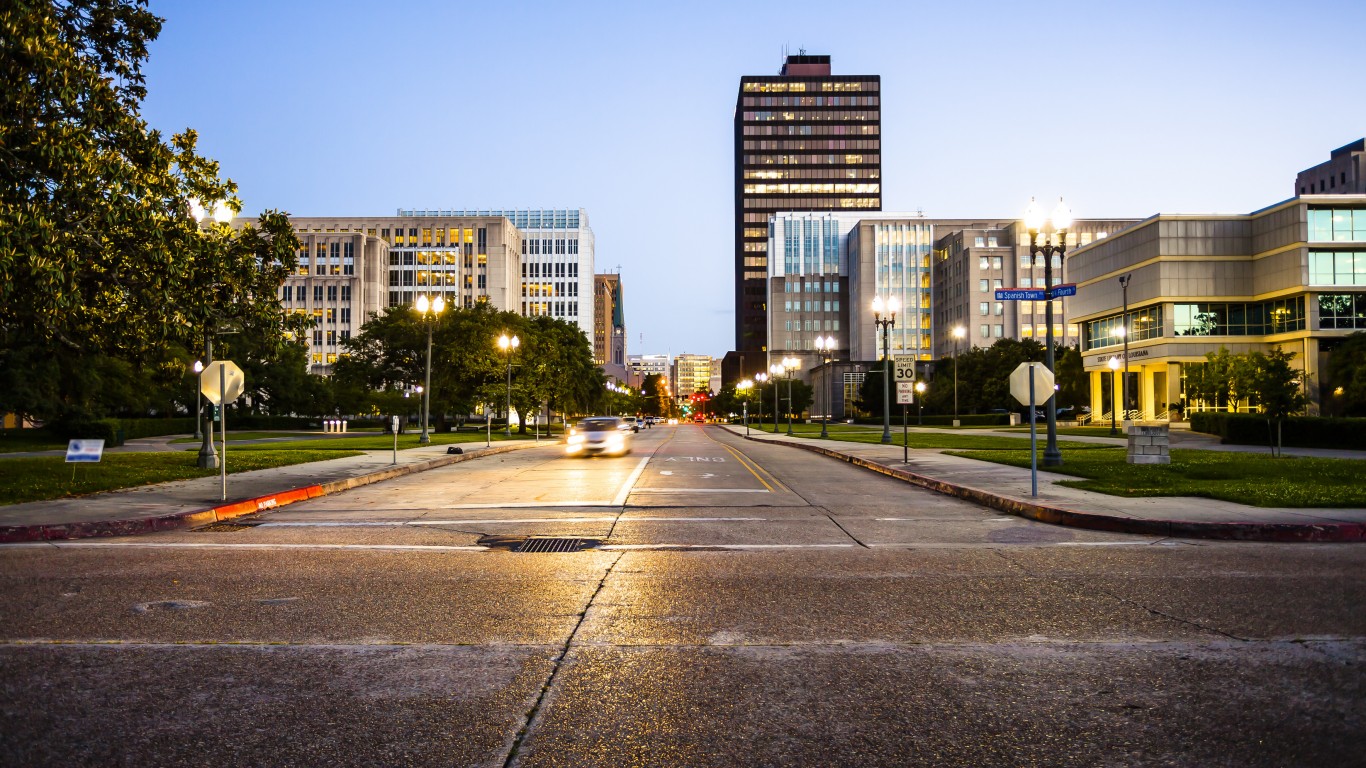
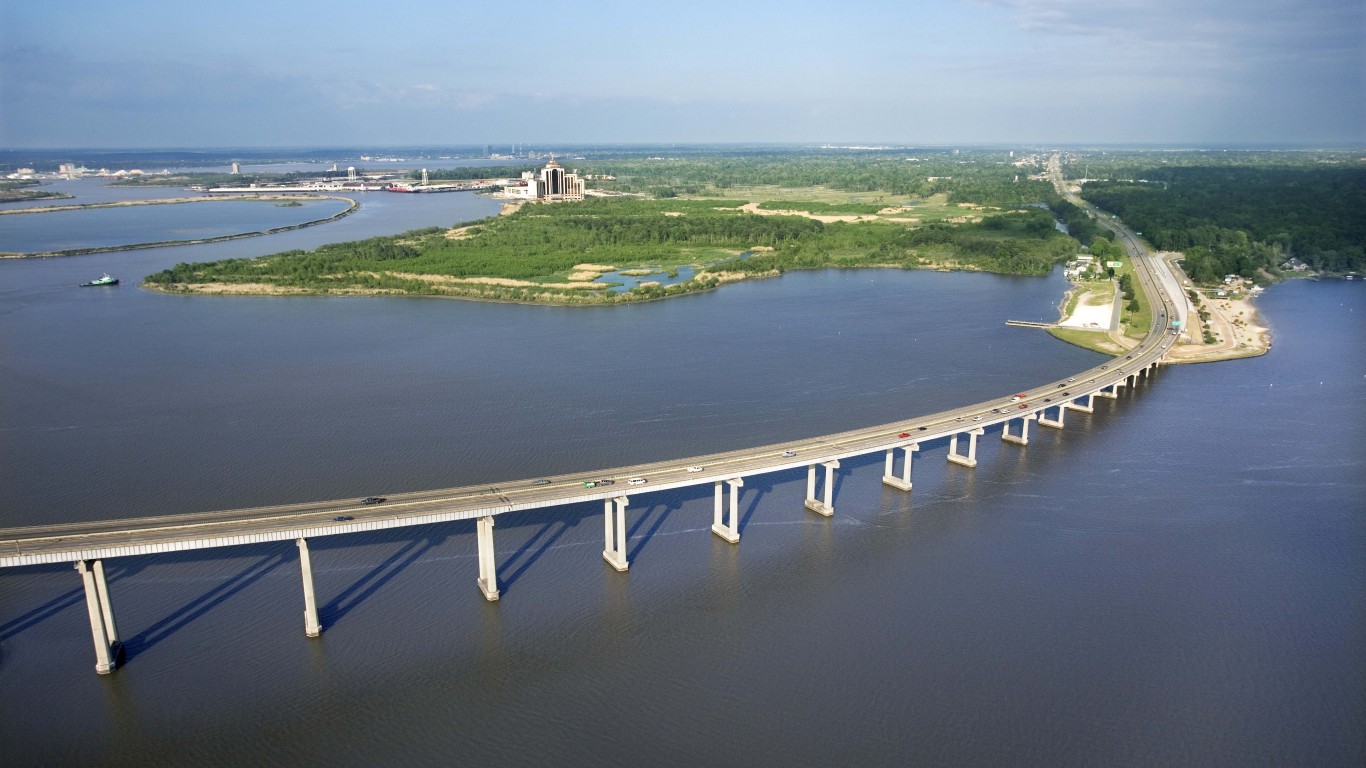
Source: CrackerClips / iStock via Getty Images
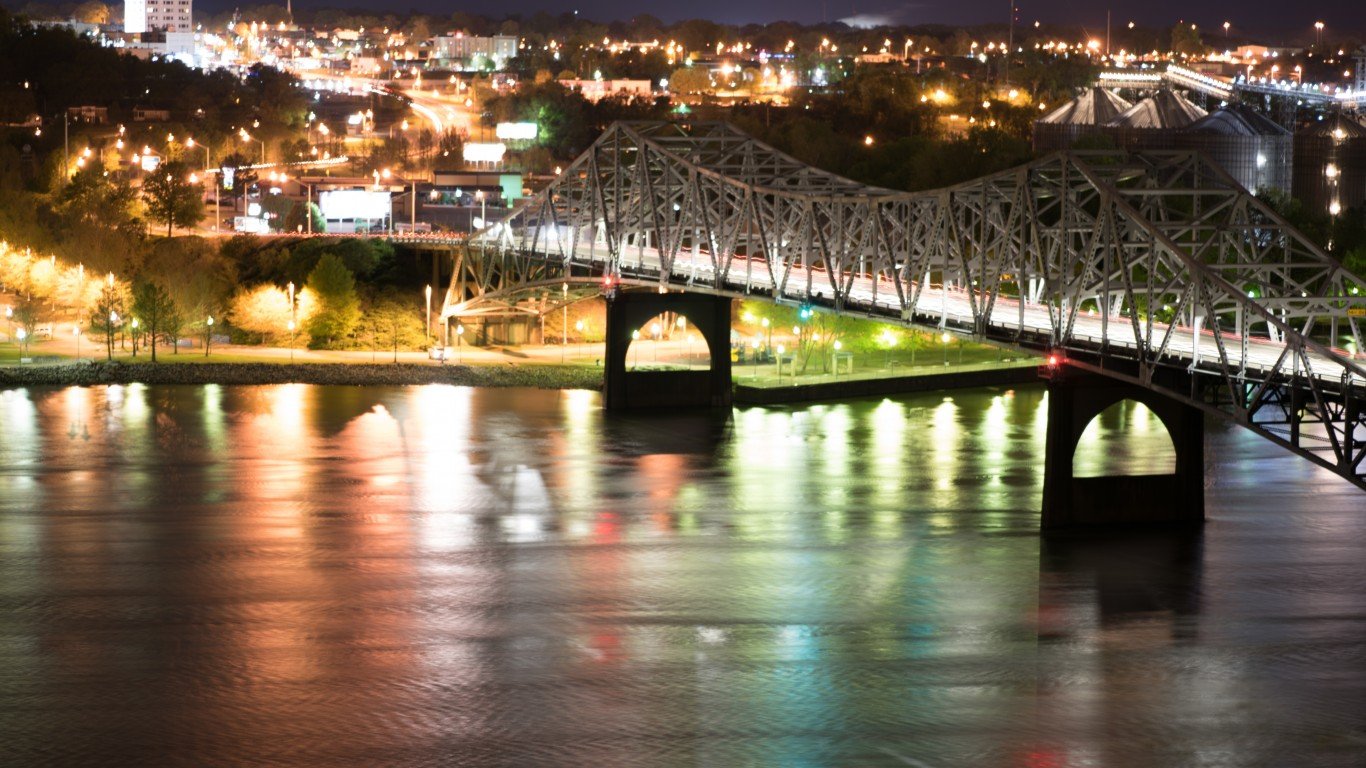
4. Baton Rouge, LA
> 2018 traffic fatalities per 100,000 people: 20.7 (state: 16.5)
> Avg. commute time: 27.2 mins.
> 2017 hours lost due to congestion per car: 58.0 hours
> Most dangerous road: US-61
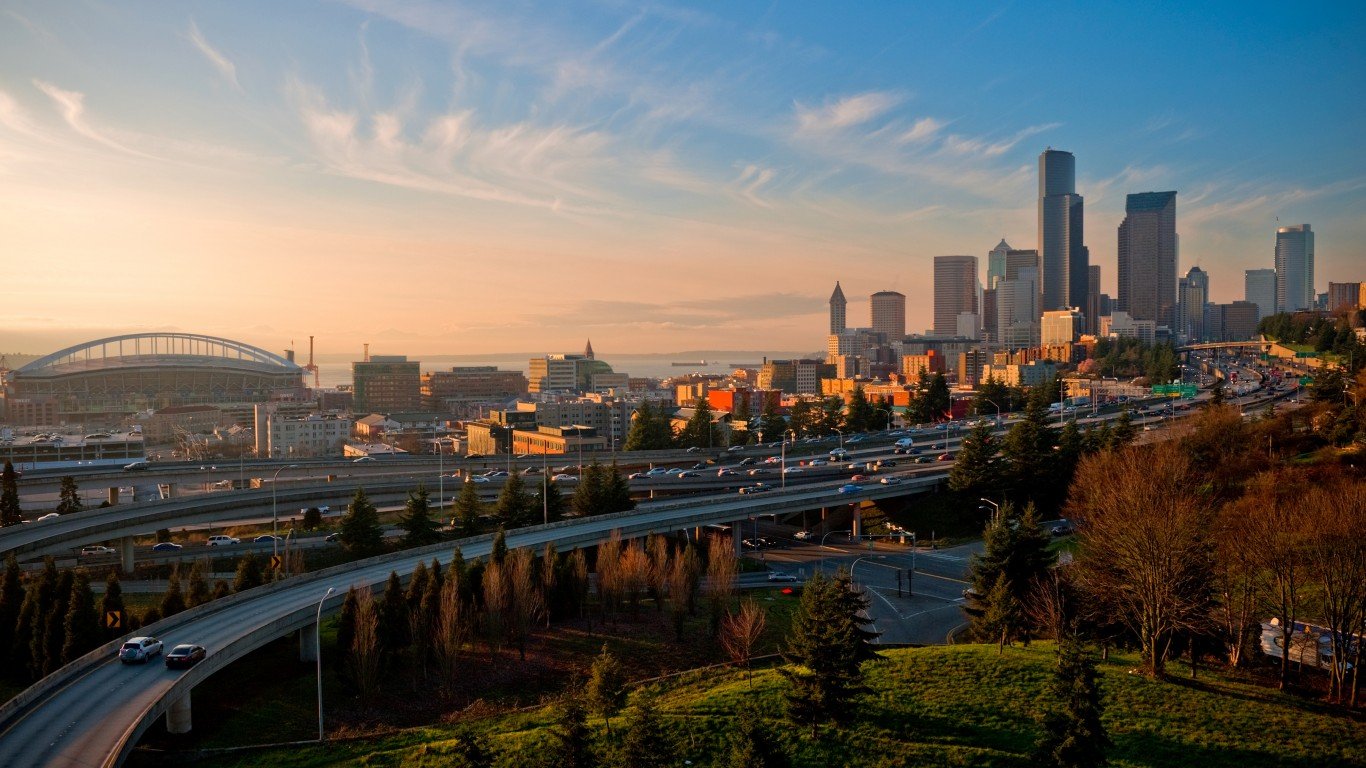
Source: LoweStock / iStock via Getty Images
3. Seattle-Tacoma-Bellevue, WA
> 2018 traffic fatalities per 100,000 people: 5.6 (state: 7.2)
> Avg. commute time: 31.6 mins.
> 2017 hours lost due to congestion per car: 75.5 hours
> Most dangerous road: I-5
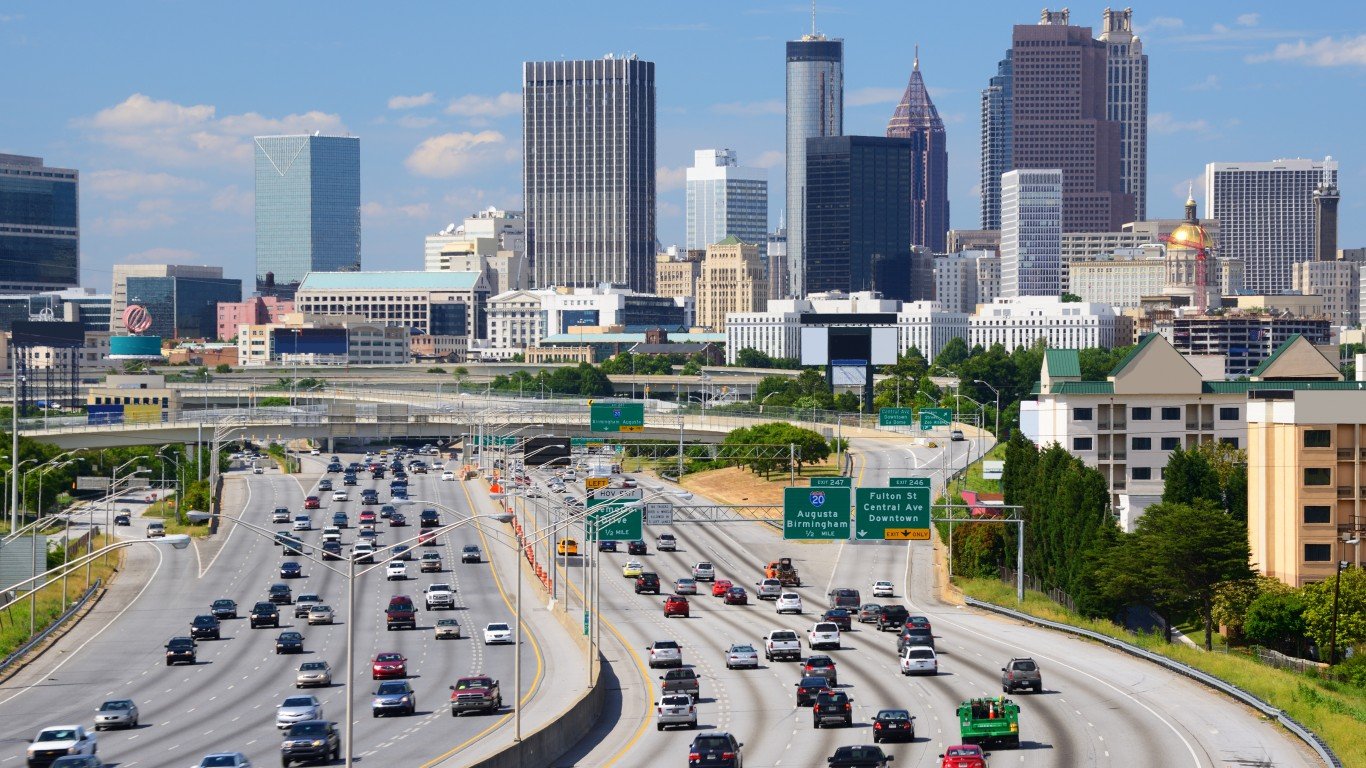
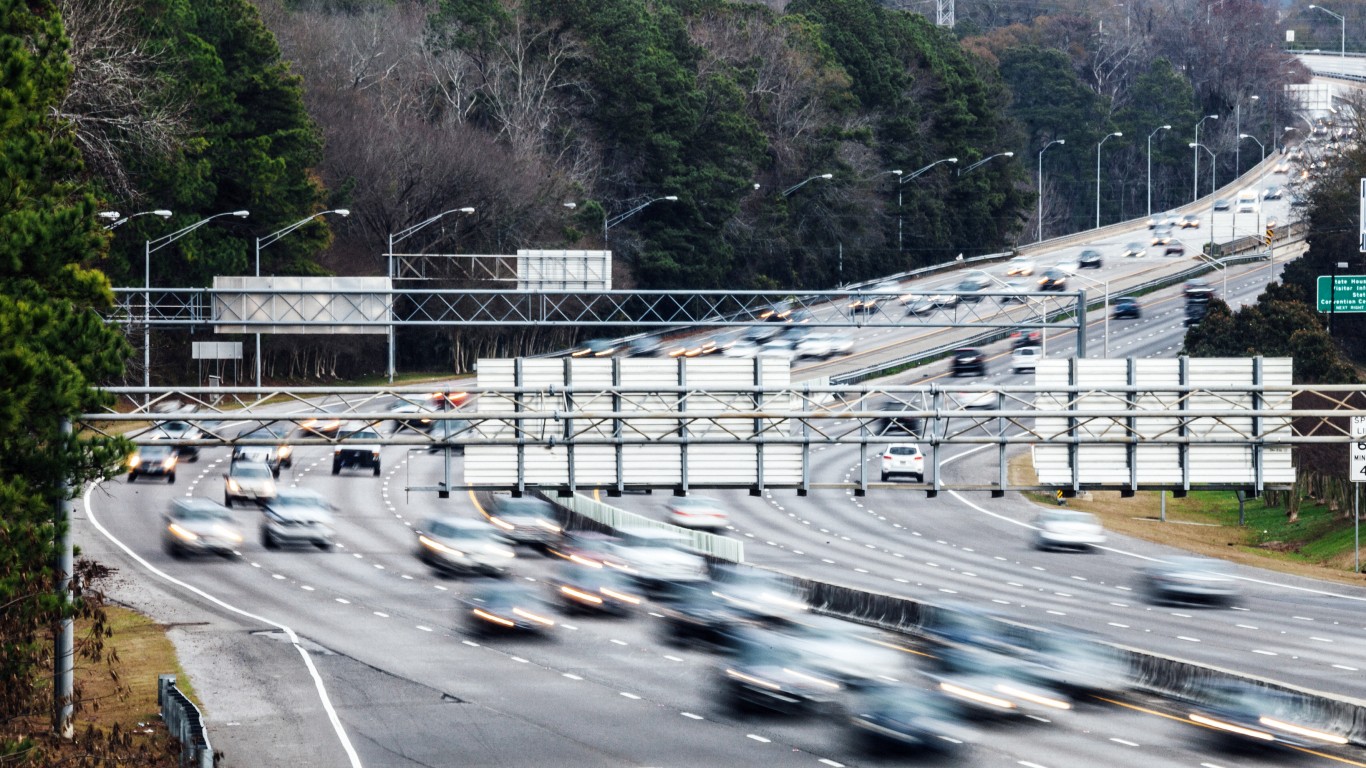
Source: SeanPavonePhoto / iStock via Getty Images
2. Atlanta-Sandy Springs-Roswell, GA
> 2018 traffic fatalities per 100,000 people: 11.7 (state: 14.2)
> Avg. commute time: 32.5 mins.
> 2017 hours lost due to congestion per car: 76.3 hours
> Most dangerous road: I-75
[in-text-ad-2]
Source: DenisTangneyJr / iStock via Getty Images
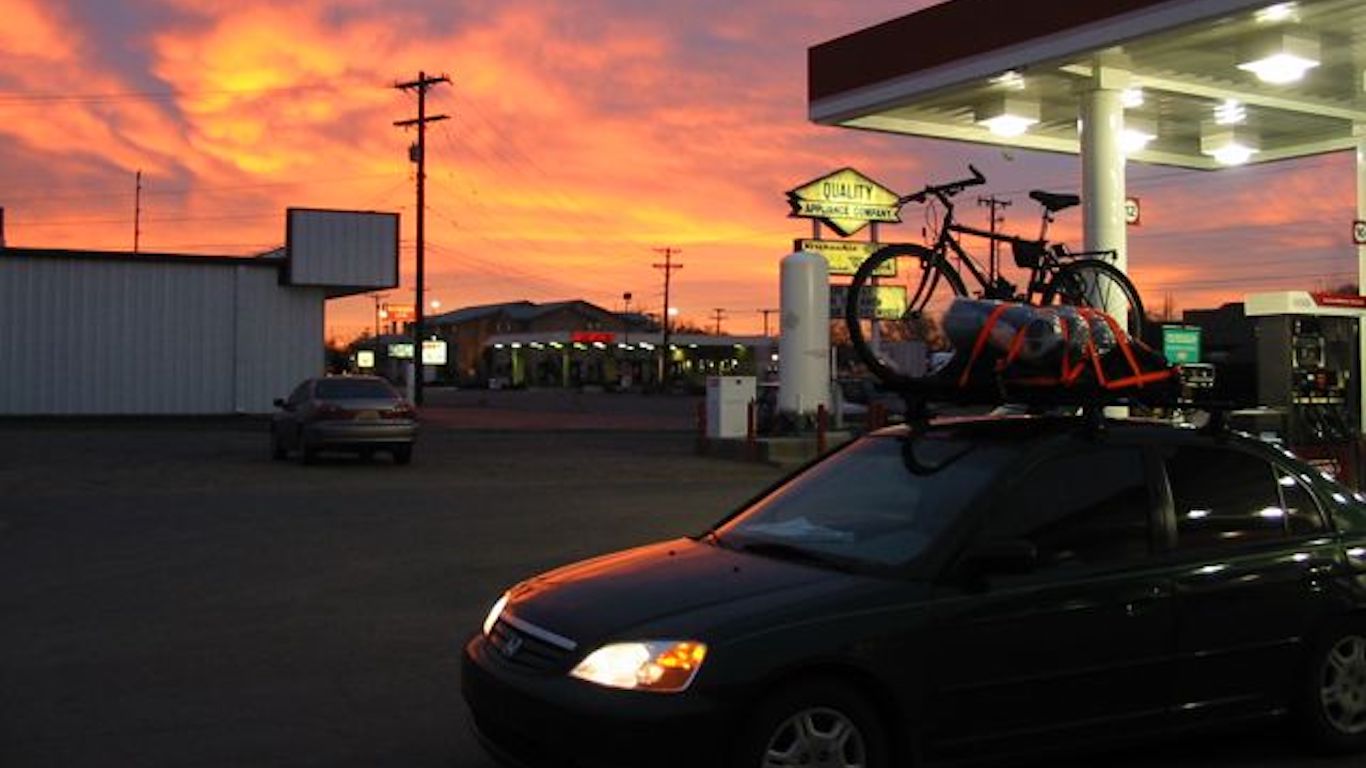
1. Odessa, TX
> 2018 traffic fatalities per 100,000 people: 33.7 (state: 12.6)
> Avg. commute time: N/A
> 2017 hours lost due to congestion per car: 31.0 hours
> Most dangerous road: I-20
Methodology
To identify the worst cities to drive in every state, 24/7 Wall St. created an index based on measures of safety, cost, and the convenience of driving, normalized to be comparable with one another. Total traffic fatalities and traffic fatalities involving drunk drivers per 100,000 are from the Fatality Analysis Reporting System (FARS) for 2018. Mean travel time to work and the percentage of the working-age population with a commute of 60 minutes or longer came from the American Community Survey (ACS) 2019 1-year estimates. The rate of car thefts per 100,000 people is from the National Insurance Crime Bureau (NICB) Hot Spots report for the year 2018. The average price of gasoline from second quarter of 2017 to second quarter of 2018 is from the Council for Community and Economic Research’s (C2ER) cost of living index for metropolitan statistical areas. Hours lost due to congestion per car came from the Texas A&M 2019 Urban Mobility Report, which features data from 2017.
Essential Tips for Investing: Sponsored
A financial advisor can help you understand the advantages and disadvantages of investment properties. Finding a qualified financial advisor doesn’t have to be hard. SmartAsset’s free tool matches you with up to three financial advisors who serve your area, and you can interview your advisor matches at no cost to decide which one is right for you. If you’re ready to find an advisor who can help you achieve your financial goals, get started now.
Investing in real estate can diversify your portfolio. But expanding your horizons may add additional costs. If you’re an investor looking to minimize expenses, consider checking out online brokerages. They often offer low investment fees, helping you maximize your profit.
Thank you for reading! Have some feedback for us?
Contact the 24/7 Wall St. editorial team.
Editors' Picks