
While some of the jobs lost in the early months of the COVID-19 pandemic have since returned, it appears the job market is in decline again. More than 850,000 Americans filed for initial jobless assistance during the week ending Dec. 5. And nearly 5.8 million Americans received unemployment benefits after their initial claim in the week ending Nov. 28 — up nearly a quarter of a million people compared to the week before, marking the first increase since August.
Much like the coronavirus itself, rises in unemployment claims are more common in certain parts of the country. Every state but one has at least one major metro area where there were fewer people working in October — the most recent month for which data is available — compared to February, the month before President Donald Trump declared a state of emergency.
To identify the American cities losing the most jobs, 24/7 Wall St. reviewed the percentage change in total employment from February to October 2020 in U.S. metro areas, using data from the Bureau of Labor Statistics.
Many of the cities on this list are tourist destinations that had previously relied on visitors to fuel their economy. With health officials discouraging travel and large events being canceled worldwide, tourism has ground to a halt. Event staff, hotel workers, restaurant workers and others in the industry have lost jobs at least in part because of the decline in tourism. These are the latest COVID-19 travel restrictions in every state.
Delaware, New Hampshire, Rhode Island, and Vermont have only one metro area, and as a result, the metro area listed for each of these states as losing the most jobs is listed by default. Alaska has just two metro areas, both of which have actually added jobs amid the pandemic. As a result, neither metro area was included for the state.
Click here to see the cities losing the most jobs in every state.
Click here to read our detailed methodology.

Source: Public Domain / Wikimedia Commons
Alabama: Gadsden
> Employment change, Feb to Oct 2020 -7.0% (-2,912 jobs)
> Oct. 2020 unemployment rate: 6.8%
> Median household income: $41,447
> Poverty rate: 19.7%
> 2019 population: 102,268
[in-text-ad]

Source: sorincolac / Getty Images
Alaska: Alaska: no city with employment decline
 24/7 Wall St.
Source: miroslav_1 / Getty Images
Arizona: Flagstaff
> Employment change, Feb to Oct 2020 -16.9% (-12,532 jobs)
> Oct. 2020 unemployment rate: 10.2%
> Median household income: $58,085
> Poverty rate: 15.8%
> 2019 population: 143,476

Source: Sean Pavone / Getty Images
Arkansas: Little Rock-North Little Rock-Conway
> Employment change, Feb to Oct 2020 -7.3% (-25,328 jobs)
> Oct. 2020 unemployment rate: 6.8%
> Median household income: $56,849
> Poverty rate: 13.8%
> 2019 population: 744,483
[in-text-ad-2]

Source: Solidago / Getty Images
California: Salinas
> Employment change, Feb to Oct 2020 -18.7% (-39,504 jobs)
> Oct. 2020 unemployment rate: 10.3%
> Median household income: $77,514
> Poverty rate: 12.7%
> 2019 population: 434,061

Source: marekuliasz / Getty Images
Colorado: Fort Collins
> Employment change, Feb to Oct 2020 -8.2% (-16,948 jobs)
> Oct. 2020 unemployment rate: 5.5%
> Median household income: $75,186
> Poverty rate: 11.3%
> 2019 population: 356,899
[in-text-ad]

Source: connerscott1 / Getty Images
Connecticut: Norwich-New London-Westerly
> Employment change, Feb to Oct 2020 -8.2% (-11,343 jobs)
> Oct. 2020 unemployment rate: 7.1%
> Median household income: $75,633
> Poverty rate: 7.2%
> 2019 population: 265,206
 24/7 Wall St.
Source: Ataraxy22 / Wikimedia Commons
Delaware: Dover
> Employment change, Feb to Oct 2020 -1.6% (-1,240 jobs)
> Oct. 2020 unemployment rate: 6.2%
> Median household income: $58,001
> Poverty rate: 13.0%
> 2019 population: 180,786

Source: LUNAMARINA / Getty Images
Florida: Orlando-Kissimmee-Sanford
> Employment change, Feb to Oct 2020 -11.2% (-150,419 jobs)
> Oct. 2020 unemployment rate: 8.2%
> Median household income: $61,876
> Poverty rate: 12.1%
> 2019 population: 2,608,147
[in-text-ad-2]

Source: akaplummer / Getty Images
Georgia: Brunswick
> Employment change, Feb to Oct 2020 -11.4% (-5,842 jobs)
> Oct. 2020 unemployment rate: 4.2%
> Median household income: $57,381
> Poverty rate: 14.1%
> 2019 population: 119,122

Source: unclegene / Getty Images
Hawaii: Kahului-Wailuku-Lahaina
> Employment change, Feb to Oct 2020 -23.8% (-20,184 jobs)
> Oct. 2020 unemployment rate: 22.3%
> Median household income: $80,754
> Poverty rate: 11.9%
> 2019 population: 167,488
[in-text-ad]

Source: Ethan Prater from San Bruno, CA, USA / Wikimedia Commons
Idaho: Pocatello
> Employment change, Feb to Oct 2020 -6.6% (-2,770 jobs)
> Oct. 2020 unemployment rate: 5.5%
> Median household income: $51,612
> Poverty rate: 12.9%
> 2019 population: 94,588

Source: Ron_Thomas / Getty Images
Illinois: Chicago-Naperville-Elgin
> Employment change, Feb to Oct 2020 -7.7% (-359,977 jobs)
> Oct. 2020 unemployment rate: 8.0%
> Median household income: $75,379
> Poverty rate: 10.6%
> 2019 population: 9,457,867

Source: Tiago_Fernandez / iStock Editorial via Getty Images
Indiana: Elkhart-Goshen
> Employment change, Feb to Oct 2020 -6.8% (-7,421 jobs)
> Oct. 2020 unemployment rate: 4.7%
> Median household income: $54,531
> Poverty rate: 9.2%
> 2019 population: 206,341
[in-text-ad-2]

Source: cosmonaut / Getty Images
Iowa: Dubuque
> Employment change, Feb to Oct 2020 -8.9% (-4,982 jobs)
> Oct. 2020 unemployment rate: 4.0%
> Median household income: $62,178
> Poverty rate: 11.4%
> 2019 population: 97,311

Source: DenisTangneyJr / Getty Images
Kansas: Manhattan
> Employment change, Feb to Oct 2020 -7.8% (-3,621 jobs)
> Oct. 2020 unemployment rate: 4.7%
> Median household income: $59,010
> Poverty rate: 18.6%
> 2019 population: 130,285
[in-text-ad]

Source: Jacqueline Nix / Getty Images
Kentucky: Bowling Green
> Employment change, Feb to Oct 2020 -12.5% (-10,273 jobs)
> Oct. 2020 unemployment rate: 7.2%
> Median household income: $51,198
> Poverty rate: 16.5%
> 2019 population: 176,816
 24/7 Wall St.
Source: DenisTangneyJr / Getty Images
Louisiana: Lake Charles
> Employment change, Feb to Oct 2020 -15.1% (-15,725 jobs)
> Oct. 2020 unemployment rate: 11.9%
> Median household income: $51,547
> Poverty rate: 20.4%
> 2019 population: 209,035

Source: Sean Pavone / Getty Images
Maine: Portland-South Portland
> Employment change, Feb to Oct 2020 -5.8% (-11,881 jobs)
> Oct. 2020 unemployment rate: 4.9%
> Median household income: $71,913
> Poverty rate: 7.7%
> 2019 population: 538,500
[in-text-ad-2]

Source: Famartin / Wikimedia Commons
Maryland: California-Lexington Park
> Employment change, Feb to Oct 2020 -9.7% (-5,451 jobs)
> Oct. 2020 unemployment rate: 5.3%
> Median household income: $87,947
> Poverty rate: 7.3%
> 2019 population: 113,510

Source: Kevin Rutherford / Wikimedia Commons
Massachusetts: Barnstable Town
> Employment change, Feb to Oct 2020 -12.9% (-15,975 jobs)
> Oct. 2020 unemployment rate: 7.9%
> Median household income: $85,042
> Poverty rate: 5.2%
> 2019 population: 212,990
[in-text-ad]

Source: csfotoimages / Getty Images
Michigan: Monroe
> Employment change, Feb to Oct 2020 -6.6% (-4,851 jobs)
> Oct. 2020 unemployment rate: 5.7%
> Median household income: $62,839
> Poverty rate: 10.8%
> 2019 population: 150,500
 24/7 Wall St.
Source: taarnes / Getty Images
Minnesota: Duluth
> Employment change, Feb to Oct 2020 -6.9% (-9,566 jobs)
> Oct. 2020 unemployment rate: 6.0%
> Median household income: $60,316
> Poverty rate: 12.4%
> 2019 population: 289,383

Source: SeanPavonePhoto / Getty Images
Mississippi: Jackson
> Employment change, Feb to Oct 2020 -0.1% (-143 jobs)
> Oct. 2020 unemployment rate: 6.5%
> Median household income: $52,426
> Poverty rate: 15.5%
> 2019 population: 594,800
[in-text-ad-2]

Source: fozzyb / Getty Images
Missouri: Cape Girardeau
> Employment change, Feb to Oct 2020 -10.3% (-4,876 jobs)
> Oct. 2020 unemployment rate: 4.3%
> Median household income: $52,624
> Poverty rate: 16.0%
> 2019 population: 93,397

Source: shanecotee / Getty Images
Montana: Great Falls
> Employment change, Feb to Oct 2020 -3.4% (-1,250 jobs)
> Oct. 2020 unemployment rate: 4.8%
> Median household income: $51,227
> Poverty rate: 15.4%
> 2019 population: 81,366
[in-text-ad]

Source: Matt Bills / Getty Images
Nebraska: Omaha-Council Bluffs
> Employment change, Feb to Oct 2020 -2.7% (-13,078 jobs)
> Oct. 2020 unemployment rate: 3.4%
> Median household income: $70,373
> Poverty rate: 9.1%
> 2019 population: 949,726
 24/7 Wall St.
Source: f11photo / Getty Images
Nevada: Las Vegas-Henderson-Paradise
> Employment change, Feb to Oct 2020 -11.6% (-128,099 jobs)
> Oct. 2020 unemployment rate: 13.9%
> Median household income: $62,107
> Poverty rate: 12.8%
> 2019 population: 2,266,715

Source: mountinez / Getty Images
New Hampshire: Dover-Durham
> Employment change, Feb to Oct 2020 -11.5% (-9,694 jobs)
> Oct. 2020 unemployment rate: 4.3%
> Median household income: N/A
> Poverty rate: N/A
> 2019 population: N/A
[in-text-ad-2]

Source: DenisTangneyJr / Getty Images
New Jersey: Atlantic City-Hammonton
> Employment change, Feb to Oct 2020 -11.8% (-13,687 jobs)
> Oct. 2020 unemployment rate: 12.4%
> Median household income: $63,389
> Poverty rate: 11.1%
> 2019 population: 263,670

Source: DenisTangneyJr / Getty Images
New Mexico: Santa Fe
> Employment change, Feb to Oct 2020 -12.9% (-9,455 jobs)
> Oct. 2020 unemployment rate: 7.8%
> Median household income: $61,298
> Poverty rate: 13.0%
> 2019 population: 150,358
[in-text-ad]

Source: GCShutter / E+ via Getty Images
New York: New York-Newark-Jersey City
> Employment change, Feb to Oct 2020 -10.7% (-1,028,472 jobs)
> Oct. 2020 unemployment rate: 9.5%
> Median household income: $83,160
> Poverty rate: 11.6%
> 2019 population: 19,216,182

Source: Sean Pavone / Getty Images
North Carolina: Asheville
> Employment change, Feb to Oct 2020 -10.6% (-24,769 jobs)
> Oct. 2020 unemployment rate: 6.2%
> Median household income: $57,428
> Poverty rate: 11.0%
> 2019 population: 462,680

Source: DenisTangneyJr / Getty Images
North Dakota: Grand Forks
> Employment change, Feb to Oct 2020 -0.7% (-359 jobs)
> Oct. 2020 unemployment rate: 4.0%
> Median household income: $57,301
> Poverty rate: 13.9%
> 2019 population: 100,815
[in-text-ad-2]

Source: Kasamias9 / Wikimedia Commons
Ohio: Youngstown-Warren-Boardman
> Employment change, Feb to Oct 2020 -5.4% (-12,081 jobs)
> Oct. 2020 unemployment rate: 7.4%
> Median household income: $48,558
> Poverty rate: 16.2%
> 2019 population: 536,081

Source: BOB WESTON / iStock via Getty Images
Oklahoma: Enid
> Employment change, Feb to Oct 2020 -4.5% (-1,159 jobs)
> Oct. 2020 unemployment rate: 6.0%
> Median household income: $64,929
> Poverty rate: 10.1%
> 2019 population: 61,056
[in-text-ad]

Source: rssfhs / Getty Images
Oregon: Corvallis
> Employment change, Feb to Oct 2020 -4.3% (-2,006 jobs)
> Oct. 2020 unemployment rate: 5.3%
> Median household income: $70,835
> Poverty rate: 17.9%
> 2019 population: 93,053

Source: Kirkikis / iStock Editorial via Getty Images
Pennsylvania: Williamsport
> Employment change, Feb to Oct 2020 -10.4% (-5,630 jobs)
> Oct. 2020 unemployment rate: 7.7%
> Median household income: $53,881
> Poverty rate: 14.0%
> 2019 population: 113,299

Source: DenisTangneyJr / Getty Images
Rhode Island: Providence-Warwick
> Employment change, Feb to Oct 2020 -6.9% (-46,522 jobs)
> Oct. 2020 unemployment rate: 7.1%
> Median household income: $70,967
> Poverty rate: 11.0%
> 2019 population: 1,624,578
[in-text-ad-2]

Source: Sean Pavone / Getty Images
South Carolina: Myrtle Beach-Conway-North Myrtle Beach
> Employment change, Feb to Oct 2020 -7.7% (-15,358 jobs)
> Oct. 2020 unemployment rate: 5.8%
> Median household income: $56,977
> Poverty rate: 11.8%
> 2019 population: 496,901

Source: peeterv / Getty Images
South Dakota: Rapid City
> Employment change, Feb to Oct 2020 -4.1% (-3,002 jobs)
> Oct. 2020 unemployment rate: 4.0%
> Median household income: $58,361
> Poverty rate: 11.0%
> 2019 population: 142,191
[in-text-ad]

Source: Sean Pavone / Getty Images
Tennessee: Nashville-Davidson–Murfreesboro–Franklin
> Employment change, Feb to Oct 2020 -6.3% (-67,262 jobs)
> Oct. 2020 unemployment rate: 6.2%
> Median household income: $70,262
> Poverty rate: 10.0%
> 2019 population: 1,933,860

Source: DenisTangneyJr / Getty Images
Texas: Midland
> Employment change, Feb to Oct 2020 -12.5% (-13,575 jobs)
> Oct. 2020 unemployment rate: 8.3%
> Median household income: $82,650
> Poverty rate: 10.4%
> 2019 population: 182,782

Source: 4kodiak / Getty Images
Utah: Salt Lake City
> Employment change, Feb to Oct 2020 -1.7% (-11,562 jobs)
> Oct. 2020 unemployment rate: 4.4%
> Median household income: $80,196
> Poverty rate: 8.6%
> 2019 population: 1,232,696
[in-text-ad-2]

Source: Sean Pavone / Getty Images
Vermont: Burlington-South Burlington
> Employment change, Feb to Oct 2020 -7.1% (-8,722 jobs)
> Oct. 2020 unemployment rate: 2.7%
> Median household income: $74,909
> Poverty rate: 11.4%
> 2019 population: 219,433

Source: BOB WESTON / Getty Images
Virginia: Harrisonburg
> Employment change, Feb to Oct 2020 -8.5% (-5,702 jobs)
> Oct. 2020 unemployment rate: 4.0%
> Median household income: $60,740
> Poverty rate: 14.4%
> 2019 population: 134,964
[in-text-ad]

Source: july7th / Getty Images
Washington: Seattle-Tacoma-Bellevue
> Employment change, Feb to Oct 2020 -3.9% (-83,767 jobs)
> Oct. 2020 unemployment rate: 5.9%
> Median household income: $94,027
> Poverty rate: 7.8%
> 2019 population: 3,979,845
 24/7 Wall St.
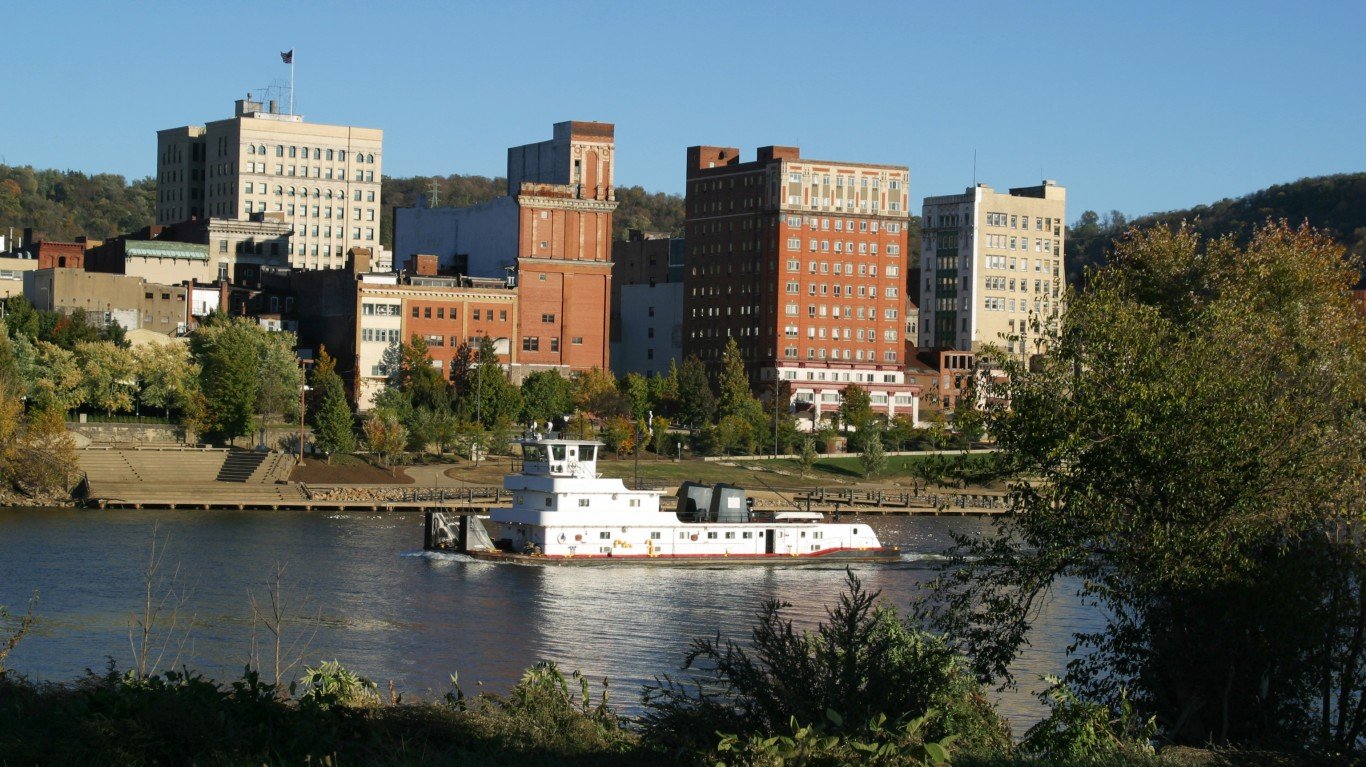
Source: StanRohrer / Getty Images
West Virginia: Wheeling
> Employment change, Feb to Oct 2020 -9.4% (-5,811 jobs)
> Oct. 2020 unemployment rate: 7.5%
> Median household income: $50,440
> Poverty rate: 11.4%
> 2019 population: 138,948

Source: DenisTangneyJr / Getty Images
Wisconsin: Appleton
> Employment change, Feb to Oct 2020 -1.7% (-2,177 jobs)
> Oct. 2020 unemployment rate: 4.3%
> Median household income: $68,335
> Poverty rate: 7.2%
> 2019 population: 237,974
[in-text-ad-2]
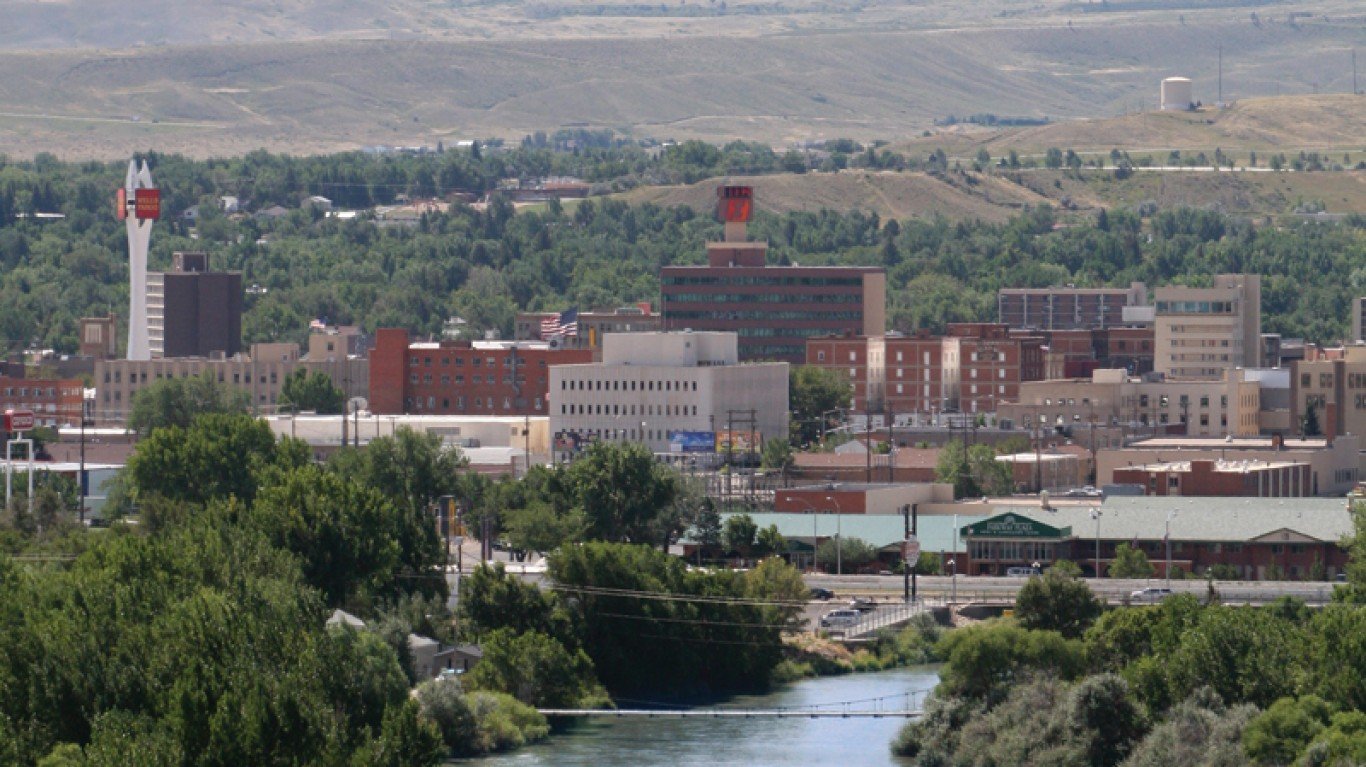
Source: Public Domain / Wikimedia Commons
Wyoming: Casper
> Employment change, Feb to Oct 2020 -6.0% (-2,253 jobs)
> Oct. 2020 unemployment rate: 8.5%
> Median household income: $65,034
> Poverty rate: 8.6%
> 2019 population: 79,858
Methodology
To identify the American cities losing the most jobs, 24/7 Wall St. reviewed the percentage change in total employment from February to October 2020 in U.S. metro areas. Employment (the number of people employed), the total size of the labor force (those working and looking for work), and the number of unemployed workers are all from the Bureau of Labor Statistics and are seasonally adjusted. The unemployment rate is also from the BLS and is seasonally adjusted for October 2020. Employment by industry at the super sector level is also from the BLS, and was used to calculate changes from February to October 2020. Median household income and poverty rates are for 2019 and came from the U.S. Census Bureau’s American Community Survey. Delaware, New Hampshire, Rhode Island, and Vermont have only one metro area, and as a result, the metro area listed for each of these states as adding the most jobs is listed by default.
Take This Retirement Quiz To Get Matched With A Financial Advisor (Sponsored)
Take the quiz below to get matched with a financial advisor today.
Each advisor has been vetted by SmartAsset and is held to a fiduciary standard to act in your best interests.
Here’s how it works:
1. Answer SmartAsset advisor match quiz
2. Review your pre-screened matches at your leisure. Check out the
advisors’ profiles.
3. Speak with advisors at no cost to you. Have an introductory call on the phone or introduction in person and choose whom to work with in the future
Take the retirement quiz right here.
Thank you for reading! Have some feedback for us?
Contact the 24/7 Wall St. editorial team.
Editors' Picks