
The COVID-19 pandemic brought an abrupt end to an era of relative prosperity in the United States. After years of steady economic expansion and job growth, the U.S. poverty rate stood at 12.3% in 2019 — its lowest level in over a decade and a half.
This year, between May and October alone, the number of Americans living below the poverty line spiked by an estimated 8 million, according to researchers at Columbia University.
While the economic fallout tied to the COVID-19 pandemic will likely drive up the poverty rate nationwide, there are some cities where residents are far less likely to live in poverty than the typical American.
24/7 Wall St. reviewed the share of residents living below the poverty line in all 384 U.S. metro areas to identify the 50 cities with the lowest poverty rates. In the case of a tie, the metro area with a higher median household income ranked higher. In each of the metro areas on this list, the poverty rate is 9.2% or lower. For reference, the U.S. Department of Health and Human services sets the official poverty threshold at an annual income of no more than approximately $26,000 for a family of four.
Data on poverty, median household income, and SNAP recipiency are all from the U.S. Census Bureau’s 2019 American Community Survey. SNAP is the government’s Supplemental Nutrition Assistance Program, formerly known as food stamps. Seasonally adjusted October, 2020 unemployment rates are from the Bureau of Labor Statistics.
Exactly how the COVID-19 recession will impact the official 2020 poverty rate — both in the metro areas on this list and across the U.S. as a whole — remains to be seen. However, poverty tends to rise with unemployment, and the job markets in the metro areas on this list are relatively strong. Only 10 of the 50 cities on this list had a higher unemployment rate in October than comparable national jobless rate of 6.9%. Here is a look at the cities with the worst COVID-19 unemployment crisis right now.
Not only do these cities have lower than average poverty rates, they also tend to have relatively high incomes overall. Residents in these cities are therefore less likely to depend on government assistance programs like SNAP — both relative to the rest of the state and the U.S. as a whole. Here is a look at the richest city in every state.
Click here to see the cities with the lowest poverty rates.
Source: Tiago_Fernandez / iStock Editorial via Getty Images
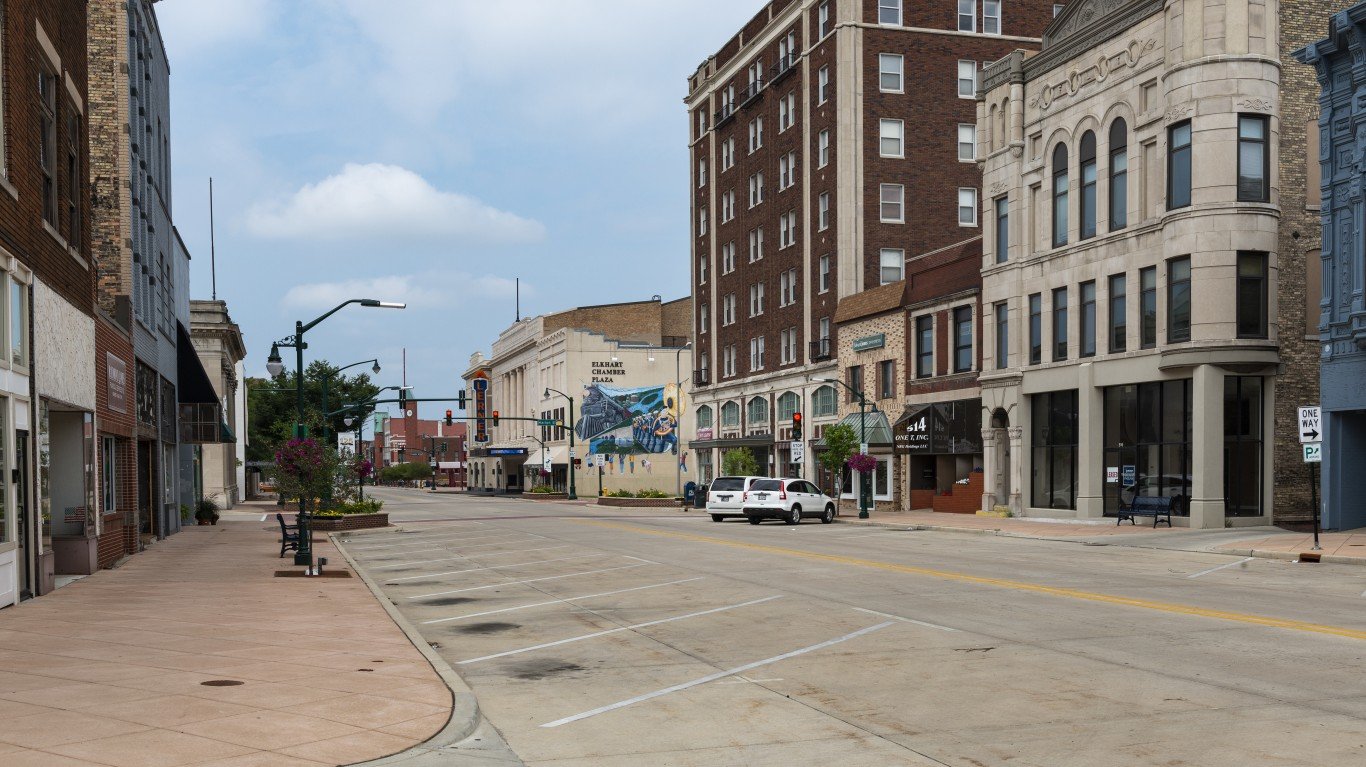
50. Elkhart-Goshen, IN
> Poverty rate: 9.2% (Indiana: 11.9%)
> Oct. 2020 unemployment: 4.7% (Indiana: 5.0%)
> Households receiving SNAP benefits: 6.3% (Indiana: 8.5%)
> Median household income: $54,531 (Indiana: $57,603)
[in-text-ad]

Source: Ebyabe / Wikimedia Commons
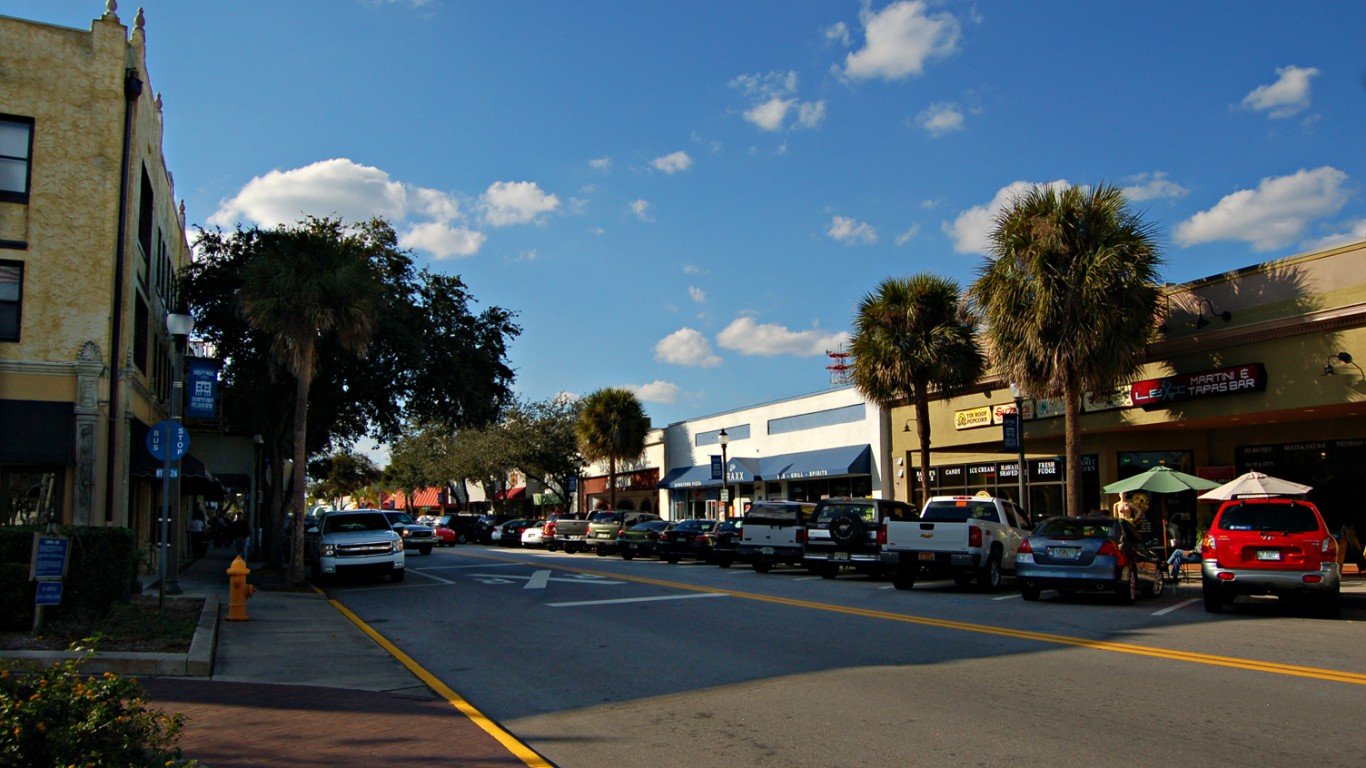
49. North Port-Sarasota-Bradenton, FL
> Poverty rate: 9.2% (Florida: 12.7%)
> Oct. 2020 unemployment: 5.0% (Florida: 6.5%)
> Households receiving SNAP benefits: 6.6% (Florida: 11.8%)
> Median household income: $65,526 (Florida: $59,227)
 24/7 Wall St.
Source: pabradyphoto / iStock via Getty Images
48. Harrisburg-Carlisle, PA
> Poverty rate: 9.2% (Pennsylvania: 12.0%)
> Oct. 2020 unemployment: 5.9% (Pennsylvania: 7.3%)
> Households receiving SNAP benefits: 8.5% (Pennsylvania: 13.5%)
> Median household income: $67,069 (Pennsylvania: $63,463)

Source: Nate Hovee / iStock via Getty Images
47. Olympia-Lacey-Tumwater, WA
> Poverty rate: 9.2% (Washington: 9.8%)
> Oct. 2020 unemployment: 6.3% (Washington: 6.0%)
> Households receiving SNAP benefits: 12.1% (Washington: 10.6%)
> Median household income: $78,512 (Washington: $78,687)
[in-text-ad-2]

Source: Matt Bills / Getty Images
46. Omaha-Council Bluffs, NE-IA
> Poverty rate: 9.1% (Nebraska: 9.9%)
> Oct. 2020 unemployment: 3.4% (Nebraska: 3.0%)
> Households receiving SNAP benefits: 7.9% (Nebraska: 7.6%)
> Median household income: $70,373 (Nebraska: $63,229)

Source: DenisTangneyJr / Getty Images
45. Bridgeport-Stamford-Norwalk, CT
> Poverty rate: 9.1% (Connecticut: 10.0%)
> Oct. 2020 unemployment: 6.6% (Connecticut: 6.1%)
> Households receiving SNAP benefits: 8.3% (Connecticut: 11.1%)
> Median household income: $97,053 (Connecticut: $78,833)
[in-text-ad]

Source: felixmizioznikov / Getty Images
44. Port St. Lucie, FL
> Poverty rate: 8.9% (Florida: 12.7%)
> Oct. 2020 unemployment: 5.3% (Florida: 6.5%)
> Households receiving SNAP benefits: 10.9% (Florida: 11.8%)
> Median household income: $62,608 (Florida: $59,227)
 24/7 Wall St.
Source: Sean Pavone / Getty Images
43. Madison, WI
> Poverty rate: 8.9% (Wisconsin: 10.4%)
> Oct. 2020 unemployment: 4.2% (Wisconsin: 5.7%)
> Households receiving SNAP benefits: 5.4% (Wisconsin: 9.4%)
> Median household income: $75,545 (Wisconsin: $64,168)

Source: SeanPavonePhoto / Getty Images
42. Raleigh-Cary, NC
> Poverty rate: 8.9% (North Carolina: 13.6%)
> Oct. 2020 unemployment: 5.6% (North Carolina: 6.3%)
> Households receiving SNAP benefits: 7.3% (North Carolina: 11.6%)
> Median household income: $80,096 (North Carolina: $57,341)
[in-text-ad-2]

Source: Sanfranman59 / Wikimedia Commons
41. Vallejo, CA
> Poverty rate: 8.9% (California: 11.8%)
> Oct. 2020 unemployment: 8.6% (California: 9.3%)
> Households receiving SNAP benefits: 6.2% (California: 8.4%)
> Median household income: $86,652 (California: $80,440)

Source: DenisTangneyJr / Getty Images
40. Lewiston-Auburn, ME
> Poverty rate: 8.8% (Maine: 10.9%)
> Oct. 2020 unemployment: 5.6% (Maine: 5.4%)
> Households receiving SNAP benefits: 13.4% (Maine: 12.3%)
> Median household income: $63,813 (Maine: $58,924)
[in-text-ad]

Source: Aneese / Getty Images
39. Ocean City, NJ
> Poverty rate: 8.8% (New Jersey: 9.2%)
> Oct. 2020 unemployment: 9.8% (New Jersey: 8.2%)
> Households receiving SNAP benefits: 9.3% (New Jersey: 7.4%)
> Median household income: $69,980 (New Jersey: $85,751)
Source: MicheleHaro / Wikimedia Commons
38. Palm Bay-Melbourne-Titusville, FL
> Poverty rate: 8.7% (Florida: 12.7%)
> Oct. 2020 unemployment: 5.2% (Florida: 6.5%)
> Households receiving SNAP benefits: 8.6% (Florida: 11.8%)
> Median household income: $57,305 (Florida: $59,227)

Source: Dsmspence / Wikimedia Commons
37. Des Moines-West Des Moines, IA
> Poverty rate: 8.7% (Iowa: 11.2%)
> Oct. 2020 unemployment: 3.7% (Iowa: 3.6%)
> Households receiving SNAP benefits: 9.6% (Iowa: 9.5%)
> Median household income: $71,164 (Iowa: $61,691)
[in-text-ad-2]
Source: Public Domain / Wikimedia Commons
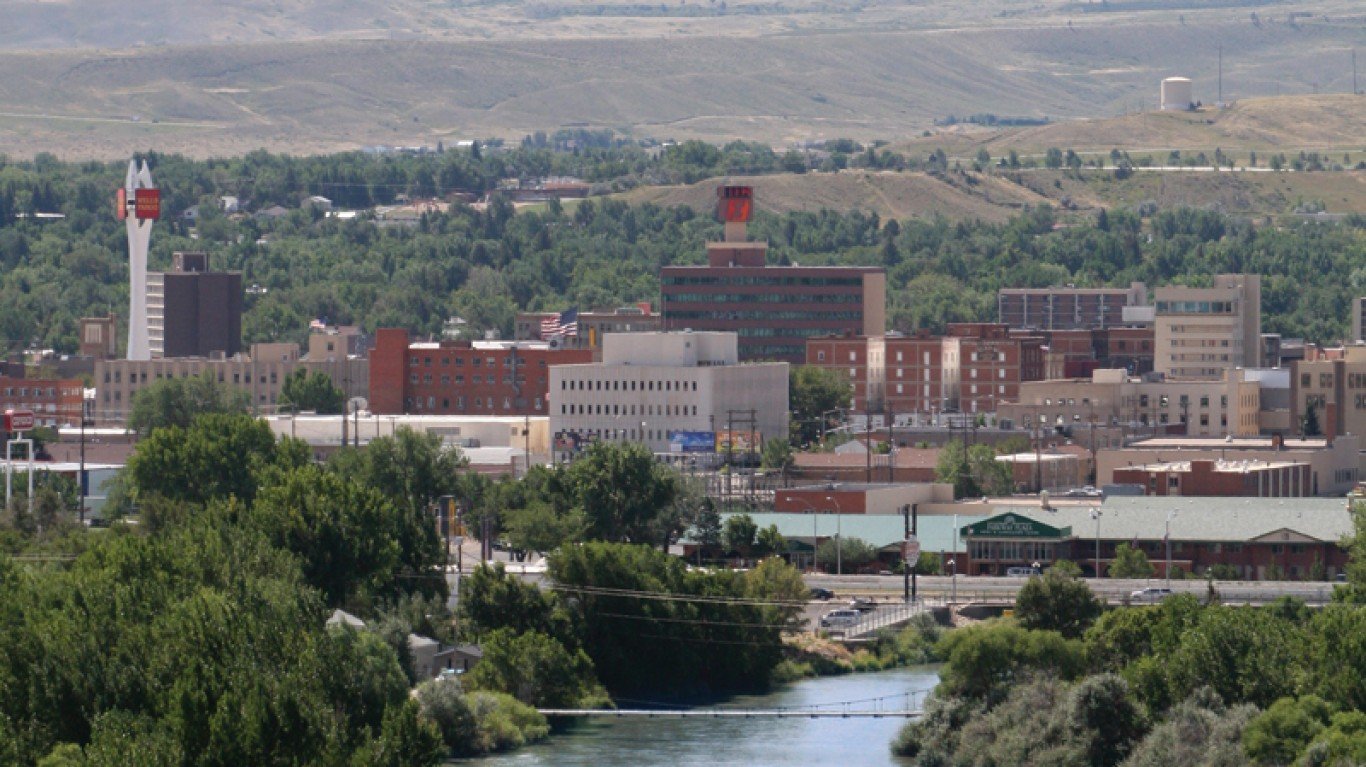
36. Casper, WY
> Poverty rate: 8.6% (Wyoming: 10.1%)
> Oct. 2020 unemployment: 8.5% (Wyoming: 5.5%)
> Households receiving SNAP benefits: 4.1% (Wyoming: 4.7%)
> Median household income: $65,034 (Wyoming: $65,003)

Source: NicolasMcComber / Getty Images
35. Winchester, VA-WV
> Poverty rate: 8.6% (Virginia: 9.9%)
> Oct. 2020 unemployment: 4.0% (Virginia: 5.3%)
> Households receiving SNAP benefits: 7.0% (Virginia: 7.8%)
> Median household income: $76,583 (Virginia: $76,456)
[in-text-ad]

Source: legacyimagesphotography / Getty Images
34. Salt Lake City, UT
> Poverty rate: 8.6% (Utah: 8.9%)
> Oct. 2020 unemployment: 4.4% (Utah: 4.1%)
> Households receiving SNAP benefits: 4.9% (Utah: 5.5%)
> Median household income: $80,196 (Utah: $75,780)

Source: Sean Pavone / Getty Images
33. Boston-Cambridge-Newton, MA-NH
> Poverty rate: 8.6% (Massachusetts: 9.4%)
> Oct. 2020 unemployment: 7.0% (Massachusetts: 7.4%)
> Households receiving SNAP benefits: 9.0% (Massachusetts: 11.2%)
> Median household income: $94,430 (Massachusetts: $85,843)

Source: Richard Schafer / Getty Images
32. Idaho Falls, ID
> Poverty rate: 8.5% (Idaho: 11.2%)
> Oct. 2020 unemployment: 4.2% (Idaho: 5.5%)
> Households receiving SNAP benefits: 8.0% (Idaho: 8.3%)
> Median household income: $63,616 (Idaho: $60,999)
[in-text-ad-2]

Source: oneillbro / Getty Images
31. Colorado Springs, CO
> Poverty rate: 8.4% (Colorado: 9.3%)
> Oct. 2020 unemployment: 6.3% (Colorado: 6.4%)
> Households receiving SNAP benefits: 8.4% (Colorado: 6.9%)
> Median household income: $72,633 (Colorado: $77,127)

Source: StevenGaertner / Getty Images
30. Minneapolis-St. Paul-Bloomington, MN-WI
> Poverty rate: 8.2% (Minnesota: 9.0%)
> Oct. 2020 unemployment: 4.8% (Minnesota: 4.6%)
> Households receiving SNAP benefits: 6.9% (Minnesota: 7.4%)
> Median household income: $83,698 (Minnesota: $74,593)
[in-text-ad]

Source: Nicolas McComber / Getty Images
29. San Francisco-Oakland-Berkeley, CA
> Poverty rate: 8.2% (California: 11.8%)
> Oct. 2020 unemployment: 7.3% (California: 9.3%)
> Households receiving SNAP benefits: 4.8% (California: 8.4%)
> Median household income: $114,696 (California: $80,440)
 24/7 Wall St.
Source: Michael Warren / Getty Images
28. The Villages, FL
> Poverty rate: 8.1% (Florida: 12.7%)
> Oct. 2020 unemployment: 6.1% (Florida: 6.5%)
> Households receiving SNAP benefits: 4.1% (Florida: 11.8%)
> Median household income: $60,287 (Florida: $59,227)

Source: Art Wager / Getty Images
27. Urban Honolulu, HI
> Poverty rate: 8.1% (Hawaii: 9.3%)
> Oct. 2020 unemployment: 12.2% (Hawaii: 14.3%)
> Households receiving SNAP benefits: 9.0% (Hawaii: 10.4%)
> Median household income: $87,470 (Hawaii: $83,102)
[in-text-ad-2]

Source: DenisTangneyJr / iStock via Getty Images
26. Sheboygan, WI
> Poverty rate: 8.0% (Wisconsin: 10.4%)
> Oct. 2020 unemployment: 4.2% (Wisconsin: 5.7%)
> Households receiving SNAP benefits: 8.5% (Wisconsin: 9.4%)
> Median household income: $60,706 (Wisconsin: $64,168)

Source: Michael-Tatman / Getty Images
25. Wausau-Weston, WI
> Poverty rate: 8.0% (Wisconsin: 10.4%)
> Oct. 2020 unemployment: 4.1% (Wisconsin: 5.7%)
> Households receiving SNAP benefits: 6.9% (Wisconsin: 9.4%)
> Median household income: $65,094 (Wisconsin: $64,168)
[in-text-ad]

Source: Bryan Bean / Wikimedia Commons
24. Greeley, CO
> Poverty rate: 7.9% (Colorado: 9.3%)
> Oct. 2020 unemployment: 6.6% (Colorado: 6.4%)
> Households receiving SNAP benefits: 5.2% (Colorado: 6.9%)
> Median household income: $78,615 (Colorado: $77,127)

Source: photoquest7 / Getty Images
23. Denver-Aurora-Lakewood, CO
> Poverty rate: 7.9% (Colorado: 9.3%)
> Oct. 2020 unemployment: 6.7% (Colorado: 6.4%)
> Households receiving SNAP benefits: 5.6% (Colorado: 6.9%)
> Median household income: $85,641 (Colorado: $77,127)

Source: Arthurpreston / Getty Images
22. Oxnard-Thousand Oaks-Ventura, CA
> Poverty rate: 7.9% (California: 11.8%)
> Oct. 2020 unemployment: 7.2% (California: 9.3%)
> Households receiving SNAP benefits: 6.5% (California: 8.4%)
> Median household income: $92,236 (California: $80,440)
[in-text-ad-2]

Source: july7th / Getty Images
21. Seattle-Tacoma-Bellevue, WA
> Poverty rate: 7.8% (Washington: 9.8%)
> Oct. 2020 unemployment: 5.9% (Washington: 6.0%)
> Households receiving SNAP benefits: 8.7% (Washington: 10.6%)
> Median household income: $94,027 (Washington: $78,687)

Source: DenisTangneyJr / Getty Images
20. Sioux Falls, SD
> Poverty rate: 7.7% (South Dakota: 11.9%)
> Oct. 2020 unemployment: 3.3% (South Dakota: 3.6%)
> Households receiving SNAP benefits: 9.1% (South Dakota: 8.7%)
> Median household income: $65,566 (South Dakota: $59,533)
[in-text-ad]

Source: Sean Pavone / Getty Images
19. Portland-South Portland, ME
> Poverty rate: 7.7% (Maine: 10.9%)
> Oct. 2020 unemployment: 4.9% (Maine: 5.4%)
> Households receiving SNAP benefits: 8.3% (Maine: 12.3%)
> Median household income: $71,913 (Maine: $58,924)

Source: f11photo / Getty Images
18. Washington-Arlington-Alexandria, DC-VA-MD-WV
> Poverty rate: 7.5% (District of Columbia: .)
> Oct. 2020 unemployment: 6.9% (District of Columbia: .)
> Households receiving SNAP benefits: 6.2% (District of Columbia: .)
> Median household income: $105,659 (District of Columbia: .)

Source: Montes-Bradley / Getty Images
17. Staunton, VA
> Poverty rate: 7.3% (Virginia: 9.9%)
> Oct. 2020 unemployment: 4.1% (Virginia: 5.3%)
> Households receiving SNAP benefits: 10.0% (Virginia: 7.8%)
> Median household income: $57,844 (Virginia: $76,456)
[in-text-ad-2]

Source: DenisTangneyJr / Getty Images
16. Manchester-Nashua, NH
> Poverty rate: 7.3% (New Hampshire: 7.3%)
> Oct. 2020 unemployment: 4.2% (New Hampshire: 4.2%)
> Households receiving SNAP benefits: 6.2% (New Hampshire: 6.0%)
> Median household income: $83,626 (New Hampshire: $77,933)

Source: Famartin / Wikimedia Commons
15. California-Lexington Park, MD
> Poverty rate: 7.3% (Maryland: 9.0%)
> Oct. 2020 unemployment: 5.3% (Maryland: 7.8%)
> Households receiving SNAP benefits: 9.4% (Maryland: 9.8%)
> Median household income: $87,947 (Maryland: $86,738)
[in-text-ad]

Source: zrfphoto / Getty Images
14. Gettysburg, PA
> Poverty rate: 7.2% (Pennsylvania: 12.0%)
> Oct. 2020 unemployment: 4.8% (Pennsylvania: 7.3%)
> Households receiving SNAP benefits: 6.9% (Pennsylvania: 13.5%)
> Median household income: $67,715 (Pennsylvania: $63,463)

Source: DenisTangneyJr / Getty Images
13. Appleton, WI
> Poverty rate: 7.2% (Wisconsin: 10.4%)
> Oct. 2020 unemployment: 4.3% (Wisconsin: 5.7%)
> Households receiving SNAP benefits: 5.8% (Wisconsin: 9.4%)
> Median household income: $68,335 (Wisconsin: $64,168)

Source: connerscott1 / Getty Images
12. Norwich-New London, CT
> Poverty rate: 7.2% (Connecticut: 10.0%)
> Oct. 2020 unemployment: 7.1% (Connecticut: 6.1%)
> Households receiving SNAP benefits: 10.9% (Connecticut: 11.1%)
> Median household income: $75,633 (Connecticut: $78,833)
[in-text-ad-2]

Source: Andy445 / Getty Images
11. Rochester, MN
> Poverty rate: 6.9% (Minnesota: 9.0%)
> Oct. 2020 unemployment: 4.2% (Minnesota: 4.6%)
> Households receiving SNAP benefits: 6.2% (Minnesota: 7.4%)
> Median household income: $75,926 (Minnesota: $74,593)

Source: jmoor17 / Getty Images
10. Bremerton-Silverdale-Port Orchard, WA
> Poverty rate: 6.9% (Washington: 9.8%)
> Oct. 2020 unemployment: 5.9% (Washington: 6.0%)
> Households receiving SNAP benefits: 7.8% (Washington: 10.6%)
> Median household income: $79,624 (Washington: $78,687)
[in-text-ad]

Source: gsheldon / iStock Editorial via Getty Images
9. Chambersburg-Waynesboro, PA
> Poverty rate: 6.8% (Pennsylvania: 12.0%)
> Oct. 2020 unemployment: 6.2% (Pennsylvania: 7.3%)
> Households receiving SNAP benefits: 10.5% (Pennsylvania: 13.5%)
> Median household income: $62,484 (Pennsylvania: $63,463)

Source: Sanfranman59 / Wikimedia Commons
8. Santa Rosa-Petaluma, CA
> Poverty rate: 6.8% (California: 11.8%)
> Oct. 2020 unemployment: 6.4% (California: 9.3%)
> Households receiving SNAP benefits: 4.9% (California: 8.4%)
> Median household income: $87,828 (California: $80,440)

Source: Spondylolithesis / Getty Images
7. Napa, CA
> Poverty rate: 6.8% (California: 11.8%)
> Oct. 2020 unemployment: 7.2% (California: 9.3%)
> Households receiving SNAP benefits: 1.7% (California: 8.4%)
> Median household income: $92,769 (California: $80,440)
[in-text-ad-2]

Source: NicolasMcComber / Getty Images
6. San Jose-Sunnyvale-Santa Clara, CA
> Poverty rate: 6.3% (California: 11.8%)
> Oct. 2020 unemployment: 6.0% (California: 9.3%)
> Households receiving SNAP benefits: 3.9% (California: 8.4%)
> Median household income: $130,865 (California: $80,440)

Source: DenisTangneyJr / Getty Images
5. Fond du Lac, WI
> Poverty rate: 6.2% (Wisconsin: 10.4%)
> Oct. 2020 unemployment: 4.1% (Wisconsin: 5.7%)
> Households receiving SNAP benefits: 7.2% (Wisconsin: 9.4%)
> Median household income: $65,329 (Wisconsin: $64,168)
[in-text-ad]
Source: powerofforever / Getty Images
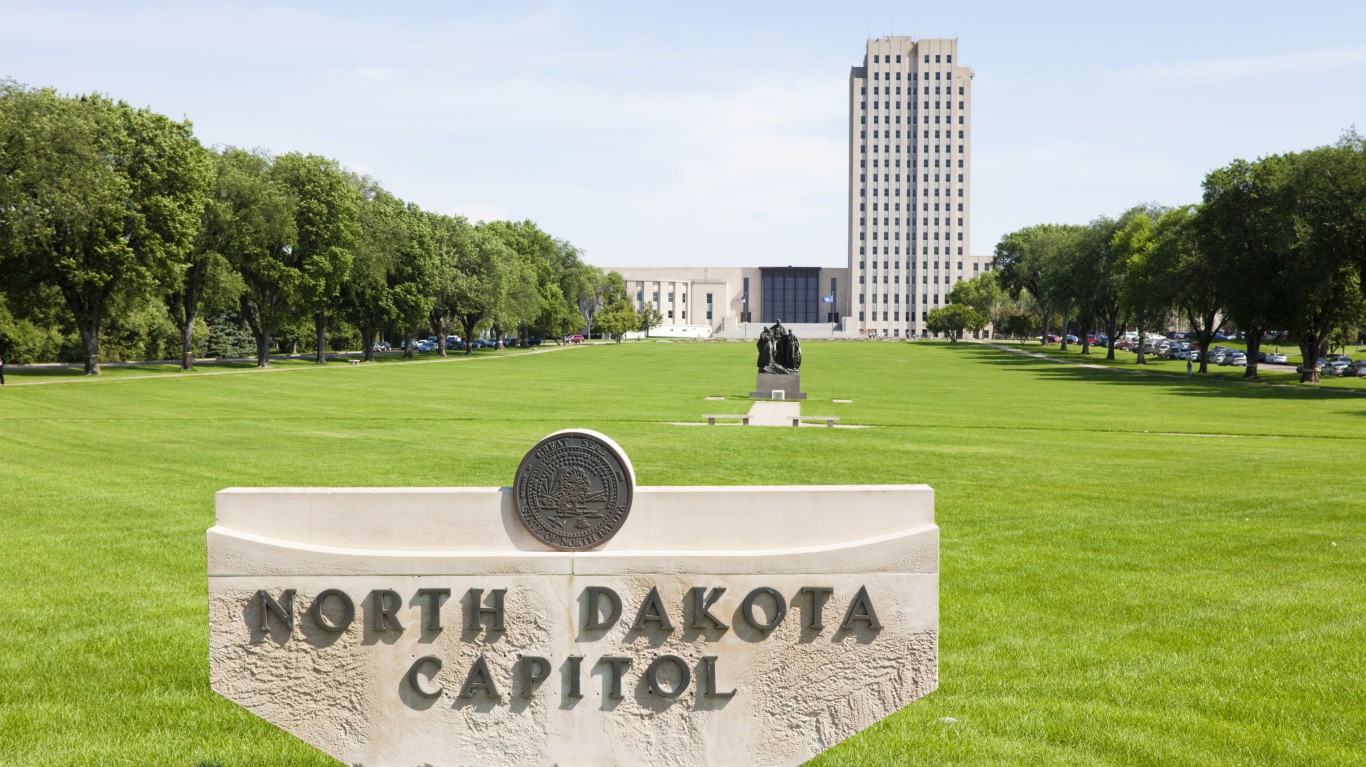
4. Bismarck, ND
> Poverty rate: 5.9% (North Dakota: 10.6%)
> Oct. 2020 unemployment: 4.0% (North Dakota: 4.8%)
> Households receiving SNAP benefits: 5.2% (North Dakota: 6.9%)
> Median household income: $70,979 (North Dakota: $64,577)

Source: lippyjr / Getty Images
3. Fairbanks, AK
> Poverty rate: 5.9% (Alaska: 10.1%)
> Oct. 2020 unemployment: 4.8% (Alaska: 5.9%)
> Households receiving SNAP benefits: 6.3% (Alaska: 10.3%)
> Median household income: $72,065 (Alaska: $75,463)

Source: DenisTangneyJr / iStock via Getty Images
2. Ogden-Clearfield, UT
> Poverty rate: 5.6% (Utah: 8.9%)
> Oct. 2020 unemployment: 3.7% (Utah: 4.1%)
> Households receiving SNAP benefits: 5.8% (Utah: 5.5%)
> Median household income: $79,251 (Utah: $75,780)
[in-text-ad-2]

Source: John Phelan / Wikimedia Commons
1. Barnstable Town, MA
> Poverty rate: 5.2% (Massachusetts: 9.4%)
> Oct. 2020 unemployment: 7.9% (Massachusetts: 7.4%)
> Households receiving SNAP benefits: 5.2% (Massachusetts: 11.2%)
> Median household income: $85,042 (Massachusetts: $85,843)
Essential Tips for Investing: Sponsored
A financial advisor can help you understand the advantages and disadvantages of investment properties. Finding a qualified financial advisor doesn’t have to be hard. SmartAsset’s free tool matches you with up to three financial advisors who serve your area, and you can interview your advisor matches at no cost to decide which one is right for you. If you’re ready to find an advisor who can help you achieve your financial goals, get started now.
Investing in real estate can diversify your portfolio. But expanding your horizons may add additional costs. If you’re an investor looking to minimize expenses, consider checking out online brokerages. They often offer low investment fees, helping you maximize your profit.
Thank you for reading! Have some feedback for us?
Contact the 24/7 Wall St. editorial team.
Editors' Picks