
The U.S. has reported more than 25,000,000 confirmed COVID-19 cases as of Jan. 27, 2021. More than 410,000 Americans have died of COVID-19 — the highest death toll of any country.
The virus has spread throughout the country in a way that has been difficult to predict, surging in one region, then showing signs of improvement, and then reappearing in other regions. Though local outbreaks may ebb and flow, the current surge in cases has been felt nearly nationwide, leading to new travel restrictions and business closures around the country.
Nationwide, there were an average of 52.2 daily new coronavirus cases per 100,000 Americans in the week ending Jan. 27, 2021. Cumulatively, the U.S. has reported 7,677.0 cases per 100,000 Americans, and 127.1 deaths per 100,000 Americans.
The extent of the spread of the novel coronavirus continues to vary considerably from state to state, and even from county to county. Even as the number of daily new cases is flattening or even declining in some parts of the country, new cases are surging at a growing rate in others.
The coronavirus has spread to different parts of the country in different stages throughout the pandemic. In the spring, the worst hit states were in the Northeast, as New York City became the epicenter of the nation’s crisis. The virus spread to states throughout the Sun Belt in the summer, and hit states in the Midwest and West during the fall. Now, nearly every state is categorized as a COVID-19 hotspot, according to definitions based on new cases per capita from the nonprofit health organization Kaiser Family Foundation.
To determine the county in each state with the highest rate of daily cases of the virus, 24/7 Wall St. compiled and reviewed data from state and local health departments. We ranked counties according to the average new number of cases per 100,000 residents per day during the week ending Jan. 27, 2021. Population data used to adjust case and death totals came from the U.S. Census Bureau’s 2018 American Community Survey and are five-year estimates.

Source: RealPeopleGroup / E+ via Getty Images
Alabama: Tallapoosa County
> Avg. new daily cases in Tallapoosa County in week ending Jan. 27, 2021: 168.3 per 100,000
> Cumulative confirmed COVID-19 cases in Tallapoosa County as of Jan. 27, 2021: 3,228 (7,943.8 per 100,000)
> Cumulative confirmed COVID-19 deaths in Tallapoosa County as of Jan. 27, 2021: 111 (273.2 per 100,000)
> Population: 40,636
> Largest place in Tallapoosa County: Alexander City

Source: DMartinez-Photo / Getty Images
Alaska: Fairbanks North Star Borough
> Avg. new daily cases in Fairbanks North Star Borough in week ending Jan. 27, 2021: 0.4 per 100,000
> Cumulative confirmed COVID-19 cases in Fairbanks North Star Borough as of Jan. 27, 2021: 3,472 (3,484.1 per 100,000)
> Cumulative confirmed COVID-19 deaths in Fairbanks North Star Borough as of Jan. 27, 2021: 25 (25.1 per 100,000)
> Population: 99,653
> Largest place in Fairbanks North Star Borough: Fairbanks
These are all the counties in Alaska where COVID-19 is slowing (and where it’s still getting worse).

Source: kenlund / Flickr
Arizona: Graham County
> Avg. new daily cases in Graham County in week ending Jan. 27, 2021: 167.2 per 100,000
> Cumulative confirmed COVID-19 cases in Graham County as of Jan. 27, 2021: 4,848 (12,798.8 per 100,000)
> Cumulative confirmed COVID-19 deaths in Graham County as of Jan. 27, 2021: 65 (171.6 per 100,000)
> Population: 37,879
> Largest place in Graham County: Safford

Source: BOB WESTON / Getty Images
Arkansas: Cleveland County
> Avg. new daily cases in Cleveland County in week ending Jan. 27, 2021: 150.8 per 100,000
> Cumulative confirmed COVID-19 cases in Cleveland County as of Jan. 27, 2021: 1,028 (12,497.1 per 100,000)
> Cumulative confirmed COVID-19 deaths in Cleveland County as of Jan. 27, 2021: 28 (340.4 per 100,000)
> Population: 8,226
> Largest place in Cleveland County: Rison

Source: Chuck Abbe / Wikimedia Commons
California: Inyo County
> Avg. new daily cases in Inyo County in week ending Jan. 27, 2021: 109.9 per 100,000
> Cumulative confirmed COVID-19 cases in Inyo County as of Jan. 27, 2021: 1,018 (5,629.0 per 100,000)
> Cumulative confirmed COVID-19 deaths in Inyo County as of Jan. 27, 2021: 29 (160.4 per 100,000)
> Population: 18,085
> Largest place in Inyo County: Bishop

Source: SEASTOCK / iStock
Colorado: San Miguel County
> Avg. new daily cases in San Miguel County in week ending Jan. 27, 2021: 210.8 per 100,000
> Cumulative confirmed COVID-19 cases in San Miguel County as of Jan. 27, 2021: 612 (7,680.8 per 100,000)
> Cumulative confirmed COVID-19 deaths in San Miguel County as of Jan. 27, 2021: 0 (0 per 100,000)
> Population: 7,968
> Largest place in San Miguel County: Telluride

Source: DenisTangneyJr / iStock via Getty Images
Connecticut: Windham County
> Avg. new daily cases in Windham County in week ending Jan. 27, 2021: 79 per 100,000
> Cumulative confirmed COVID-19 cases in Windham County as of Jan. 27, 2021: 8,072 (6,926.6 per 100,000)
> Cumulative confirmed COVID-19 deaths in Windham County as of Jan. 27, 2021: 136 (116.7 per 100,000)
> Population: 116,538
> Largest place in Windham County: Willimantic

Source: aimintang / Getty Images
Delaware: Sussex County
> Avg. new daily cases in Sussex County in week ending Jan. 27, 2021: 76.1 per 100,000
> Cumulative confirmed COVID-19 cases in Sussex County as of Jan. 27, 2021: 20,092 (9,152.0 per 100,000)
> Cumulative confirmed COVID-19 deaths in Sussex County as of Jan. 27, 2021: 340 (154.9 per 100,000)
> Population: 219,540
> Largest place in Sussex County: Seaford
Source: con4tini / Flickr
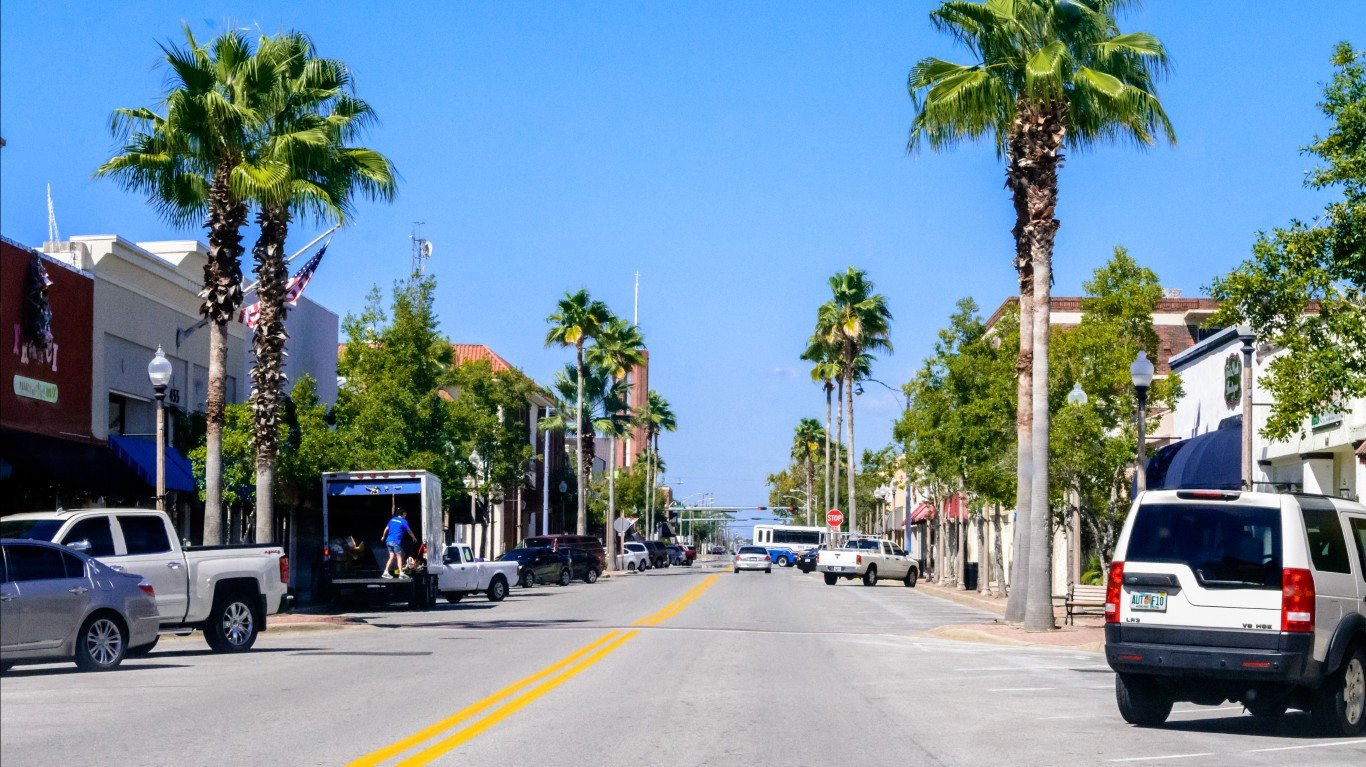
Florida: Bay County
> Avg. new daily cases in Bay County in week ending Jan. 27, 2021: 102.9 per 100,000
> Cumulative confirmed COVID-19 cases in Bay County as of Jan. 27, 2021: 15,816 (8,667.2 per 100,000)
> Cumulative confirmed COVID-19 deaths in Bay County as of Jan. 27, 2021: 276 (151.2 per 100,000)
> Population: 182,482
> Largest place in Bay County: Panama City

Source: thenationalguard / Flickr
Georgia: Jackson County
> Avg. new daily cases in Jackson County in week ending Jan. 27, 2021: 110 per 100,000
> Cumulative confirmed COVID-19 cases in Jackson County as of Jan. 27, 2021: 7,175 (10,911.8 per 100,000)
> Cumulative confirmed COVID-19 deaths in Jackson County as of Jan. 27, 2021: 97 (147.5 per 100,000)
> Population: 65,755
> Largest place in Jackson County: Jefferson

Source: Eric Broder Van Dyke / Getty Images
Hawaii: Maui County
> Avg. new daily cases in Maui County in week ending Jan. 27, 2021: 13 per 100,000
> Cumulative confirmed COVID-19 cases in Maui County as of Jan. 27, 2021: 1,792 (1,084.2 per 100,000)
> Cumulative confirmed COVID-19 deaths in Maui County as of Jan. 27, 2021: 25 (15.1 per 100,000)
> Population: 165,281
> Largest place in Maui County: Kahului
These are all the counties in Hawaii where COVID-19 is slowing (and where it’s still getting worse).

Source: Cornellrockey04 / Wikimedia Commons
Idaho: Camas County
> Avg. new daily cases in Camas County in week ending Jan. 27, 2021: 92.1 per 100,000
> Cumulative confirmed COVID-19 cases in Camas County as of Jan. 27, 2021: 64 (7,223.5 per 100,000)
> Cumulative confirmed COVID-19 deaths in Camas County as of Jan. 27, 2021: 0 (0 per 100,000)
> Population: 886
> Largest place in Camas County: Fairfield
These are all the counties in Idaho where COVID-19 is slowing (and where it’s still getting worse).
Source: roadgeek / Flickr
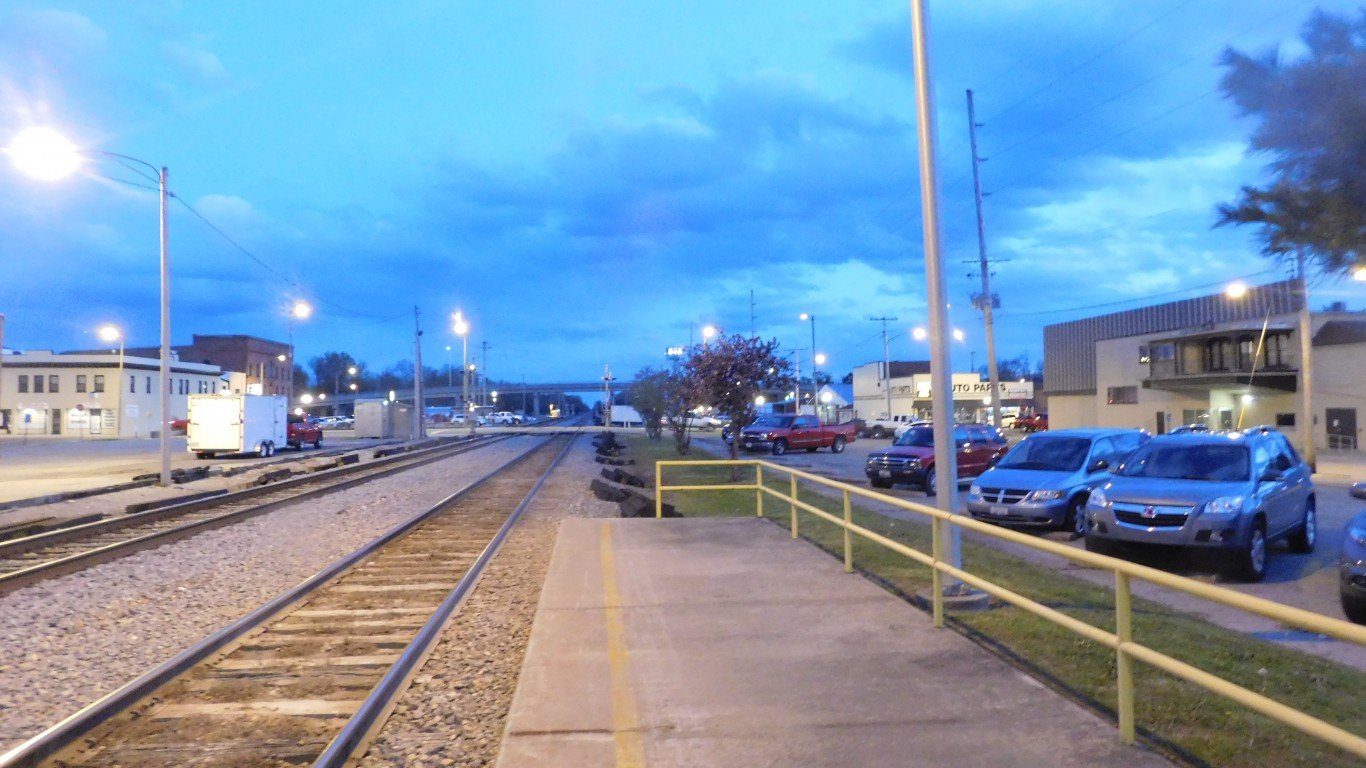
Illinois: Perry County
> Avg. new daily cases in Perry County in week ending Jan. 27, 2021: 92 per 100,000
> Cumulative confirmed COVID-19 cases in Perry County as of Jan. 27, 2021: 2,808 (13,131.4 per 100,000)
> Cumulative confirmed COVID-19 deaths in Perry County as of Jan. 27, 2021: 63 (294.6 per 100,000)
> Population: 21,384
> Largest place in Perry County: Du Quoin

Source: BOB WESTON / iStock via Getty Images
Indiana: Warrick County
> Avg. new daily cases in Warrick County in week ending Jan. 27, 2021: 78.4 per 100,000
> Cumulative confirmed COVID-19 cases in Warrick County as of Jan. 27, 2021: 6,866 (11,087.2 per 100,000)
> Cumulative confirmed COVID-19 deaths in Warrick County as of Jan. 27, 2021: 102 (164.7 per 100,000)
> Population: 61,928
> Largest place in Warrick County: Boonville

Source: John Moore / Getty Images News via Getty Images
Iowa: Kossuth County
> Avg. new daily cases in Kossuth County in week ending Jan. 27, 2021: 80.8 per 100,000
> Cumulative confirmed COVID-19 cases in Kossuth County as of Jan. 27, 2021: 1,821 (12,079.7 per 100,000)
> Cumulative confirmed COVID-19 deaths in Kossuth County as of Jan. 27, 2021: 44 (291.9 per 100,000)
> Population: 15,075
> Largest place in Kossuth County: Algona
These are all the counties in Iowa where COVID-19 is slowing (and where it’s still getting worse).

Source: thenationalguard / Flickr
Kansas: Trego County
> Avg. new daily cases in Trego County in week ending Jan. 27, 2021: 345.6 per 100,000
> Cumulative confirmed COVID-19 cases in Trego County as of Jan. 27, 2021: 371 (12,981.2 per 100,000)
> Cumulative confirmed COVID-19 deaths in Trego County as of Jan. 27, 2021: N/A (N/A per 100,000)
> Population: 2,858
> Largest place in Trego County: WaKeeney
These are all the counties in Kansas where COVID-19 is slowing (and where it’s still getting worse).

Source: dadonk / iStock
Kentucky: Oldham County
> Avg. new daily cases in Oldham County in week ending Jan. 27, 2021: 119.5 per 100,000
> Cumulative confirmed COVID-19 cases in Oldham County as of Jan. 27, 2021: 6,327 (9,678.3 per 100,000)
> Cumulative confirmed COVID-19 deaths in Oldham County as of Jan. 27, 2021: 63 (96.4 per 100,000)
> Population: 65,374
> Largest place in Oldham County: La Grange

Source: Z28scrambler / Wikimedia Commons
Louisiana: Assumption Parish
> Avg. new daily cases in Assumption Parish in week ending Jan. 27, 2021: 99.3 per 100,000
> Cumulative confirmed COVID-19 cases in Assumption Parish as of Jan. 27, 2021: 1,883 (8,290.1 per 100,000)
> Cumulative confirmed COVID-19 deaths in Assumption Parish as of Jan. 27, 2021: 31 (136.5 per 100,000)
> Population: 22,714
> Largest place in Assumption Parish: Pierre Part

Source: DenisTangneyJr / iStock via Getty Images
Maine: Androscoggin County
> Avg. new daily cases in Androscoggin County in week ending Jan. 27, 2021: 53.8 per 100,000
> Cumulative confirmed COVID-19 cases in Androscoggin County as of Jan. 27, 2021: 4,189 (3,898.8 per 100,000)
> Cumulative confirmed COVID-19 deaths in Androscoggin County as of Jan. 27, 2021: 52 (48.4 per 100,000)
> Population: 107,444
> Largest place in Androscoggin County: Lewiston
These are all the counties in Maine where COVID-19 is slowing (and where it’s still getting worse).

Source: Courtesy of Eli Pousson via Wikimedia Commons
Maryland: Dorchester County
> Avg. new daily cases in Dorchester County in week ending Jan. 27, 2021: 63.5 per 100,000
> Cumulative confirmed COVID-19 cases in Dorchester County as of Jan. 27, 2021: 2,017 (6,252.2 per 100,000)
> Cumulative confirmed COVID-19 deaths in Dorchester County as of Jan. 27, 2021: 31 (96.1 per 100,000)
> Population: 32,261
> Largest place in Dorchester County: Cambridge

Source: DenisTangneyJr / iStock via Getty Images
Massachusetts: Bristol County
> Avg. new daily cases in Bristol County in week ending Jan. 27, 2021: 79.8 per 100,000
> Cumulative confirmed COVID-19 cases in Bristol County as of Jan. 27, 2021: 48,775 (8,727.0 per 100,000)
> Cumulative confirmed COVID-19 deaths in Bristol County as of Jan. 27, 2021: 1,309 (234.2 per 100,000)
> Population: 558,905
> Largest place in Bristol County: New Bedford

Source: Tim Kiser (w:User:Malepheasant) / Wikimedia Commons
Michigan: Ontonagon County
> Avg. new daily cases in Ontonagon County in week ending Jan. 27, 2021: 57.8 per 100,000
> Cumulative confirmed COVID-19 cases in Ontonagon County as of Jan. 27, 2021: 354 (5,931.7 per 100,000)
> Cumulative confirmed COVID-19 deaths in Ontonagon County as of Jan. 27, 2021: 18 (301.6 per 100,000)
> Population: 5,968
> Largest place in Ontonagon County: Ontonagon

Source: thenationalguard / Flickr
Minnesota: Murray County
> Avg. new daily cases in Murray County in week ending Jan. 27, 2021: 60.6 per 100,000
> Cumulative confirmed COVID-19 cases in Murray County as of Jan. 27, 2021: 916 (10,966.2 per 100,000)
> Cumulative confirmed COVID-19 deaths in Murray County as of Jan. 27, 2021: 7 (83.8 per 100,000)
> Population: 8,353
> Largest place in Murray County: Slayton
Source: nataliemaynor / Flickr
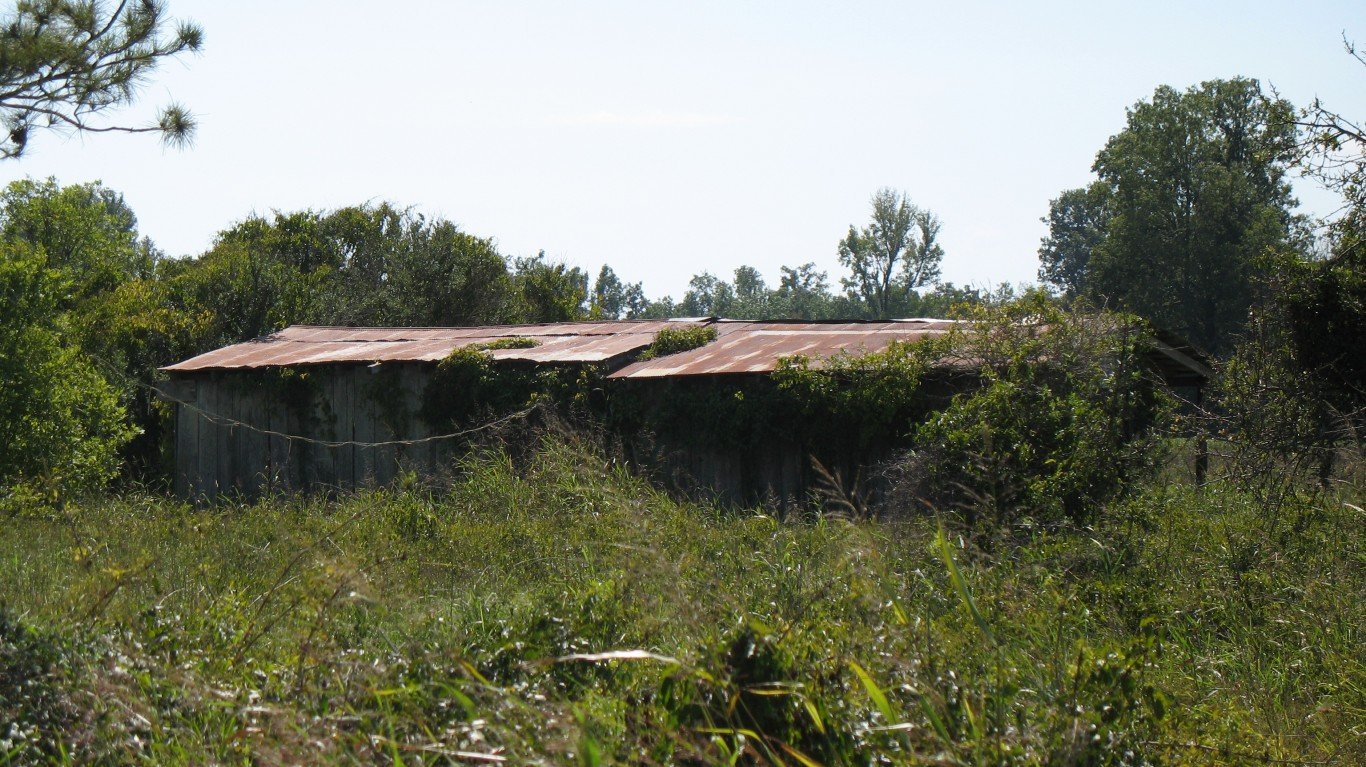
Mississippi: Tallahatchie County
> Avg. new daily cases in Tallahatchie County in week ending Jan. 27, 2021: 160 per 100,000
> Cumulative confirmed COVID-19 cases in Tallahatchie County as of Jan. 27, 2021: 1,588 (11,057.8 per 100,000)
> Cumulative confirmed COVID-19 deaths in Tallahatchie County as of Jan. 27, 2021: 35 (243.7 per 100,000)
> Population: 14,361
> Largest place in Tallahatchie County: Charleston

Source: thenationalguard / Flickr
Missouri: Macon County
> Avg. new daily cases in Macon County in week ending Jan. 27, 2021: 61.9 per 100,000
> Cumulative confirmed COVID-19 cases in Macon County as of Jan. 27, 2021: 1,149 (7,532.5 per 100,000)
> Cumulative confirmed COVID-19 deaths in Macon County as of Jan. 27, 2021: 10 (65.6 per 100,000)
> Population: 15,254
> Largest place in Macon County: Macon

Source: Aualliso / Wikimedia Commons
Montana: Deer Lodge County
> Avg. new daily cases in Deer Lodge County in week ending Jan. 27, 2021: 68.9 per 100,000
> Cumulative confirmed COVID-19 cases in Deer Lodge County as of Jan. 27, 2021: 958 (10,527.6 per 100,000)
> Cumulative confirmed COVID-19 deaths in Deer Lodge County as of Jan. 27, 2021: 9 (98.9 per 100,000)
> Population: 9,100
> Largest place in Deer Lodge County: Anaconda-Deer Lodge County

Source: BOB WESTON / iStock via Getty Images
Nebraska: Furnas County
> Avg. new daily cases in Furnas County in week ending Jan. 27, 2021: 99.8 per 100,000
> Cumulative confirmed COVID-19 cases in Furnas County as of Jan. 27, 2021: 438 (9,151.8 per 100,000)
> Cumulative confirmed COVID-19 deaths in Furnas County as of Jan. 27, 2021: 4 (83.6 per 100,000)
> Population: 4,786
> Largest place in Furnas County: Cambridge

Source: BOB WESTON / Getty Images
Nevada: Churchill County
> Avg. new daily cases in Churchill County in week ending Jan. 27, 2021: 71.3 per 100,000
> Cumulative confirmed COVID-19 cases in Churchill County as of Jan. 27, 2021: 1,798 (7,488.6 per 100,000)
> Cumulative confirmed COVID-19 deaths in Churchill County as of Jan. 27, 2021: 48 (199.9 per 100,000)
> Population: 24,010
> Largest place in Churchill County: Fallon
These are all the counties in Nevada where COVID-19 is slowing (and where it’s still getting worse).

Source: BOB WESTON / Getty Images
New Hampshire: Coos County
> Avg. new daily cases in Coos County in week ending Jan. 27, 2021: 69.6 per 100,000
> Cumulative confirmed COVID-19 cases in Coos County as of Jan. 27, 2021: 1,120 (3,495.9 per 100,000)
> Cumulative confirmed COVID-19 deaths in Coos County as of Jan. 27, 2021: 25 (78 per 100,000)
> Population: 32,038
> Largest place in Coos County: Berlin

Source: dougtone / Flickr
New Jersey: Cumberland County
> Avg. new daily cases in Cumberland County in week ending Jan. 27, 2021: 80 per 100,000
> Cumulative confirmed COVID-19 cases in Cumberland County as of Jan. 27, 2021: 12,492 (8,143.5 per 100,000)
> Cumulative confirmed COVID-19 deaths in Cumberland County as of Jan. 27, 2021: 293 (191 per 100,000)
> Population: 153,400
> Largest place in Cumberland County: Vineland

Source: BOB WESTON / Getty Images
New Mexico: Luna County
> Avg. new daily cases in Luna County in week ending Jan. 27, 2021: 107.5 per 100,000
> Cumulative confirmed COVID-19 cases in Luna County as of Jan. 27, 2021: 2,887 (11,898.4 per 100,000)
> Cumulative confirmed COVID-19 deaths in Luna County as of Jan. 27, 2021: 55 (226.7 per 100,000)
> Population: 24,264
> Largest place in Luna County: Deming

Source: dougtone / Flickr
New York: Lewis County
> Avg. new daily cases in Lewis County in week ending Jan. 27, 2021: 101.8 per 100,000
> Cumulative confirmed COVID-19 cases in Lewis County as of Jan. 27, 2021: 1,695 (6,343.9 per 100,000)
> Cumulative confirmed COVID-19 deaths in Lewis County as of Jan. 27, 2021: 25 (93.6 per 100,000)
> Population: 26,719
> Largest place in Lewis County: Lowville

Source: thenationalguard / Flickr
North Carolina: Chowan County
> Avg. new daily cases in Chowan County in week ending Jan. 27, 2021: 104.6 per 100,000
> Cumulative confirmed COVID-19 cases in Chowan County as of Jan. 27, 2021: 1,177 (8,285.9 per 100,000)
> Cumulative confirmed COVID-19 deaths in Chowan County as of Jan. 27, 2021: 20 (140.8 per 100,000)
> Population: 14,205
> Largest place in Chowan County: Edenton

Source: afiler / Flickr
North Dakota: Adams County
> Avg. new daily cases in Adams County in week ending Jan. 27, 2021: 116.3 per 100,000
> Cumulative confirmed COVID-19 cases in Adams County as of Jan. 27, 2021: 254 (10,804.0 per 100,000)
> Cumulative confirmed COVID-19 deaths in Adams County as of Jan. 27, 2021: 2 (85.1 per 100,000)
> Population: 2,351
> Largest place in Adams County: Hettinger

Source: Jacqueline Nix / iStock Editorial via Getty Images
Ohio: Pickaway County
> Avg. new daily cases in Pickaway County in week ending Jan. 27, 2021: 65.7 per 100,000
> Cumulative confirmed COVID-19 cases in Pickaway County as of Jan. 27, 2021: 7,389 (12,868.5 per 100,000)
> Cumulative confirmed COVID-19 deaths in Pickaway County as of Jan. 27, 2021: 50 (87.1 per 100,000)
> Population: 57,420
> Largest place in Pickaway County: Circleville
These are all the counties in Ohio where COVID-19 is slowing (and where it’s still getting worse).

Source: BOB WESTON / iStock via Getty Images
Oklahoma: Murray County
> Avg. new daily cases in Murray County in week ending Jan. 27, 2021: 103.3 per 100,000
> Cumulative confirmed COVID-19 cases in Murray County as of Jan. 27, 2021: 1,672 (12,050.6 per 100,000)
> Cumulative confirmed COVID-19 deaths in Murray County as of Jan. 27, 2021: 16 (115.3 per 100,000)
> Population: 13,875
> Largest place in Murray County: Sulphur

Source: icetsarina / Flickr
Oregon: Umatilla County
> Avg. new daily cases in Umatilla County in week ending Jan. 27, 2021: 48.6 per 100,000
> Cumulative confirmed COVID-19 cases in Umatilla County as of Jan. 27, 2021: 7,028 (9,139.5 per 100,000)
> Cumulative confirmed COVID-19 deaths in Umatilla County as of Jan. 27, 2021: 74 (96.2 per 100,000)
> Population: 76,898
> Largest place in Umatilla County: Hermiston
These are all the counties in Oregon where COVID-19 is slowing (and where it’s still getting worse).

Source: Althom / iStock via Getty Images
Pennsylvania: Forest County
> Avg. new daily cases in Forest County in week ending Jan. 27, 2021: 1,169.10 per 100,000
> Cumulative confirmed COVID-19 cases in Forest County as of Jan. 27, 2021: 1,248 (16,977.5 per 100,000)
> Cumulative confirmed COVID-19 deaths in Forest County as of Jan. 27, 2021: 16 (217.7 per 100,000)
> Population: 7,351
> Largest place in Forest County: Tionesta

Source: cmh2315fl / Flickr
Rhode Island: Providence County
> Avg. new daily cases in Providence County in week ending Jan. 27, 2021: 80.2 per 100,000
> Cumulative confirmed COVID-19 cases in Providence County as of Jan. 27, 2021: 74,239 (11,699.7 per 100,000)
> Cumulative confirmed COVID-19 deaths in Providence County as of Jan. 27, 2021: N/A (N/A per 100,000)
> Population: 634,533
> Largest place in Providence County: Providence

Source: kenlund / Flickr
South Carolina: Spartanburg County
> Avg. new daily cases in Spartanburg County in week ending Jan. 27, 2021: 132 per 100,000
> Cumulative confirmed COVID-19 cases in Spartanburg County as of Jan. 27, 2021: 28,661 (9,484.4 per 100,000)
> Cumulative confirmed COVID-19 deaths in Spartanburg County as of Jan. 27, 2021: 535 (177 per 100,000)
> Population: 302,195
> Largest place in Spartanburg County: Spartanburg

Source: Michael Ciaglo / Getty Images
South Dakota: Jones County
> Avg. new daily cases in Jones County in week ending Jan. 27, 2021: 86.1 per 100,000
> Cumulative confirmed COVID-19 cases in Jones County as of Jan. 27, 2021: 82 (11,156.6 per 100,000)
> Cumulative confirmed COVID-19 deaths in Jones County as of Jan. 27, 2021: 0 (0 per 100,000)
> Population: 735
> Largest place in Jones County: Murdo

Source: thenationalguard / Flickr
Tennessee: Claiborne County
> Avg. new daily cases in Claiborne County in week ending Jan. 27, 2021: 86.9 per 100,000
> Cumulative confirmed COVID-19 cases in Claiborne County as of Jan. 27, 2021: 2,331 (7,373.6 per 100,000)
> Cumulative confirmed COVID-19 deaths in Claiborne County as of Jan. 27, 2021: 36 (113.9 per 100,000)
> Population: 31,613
> Largest place in Claiborne County: Harrogate-Shawanee

Source: BOB WESTON / iStock via Getty Images
Texas: Dimmit County
> Avg. new daily cases in Dimmit County in week ending Jan. 27, 2021: 254.6 per 100,000
> Cumulative confirmed COVID-19 cases in Dimmit County as of Jan. 27, 2021: 1,123 (10,531.9 per 100,000)
> Cumulative confirmed COVID-19 deaths in Dimmit County as of Jan. 27, 2021: 18 (168.8 per 100,000)
> Population: 10,663
> Largest place in Dimmit County: Carrizo Springs
These are all the counties in Texas where COVID-19 is slowing (and where it’s still getting worse).

Source: J. Stephen Conn / Flickr
Utah: Summit County
> Avg. new daily cases in Summit County in week ending Jan. 27, 2021: 93.7 per 100,000
> Cumulative confirmed COVID-19 cases in Summit County as of Jan. 27, 2021: 4,499 (11,105.7 per 100,000)
> Cumulative confirmed COVID-19 deaths in Summit County as of Jan. 27, 2021: 6 (14.8 per 100,000)
> Population: 40,511
> Largest place in Summit County: Park City
These are all the counties in Utah where COVID-19 is slowing (and where it’s still getting worse).

Source: Kirkikis / iStock Editorial via Getty Images
Vermont: Bennington County
> Avg. new daily cases in Bennington County in week ending Jan. 27, 2021: 62 per 100,000
> Cumulative confirmed COVID-19 cases in Bennington County as of Jan. 27, 2021: 976 (2,717.2 per 100,000)
> Cumulative confirmed COVID-19 deaths in Bennington County as of Jan. 27, 2021: 4 (11.1 per 100,000)
> Population: 35,920
> Largest place in Bennington County: Bennington
Source: Warsawvirginia / Wikimedia Commons
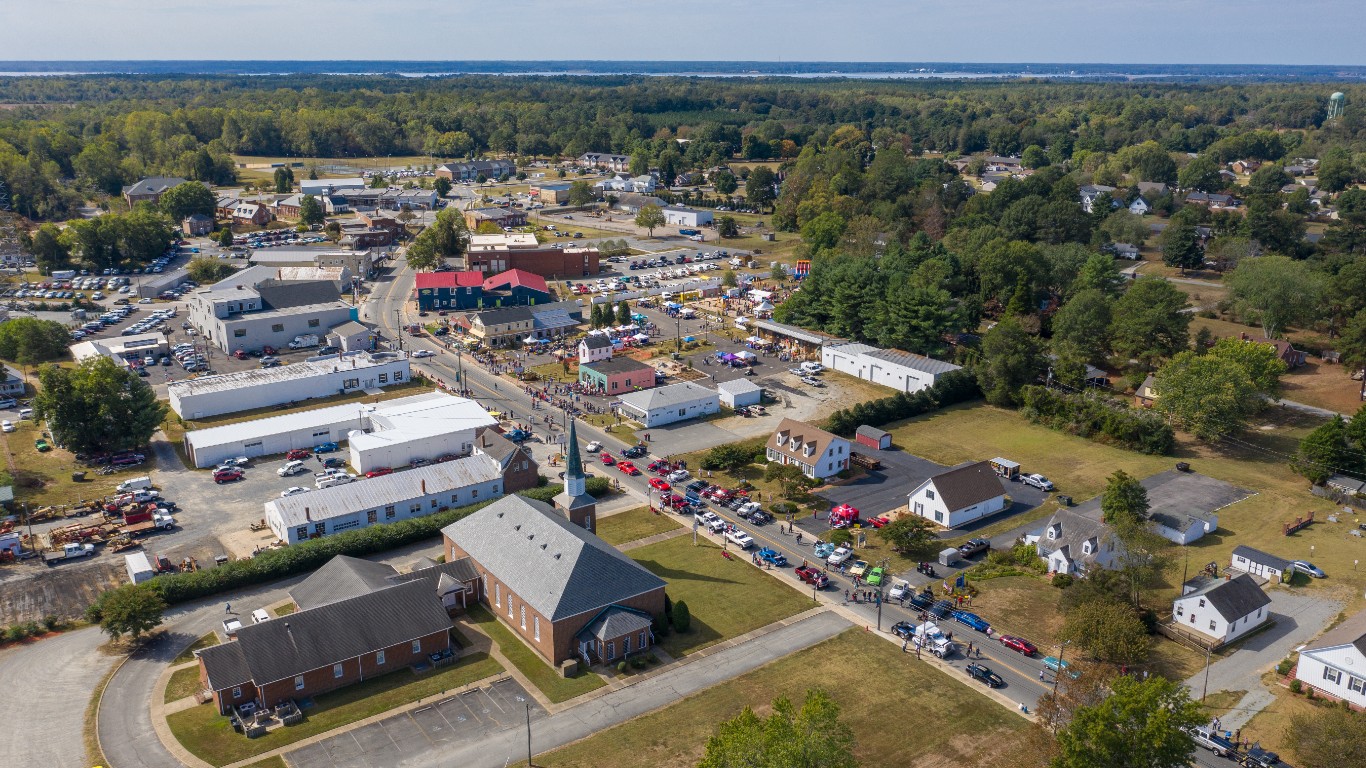
Virginia: Richmond County
> Avg. new daily cases in Richmond County in week ending Jan. 27, 2021: 159.5 per 100,000
> Cumulative confirmed COVID-19 cases in Richmond County as of Jan. 27, 2021: 1,222 (13,764.5 per 100,000)
> Cumulative confirmed COVID-19 deaths in Richmond County as of Jan. 27, 2021: 6 (67.6 per 100,000)
> Population: 8,878
> Largest place in Richmond County: Warsaw

Source: John Moore / Getty Images News via Getty Images
Washington: Yakima County
> Avg. new daily cases in Yakima County in week ending Jan. 27, 2021: 48.2 per 100,000
> Cumulative confirmed COVID-19 cases in Yakima County as of Jan. 27, 2021: 23,990 (9,622.1 per 100,000)
> Cumulative confirmed COVID-19 deaths in Yakima County as of Jan. 27, 2021: 365 (146.4 per 100,000)
> Population: 249,325
> Largest place in Yakima County: Yakima

Source: Famartin / Wikimedia Commons
West Virginia: Pendleton County
> Avg. new daily cases in Pendleton County in week ending Jan. 27, 2021: 134.5 per 100,000
> Cumulative confirmed COVID-19 cases in Pendleton County as of Jan. 27, 2021: 536 (7,596.4 per 100,000)
> Cumulative confirmed COVID-19 deaths in Pendleton County as of Jan. 27, 2021: 4 (56.7 per 100,000)
> Population: 7,056
> Largest place in Pendleton County: Franklin

Source: thenationalguard / Flickr
Wisconsin: Buffalo County
> Avg. new daily cases in Buffalo County in week ending Jan. 27, 2021: 62.5 per 100,000
> Cumulative confirmed COVID-19 cases in Buffalo County as of Jan. 27, 2021: 1,244 (9,448.0 per 100,000)
> Cumulative confirmed COVID-19 deaths in Buffalo County as of Jan. 27, 2021: 7 (53.2 per 100,000)
> Population: 13,167
> Largest place in Buffalo County: Mondovi

Source: Justinreznick / iStock
Wyoming: Teton County
> Avg. new daily cases in Teton County in week ending Jan. 27, 2021: 152.1 per 100,000
> Cumulative confirmed COVID-19 cases in Teton County as of Jan. 27, 2021: 3,020 (13,097.0 per 100,000)
> Cumulative confirmed COVID-19 deaths in Teton County as of Jan. 27, 2021: 6 (26 per 100,000)
> Population: 23,059
> Largest place in Teton County: Jackson
Click here to see all coronavirus data for every state.
Essential Tips for Investing: Sponsored
A financial advisor can help you understand the advantages and disadvantages of investment properties. Finding a qualified financial advisor doesn’t have to be hard. SmartAsset’s free tool matches you with up to three financial advisors who serve your area, and you can interview your advisor matches at no cost to decide which one is right for you. If you’re ready to find an advisor who can help you achieve your financial goals, get started now.
Investing in real estate can diversify your portfolio. But expanding your horizons may add additional costs. If you’re an investor looking to minimize expenses, consider checking out online brokerages. They often offer low investment fees, helping you maximize your profit.
Thank you for reading! Have some feedback for us?
Contact the 24/7 Wall St. editorial team.
Editors' Picks


