
State governments are constitutionally granted the power to control taxes, make and enforce laws, and regulate commerce within their borders. With these tools, state governments across the country are ultimately responsible for keeping safe streets, balancing the budget, and promoting economic vitality. Some states have proven to be more adept than others at achieving these goals.
For the 11th consecutive year, 24/7 Wall St. reviewed economic indicators, budget allocations, and state balance sheets, in addition to a range of social measures to rank how well each state is run. Data came from a wide range of public and private sources, including public policy think tank The Pew Charitable Trusts and the U.S. Census Bureau.
Several indicators can point to fiscal mismanagement at the state level, including a minimal rainy day fund — funds set aside for budget emergencies — and less-than-perfect credit rating scores from ratings agencies. Many of these states are ranked lower on this list. Lower-ranking states also tend to have an underfunded pension system. Many states are facing a pension crisis, with pension obligations far outweighing available funds. Here is a look at every state’s pension crisis, ranked.
The ongoing public health and economic crises that have resulted from the COVID-19 pandemic demonstrate the wide range of ways that state governments across the country can respond to similar challenges. In recent months, some states have kept businesses open in the interest of economic vitality, often at the risk of spreading the virus more widely and rapidly. Others, meanwhile, have opted to shut down large segments of the economy in the hopes of slowing the virus’s spread. These different approaches reflect governments’ different priorities, and each has contributed to vastly different outcomes. Here is a look at the states where the virus is spreading the fastest.
It is important to note, however, that public health and economic data used to create this list are for 2019 and earlier. As a result, COVID-19 has not impacted this year’s rankings of the best and worst-run states. Additionally, a state’s relative ranking on this list is not necessarily attributable to sitting elected officials as governing strategies and budget priorities can have consequences that extend far beyond the tenure of those who set them.
Click here to see the best and worst run states in America.
Click here to see our detailed methodology.

Source: fotoguy22 / Getty Images
1. Utah
> 2019 unemployment: 2.6% (4th lowest)
> Pension funded ratio: 85.2% (9th highest)
> 1 yr. GDP growth: +3.8% (4th highest)
> Poverty rate: 8.9% (2nd lowest)
> Moody’s credit rating and outlook: Aaa/Stable
For the second year in a row, Utah ranks as the best run state in the country. The state is one of only 12 nationwide with a perfect triple-A rating and stable outlook from credit rating agency Moody’s. It also has the funding to meet over 85% of its pension obligations, well above the 70.7% average among all states.
Not only is the state government in a strong financial position, but many of the state’s residents are as well. Utah’s 8.9% poverty rate is nearly the lowest in the country, and the median household income in the state of $75,780 is higher than in all but 10 other states. Widespread financial stability is partially the product of a strong job market. Utah’s annual unemployment rate of 2.6% is lower than that of all by three other states and well below the 3.7% national rate.
[in-text-ad]

Source: YinYang / Getty Images
2. Washington
> 2019 unemployment: 4.3% (8th highest)
> Pension funded ratio: 93.9% (5th highest)
> 1 yr. GDP growth: +4.6% (2nd highest)
> Poverty rate: 9.8% (9th lowest)
> Moody’s credit rating and outlook: Aaa/Stable
Washington’s economy is growing faster than that of nearly every other state. At 4.6%, GDP growth in Washington in 2019 was more than double the 2.2% national economic growth the same year. Washington is one of only half a dozen states to report employment growth above 10% from 2015 to 2019.
Policy makers in Washington have positioned the state well to meet its financial obligations. About 94% of the state’s public employee pension system is funded — well above the 70.7% average funding across all states. Additionally, Washington is one of only 12 states with a perfect triple-A credit rating and a stable outlook from Moody’s.
 24/7 Wall St.
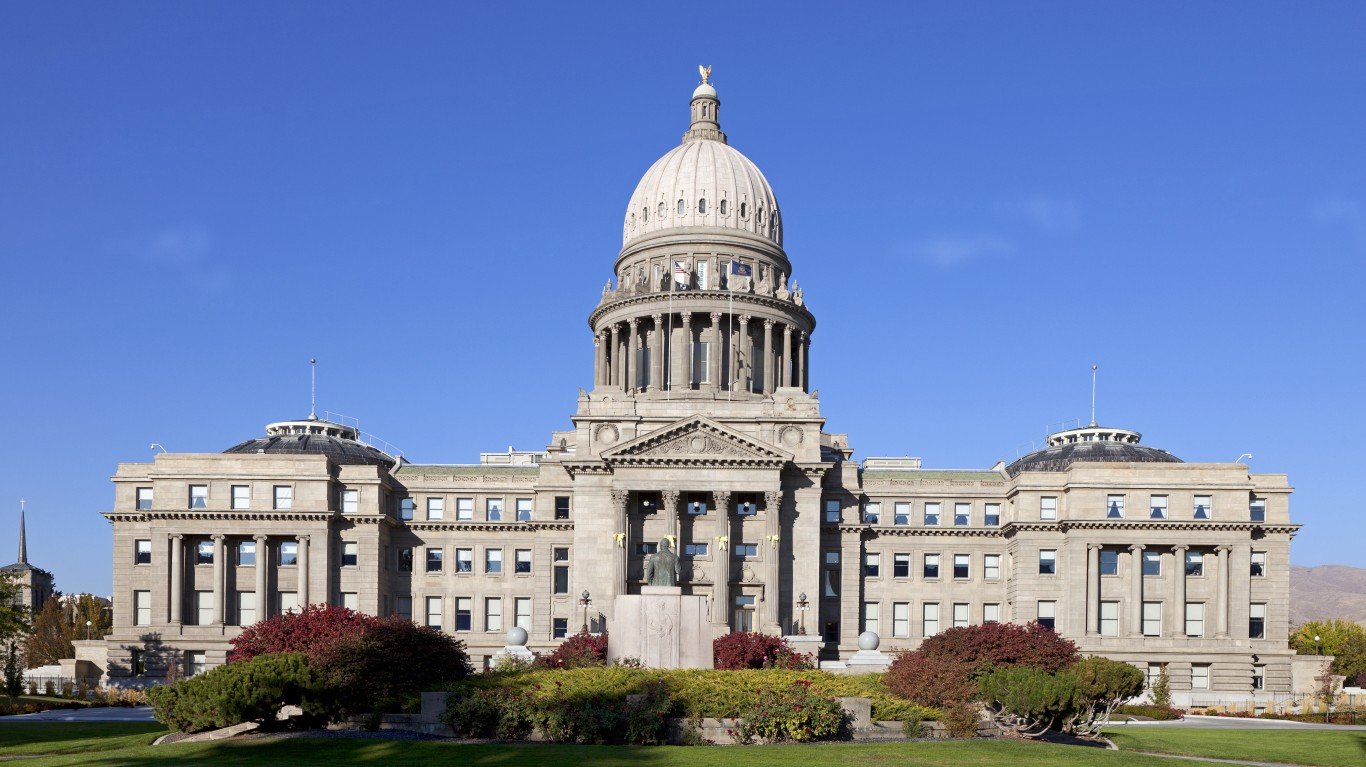
Source: KingWu / Getty Images
3. Idaho
> 2019 unemployment: 2.9% (11th lowest)
> Pension funded ratio: 92.4% (6th highest)
> 1 yr. GDP growth: +3.4% (5th highest)
> Poverty rate: 11.2% (21st lowest)
> Moody’s credit rating and outlook: Aa1/Stable
Idaho is one of fewer than a dozen states with an annual unemployment rate below 3%. Violent crime is also fairly uncommon in Idaho, as there were only 224 reported incidents for every 100,000 people in 2019, well below the national violent crime rate of 367 per 100,000.
A relatively safe state with a healthy job market, Idaho drew in tens of thousands of new residents in 2019. The state’s population grew 2.1% last year — more than every other state and over four times the 0.5% U.S. population growth rate. Population growth can contribute to economic growth, and Idaho’s economy is among the fastest growing in the country. The state’s GDP expanded by 3.4% in 2019, compared to 2.2% U.S. GDP growth.

Source: gkuchera / Getty Images
4. Minnesota
> 2019 unemployment: 3.2% (17th lowest)
> Pension funded ratio: 81.8% (15th highest)
> 1 yr. GDP growth: +1.1% (15th lowest)
> Poverty rate: 9.0% (4th lowest)
> Moody’s credit rating and outlook: Aa1/Stable
Minnesota ranks as the best-run state in the Midwest and fourth best nationwide. In 2019, before the pandemic sent the unemployment rate soaring nationwide, only 3.2% of the labor force in Minnesota was out of work, one of the lower unemployment rates among states. A strong job market reduces the likelihood of serious financial hardship for state residents, and Minnesota is one of fewer than a dozen states with a poverty rate below 10%.
Many states are facing a budget shortfall and do not have the revenue or savings necessary to cover public employee pensions. Minnesota is better positioned than most, however, with funding for over 80% of its pension obligations. Minnesota has ranked among the top five best run states every year since 2014.
[in-text-ad-2]

Source: carl173 / Getty Images
5. Colorado
> 2019 unemployment: 2.8% (9th lowest)
> Pension funded ratio: 58.8% (9th lowest)
> 1 yr. GDP growth: +3.9% (3rd highest)
> Poverty rate: 9.3% (7th lowest)
> Moody’s credit rating and outlook: Aa2/Stable
Colorado was among the 10 fastest growing states, by population, last year. And like most states people are flocking to, Colorado’s economy is growing rapidly. The state reported near nation-leading 3.9% GDP growth in 2019. For context, the U.S. economy grew by 2.2% the same year.
A strong job market may partially explain Colorado’s rapid population and economic growth. From 2015 to 2019, employment in Colorado climbed by 9.6%, more than in all but six other states. In 2019, before the COVID-19 recession, just 2.8% of the labor force in Colorado was unemployed, well below the 3.7% national annual unemployment rate.

Source: 4kodiak / Getty Images
6. Oregon
> 2019 unemployment: 3.7% (18th highest)
> Pension funded ratio: 82.1% (14th highest)
> 1 yr. GDP growth: +2.8% (12th highest)
> Poverty rate: 11.4% (24th lowest)
> Moody’s credit rating and outlook: Aa1/Stable
Oregon ranks as one of the best run states in the country in large part because of its positive financial outlook. Moody’s gave its seniormost tax backed bond an Aa1 rating, the second-best possible score, and said the state’s outlook is stable. The state’s current rainy day fund could cover 12.7% of the state’s general expenditures, the ninth highest share among states and well above the 8.7% average among states.
Oregon has ranked as one of the 10 best run states every year since 2016. The state’s job market has consistently improved, with the number of people employed growing by 9.0% from 2015 to 2019, the ninth largest increase of any state over that time.
[in-text-ad]

Source: DenisTangneyJr / Getty Images
7. Nevada
> 2019 unemployment: 3.9% (15th highest)
> Pension funded ratio: 75.3% (23rd highest)
> 1 yr. GDP growth: +2.7% (13th highest)
> Poverty rate: 12.5% (21st highest)
> Moody’s credit rating and outlook: Aa1/Negative
Nevada ranked as one of the five worst run states in the country in 2013. After years of steady improvement, it now ranks as one of the 10 best. Nevada is one of the fastest growing states in the country, with its population growing by 1.7% from 2018 to 2019, largely due to migration. Nationwide, the population increased by 0.5% during that same time period.
Nevada does not have a large amount of debt when compared to other states, at $1,116 per capita — the third lowest of any state. Its debt accounts for just 15.8% of revenue, compared to 44.6% in the typical state.
 24/7 Wall St.
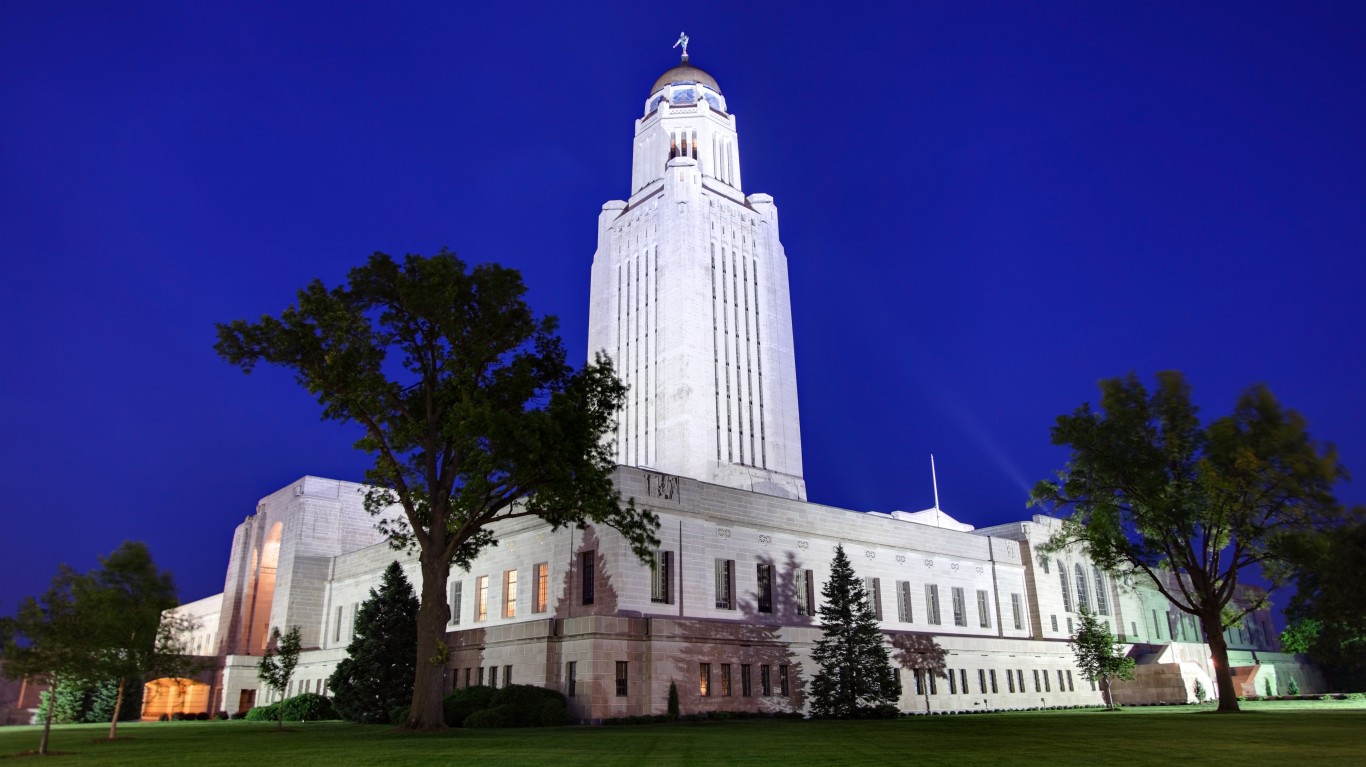
Source: DenisTangneyJr / Getty Images
8. Nebraska
> 2019 unemployment: 3.0% (14th lowest)
> Pension funded ratio: 90.3% (7th highest)
> 1 yr. GDP growth: +2.0% (20th highest)
> Poverty rate: 9.9% (11th lowest)
> Moody’s credit rating and outlook: Aa2/Stable
Nebraska has ranked as one of the 10 best run states each year since 2011. Though the state’s median household income of $63,229 is about $2,500 lower than the national median, residents are relatively unlikely to struggle financially. In 2019, Nebraska was one of just 11 states with a poverty rate under 10%. It also had a relatively low unemployment rate, at 3.0%. The national unemployment rate was 3.7% in 2019.
The cost of living is relatively low in Nebraska, as goods and services are about 10% cheaper in the state than they are nationwide.
Source: traveler1116 / Getty Images
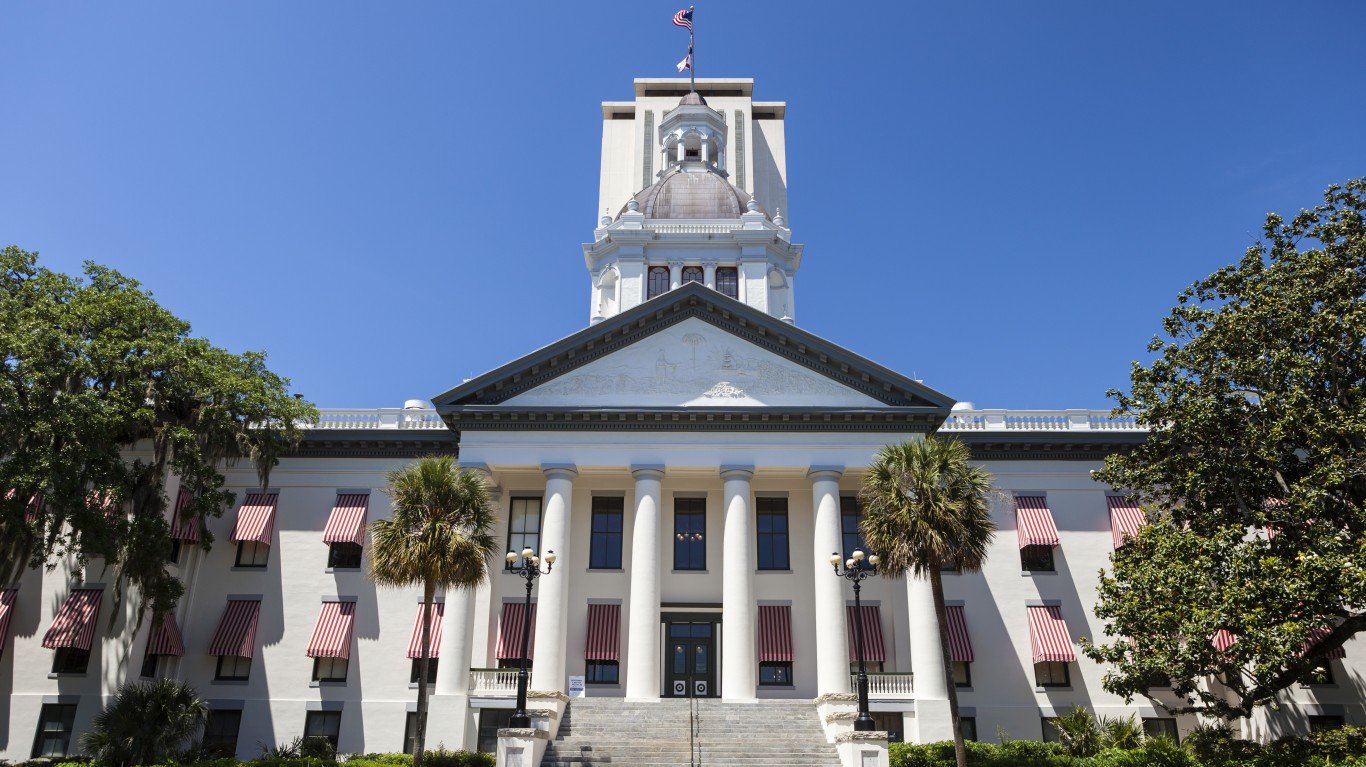
9. Florida
> 2019 unemployment: 3.1% (15th lowest)
> Pension funded ratio: 79.9% (19th highest)
> 1 yr. GDP growth: +2.8% (9th highest)
> Poverty rate: 12.7% (19th highest)
> Moody’s credit rating and outlook: Aaa/Stable
Florida’s economy has flourished in recent years. Total employment grew by 10.4% from 2015 to 2019, the fifth highest increase among states and well beyond the 6.4% growth nationwide. Florida’s real GDP increased 2.8% from 2018 to 2019, one of the 10 largest increases.
Owning a home is one of the most common and practical ways to build wealth as home values increase over time. Florida ranks as one of the best run states in part because of how much home values increased — by 36.3% from 2015 to 2019. Nationwide, home values rose by 23.7% over that time period.
[in-text-ad-2]

Source: powerofforever / Getty Images
10. North Dakota
> 2019 unemployment: 2.4% (2nd lowest)
> Pension funded ratio: 65.2% (16th lowest)
> 1 yr. GDP growth: +0.9% (11th lowest)
> Poverty rate: 10.6% (17th lowest)
> Moody’s credit rating and outlook: Aa2/Stable
North Dakota’s GDP per capita is sixth in the nation at over $70,000. The national GDP per capita is just over $58,000..
North Dakota is an oil and gas powerhouse, and its exports per capita rank third in the nation at over $8,000 per person. However, the number of active drilling rigs declined sharply starting in 2015, and this is likely one reason why the state has had one of the worst job markets in the country in recent years. From 2015 to 2019, the number of jobs in North Dakota fell by 3.0%, more than any other state.

Source: traveler1116 / Getty Images
11. Texas
> 2019 unemployment: 3.5% (24th highest)
> Pension funded ratio: 70.6% (24th lowest)
> 1 yr. GDP growth: +2.9% (8th highest)
> Poverty rate: 13.6% (11th highest)
> Moody’s credit rating and outlook: Aaa/Stable
Texas ranks as the 11th the best run state because of its solid financial footing. It is one of just a dozen states with a triple-A rating and a stable outlook from Moody’s. The state’s rainy day fund could cover over 21% of its general fund expenditures. The average rainy day coverage across states is less than 9% of expenditures.
As a large exporter of petroleum, the state’s exports per capita of $11,398 in 2019 were second highest of any state and more than double the national exports per capita of $5,000.
[in-text-ad]

Source: traveler1116 / Getty Images
12. Delaware
> 2019 unemployment: 3.8% (17th highest)
> Pension funded ratio: 85.1% (10th highest)
> 1 yr. GDP growth: +1.8% (22nd highest)
> Poverty rate: 11.3% (22nd lowest)
> Moody’s credit rating and outlook: Aaa/Stable
Delaware residents tend to be financially well off, with a median annual household income of over $70,000. Nationwide, the median household income is $65,712. The state’s poverty rate is 11.3%, a full percentage point lower than the U.S. rate.
Also, Delaware’s real GDP per capita of just over $66,000 is the ninth highest of any state. The U.S. real GDP per capita is nearly $8,000 lower. The state is also one of 12 with a Aaa credit rating from Moody’s.
 24/7 Wall St.
Source: benedek / iStock via Getty Images
13. Massachusetts
> 2019 unemployment: 2.9% (11th lowest)
> Pension funded ratio: 60.6% (10th lowest)
> 1 yr. GDP growth: +2.4% (17th highest)
> Poverty rate: 9.4% (8th lowest)
> Moody’s credit rating and outlook: Aa1/Stable
Massachusetts ranks as the best run state in the Northeast. Before the COVID-19 pandemic and resulting recession, Massachusetts had one of the strongest job markets in the country with an annual unemployment rate of only 2.9%. Over the same period, the national jobless rate was 3.7%. Economic growth in Massachusetts was also relatively strong, with 2.4% GDP growth in 2019 compared to the 2.2% national economic expansion.
The Massachusetts state government, as well as local governments across the state, benefit from a relatively strong tax base. The typical household in the state earns $85,843 a year, about $20,000 more than the typical American household.

Source: timhughes / Getty Images
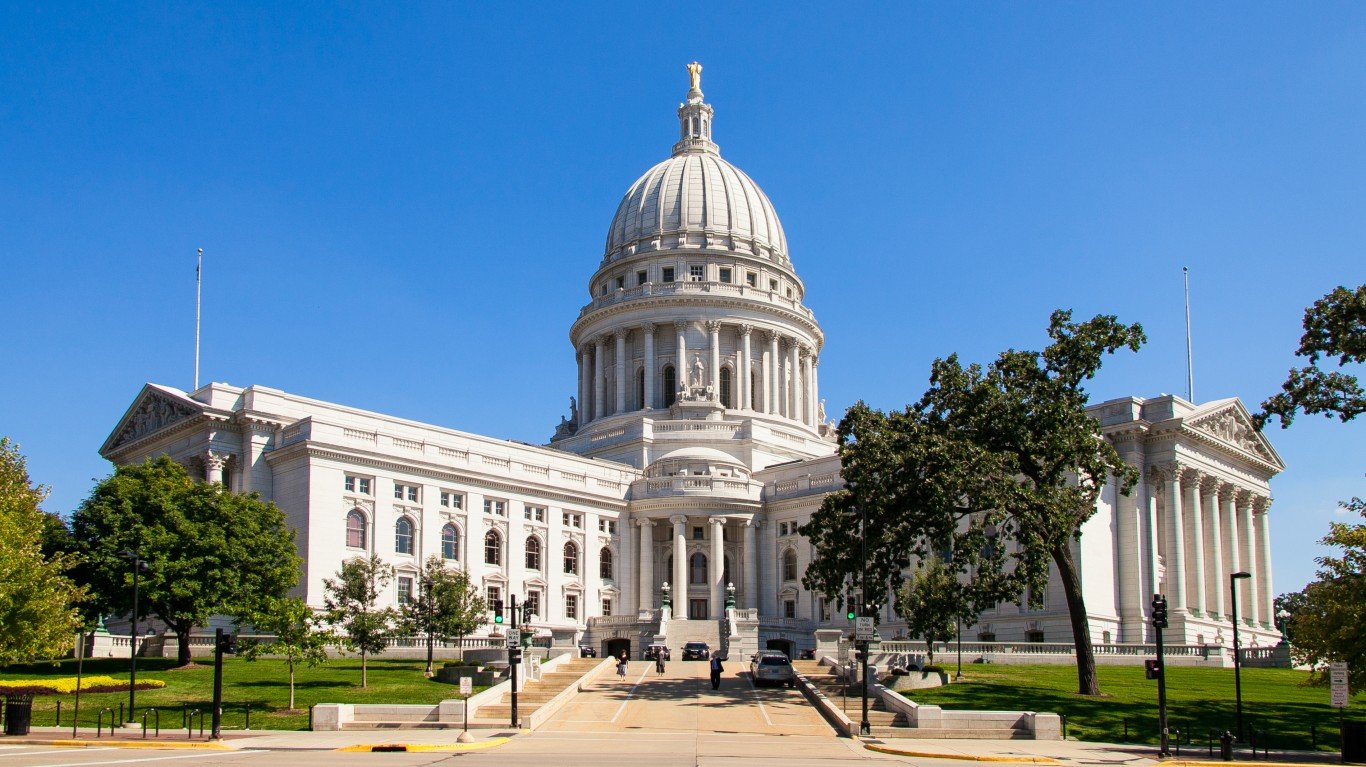
14. Wisconsin
> 2019 unemployment: 3.3% (22nd lowest)
> Pension funded ratio: 96.5% (4th highest)
> 1 yr. GDP growth: +1.4% (20th lowest)
> Poverty rate: 10.4% (16th lowest)
> Moody’s credit rating and outlook: Aa1/Stable
Wisconsin has one of the best-funded pension systems in the United States. The state has assets on hand to back 96.5% of its pension liabilities, a larger share than all but three other states. Wisconsin residents are also less likely than most Americans to be unemployed or live below the poverty line.
In addition to performing well in several economic measures and fiscal management indicators, Wisconsin also performs better than most other states in some social measures. For example, the violent crime rate in the state is just 293 incidents for every 100,000 people annually. Meanwhile, the national rate is 367 incidents per 100,000 people.
[in-text-ad-2]

Source: jiawangkun / Getty Images
15. New Hampshire
> 2019 unemployment: 2.5% (3rd lowest)
> Pension funded ratio: 64.7% (15th lowest)
> 1 yr. GDP growth: +1.4% (21st lowest)
> Poverty rate: 7.3% (the lowest)
> Moody’s credit rating and outlook: Aa1/Stable
New Hampshire is the second best run state in the Northeast and 15th best run state nationwide. By several economic measures, New Hampshire towers over other states. The New England state boasts the nation’s lowest poverty rate, at 7.3%, and a 2019 unemployment rate of 2.5%, which is over a full percentage point below the 3.7% national jobless rate.
New Hampshire has also done a better job than most states at keeping crime rates low. There were only 153 violent crimes for every 100,000 people in the state in 2019, well below the national violent crime rate of 367 incidents per 100,000 people.

Source: zrfphoto / Getty Images
16. California
> 2019 unemployment: 4.0% (12th highest)
> Pension funded ratio: 71.1% (25th lowest)
> 1 yr. GDP growth: +3.4% (6th highest)
> Poverty rate: 11.8% (25th highest)
> Moody’s credit rating and outlook: Aa2/Stable
California reported near nation-leading economic growth in 2019, with GDP expanding by 3.4%, a greater growth than all but five other states and well above the 2.2% national GDP growth that year. California is also better positioned than most states to fund government operations in the event of a budget deficit, with $21.2 billion in a rainy day fund — enough to cover about 15% of annual government spending. Most states have less than 10% of their annual expenditures saved in a rainy day fund.
California does not rank better than most states in many other important measures, however. For example, even before the COVID-19 pandemic, the state’s annual unemployment rate was 4.0%, higher than most other states and the 3.7% national jobless rate.
[in-text-ad]

Source: Ron and Patty Thomas / Getty Images
17. Tennessee
> 2019 unemployment: 3.4% (24th lowest)
> Pension funded ratio: 97.7% (3rd highest)
> 1 yr. GDP growth: +1.6% (24th lowest)
> Poverty rate: 13.9% (9th highest)
> Moody’s credit rating and outlook: Aaa/Stable
Tennessee faces greater social and public health challenges than most states. One of the most dangerous states in the country, Tennessee’s violent crime rate of 595 incidents per 100,000 people is higher than that of all but two other states and well above the national rate of 367 per 100,000. Additionally, life expectancy at birth in Tennessee is just 76 years, three years below the national average.
Still, Tennessee is one of the most fiscally well-managed states in the country. At a time when many states are facing a pension crisis, Tennessee has assets on hand to cover about 98% of its pension liabilities. Additionally, Tennessee is one of only 12 states with a perfect triple-A credit rating and a stable outlook from Moody’s.
 24/7 Wall St.
Source: traveler1116 / Getty Images
18. Virginia
> 2019 unemployment: 2.8% (9th lowest)
> Pension funded ratio: 79.0% (20th highest)
> 1 yr. GDP growth: +2.2% (18th highest)
> Poverty rate: 9.9% (11th lowest)
> Moody’s credit rating and outlook: Aaa/Stable
Virginia is one of the safest states in the country. There were only 208 violent crimes reported in the state in 2019 for every 100,000 people, well below that year’s national violent crime rate of 367 per 100,000. Virginia residents are also more likely than most Americans to avoid poverty. The state is one of fewer than a dozen nationwide with a poverty rate below 10%.
While the Virginia population may be better positioned financially than Americans on average, the state government is not. Virginia has only $792 million saved in a rainy day fund — enough to cover only 3.7% of its annual expenditures. On average, state rainy day savings have funding to cover 8.7% of annual expenditures.

Source: Sean Pavone / Getty Images
19. Georgia
> 2019 unemployment: 3.4% (24th lowest)
> Pension funded ratio: 80.1% (18th highest)
> 1 yr. GDP growth: +1.6% (25th highest)
> Poverty rate: 13.3% (14th highest)
> Moody’s credit rating and outlook: Aaa/Stable
Before the COVID-19 pandemic, job growth was relatively strong in Georgia. Overall employment climbed by 8.3% in the state from 2015 to 2019, outpacing the comparable 6.4% national job growth rate. Partially as a result, Georgia’s 3.4% 2019 annual unemployment rate is below the 3.7% national jobless rate.
While job growth has been strong, overall economic growth in Georgia has been less robust. Last year, Georgia’s economy expanded by just 1.6% — trailing the national 2019 GDP growth of 2.2%.
[in-text-ad-2]

Source: Eifel Kreutz / Getty Images
20. North Carolina
> 2019 unemployment: 3.9% (15th highest)
> Pension funded ratio: 88.6% (8th highest)
> 1 yr. GDP growth: +1.9% (21st highest)
> Poverty rate: 13.6% (11th highest)
> Moody’s credit rating and outlook: Aaa/Stable
By several measures, North Carolina is better fiscally managed than most other states. Not only is it one of only 12 states with a perfect triple-A credit rating and a stable outlook from Moody’s, but it also has a well-funded pension system at a time when many states are confronting a pension crisis. North Carolina has about $97.6 billion in assets for employee pensions, enough to cover 88.6% of its obligations. On average, states have assets to cover only about 71% of pension obligations.
In some other key economic measures, North Carolina is lagging much of the rest of the country. For example, North Carolina residents are more likely to live below the poverty line and more likely to be unemployed than most Americans. More robust economic growth would likely help reduce the state’s high poverty and unemployment rates. North Carolina’s GDP expanded by just 1.9% in 2019, slower than in most states and below the 2.2% national economic growth rate.

Source: Davel5957 / Getty Images
21. Iowa
> 2019 unemployment: 2.7% (6th lowest)
> Pension funded ratio: 83.6% (12th highest)
> 1 yr. GDP growth: +0.4% (2nd lowest)
> Poverty rate: 11.2% (21st lowest)
> Moody’s credit rating and outlook: Aa2/Stable
Annual GDP growth in Iowa was slower than in nearly every other state in 2019. Iowa’s economy grew by just 0.4% last year, well below the 2.2% national GDP growth rate. Job growth in the state has also been lackluster in recent years. Overall employment climbed by just 1.6% in Iowa from 2015 to 2019. Meanwhile, the national employment growth rate was 6.4% over the same period.
Despite sluggish growth, Iowa’s job market is stronger than that of most other states. An average of just 2.7% of the state’s labor force was unemployed in 2019, a full percentage point below the comparable national jobless rate.
[in-text-ad]

Source: gregobagel / Getty Images
22. Maryland
> 2019 unemployment: 3.6% (20th highest)
> Pension funded ratio: 70.4% (23rd lowest)
> 1 yr. GDP growth: +1.4% (22nd lowest)
> Poverty rate: 9.0% (4th lowest)
> Moody’s credit rating and outlook: Aaa/Stable
In many key indicators of fiscal and economic management, Maryland closely aligns with the overall average across states. For example, Maryland has enough assets to cover about 70% of its total pension obligations, compared to the 71% average across all states. Additionally, Maryland’s pre-COVID annual jobless rate of 3.6% is only a tenth of a point below the comparable 3.7% national unemployment rate.
In other ways, the state stands out from much of the rest of the country — in both good ways and bad. On one hand, Maryland is one of only 12 states with a perfect triple-A credit rating and a stable outlook from Moody’s. However, annual GDP growth in the state is a relatively sluggish 1.4%, compared to the 2.2% national economic growth rate.

Source: lkonya / Getty Images
23. Hawaii
> 2019 unemployment: 2.7% (6th lowest)
> Pension funded ratio: 55.5% (8th lowest)
> 1 yr. GDP growth: +0.3% (the lowest)
> Poverty rate: 9.3% (7th lowest)
> Moody’s credit rating and outlook: Aa2/Stable
Before the COVID-19 pandemic, Hawaii had one of the strongest labor markets in the United States. An average of just 2.7% of the state labor force was unemployed in 2019, compared to just 3.7% of the labor force nationwide. However, Hawaii’s economy, which is heavily dependent on tourism, was hit hard by the COVID-19 pandemic and unemployment has since surged statewide. Economic growth has also been weak in Hawaii before the pandemic. The state’s GDP grew by just 0.3% in 2019, the smallest improvement of any state and well below the comparable 2.2% national GDP growth.
An educated population can be fundamental to economic vitality in a given region, and in Hawaii, 92.4% of adults have a high school diploma or higher, compared to just 88.6% of adults nationwide. Hawaii allocates about 28% of its annual expenditures to education, more than every other state except for Utah.

Source: DenisTangneyJr / Getty Images
24. Wyoming
> 2019 unemployment: 3.6% (20th highest)
> Pension funded ratio: 68.5% (21st lowest)
> 1 yr. GDP growth: +1.3% (17th lowest)
> Poverty rate: 10.1% (14th lowest)
> Moody’s credit rating and outlook: N/A
By several measures, Wyoming is in a more secure financial position than every other state. First, the state has enough saved in a rainy day fund to cover about 97% of its annual expenditures — more than any other state. On average, states have enough saved in rainy day funds to cover only about 9% of yearly spending. Additionally, Wyoming’s debt levels are equal to only about 11% of annual revenue, the smallest share of any state.
In other key measures, however, Wyoming lags behind much of the country. For example, employment fell by 2.5% in the state over the last five years. Over the same period, employment climbed 6.4% nationwide. Economic growth has also been lackluster, as Wyoming’s GDP expanded by just 1.3% in 2019, nearly a full percentage point below the 2.2% national economic growth rate.
[in-text-ad-2]
Source: ChrisBoswell / iStock via Getty Images
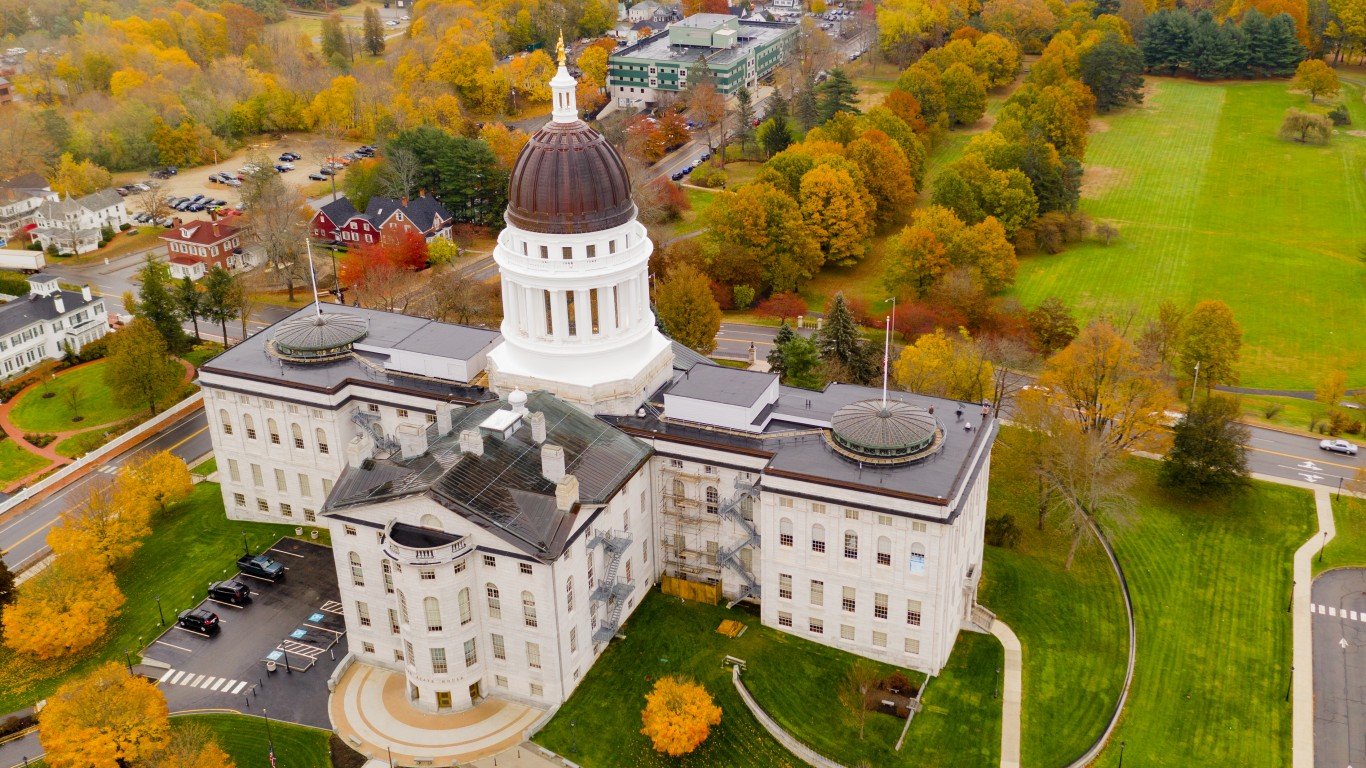
25. Maine
> 2019 unemployment: 3.0% (14th lowest)
> Pension funded ratio: 84.5% (11th highest)
> 1 yr. GDP growth: +2.6% (14th highest)
> Poverty rate: 10.9% (19th lowest)
> Moody’s credit rating and outlook: Aa2/Stable
Maine ranks as the safest state in the country. There were only 115 violent crimes for every 100,000 people in Maine in 2019, less than one-third the national violent crime rate of 367 incidents per 100,000 Americans. Maine residents are also relatively financially secure as they are less likely to be unemployed and less likely to live below the poverty line than most Americans.
For many Americans, homeownership is a practical way to build wealth — but in Maine, real estate investment has not been especially profitable in recent years. The typical home in Maine appreciated in value by just 11.2% in the last five years, while the typical home nationwide was worth 23.6% more in 2019 than in 2015.
Source: traveler1116 / Getty Images
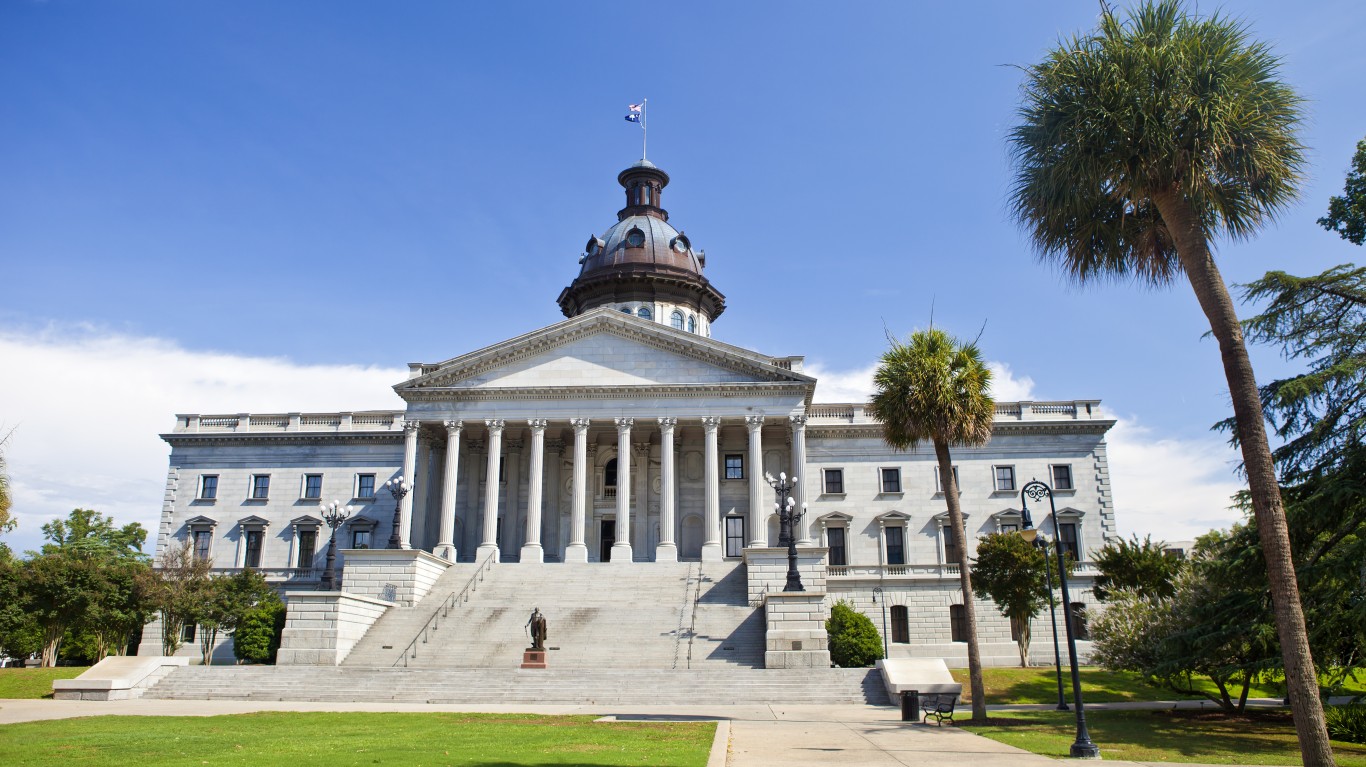
26. South Carolina
> 2019 unemployment: 2.8% (9th lowest)
> Pension funded ratio: 55.1% (7th lowest)
> 1 yr. GDP growth: +2.8% (10th highest)
> Poverty rate: 13.8% (10th highest)
> Moody’s credit rating and outlook: Aaa/Stable
Before the COVID-19 pandemic, South Carolina had one of the lowest unemployment rates in the country. An average of just 2.8% of the labor force in the state was unemployed last year, compared to the 3.7% national unemployment rate.
While jobs appear widely available in the state, they are generally not very well paying. The typical South Carolina household earns just $56,227 a year, about $9,500 less than the median household income nationwide. South Carolina’s poverty rate of 13.8% is also higher than the 12.3% national poverty rate. Despite high poverty, South Carolina allocates just 40% of its annual spending to social services and income maintenance, less than the 43% average across all states.
[in-text-ad]

Source: SeanPavonePhoto / iStock via Getty Images
27. Vermont
> 2019 unemployment: 2.4% (2nd lowest)
> Pension funded ratio: 64.2% (14th lowest)
> 1 yr. GDP growth: +0.8% (9th lowest)
> Poverty rate: 10.2% (15th lowest)
> Moody’s credit rating and outlook: Aa1/Stable
An estimated 5.7% of Vermont’s annual spending goes towards public safety, a larger share than all but three other states. The state also has one of the lowest violent crime rates in the country. There were just 202 violent crimes for every 100,000 people in Vermont in 2019, compared to the national violent crime rate of 367 per 100,000. Vermonters also benefit from one of the strongest job markets in the country, as just 2.4% of the labor force was unemployed in 2019, compared to the 3.7% national unemployment rate.
Safe streets and job opportunities have not been enough to draw in new residents, however, and Vermont is one of only 10 states to report population decline in 2019. Fewer residents translate to reduced demand for housing, and that may be having an effect on real estate values in the state. The typical home in Vermont appreciated by just 0.04% in 2019, while the typical home nationwide was worth 4.7% more in 2019 than in the previous year.

Source: powerofforever / Getty Images
28. Montana
> 2019 unemployment: 3.5% (24th highest)
> Pension funded ratio: 72.6% (24th highest)
> 1 yr. GDP growth: +2.8% (11th highest)
> Poverty rate: 12.6% (20th highest)
> Moody’s credit rating and outlook: Aa1/Stable
Economic growth in Montana has been relatively strong as the state reported 2.8% GDP growth in 2019, outpacing the 2.2% national GDP growth rate that year. The state’s job market is also healthier than most, as the 2019 unemployment rate in Montana was just 3.5% — slightly below the 3.7% national jobless rate.
In other key measures, Montana lags behind much of the rest of the country. For example, the state has only about $60 million saved in a rainy day fund — enough to cover just 2.5% of its annual expenditures. Meanwhile, across all states, the average rainy day fund can cover about 9% of annual budget expenses.

Source: lavendertime / Getty Images
29. New York
> 2019 unemployment: 4.0% (12th highest)
> Pension funded ratio: 98.0% (2nd highest)
> 1 yr. GDP growth: +1.6% (25th lowest)
> Poverty rate: 13.0% (16th highest)
> Moody’s credit rating and outlook: Aa2/Stable
New York is one of the healthiest states in the country, with a life expectancy at birth of 81.3 years — the third highest of any state. The state also has the highest real GDP per capita of any state, at more than $76,600. Nationwide, real GDP per capita is $58,164.
New York’s fiscal management measures are a mixed bag. New York’s credit rating of Aa2 with a stable outlook from Moody’s is lower than 27 other states. Similarly, the state’s rainy day fund is small, able to cover only 2.8% of its general expenditures — one of the lowest shares of any state and well below the average across all states of 8.7%. On the other hand, New York has enough assets to cover 98% of its pension obligations, the second highest pension funded ratio of any state.
[in-text-ad-2]

Source: benedek / Getty Images
30. Arizona
> 2019 unemployment: 4.7% (6th highest)
> Pension funded ratio: 65.5% (17th lowest)
> 1 yr. GDP growth: +3.1% (7th highest)
> Poverty rate: 13.5% (13th highest)
> Moody’s credit rating and outlook: Aa2/Stable
Arizona’s economy grew by 3.1% in 2019 — faster than all but six other states and far outpacing the 2.2% national GDP growth the same year.
The rapid economic growth has not, however, translated to a strong job market or a low poverty rate in Arizona. Even before the COVID-19 pandemic and resulting recession, the annual unemployment rate in Arizona was 4.7%, a full percentage point higher than the comparable national rate. Additionally, an estimated 13.5% of Arizona’s population lives below the poverty line, compared to 12.3% of Americans nationwide.

Source: Davel5957 / Getty Images
31. Indiana
> 2019 unemployment: 3.3% (22nd lowest)
> Pension funded ratio: 66.5% (18th lowest)
> 1 yr. GDP growth: +1.6% (24th highest)
> Poverty rate: 11.9% (23rd highest)
> Moody’s credit rating and outlook: Aa1/Stable
Indiana’s economy is faring better than most other state economies in terms of offering residents employment opportunities and incomes that exceed the federal poverty level — as just 3.3% of the labor force is unemployed and 11.9% of the population lives below the poverty line, compared to the 3.7% and 12.3% respective national rates.
Economic growth in the state has been lackluster however. Indiana reported 1.6% GDP growth in 2019, compared to the 2.2% national GDP growth rate. Indiana is also poorly equipped to pay out public sector employee pensions, as the state has only enough assets on hand to cover 66.5% of its pension liabilities. Across the country, state governments have the means to cover about 71% of pension obligations on average.
[in-text-ad]
Source: powerofforever / E+ via Getty Images
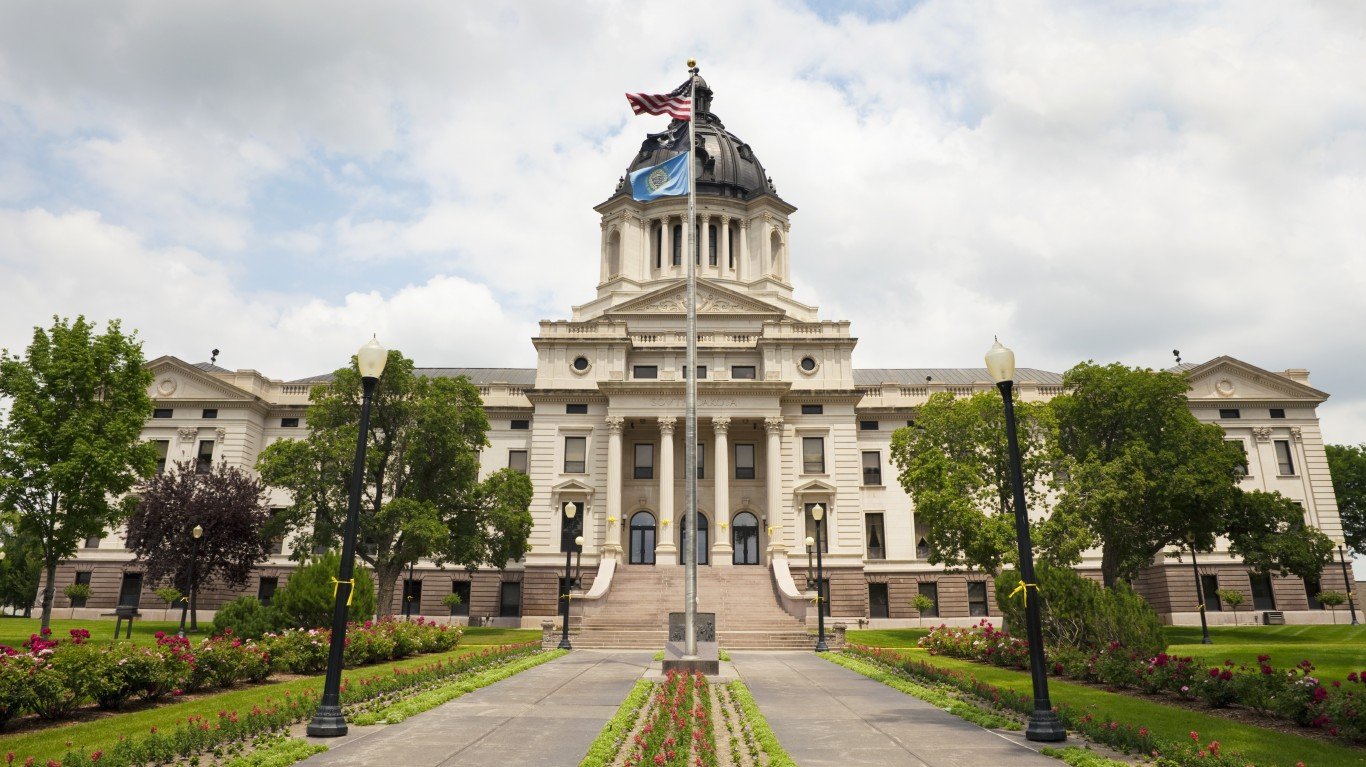
32. South Dakota
> 2019 unemployment: 3.3% (22nd lowest)
> Pension funded ratio: 100.0% (the highest)
> 1 yr. GDP growth: +0.6% (4th lowest)
> Poverty rate: 11.9% (23rd highest)
> Moody’s credit rating and outlook: Aa1/Stable
South Dakota is the only state that has enough money to meet all of its pension obligations. On average, states have enough money to pay for only about 70% of their pension liabilities. However, the state’s debts amount to nearly two-thirds of its revenue. In most states, debt amounts to less than half of revenue.
South Dakota’s economy has lagged behind the economies of other states in recent years. Its real GDP increased by just 0.6% from 2018 to 2019, a smaller increase than all but three other states. Its total employment also increased by just 2.8% from 2015 to 2019, less than half of the 6.4% employment increase nationwide.

Source: traveler1116 / Getty Images
33. Ohio
> 2019 unemployment: 4.1% (10th highest)
> Pension funded ratio: 75.8% (22nd highest)
> 1 yr. GDP growth: +1.5% (23rd lowest)
> Poverty rate: 13.1% (15th highest)
> Moody’s credit rating and outlook: Aa1/Stable
Even before the COVID-19 pandemic, Ohio was struggling with unemployment to a greater degree than much of the country. Employment in the state increased by only 3.0% from 2015 to 2019, less than half the 6.4% employment growth across the U.S. as a whole. Partially as a result, the annual unemployment rate in Ohio stands at 4.1% — higher than the 3.7% national unemployment rate.
While Ohio lags behind much of the country in some key economic measures, it also fairs well in other important social indicators. A relatively safe state, Ohio’s violent crime rate of 293 incidents for every 100,000 people is considerably lower than the national rate of 367 per 100,000.
Source: Davel5957 / Getty Images
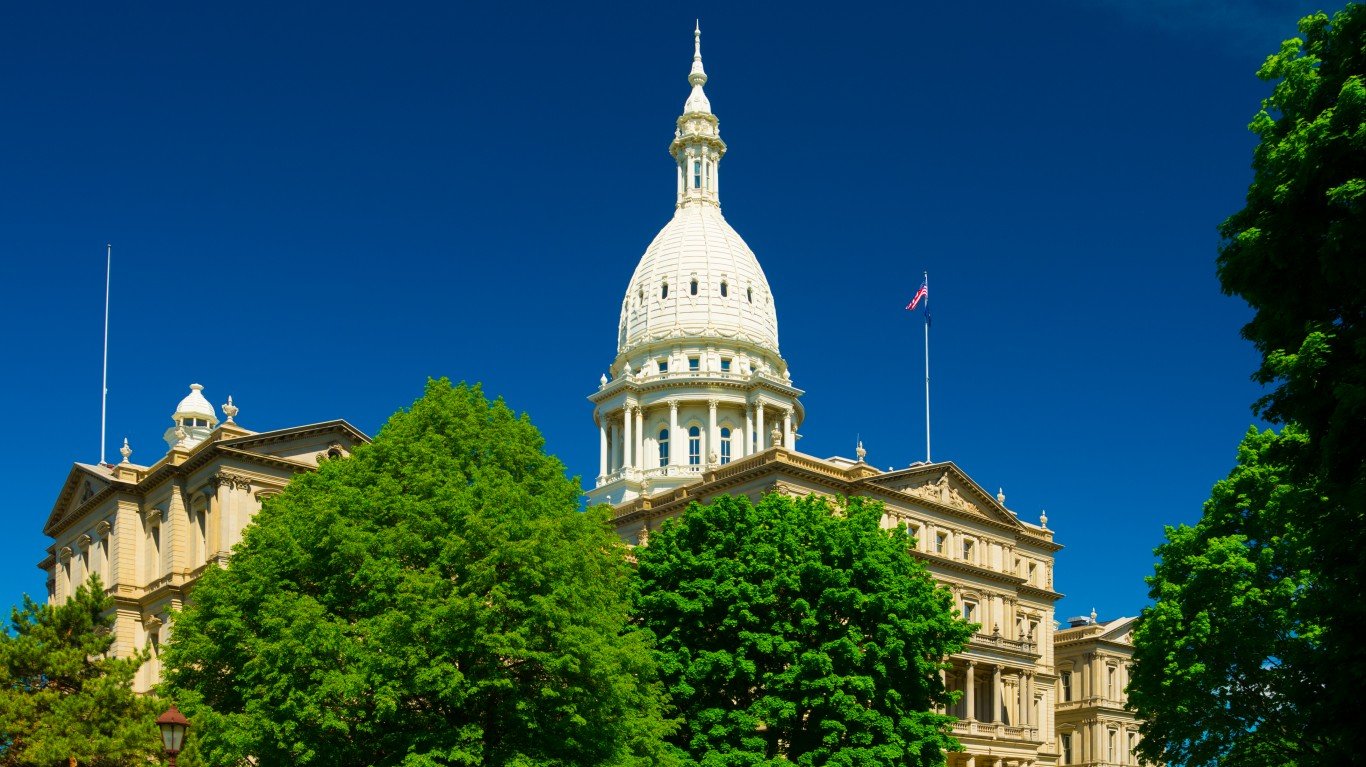
34. Michigan
> 2019 unemployment: 4.1% (10th highest)
> Pension funded ratio: 63.2% (13th lowest)
> 1 yr. GDP growth: +0.8% (10th lowest)
> Poverty rate: 13.0% (16th highest)
> Moody’s credit rating and outlook: Aa1/Stable
Like other states that make up the Rust Belt region, Michigan has for some time struggled with economic issues related to the long-term decline of American manufacturing, beginning in the late 1970s. For years, the state has had one of the highest unemployment rates in the country. An average of 4.1% of the labor force was out of work in 2019, the 10th highest unemployment rate out of any state. Rust Belt states are often subject to population drain, and about 10,500 more people moved away from Michigan in 2019 than moved there.
Still, Michigan’s status on this list has improved somewhat over the past decade, as it ranked fourth-worst among states in the 2010 edition of this story. Home values in the state increased by 23.3% over the last five years, a larger increase than in the vast majority of states.
[in-text-ad-2]
Source: fotoguy22 / Getty Images
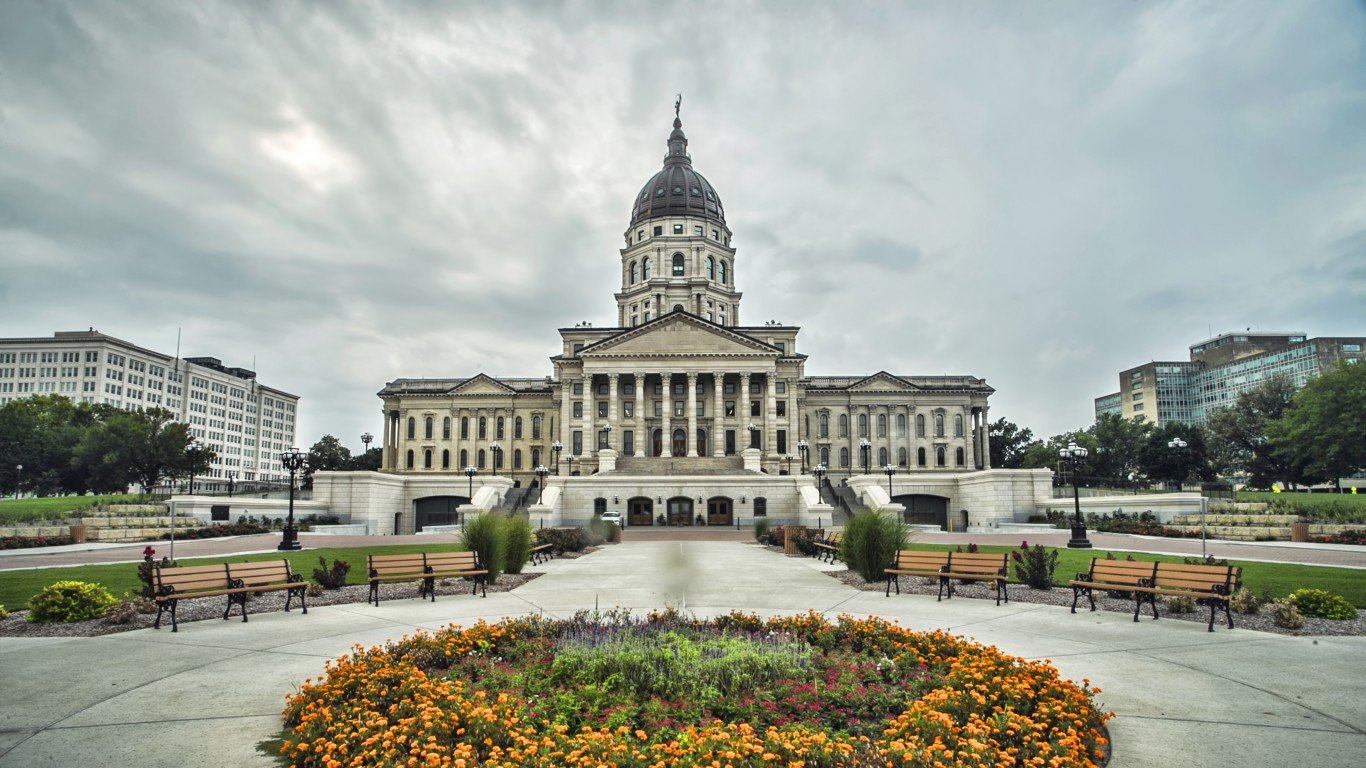
35. Kansas
> 2019 unemployment: 3.2% (17th lowest)
> Pension funded ratio: 68.9% (22nd lowest)
> 1 yr. GDP growth: +1.2% (16th lowest)
> Poverty rate: 11.4% (24th lowest)
> Moody’s credit rating and outlook: Aa3/Stable
Kansas has one of the worst credit ratings of any state, at Aa3. It is also the only state with no money in its rainy day fund. Most states have hundreds of millions, if not billions, of dollars saved in case of emergency.
Kansas had a relatively low unemployment rate before the pandemic, with just 3.4% of its labor force out of work in 2019, slightly lower than the 3.7% U.S. unemployment rate for that year. Yet the state’s total employment grew by just 1.6% from 2015 to 2019, one of the smallest increases of any state.
Source: CharlieTong / Getty Images
36. Pennsylvania
> 2019 unemployment: 4.4% (7th highest)
> Pension funded ratio: 54.8% (6th lowest)
> 1 yr. GDP growth: +2.4% (15th highest)
> Poverty rate: 12.0% (22nd highest)
> Moody’s credit rating and outlook: Aa3/Stable
Pennsylvania ranks among the bottom third of states on this list, thanks in large part to indicators related to the state’s financial obligations. Pennsylvania’s state pension fund remains one of the most underfunded, with enough assets to cover just 54.8% of its outstanding obligations. That is the sixth lowest pension funded ratio among states and well below the average of 70.7% across all states. The state’s rainy day fund of just $23 million is equivalent to just 0.1% of the state’s general expenditures, the third lowest share of any state.
Pennsylvania’s Aa3 credit rating from Moody’s ranks among the 10 lowest-rated states.
[in-text-ad]
Source: fotoguy22 / iStock via Getty Images
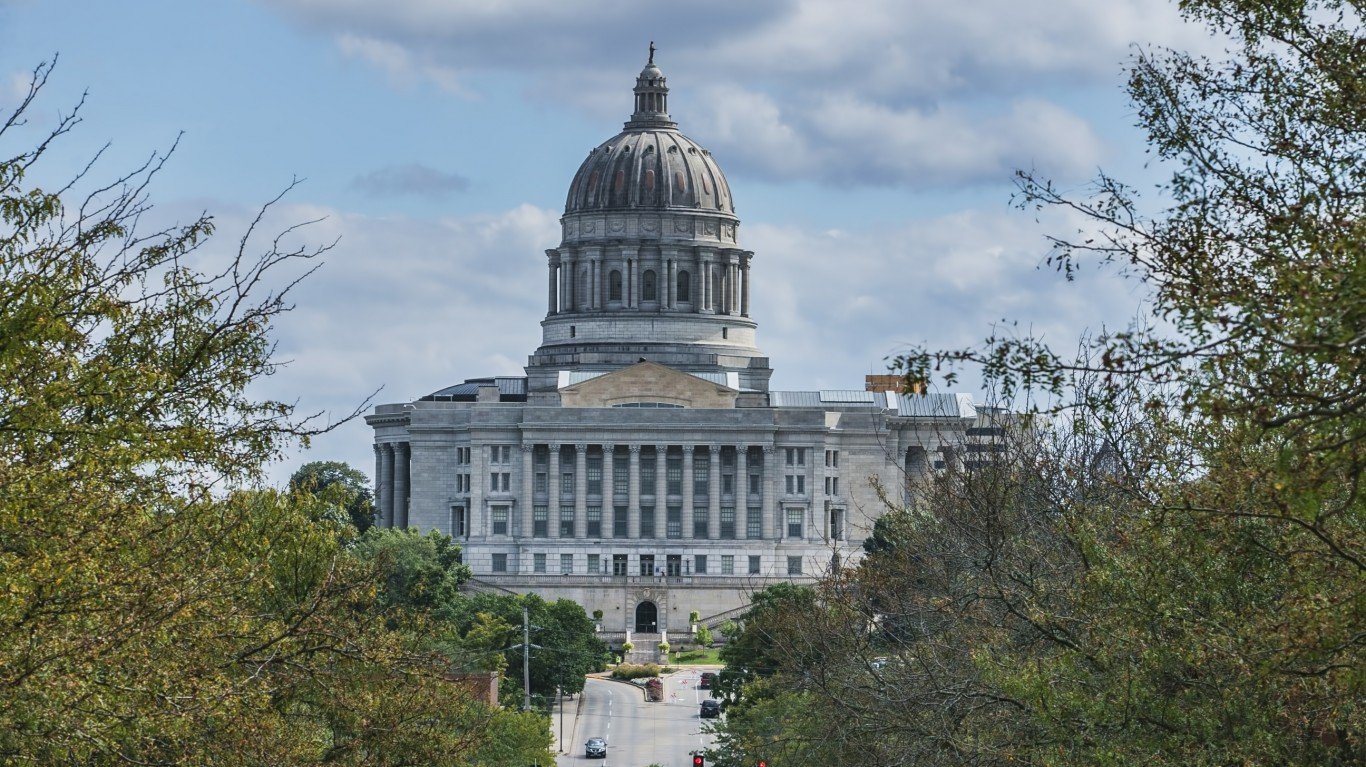
37. Missouri
> 2019 unemployment: 3.3% (22nd lowest)
> Pension funded ratio: 77.8% (21st highest)
> 1 yr. GDP growth: +1.0% (14th lowest)
> Poverty rate: 12.9% (18th highest)
> Moody’s credit rating and outlook: Aaa/Stable
Missouri ranks 37th on this list in spite of its top tier triple-A credit rating. It is the lowest ranked state with such a rating. In other measures, Missouri ranks well below most states. For example the state’s median household income of $57,409 is well below the $65,712 nationwide median.
Missouri’s life expectancy at birth is 77.3 years, 1.8 years below the national average. The state also has one of the 10 highest violent crime rates in the country, reporting 495 murders, rapes, robberies, and aggravated assaults per 100,000 residents annually, well above the national violent crime rate of 367 per 100,000.

Source: traveler1116 / Getty Images
38. Alabama
> 2019 unemployment: 3.0% (14th lowest)
> Pension funded ratio: 71.9% (25th highest)
> 1 yr. GDP growth: +1.4% (18th lowest)
> Poverty rate: 15.5% (7th highest)
> Moody’s credit rating and outlook: Aa1/Stable
Alabama has struggled to ensure that its population achieves at least a K-12 education — 87.1% of the state’s adult population has a high school diploma, the eighth-lowest share among states. Alabama also ranks as one of the least economically prosperous states, with one of the higher poverty rates in the country and one of the lowest GDPs per capita.

Source: Aneese / iStock via Getty Images
39. New Jersey
> 2019 unemployment: 3.6% (20th highest)
> Pension funded ratio: 38.4% (the lowest)
> 1 yr. GDP growth: +1.4% (19th lowest)
> Poverty rate: 9.2% (5th lowest)
> Moody’s credit rating and outlook: A3/Negative
New Jersey is struggling with the worst pension crisis of any state. The state has an estimated $212.2 billion in pension obligations — and assets to cover only 38.4% of them. New Jersey is also not well positioned to weather a revenue shortfall, as its rainy day fund has only $421 million — enough to cover just 1.1% of its annual expenditures. Credit rating agency Moody’s has assigned New Jersey a credit rating of just A3 with a negative outlook — one of the lowest ratings among states.
Government coiffers in New Jersey would benefit from stronger economic growth and a broader tax base. However, last year, the state’s economy grew by just 1.4% — compared to the national GDP growth rate of 2.2% in 2019 — and nearly 28,000 more people left the state than moved in.
[in-text-ad-2]

Source: traveler1116 / Getty Images
40. Oklahoma
> 2019 unemployment: 3.3% (22nd lowest)
> Pension funded ratio: 81.3% (16th highest)
> 1 yr. GDP growth: +2.4% (16th highest)
> Poverty rate: 15.2% (8th highest)
> Moody’s credit rating and outlook: Aa2/Stable
Oklahoma’s population struggles financially more than the populations of most states. The state has the eighth highest poverty rate of any state, at 15.2%, and 14.3% lack health insurance, the second highest uninsured rate of any state and lower only than neighbor Texas.
As is often the case in states with low economic prosperity, the state’s median home value of $147,000 is the fourth lowest among states and about $93,000 below the national median home value.

Source: nashvilledino2 / iStock via Getty Images
41. Rhode Island
> 2019 unemployment: 3.6% (20th highest)
> Pension funded ratio: 54.2% (5th lowest)
> 1 yr. GDP growth: +1.0% (13th lowest)
> Poverty rate: 10.8% (18th lowest)
> Moody’s credit rating and outlook: Aa2/Stable
Few states are saddled with a larger debt burden than Rhode Island. The state has about $9.1 billion in debt, equal to nearly its entire annual revenue. The state also has a woefully underfunded pension system and a rainy day fund that could only cover about 5% of annual expenses in the event of a revenue shortfall.
Like many states on the lower end of this list, Rhode Island has reported relatively lackluster economic growth. The state’s GDP expanded by just 1.0% in 2019, less than half the comparable 2.2% national GDP growth rate.
[in-text-ad]

Source: SeanPavonePhoto / iStock via Getty Images
42. Connecticut
> 2019 unemployment: 3.7% (18th highest)
> Pension funded ratio: 46.7% (4th lowest)
> 1 yr. GDP growth: +0.9% (12th lowest)
> Poverty rate: 10.0% (12th lowest)
> Moody’s credit rating and outlook: A1/Stable
Connecticut ranks as the worst run state in the Northeast and ninth worst run state nationwide. The state is one of only a dozen in the country where GDP growth did not break 1% in 2019. Connecticut is also not equipped to meet most of its pension obligations, with enough funding for only 46.7% of its pension obligations.
The state’s sluggish economic growth and insufficient funding are likely exacerbated by a dwindling tax base. Last year, nearly 10,000 more people moved out of Connecticut than moved in, making the state one of only 10 to report population decline in 2019.

Source: traveler1116 / Getty Images
43. Arkansas
> 2019 unemployment: 3.5% (24th highest)
> Pension funded ratio: 81.2% (17th highest)
> 1 yr. GDP growth: +0.6% (7th lowest)
> Poverty rate: 16.2% (5th highest)
> Moody’s credit rating and outlook: Aa1/Stable
Arkansas has the fourth highest violent crime rate of any state, with 585 reported murders, rapes, robberies, and aggravated assaults per 100,000 residents in 2019, the fourth highest rate of any state. The state’s annual expenditure on public safety accounts for just 3.1% of the state’s total annual budget, the eighth lowest share of any state.
Arkansas’ credit is rated at a relatively high Aa1 with a stable outlook, and more than 80% of the state’s pension obligations are currently funded. However, the state’s rainy day fund of $153 million accounts for just 2.7% of its fiscal 2019 expenditures, seventh lowest among states.

Source: On-Track / Getty Images
44. Illinois
> 2019 unemployment: 4.0% (12th highest)
> Pension funded ratio: 39.0% (2nd lowest)
> 1 yr. GDP growth: +0.5% (3rd lowest)
> Poverty rate: 11.5% (25th lowest)
> Moody’s credit rating and outlook: Baa3/Negative
Nearly 86,000 more people left Illinois than moved in in 2019, and as a result, the state was one of only 10 that is home to fewer people today than a year ago. The population decline was likely a drag on economic growth, as the state’s GDP expanded by just half a percent in 2019, less than one-quarter of the comparable 2.2% national GDP growth.
Compared to most states, Illinois is not well positioned financially. Saddled with debt, a woefully underfunded pension system, and a virtually empty rainy day fund, Illinois has a Baa3 credit rating from Moody’s and a negative outlook — the worst of any state.
[in-text-ad-2]

Source: fotoguy22 / Getty Images
45. Kentucky
> 2019 unemployment: 4.3% (8th highest)
> Pension funded ratio: 44.9% (3rd lowest)
> 1 yr. GDP growth: +1.8% (23rd highest)
> Poverty rate: 16.3% (4th highest)
> Moody’s credit rating and outlook: A1/Stable
Kentucky ranks as one of the worst-run states on this list largely due to indicators related to the state’s budget management. The state’s current pension fund is enough to cover just 44.9% of its outstanding obligations — the third lowest share among states and well below the average of 70.7% across all states. The state’s rainy day fund as of the fiscal year 2019 budget of just $129 million is equivalent to 1.1% of the state’s general fund expenditures, the fifth lowest share of any state.

Source: Davel5957 / E+ via Getty Images
46. New Mexico
> 2019 unemployment: 4.9% (3rd highest)
> Pension funded ratio: 61.0% (11th lowest)
> 1 yr. GDP growth: +5.2% (the highest)
> Poverty rate: 18.2% (3rd highest)
> Moody’s credit rating and outlook: Aa2/Stable
New Mexico’s ranking as the fifth worst-run state, while certainly not a good outcome, is an improvement from last year, when it ranked last. In small part that was due to the state’s economic growth — between 2018 and 2019, New Mexico reported a one-year GDP growth of 5.2%, the highest of any state.
However, by most measures considered for this index, the state still ranks as one of the worst in the country. For example, the state has an annual unemployment rate of 4.9%, tied for the third highest among states. It also has the second highest violent crime rate in the country, at 832 incidents per 100,000 residents, more than double the national rate of 367 per 100,000.
[in-text-ad]

Source: BergmannD / Getty Images
47. Alaska
> 2019 unemployment: 6.1% (the highest)
> Pension funded ratio: 68.4% (20th lowest)
> 1 yr. GDP growth: +0.6% (6th lowest)
> Poverty rate: 10.1% (14th lowest)
> Moody’s credit rating and outlook: Aa3/Negative
No other state had a more precipitous decline in ranking over the past decade than Alaska, as the state dropped from sixth best in 2012 to fourth worst this year. The state’s decline partly coincided with the dramatic decline in crude oil prices that began in the summer of 2014. Alaska’s economy relies heavily on oil tax revenue, and the state provides an annual fund to all its citizens based on oil revenue. While not affecting its ranking this year, due to this year’s oil prices drop — caused by oil price wars and the coronavirus pandemic — the state’s oil fund further lost billions of dollars.
The state’s outstanding debt per capita is one of the highest of any state. Currently, Moody’s rates Alaska’s most senior tax backed bond at Aa3 with a negative outlook, one of the worst of any state.

Source: traveler1116 / iStock via Getty Images
48. West Virginia
> 2019 unemployment: 4.9% (3rd highest)
> Pension funded ratio: 82.3% (13th highest)
> 1 yr. GDP growth: +0.7% (8th lowest)
> Poverty rate: 16.0% (6th highest)
> Moody’s credit rating and outlook: Aa2/Stable
West Virginia’s population is one of the least prosperous in the country. The state has a median household income of $48,850, the second lowest of any state. West Virginia has very low educational attainment at both the high school and collegiate level, including a nation-lowest 21.1% bachelor’s attainment rate among adults. Those with lower educational attainment levels are less likely to hold a higher-paying job or have better job stability, and the state’s 4.9% average unemployment rate in 2019 was tied for third-worst among states.
As is often the case among low-income populations, health outcomes are often relatively poor. West Virginia’s life expectancy at birth of 74.8 years is the worst of any state and more than four years less than the national figure.
Source: BERKO85 / Getty Images
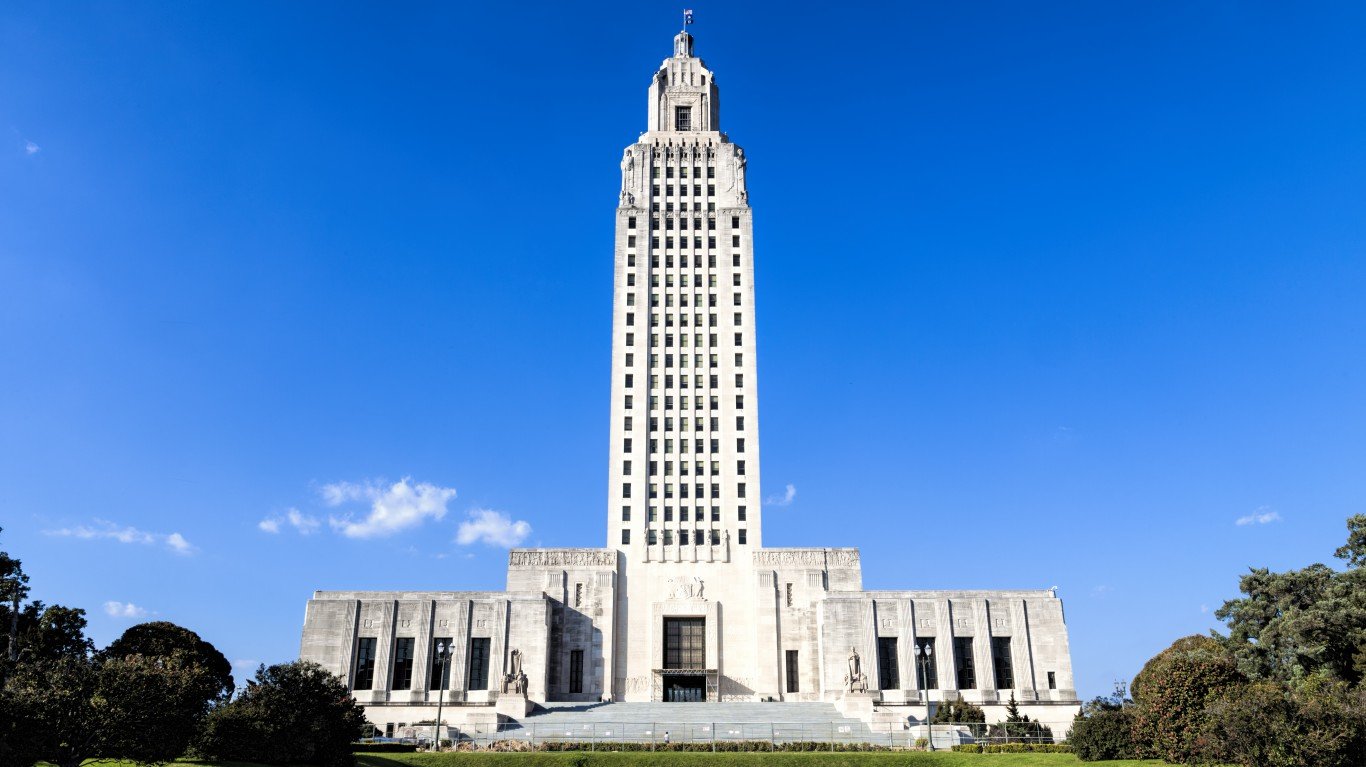
49. Louisiana
> 2019 unemployment: 4.8% (5th highest)
> Pension funded ratio: 67.3% (19th lowest)
> 1 yr. GDP growth: +2.1% (19th highest)
> Poverty rate: 19.0% (2nd highest)
> Moody’s credit rating and outlook: Aa3/Stable
In the previous three years, Louisiana has either ranked worst or second worst run state. It has the second highest poverty rate in the country as well as the highest share of households earning less than $10,000 a year, at 10.1%. Louisiana ranks among the five worst states in the country in other socioeconomic indicators, including violent crime, bachelor’s degree and high school attainment among adults, unemployment, and population decline due to out migration.
[in-text-ad-2]

Source: SeanPavonePhoto / Getty Images
50. Mississippi
> 2019 unemployment: 5.4% (2nd highest)
> Pension funded ratio: 62.6% (12th lowest)
> 1 yr. GDP growth: +0.6% (5th lowest)
> Poverty rate: 19.6% (the highest)
> Moody’s credit rating and outlook: Aa2/Stable
Mississippi has ranked no better than fourth worst in the last seven years, but this is the first year it has ranked as the worst run state in the country. Like Louisiana, Mississippi’s low ranking is closely tied to the low well-being of its population. Mississippi has the highest poverty rate in the country, at 19.6%, compared to the national rate of 12.3%. The state ranks among the five worst in important socioeconomic and health measures, including health insurance coverage, high school and college attainment, unemployment, home value, and life expectancy at birth.
The state’s GDP per capita of $34,493 is the lowest of any state and $23,671 lower than the national GDP per capita.
Methodology:
To determine how well each state is run, 24/7 Wall St. constructed an index of 19 measures assessing state finances, economy, job market, and other various socioeconomic metrics. Data on population change due to net migration from 2018 to 2019 came from the Census Bureau’s Population Estimates Program and was included in the index. Data on the poverty rate, the percentage of adults 25 and over with at least a high school diploma, the percentage of the population without health insurance, and median household income for 2019 came from the U.S. Census Bureau’s American Community Survey and was included in the index. The change in median home value from 2018 to 2019 and the change in median home value from 2015 to 2019 were calculated from ACS data and were both included in the index.
State tax revenue figures for fiscal 2018 from the Census Bureau’s State & Local Government Finance tables were adjusted for population using Census Bureau population estimates and included in the index. Data on outstanding state debt in fiscal 2018, also from the Census Bureau, was adjusted for population and included in the index. We also calculated state debt as a percentage of state revenue in fiscal 2018 and included it in the index. Census Bureau data on the total value of state exports in 2019, estimated using the state-based origin method, were adjusted for population and included in the index.
Data on each state pension fund’s asset-to-liabilities ratio in fiscal 2018 came from The Pew Charitable Trusts and was included in the index. Data on each state’s rainy day fund balance as a percentage of general fund expenditures in fiscal 2019 came from the National Association of State Budget Officers and was included in the index. Credit ratings of each state’s general obligation bonds from Moody’s Investor Service, current as of Nov. 27, 2020, was included in the index.
Data on the number of violent crimes reported per 100,000 residents came from the FBI’s 2019 Uniform Crime Report and was included in the index. Data on the 2019 unemployment rate as well as the percentage change in labor force from 2015 to 2019 came from the Bureau of Labor Statistics’ Local Area Unemployment Statistics Program and both measures were included in the index. Data on the percentage growth in real GDP from 2018 to 2019 and real GDP per capita as of 2019 in chained 2012 dollars came from the Bureau of Economic Analysis and both measures were included in the index. All measures are for the most recent period available and were included in the index at equal weight.
Essential Tips for Investing: Sponsored
A financial advisor can help you understand the advantages and disadvantages of investment properties. Finding a qualified financial advisor doesn’t have to be hard. SmartAsset’s free tool matches you with up to three financial advisors who serve your area, and you can interview your advisor matches at no cost to decide which one is right for you. If you’re ready to find an advisor who can help you achieve your financial goals, get started now.
Investing in real estate can diversify your portfolio. But expanding your horizons may add additional costs. If you’re an investor looking to minimize expenses, consider checking out online brokerages. They often offer low investment fees, helping you maximize your profit.
Thank you for reading! Have some feedback for us?
Contact the 24/7 Wall St. editorial team.
Editors' Picks