
The U.S. reported over 64,000 new cases of coronavirus on Feb. 17, bringing the total count to more than 27,400,000 confirmed cases of COVID-19. There have been more than 470,000 COVID-19-related deaths — the highest death toll of any country.
New cases continue to rise, albeit at a slowing rate. In the past week, there were an average of 27.8 daily new coronavirus cases per 100,000 Americans — a decrease from the week prior, when there were an average of 39 daily new coronavirus cases per 100,000 people.
While new data shows that the risk of contracting COVID-19 is high in almost every part of the country, cities continue to be the sites of major outbreaks and superspreader events. Experts agree that the virus is more likely to spread in group settings where large numbers of people routinely have close contact with one another, such as colleges, nursing homes, bars, and restaurants. Metropolitan areas with a high degree of connectivity between different neighborhoods and a large population may be particularly at-risk.
The metro areas with the highest incidence of COVID-19 cases are distributed relatively unevenly across the United States. Of the 50 metro areas with the highest case counts per capita, 26 are in the South, 16 are in the Midwest, eight are in the West, and zero are in the Northeast.
The five metro areas with the highest number of coronavirus cases per capita are: Yuma, AZ; Pine Bluff, AR; Lubbock, TX; Laredo, TX; and Bismarck, ND. The incidence of COVID-19 in these metro areas range from 17,398.9 cases per 100,000 to 15,511.7 cases per 100,000. For comparison, there are currently 8,511.6 cases per 100,000 Americans nationwide.
The 50 cities with the highest incidence of COVID-19 have over 12,100 more coronavirus cases per capita than the U.S. as a whole, but cases are growing at a slowing rate. There were an average of 35.5 daily new coronavirus cases per 100,000 people in the week ending Feb. 17, a decrease from the week prior, when there were an average of 46.3 daily new coronavirus cases per 100,000 people. In five of the 50 cities with the highest COVID-19 incidence, new cases are rising at an increasing rate.
To determine the cities with the most COVID-19 cases, 24/7 Wall St. compiled and reviewed data from state and local health departments. We ranked metro areas based on the number of confirmed COVID-19 cases per 100,000 residents as of Feb. 17. To estimate the incidence of COVID-19 at the metropolitan level, we aggregated data from the county level using boundary definitions from the U.S. Census Bureau. Population data used to adjust case and death totals came from the U.S. Census Bureau’s 2018 American Community Survey and are five-year estimates. Unemployment data is from the Bureau of Labor Statistics and is seasonally adjusted.

Source: davidwilson1949 / Flickr
50. Waterloo-Cedar Falls, IA
> Confirmed COVID-19 cases as of Feb. 17: 18,634
> Confirmed COVID-19 cases as of Feb. 17 per 100,000 residents: 10,952.7
> Cumulative COVID-19 deaths as of Feb. 17: 362
> Cumulative COVID-19 deaths as of Feb. 17 per 100,000 residents: 212.8
> Population: 170,132
These are all the counties in Iowa where COVID-19 is slowing (and where it’s still getting worse).

Source: Public Domain / Wikimedia Commons
49. Kankakee, IL
> Confirmed COVID-19 cases as of Feb. 17: 12,231
> Confirmed COVID-19 cases as of Feb. 17 per 100,000 residents: 11,012.9
> Cumulative COVID-19 deaths as of Feb. 17: 189
> Cumulative COVID-19 deaths as of Feb. 17 per 100,000 residents: 170.2
> Population: 111,061
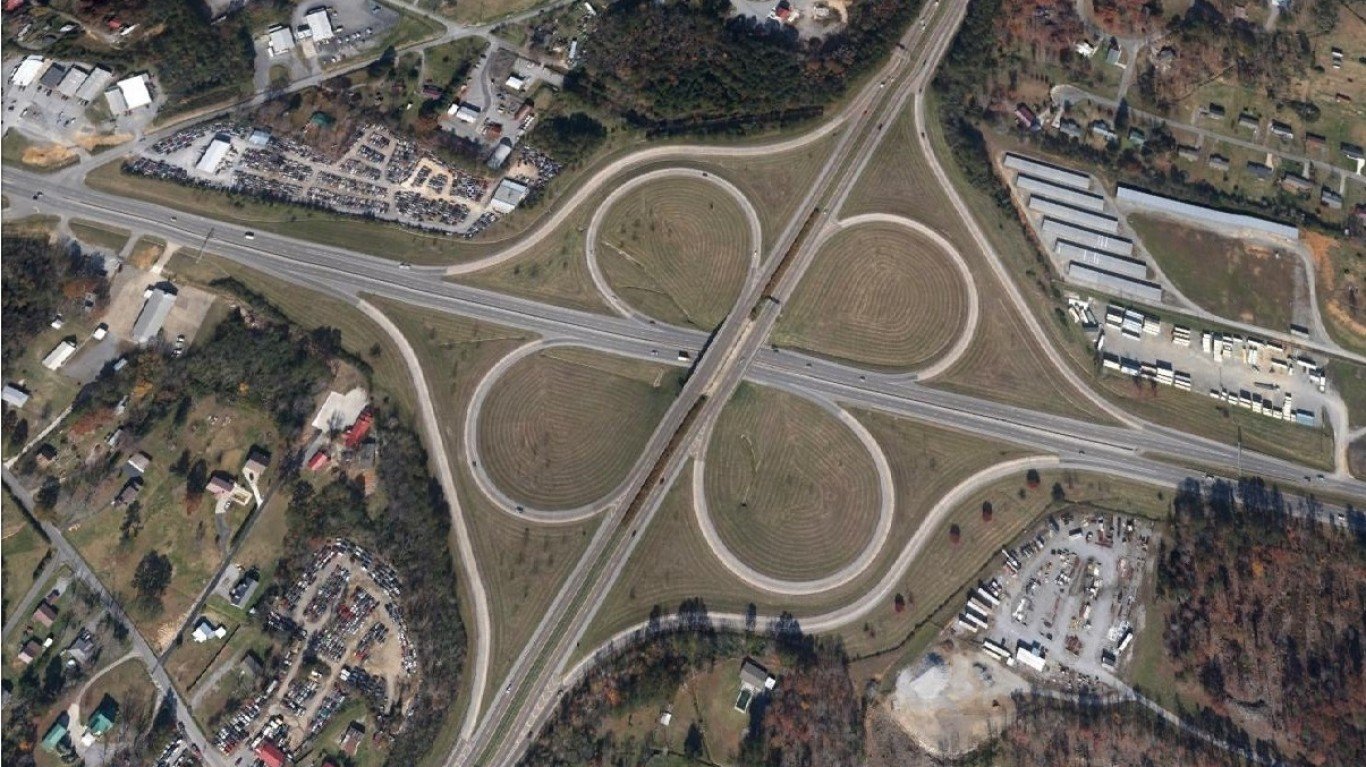
Source: Jared Winkler / Wikimedia Commons
48. Omaha-Council Bluffs, NE-IA
> Confirmed COVID-19 cases as of Feb. 17: 101,659
> Confirmed COVID-19 cases as of Feb. 17 per 100,000 residents: 11,015.3
> Cumulative COVID-19 deaths as of Feb. 17: 986
> Cumulative COVID-19 deaths as of Feb. 17 per 100,000 residents: 106.8
> Population: 922,891
Source: wellesenterprises / Getty Images
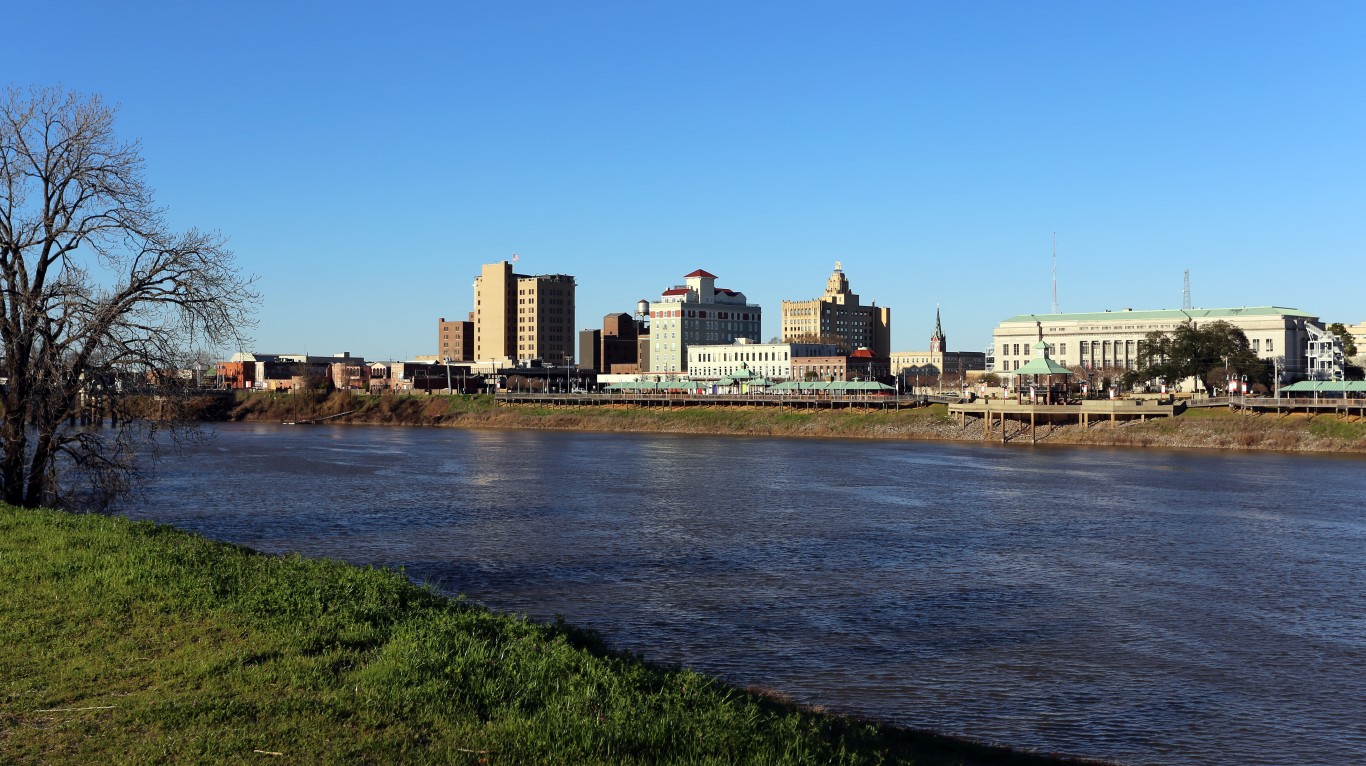
47. Monroe, LA
> Confirmed COVID-19 cases as of Feb. 17: 22,536
> Confirmed COVID-19 cases as of Feb. 17 per 100,000 residents: 11,017.8
> Cumulative COVID-19 deaths as of Feb. 17: 545
> Cumulative COVID-19 deaths as of Feb. 17 per 100,000 residents: 266.4
> Population: 204,542
Source: DenisTangneyJr / Getty Images
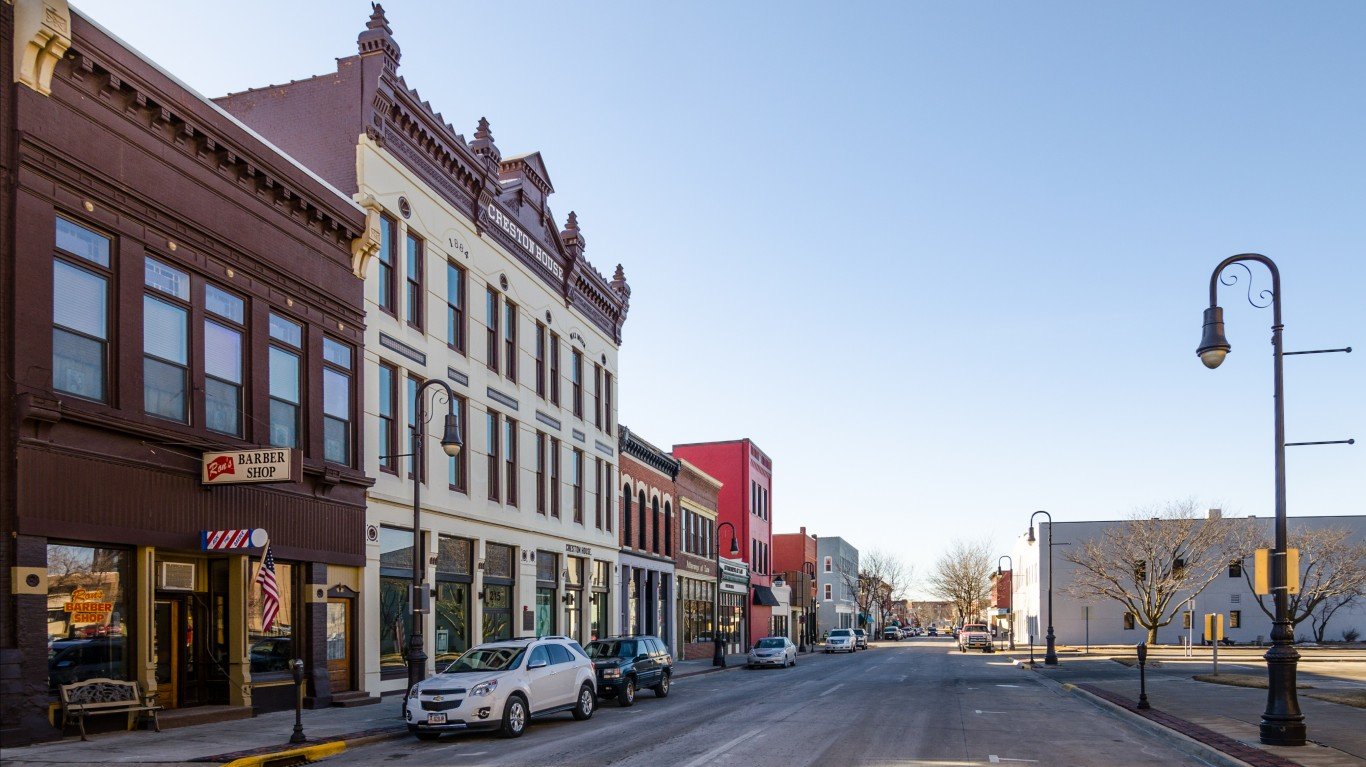
46. Abilene, TX
> Confirmed COVID-19 cases as of Feb. 17: 18,745
> Confirmed COVID-19 cases as of Feb. 17 per 100,000 residents: 11,025.9
> Cumulative COVID-19 deaths as of Feb. 17: 435
> Cumulative COVID-19 deaths as of Feb. 17 per 100,000 residents: 255.9
> Population: 170,009
These are all the counties in Texas where COVID-19 is slowing (and where it’s still getting worse).

Source: jessa2482 / Getty Images
45. Sheboygan, WI
> Confirmed COVID-19 cases as of Feb. 17: 12,720
> Confirmed COVID-19 cases as of Feb. 17 per 100,000 residents: 11,041.2
> Cumulative COVID-19 deaths as of Feb. 17: 125
> Cumulative COVID-19 deaths as of Feb. 17 per 100,000 residents: 108.5
> Population: 115,205

Source: danthi66 / Getty Images
44. Hot Springs, AR
> Confirmed COVID-19 cases as of Feb. 17: 10,867
> Confirmed COVID-19 cases as of Feb. 17 per 100,000 residents: 11,055.4
> Cumulative COVID-19 deaths as of Feb. 17: 269
> Cumulative COVID-19 deaths as of Feb. 17 per 100,000 residents: 273.7
> Population: 98,296

Source: Sean Pavone / iStock via Getty Images
43. Little Rock-North Little Rock-Conway, AR
> Confirmed COVID-19 cases as of Feb. 17: 81,385
> Confirmed COVID-19 cases as of Feb. 17 per 100,000 residents: 11,080.3
> Cumulative COVID-19 deaths as of Feb. 17: 1,160
> Cumulative COVID-19 deaths as of Feb. 17 per 100,000 residents: 157.9
> Population: 734,502
Source: Thomson200 / Wikimedia Commons
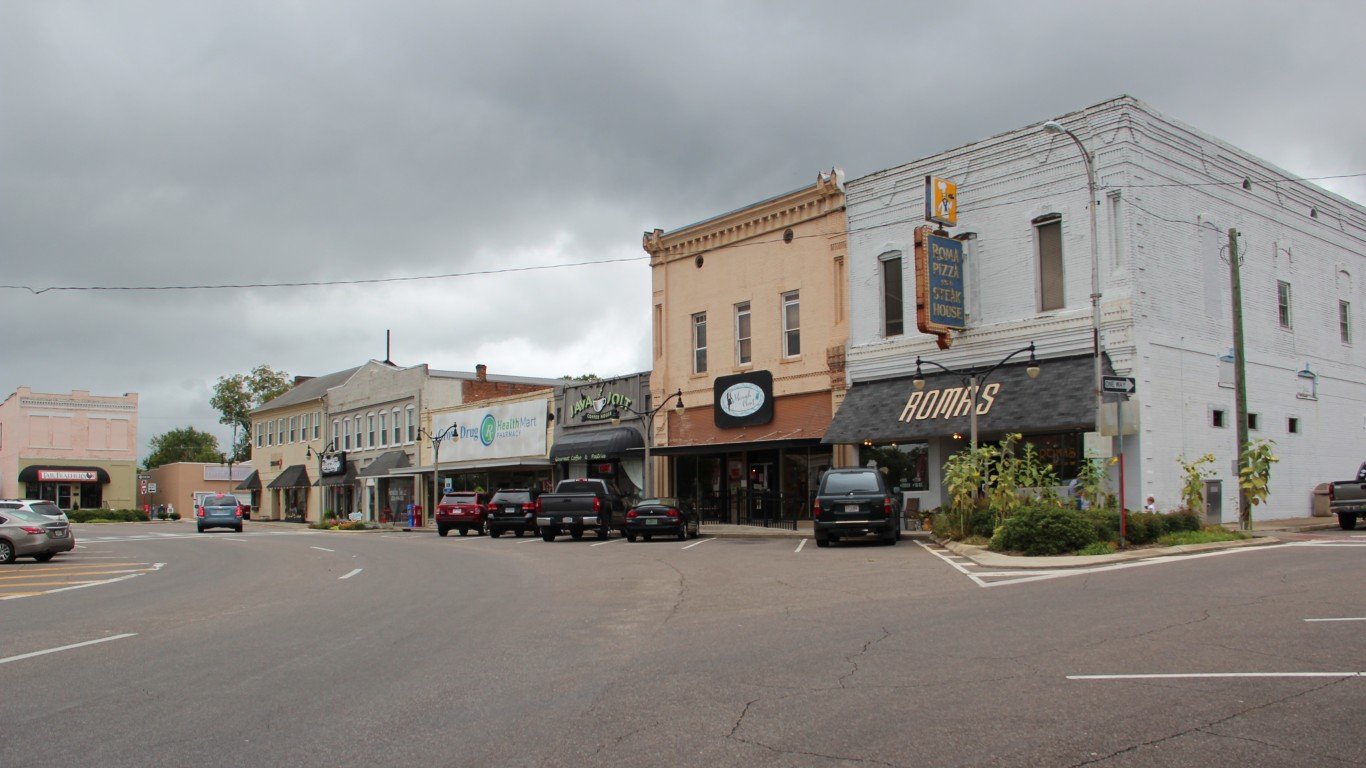
42. Anniston-Oxford, AL
> Confirmed COVID-19 cases as of Feb. 17: 12,784
> Confirmed COVID-19 cases as of Feb. 17 per 100,000 residents: 11,107.1
> Cumulative COVID-19 deaths as of Feb. 17: 264
> Cumulative COVID-19 deaths as of Feb. 17 per 100,000 residents: 229.4
> Population: 115,098

Source: peeterv / Getty Images
41. Rapid City, SD
> Confirmed COVID-19 cases as of Feb. 17: 15,188
> Confirmed COVID-19 cases as of Feb. 17 per 100,000 residents: 11,109.0
> Cumulative COVID-19 deaths as of Feb. 17: 215
> Cumulative COVID-19 deaths as of Feb. 17 per 100,000 residents: 157.3
> Population: 136,718

Source: DenisTangneyJr / iStock via Getty Images
40. Evansville, IN-KY
> Confirmed COVID-19 cases as of Feb. 17: 35,104
> Confirmed COVID-19 cases as of Feb. 17 per 100,000 residents: 11,145.3
> Cumulative COVID-19 deaths as of Feb. 17: 595
> Cumulative COVID-19 deaths as of Feb. 17 per 100,000 residents: 188.9
> Population: 314,967

Source: Public Domain / Wikimedia Commons
39. Morristown, TN
> Confirmed COVID-19 cases as of Feb. 17: 15,711
> Confirmed COVID-19 cases as of Feb. 17 per 100,000 residents: 11,222.1
> Cumulative COVID-19 deaths as of Feb. 17: 314
> Cumulative COVID-19 deaths as of Feb. 17 per 100,000 residents: 224.3
> Population: 140,000

Source: BOB WESTON / Getty Images
38. Jackson, TN
> Confirmed COVID-19 cases as of Feb. 17: 20,061
> Confirmed COVID-19 cases as of Feb. 17 per 100,000 residents: 11,238.3
> Cumulative COVID-19 deaths as of Feb. 17: 452
> Cumulative COVID-19 deaths as of Feb. 17 per 100,000 residents: 253.2
> Population: 178,506

Source: Kruck20 / Getty Images
37. Spartanburg, SC
> Confirmed COVID-19 cases as of Feb. 17: 34,085
> Confirmed COVID-19 cases as of Feb. 17 per 100,000 residents: 11,279.1
> Cumulative COVID-19 deaths as of Feb. 17: 659
> Cumulative COVID-19 deaths as of Feb. 17 per 100,000 residents: 218.1
> Population: 302,195
Source: toddmedia / Getty Images
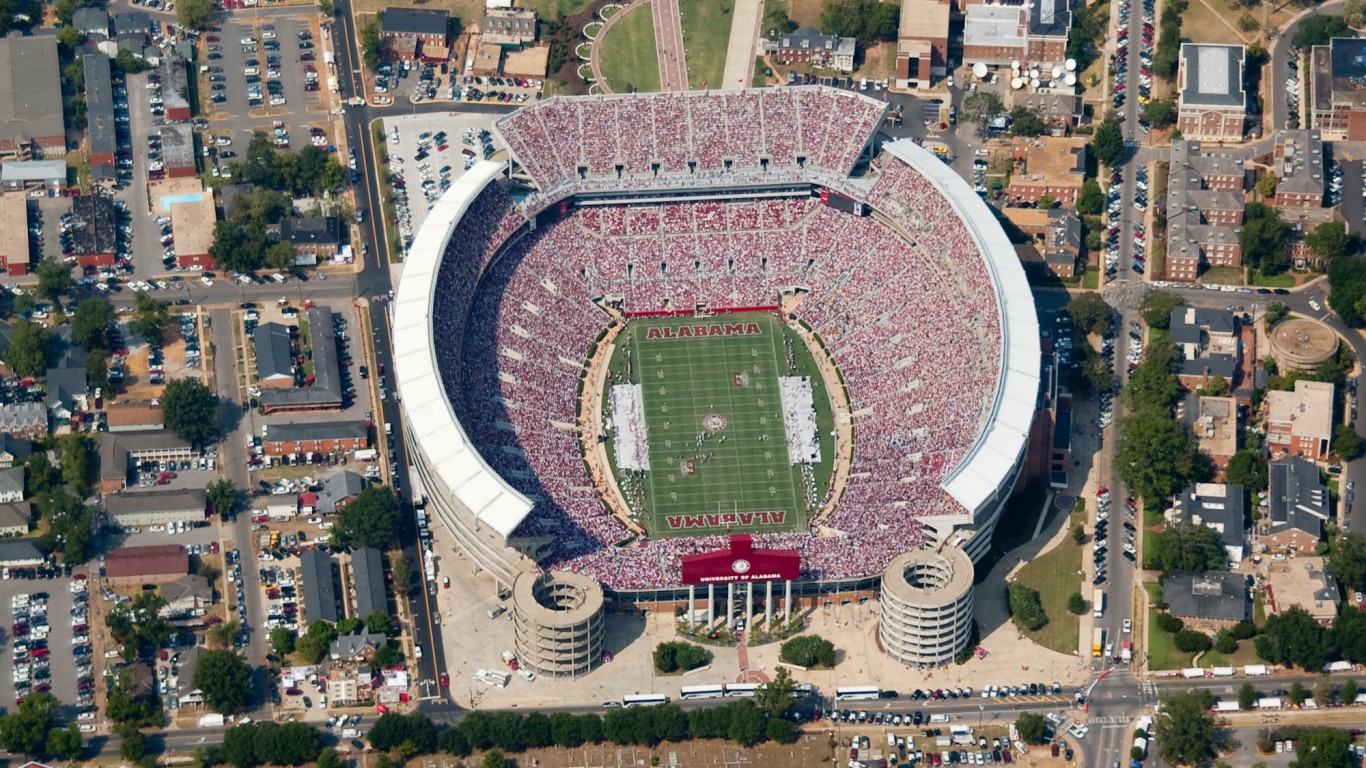
36. Tuscaloosa, AL
> Confirmed COVID-19 cases as of Feb. 17: 28,646
> Confirmed COVID-19 cases as of Feb. 17 per 100,000 residents: 11,466.5
> Cumulative COVID-19 deaths as of Feb. 17: 538
> Cumulative COVID-19 deaths as of Feb. 17 per 100,000 residents: 215.4
> Population: 249,824

Source: frankix / Getty Images
35. Flagstaff, AZ
> Confirmed COVID-19 cases as of Feb. 17: 16,088
> Confirmed COVID-19 cases as of Feb. 17 per 100,000 residents: 11,473.6
> Cumulative COVID-19 deaths as of Feb. 17: 302
> Cumulative COVID-19 deaths as of Feb. 17 per 100,000 residents: 215.4
> Population: 140,217
Source: ULora / Getty Images
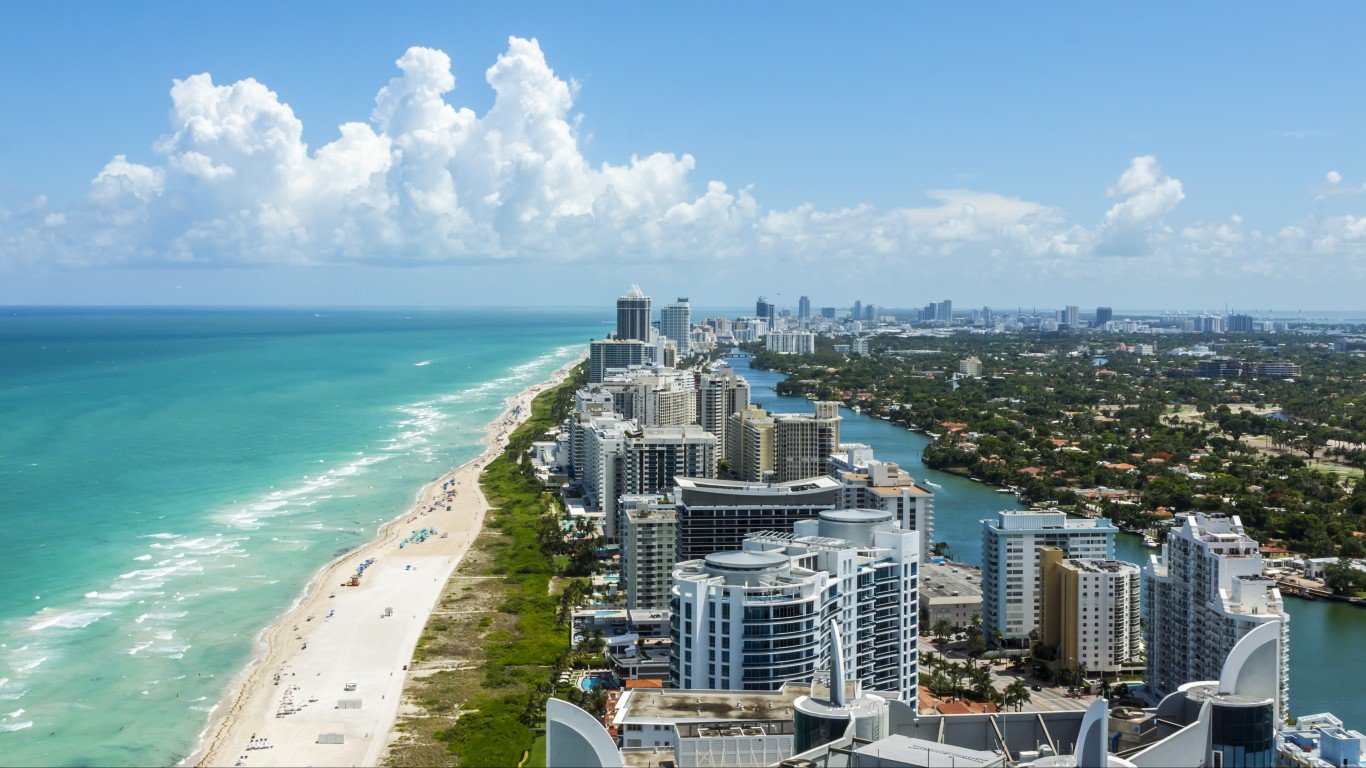
34. Miami-Fort Lauderdale-Pompano Beach, FL
> Confirmed COVID-19 cases as of Feb. 17: 699,851
> Confirmed COVID-19 cases as of Feb. 17 per 100,000 residents: 11,527.9
> Cumulative COVID-19 deaths as of Feb. 17: 9,874
> Cumulative COVID-19 deaths as of Feb. 17 per 100,000 residents: 162.6
> Population: 6,070,944
Source: Chris Rand / Wikimedia Commons
33. Green Bay, WI
> Confirmed COVID-19 cases as of Feb. 17: 36,632
> Confirmed COVID-19 cases as of Feb. 17 per 100,000 residents: 11,530.3
> Cumulative COVID-19 deaths as of Feb. 17: 277
> Cumulative COVID-19 deaths as of Feb. 17 per 100,000 residents: 87.2
> Population: 317,702
Source: felixmizioznikov / Getty Images
32. Florence, SC
> Confirmed COVID-19 cases as of Feb. 17: 23,787
> Confirmed COVID-19 cases as of Feb. 17 per 100,000 residents: 11,557.5
> Cumulative COVID-19 deaths as of Feb. 17: 528
> Cumulative COVID-19 deaths as of Feb. 17 per 100,000 residents: 256.5
> Population: 205,814

Source: DenisTangneyJr / Getty Images
31. Fond du Lac, WI
> Confirmed COVID-19 cases as of Feb. 17: 11,838
> Confirmed COVID-19 cases as of Feb. 17 per 100,000 residents: 11,570.2
> Cumulative COVID-19 deaths as of Feb. 17: 89
> Cumulative COVID-19 deaths as of Feb. 17 per 100,000 residents: 87
> Population: 102,315

Source: Kruck20 / iStock via Getty Images
30. Greenville-Anderson, SC
> Confirmed COVID-19 cases as of Feb. 17: 102,511
> Confirmed COVID-19 cases as of Feb. 17 per 100,000 residents: 11,598.2
> Cumulative COVID-19 deaths as of Feb. 17: 1,653
> Cumulative COVID-19 deaths as of Feb. 17 per 100,000 residents: 187
> Population: 883,853

Source: iip-photo-archive / Flickr
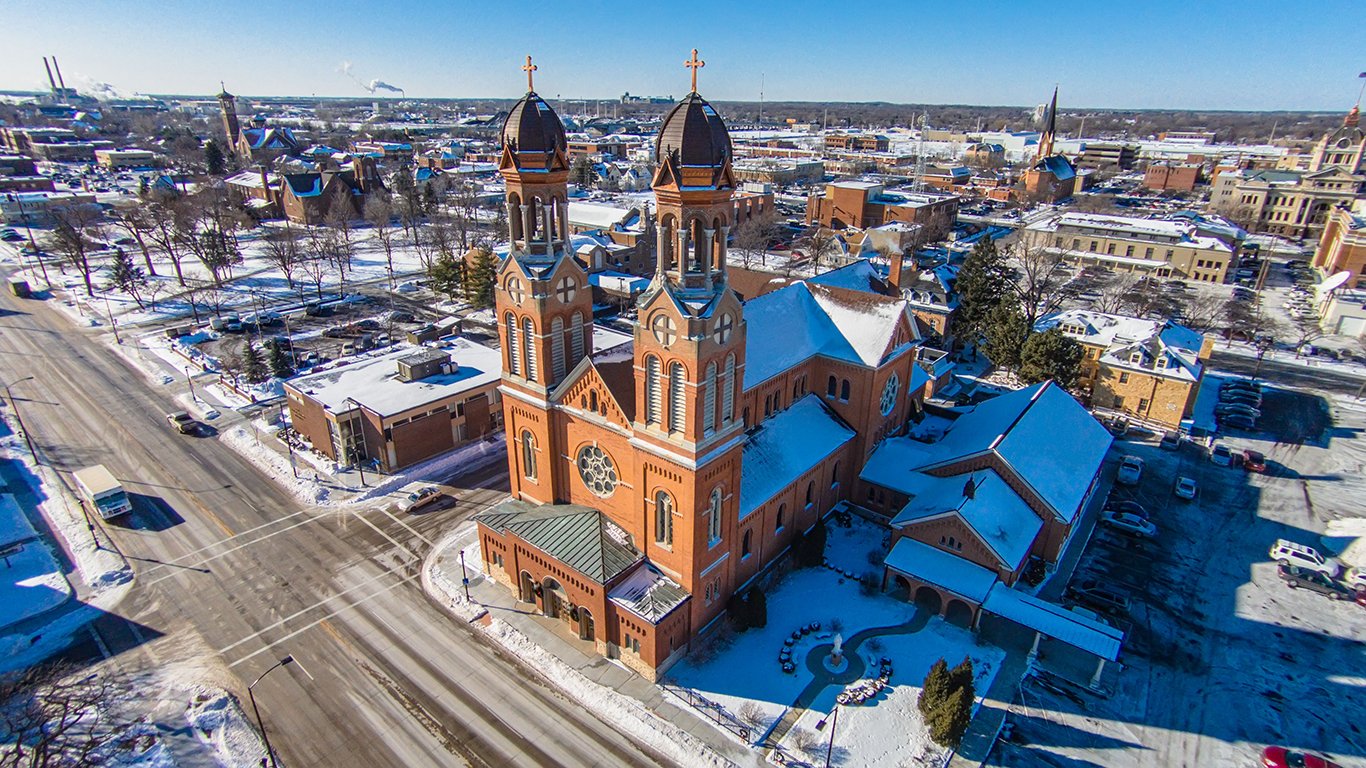
29. St. Cloud, MN
> Confirmed COVID-19 cases as of Feb. 17: 22,952
> Confirmed COVID-19 cases as of Feb. 17 per 100,000 residents: 11,674.6
> Cumulative COVID-19 deaths as of Feb. 17: 289
> Cumulative COVID-19 deaths as of Feb. 17 per 100,000 residents: 147
> Population: 196,598

Source: Melikamp / Wikimedia Commons
28. Phoenix-Mesa-Chandler, AZ
> Confirmed COVID-19 cases as of Feb. 17: 545,650
> Confirmed COVID-19 cases as of Feb. 17 per 100,000 residents: 11,675.1
> Cumulative COVID-19 deaths as of Feb. 17: 9,273
> Cumulative COVID-19 deaths as of Feb. 17 per 100,000 residents: 198.4
> Population: 4,673,634
Source: Bmag32 (Uploads) / Wikimedia Commons
27. Cleveland, TN
> Confirmed COVID-19 cases as of Feb. 17: 14,204
> Confirmed COVID-19 cases as of Feb. 17 per 100,000 residents: 11,706.0
> Cumulative COVID-19 deaths as of Feb. 17: 153
> Cumulative COVID-19 deaths as of Feb. 17 per 100,000 residents: 126.1
> Population: 121,339

Source: DenisTangneyJr / iStock Unreleased via Getty Images
26. Fargo, ND-MN
> Confirmed COVID-19 cases as of Feb. 17: 27,948
> Confirmed COVID-19 cases as of Feb. 17 per 100,000 residents: 11,792.3
> Cumulative COVID-19 deaths as of Feb. 17: 276
> Cumulative COVID-19 deaths as of Feb. 17 per 100,000 residents: 116.5
> Population: 237,003

Source: Vito Palmisano / iStock via Getty Images
25. Nashville-Davidson–Murfreesboro–Franklin, TN
> Confirmed COVID-19 cases as of Feb. 17: 219,485
> Confirmed COVID-19 cases as of Feb. 17 per 100,000 residents: 11,932.0
> Cumulative COVID-19 deaths as of Feb. 17: 2,459
> Cumulative COVID-19 deaths as of Feb. 17 per 100,000 residents: 133.7
> Population: 1,839,460

Source: BOB WESTON / iStock via Getty Images
24. Enid, OK
> Confirmed COVID-19 cases as of Feb. 17: 7,421
> Confirmed COVID-19 cases as of Feb. 17 per 100,000 residents: 11,932.8
> Cumulative COVID-19 deaths as of Feb. 17: 69
> Cumulative COVID-19 deaths as of Feb. 17 per 100,000 residents: 111
> Population: 62,190

Source: 4kodiak / Getty Images
23. Salt Lake City, UT
> Confirmed COVID-19 cases as of Feb. 17: 142,315
> Confirmed COVID-19 cases as of Feb. 17 per 100,000 residents: 11,999.7
> Cumulative COVID-19 deaths as of Feb. 17: 749
> Cumulative COVID-19 deaths as of Feb. 17 per 100,000 residents: 63.2
> Population: 1,185,990
These are all the counties in Utah where COVID-19 is slowing (and where it’s still getting worse).

Source: Mliedel / Wikimedia Commons
22. Riverside-San Bernardino-Ontario, CA
> Confirmed COVID-19 cases as of Feb. 17: 553,901
> Confirmed COVID-19 cases as of Feb. 17 per 100,000 residents: 12,258.0
> Cumulative COVID-19 deaths as of Feb. 17: 5,976
> Cumulative COVID-19 deaths as of Feb. 17 per 100,000 residents: 132.3
> Population: 4,518,699
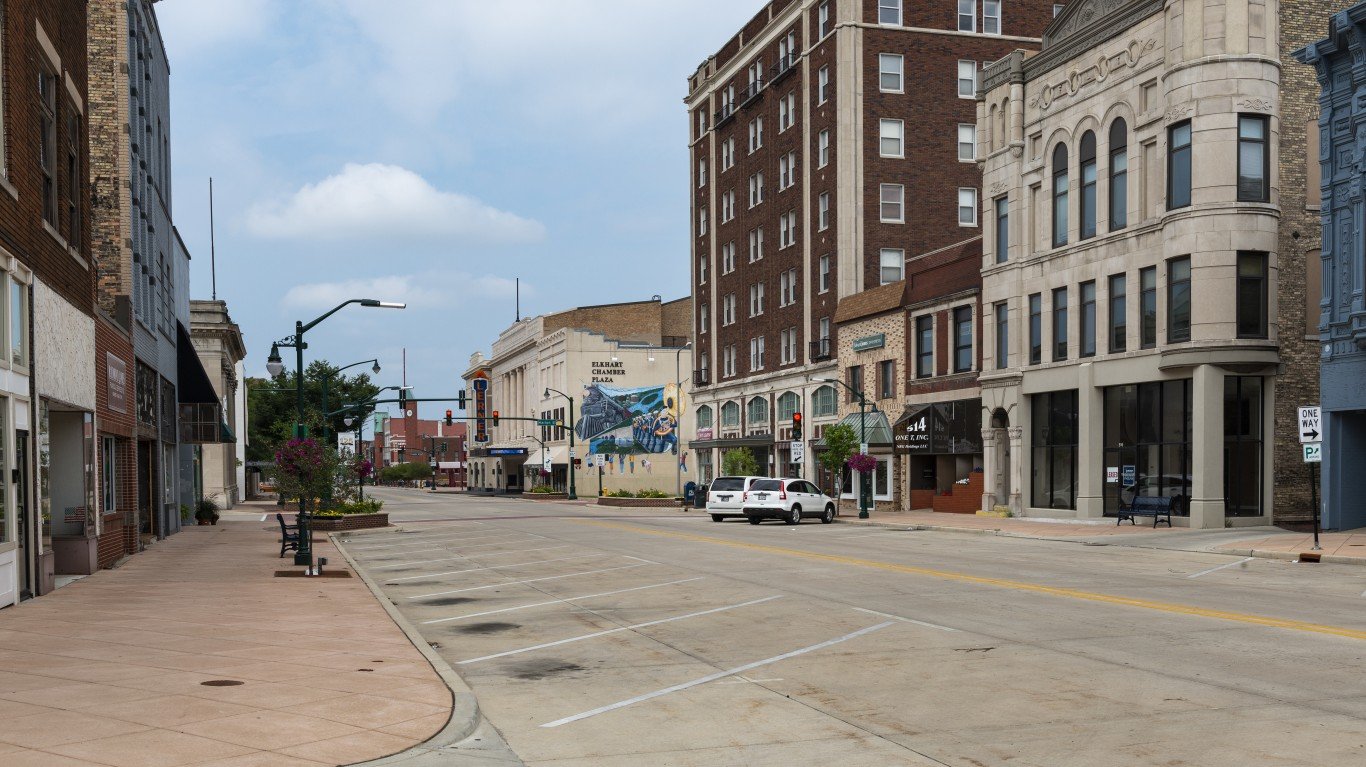
Source: Tiago_Fernandez / iStock Editorial via Getty Images
21. Elkhart-Goshen, IN
> Confirmed COVID-19 cases as of Feb. 17: 25,121
> Confirmed COVID-19 cases as of Feb. 17 per 100,000 residents: 12,338.2
> Cumulative COVID-19 deaths as of Feb. 17: 406
> Cumulative COVID-19 deaths as of Feb. 17 per 100,000 residents: 199.4
> Population: 203,604
Source: peeterv / iStock via Getty Images
20. Fort Smith, AR-OK
> Confirmed COVID-19 cases as of Feb. 17: 31,195
> Confirmed COVID-19 cases as of Feb. 17 per 100,000 residents: 12,524.5
> Cumulative COVID-19 deaths as of Feb. 17: 474
> Cumulative COVID-19 deaths as of Feb. 17 per 100,000 residents: 190.3
> Population: 249,072

Source: cosmonaut / Getty Images
19. Dubuque, IA
> Confirmed COVID-19 cases as of Feb. 17: 12,155
> Confirmed COVID-19 cases as of Feb. 17 per 100,000 residents: 12,556.6
> Cumulative COVID-19 deaths as of Feb. 17: 190
> Cumulative COVID-19 deaths as of Feb. 17 per 100,000 residents: 196.3
> Population: 96,802
These are all the counties in Iowa where COVID-19 is slowing (and where it’s still getting worse).
Source: Public Domain / Wikimedia Commons
18. Gadsden, AL
> Confirmed COVID-19 cases as of Feb. 17: 12,995
> Confirmed COVID-19 cases as of Feb. 17 per 100,000 residents: 12,624.0
> Cumulative COVID-19 deaths as of Feb. 17: 300
> Cumulative COVID-19 deaths as of Feb. 17 per 100,000 residents: 291.4
> Population: 102,939
Source: DenisTangneyJr / Getty Images
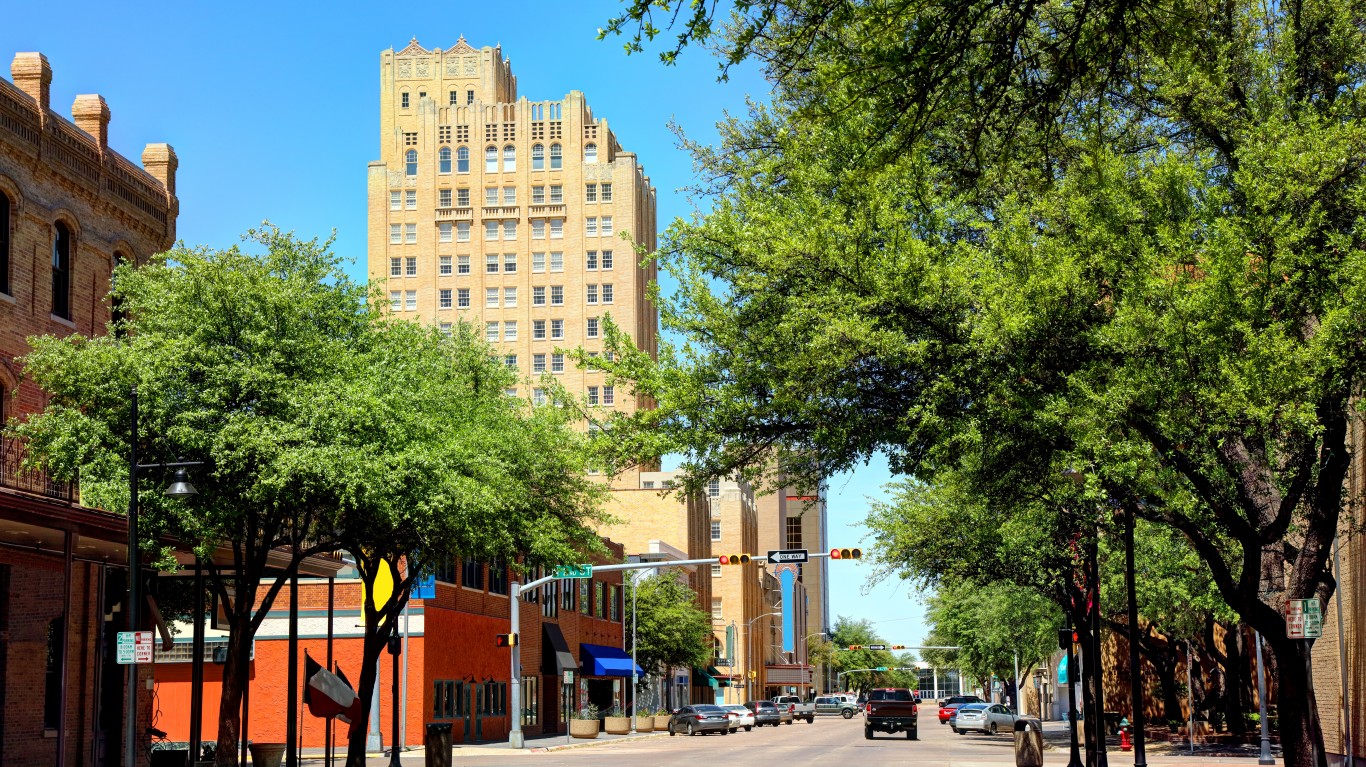
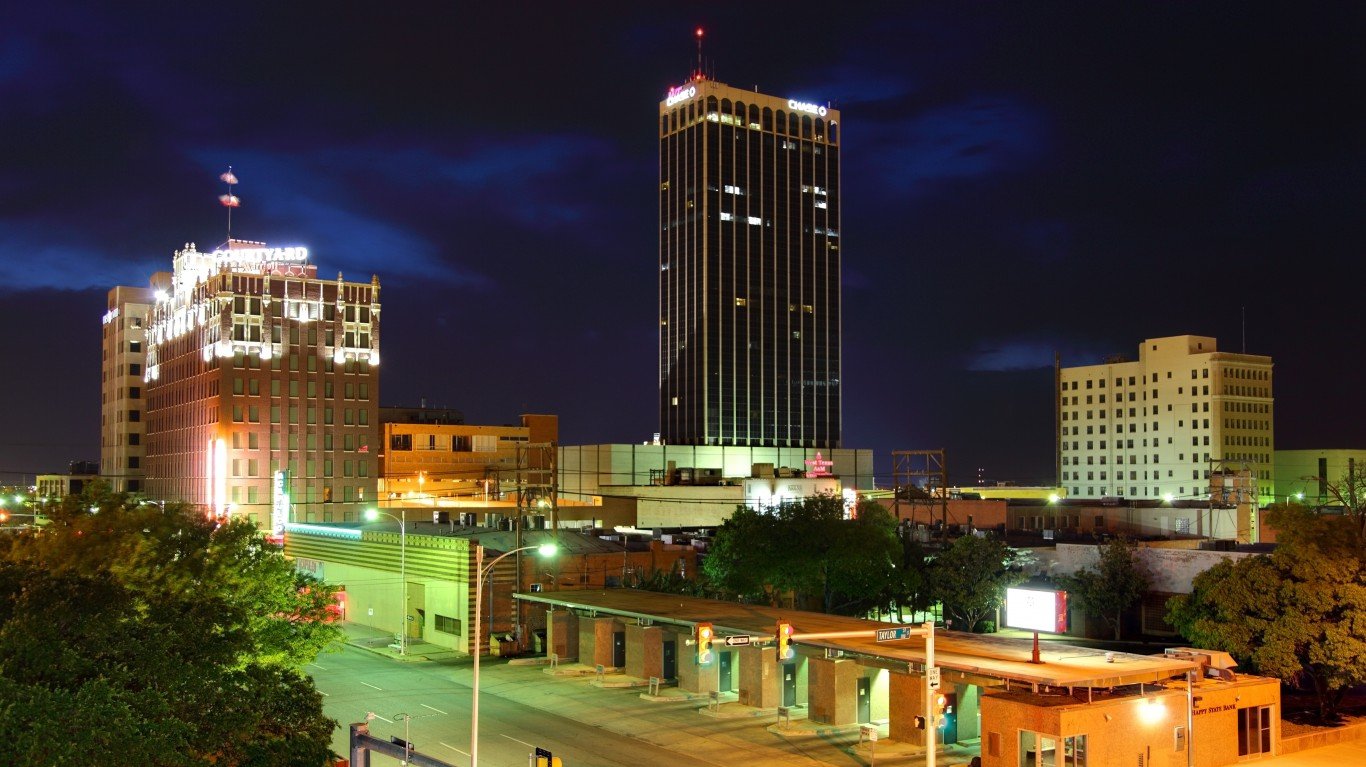
17. Amarillo, TX
> Confirmed COVID-19 cases as of Feb. 17: 33,544
> Confirmed COVID-19 cases as of Feb. 17 per 100,000 residents: 12,734.4
> Cumulative COVID-19 deaths as of Feb. 17: 632
> Cumulative COVID-19 deaths as of Feb. 17 per 100,000 residents: 239.9
> Population: 263,412
These are all the counties in Texas where COVID-19 is slowing (and where it’s still getting worse).

Source: Public Domain / Wikimedia Commons
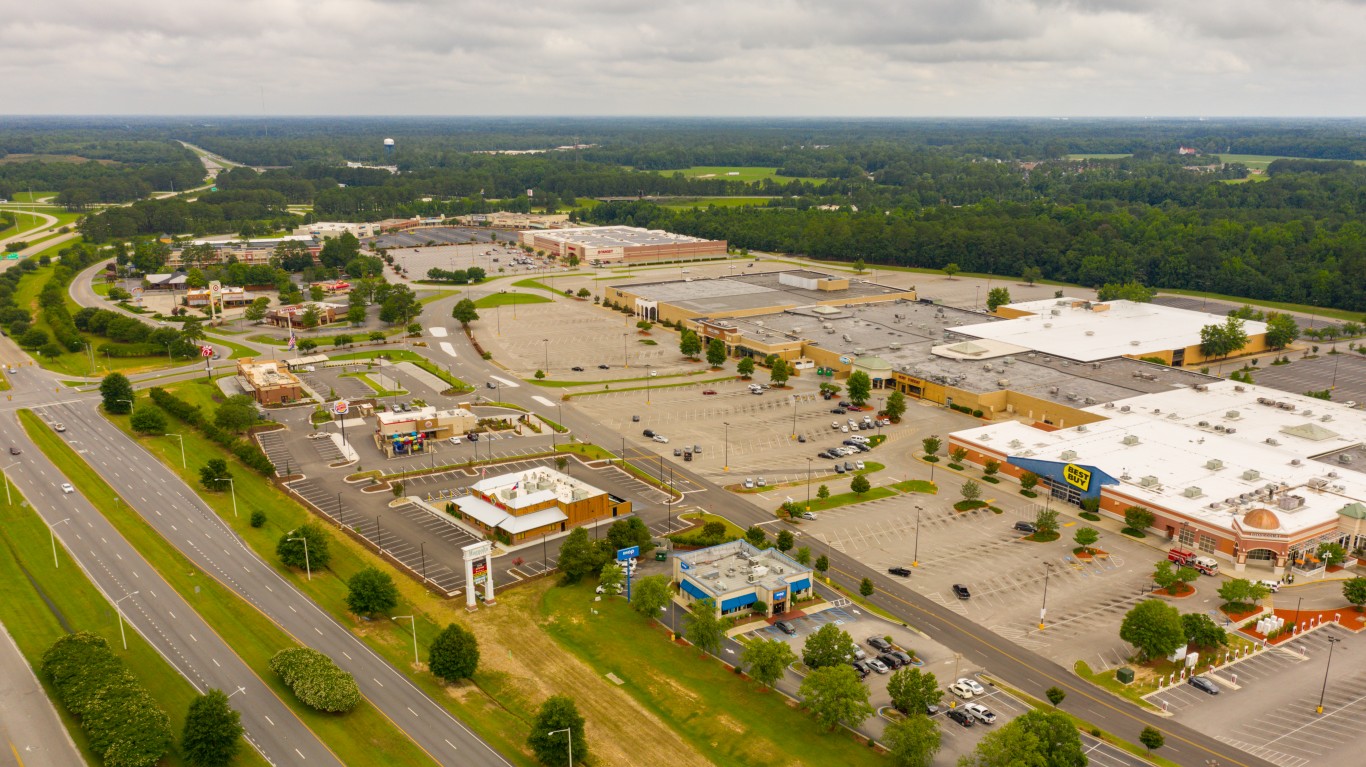
16. Gainesville, GA
> Confirmed COVID-19 cases as of Feb. 17: 24,993
> Confirmed COVID-19 cases as of Feb. 17 per 100,000 residents: 12,754.1
> Cumulative COVID-19 deaths as of Feb. 17: 379
> Cumulative COVID-19 deaths as of Feb. 17 per 100,000 residents: 193.4
> Population: 195,961

Source: PictureItPerfect / iStock
15. Grand Forks, ND-MN
> Confirmed COVID-19 cases as of Feb. 17: 13,123
> Confirmed COVID-19 cases as of Feb. 17 per 100,000 residents: 12,866.8
> Cumulative COVID-19 deaths as of Feb. 17: 135
> Cumulative COVID-19 deaths as of Feb. 17 per 100,000 residents: 132.4
> Population: 101,991
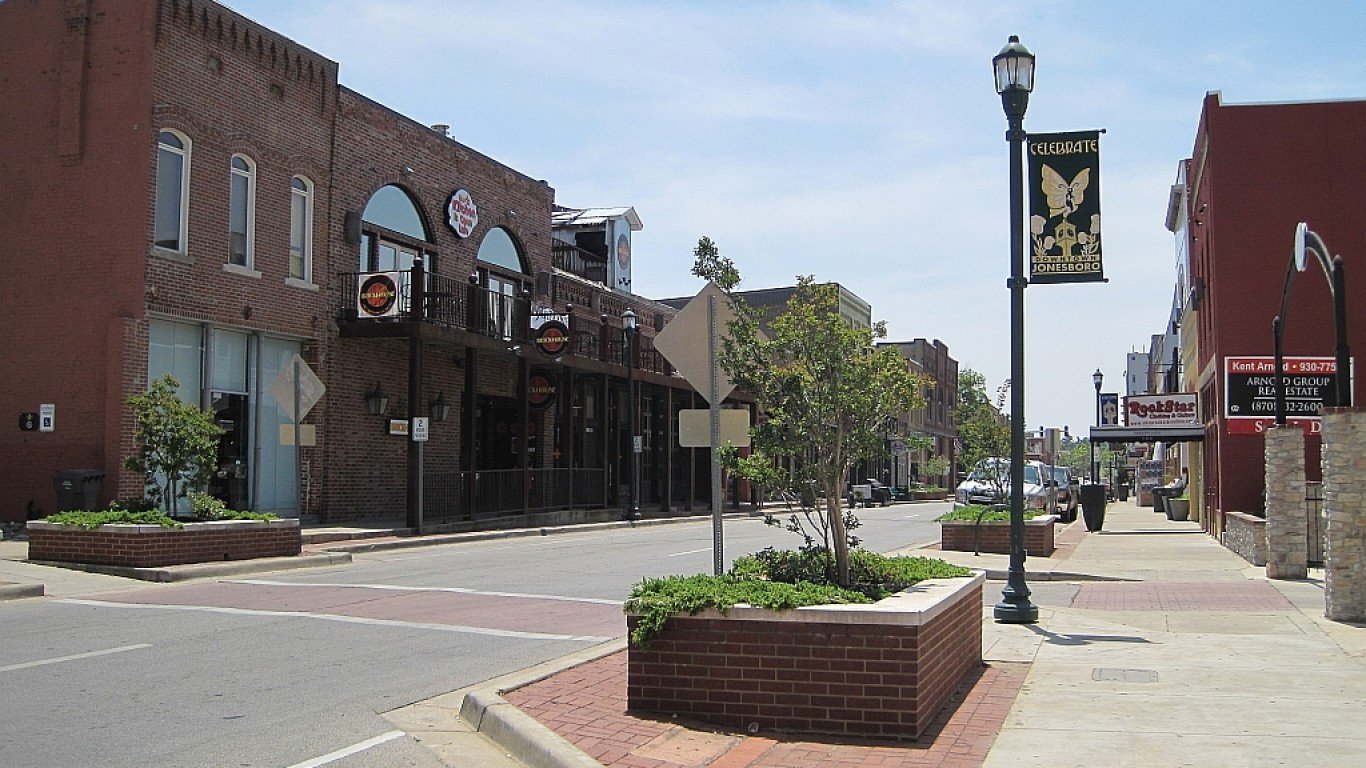
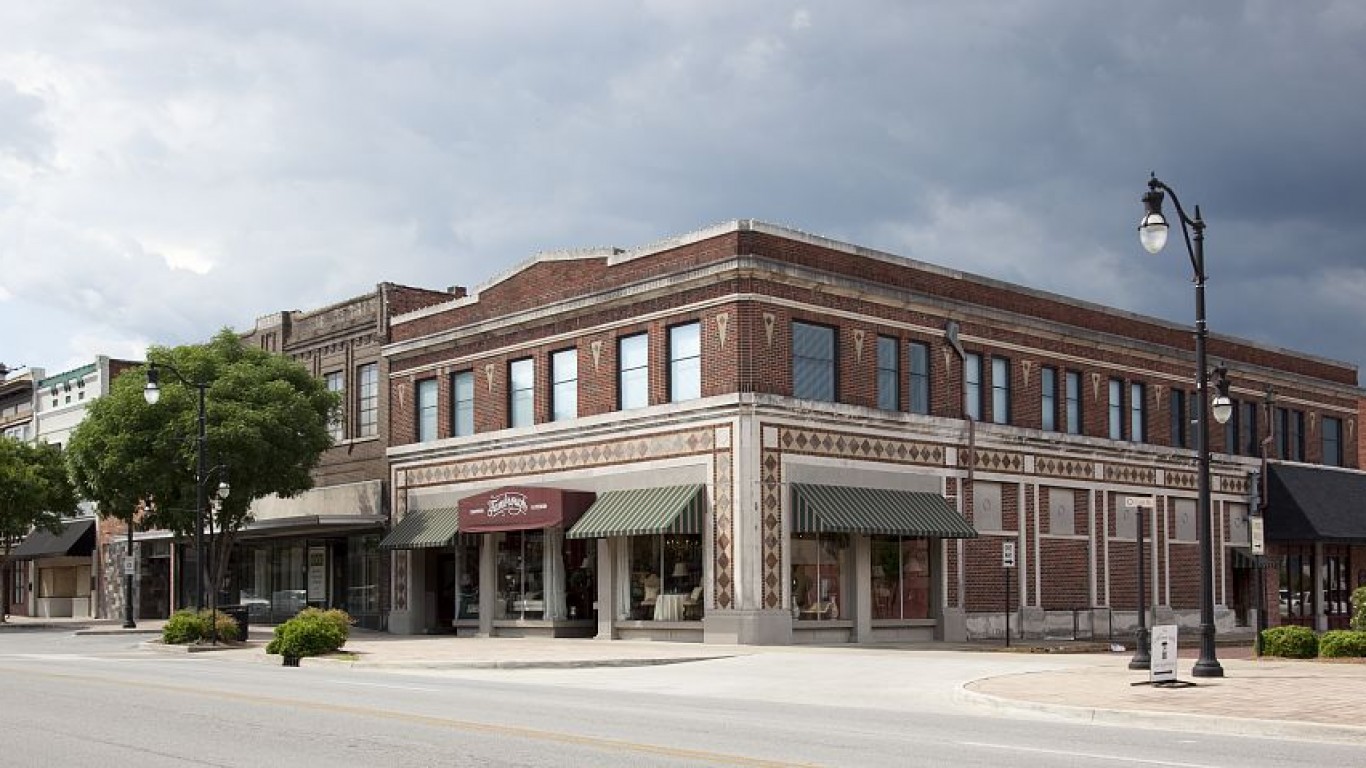
Source: Thomas R Machnitzki ([email protected]) / Wikimedia Commons
14. Jonesboro, AR
> Confirmed COVID-19 cases as of Feb. 17: 17,693
> Confirmed COVID-19 cases as of Feb. 17 per 100,000 residents: 13,635.7
> Cumulative COVID-19 deaths as of Feb. 17: 284
> Cumulative COVID-19 deaths as of Feb. 17 per 100,000 residents: 218.9
> Population: 129,755
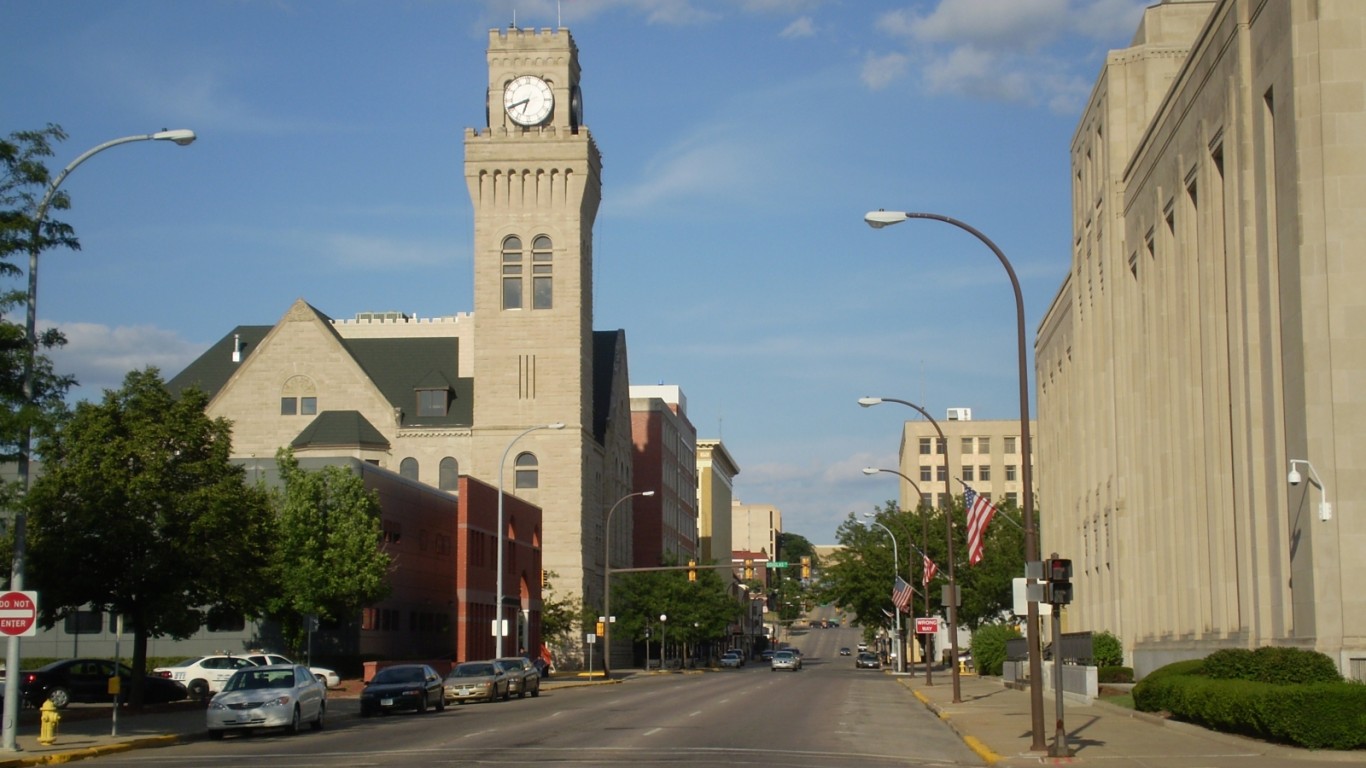
Source: BergmannD / iStock via Getty Images
13. Sioux City, IA-NE-SD
> Confirmed COVID-19 cases as of Feb. 17: 19,712
> Confirmed COVID-19 cases as of Feb. 17 per 100,000 residents: 13,723.4
> Cumulative COVID-19 deaths as of Feb. 17: 312
> Cumulative COVID-19 deaths as of Feb. 17 per 100,000 residents: 217.2
> Population: 143,638
These are all the counties in Iowa where COVID-19 is slowing (and where it’s still getting worse).

Source: BOB WESTON / Getty Images
12. Dalton, GA
> Confirmed COVID-19 cases as of Feb. 17: 19,994
> Confirmed COVID-19 cases as of Feb. 17 per 100,000 residents: 13,942.2
> Cumulative COVID-19 deaths as of Feb. 17: 272
> Cumulative COVID-19 deaths as of Feb. 17 per 100,000 residents: 189.7
> Population: 143,406

Source: Natalia Bratslavsky / Shutterstock.com
11. Fayetteville-Springdale-Rogers, AR
> Confirmed COVID-19 cases as of Feb. 17: 70,332
> Confirmed COVID-19 cases as of Feb. 17 per 100,000 residents: 13,966.3
> Cumulative COVID-19 deaths as of Feb. 17: 929
> Cumulative COVID-19 deaths as of Feb. 17 per 100,000 residents: 184.5
> Population: 503,585

Source: DenisTangneyJr / Getty Images
10. El Paso, TX
> Confirmed COVID-19 cases as of Feb. 17: 120,205
> Confirmed COVID-19 cases as of Feb. 17 per 100,000 residents: 14,350.2
> Cumulative COVID-19 deaths as of Feb. 17: 2,262
> Cumulative COVID-19 deaths as of Feb. 17 per 100,000 residents: 270
> Population: 837,654
These are all the counties in Texas where COVID-19 is slowing (and where it’s still getting worse).
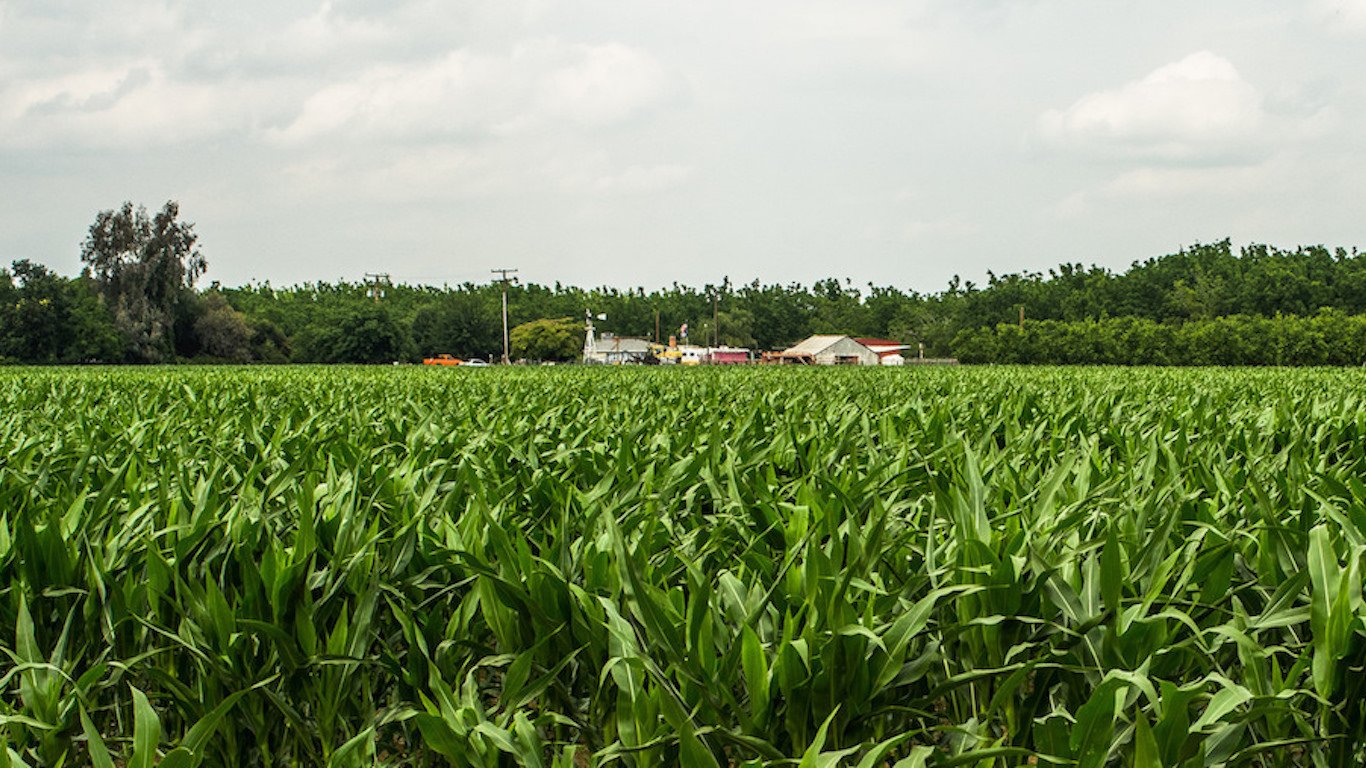
Source: https://www.flickr.com/photos/33671002@N00/
9. Hanford-Corcoran, CA
> Confirmed COVID-19 cases as of Feb. 17: 21,583
> Confirmed COVID-19 cases as of Feb. 17 per 100,000 residents: 14,381.5
> Cumulative COVID-19 deaths as of Feb. 17: 209
> Cumulative COVID-19 deaths as of Feb. 17 per 100,000 residents: 139.3
> Population: 150,075

Source: DenisTangneyJr / Getty Images
8. Sioux Falls, SD
> Confirmed COVID-19 cases as of Feb. 17: 36,969
> Confirmed COVID-19 cases as of Feb. 17 per 100,000 residents: 14,472.8
> Cumulative COVID-19 deaths as of Feb. 17: 476
> Cumulative COVID-19 deaths as of Feb. 17 per 100,000 residents: 186.3
> Population: 255,438

Source: Cbl62 / Wikimedia Commons
7. El Centro, CA
> Confirmed COVID-19 cases as of Feb. 17: 26,711
> Confirmed COVID-19 cases as of Feb. 17 per 100,000 residents: 14,821.7
> Cumulative COVID-19 deaths as of Feb. 17: 584
> Cumulative COVID-19 deaths as of Feb. 17 per 100,000 residents: 324.1
> Population: 180,216

Source: Javin Weaver / Wikimedia Commons
6. Provo-Orem, UT
> Confirmed COVID-19 cases as of Feb. 17: 88,217
> Confirmed COVID-19 cases as of Feb. 17 per 100,000 residents: 14,940.9
> Cumulative COVID-19 deaths as of Feb. 17: 308
> Cumulative COVID-19 deaths as of Feb. 17 per 100,000 residents: 52.2
> Population: 590,440
These are all the counties in Utah where COVID-19 is slowing (and where it’s still getting worse).
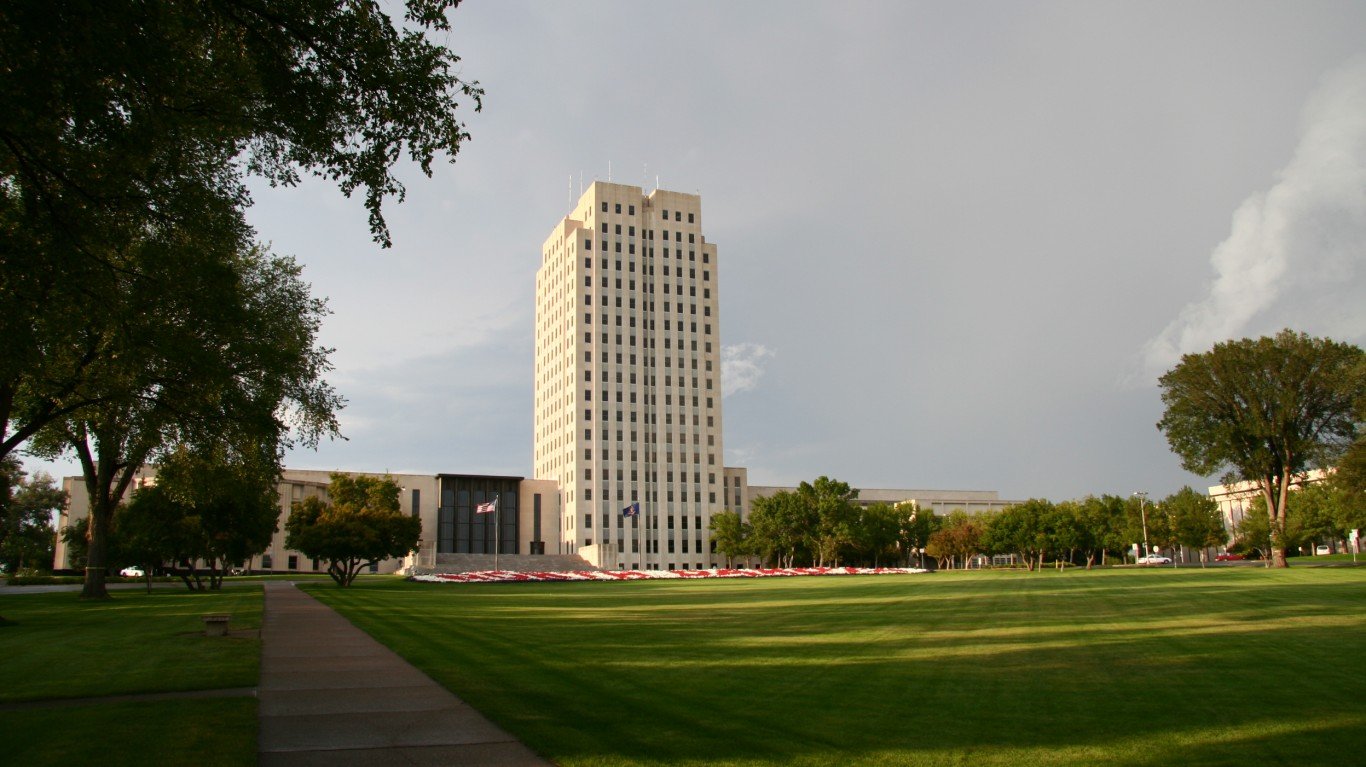
Source: sakakawea7 / Getty Images
5. Bismarck, ND
> Confirmed COVID-19 cases as of Feb. 17: 19,563
> Confirmed COVID-19 cases as of Feb. 17 per 100,000 residents: 15,511.7
> Cumulative COVID-19 deaths as of Feb. 17: 281
> Cumulative COVID-19 deaths as of Feb. 17 per 100,000 residents: 222.8
> Population: 126,118

Source: DenisTangneyJr / Getty Images
4. Laredo, TX
> Confirmed COVID-19 cases as of Feb. 17: 42,419
> Confirmed COVID-19 cases as of Feb. 17 per 100,000 residents: 15,592.2
> Cumulative COVID-19 deaths as of Feb. 17: 653
> Cumulative COVID-19 deaths as of Feb. 17 per 100,000 residents: 240
> Population: 272,053
These are all the counties in Texas where COVID-19 is slowing (and where it’s still getting worse).

Source: Ron and Patty Thomas / Getty Images
3. Lubbock, TX
> Confirmed COVID-19 cases as of Feb. 17: 48,955
> Confirmed COVID-19 cases as of Feb. 17 per 100,000 residents: 15,634.4
> Cumulative COVID-19 deaths as of Feb. 17: 796
> Cumulative COVID-19 deaths as of Feb. 17 per 100,000 residents: 254.2
> Population: 313,123
These are all the counties in Texas where COVID-19 is slowing (and where it’s still getting worse).
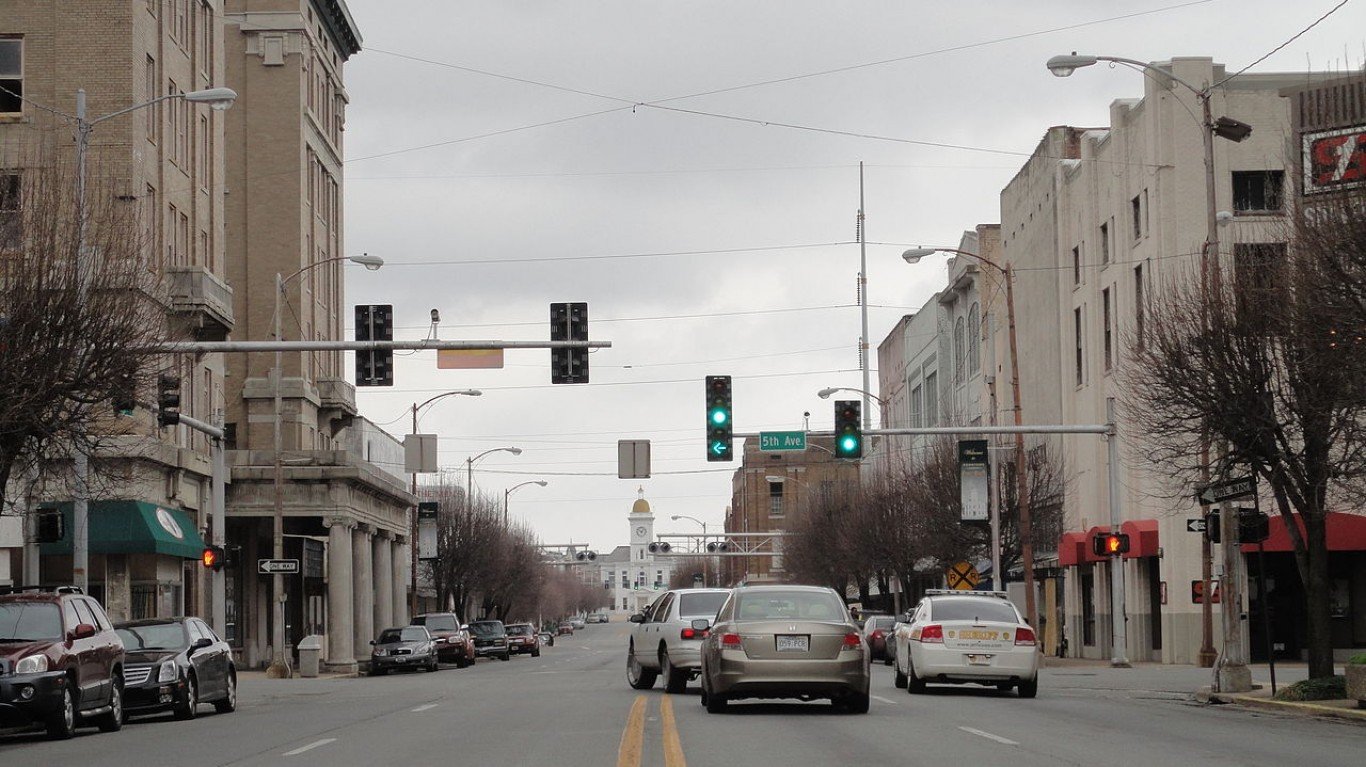
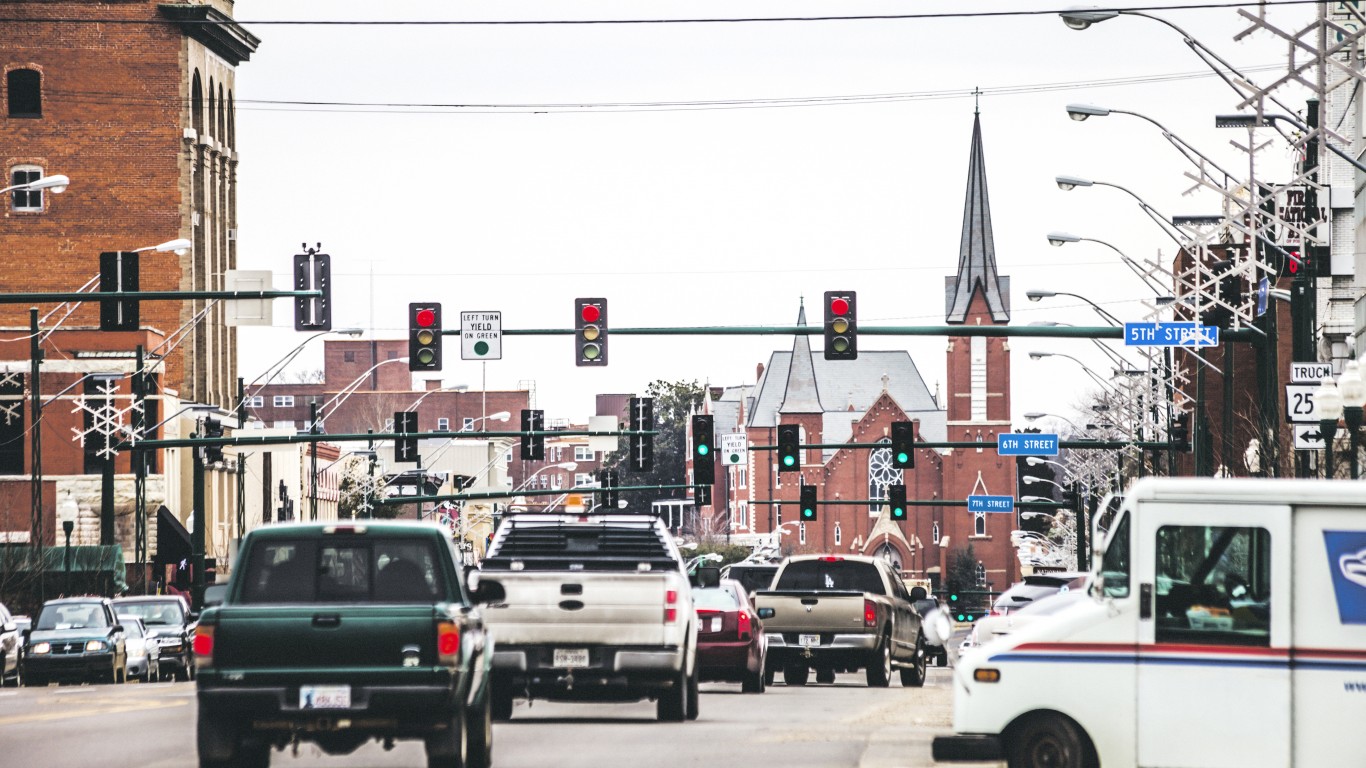
Source: Paul Sableman (Flickr user: pasa47) / Wikimedia Commons
2. Pine Bluff, AR
> Confirmed COVID-19 cases as of Feb. 17: 15,185
> Confirmed COVID-19 cases as of Feb. 17 per 100,000 residents: 16,443.8
> Cumulative COVID-19 deaths as of Feb. 17: 277
> Cumulative COVID-19 deaths as of Feb. 17 per 100,000 residents: 300
> Population: 92,345
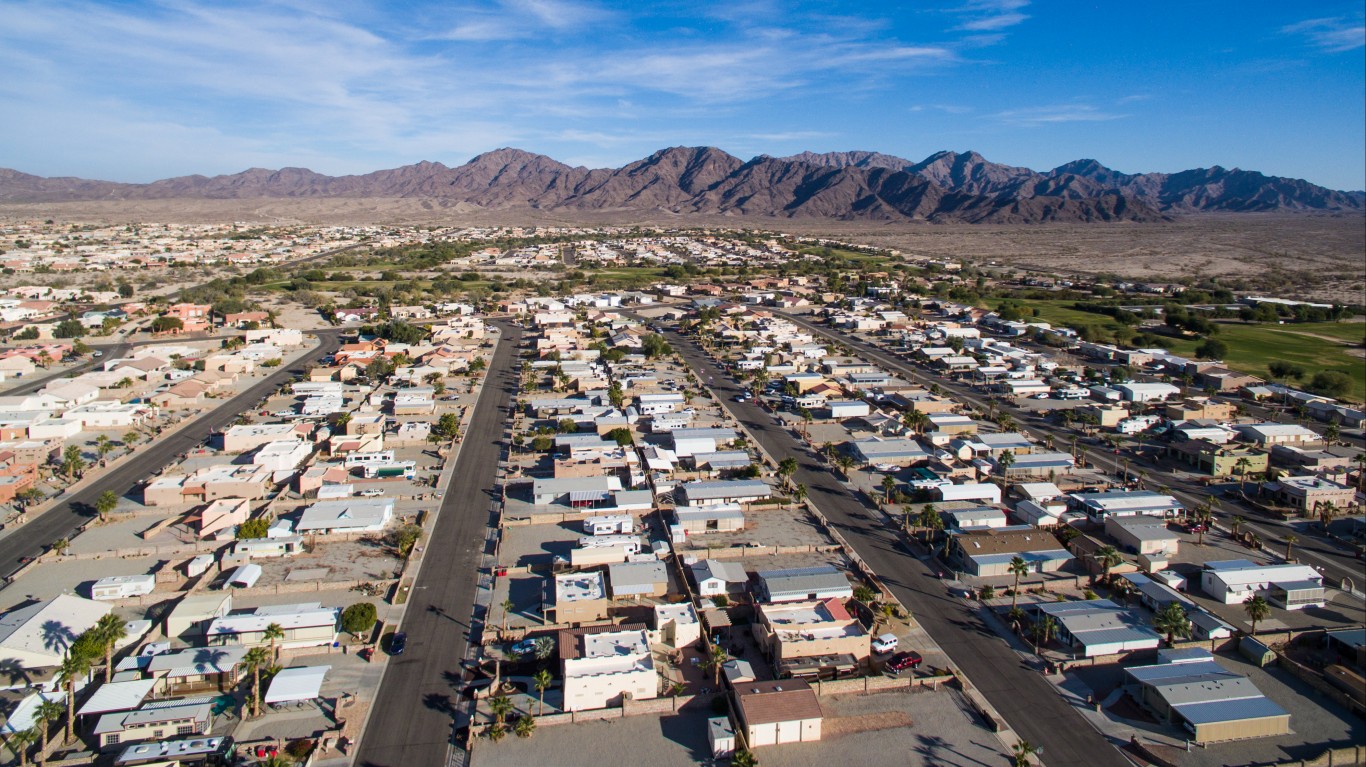
Source: ianmcdonnell / Getty Images
1. Yuma, AZ
> Confirmed COVID-19 cases as of Feb. 17: 36,160
> Confirmed COVID-19 cases as of Feb. 17 per 100,000 residents: 17,398.9
> Cumulative COVID-19 deaths as of Feb. 17: 762
> Cumulative COVID-19 deaths as of Feb. 17 per 100,000 residents: 366.6
> Population: 207,829
Click here to see all coronavirus data for every state.
Take This Retirement Quiz To Get Matched With A Financial Advisor (Sponsored)
Take the quiz below to get matched with a financial advisor today.
Each advisor has been vetted by SmartAsset and is held to a fiduciary standard to act in your best interests.
Here’s how it works:
1. Answer SmartAsset advisor match quiz
2. Review your pre-screened matches at your leisure. Check out the
advisors’ profiles.
3. Speak with advisors at no cost to you. Have an introductory call on the phone or introduction in person and choose whom to work with in the future
Take the retirement quiz right here.
Thank you for reading! Have some feedback for us?
Contact the 24/7 Wall St. editorial team.
Editors' Picks


