
The U.S. has reported more than 28,000,000 confirmed COVID-19 cases as of Mar. 2, 2021. More than 490,000 Americans have died of COVID-19 — the highest death toll of any country.
The virus has spread throughout the country in a way that has been difficult to predict, surging in one region, then showing signs of improvement, and then reappearing in other regions. Though local outbreaks may ebb and flow, the current surge in cases has been felt nearly nationwide, leading to new travel restrictions and business closures around the country.
Nationwide, there were an average of 20.3 daily new coronavirus cases per 100,000 Americans in the week ending Mar. 2, 2021. Cumulatively, the U.S. has reported 8,658.3 cases per 100,000 Americans, and 152.8 deaths per 100,000 Americans.
The extent of the spread of the novel coronavirus continues to vary considerably from state to state, and even from county to county. Even as the number of daily new cases is flattening or even declining in some parts of the country, new cases are surging at a growing rate in others.
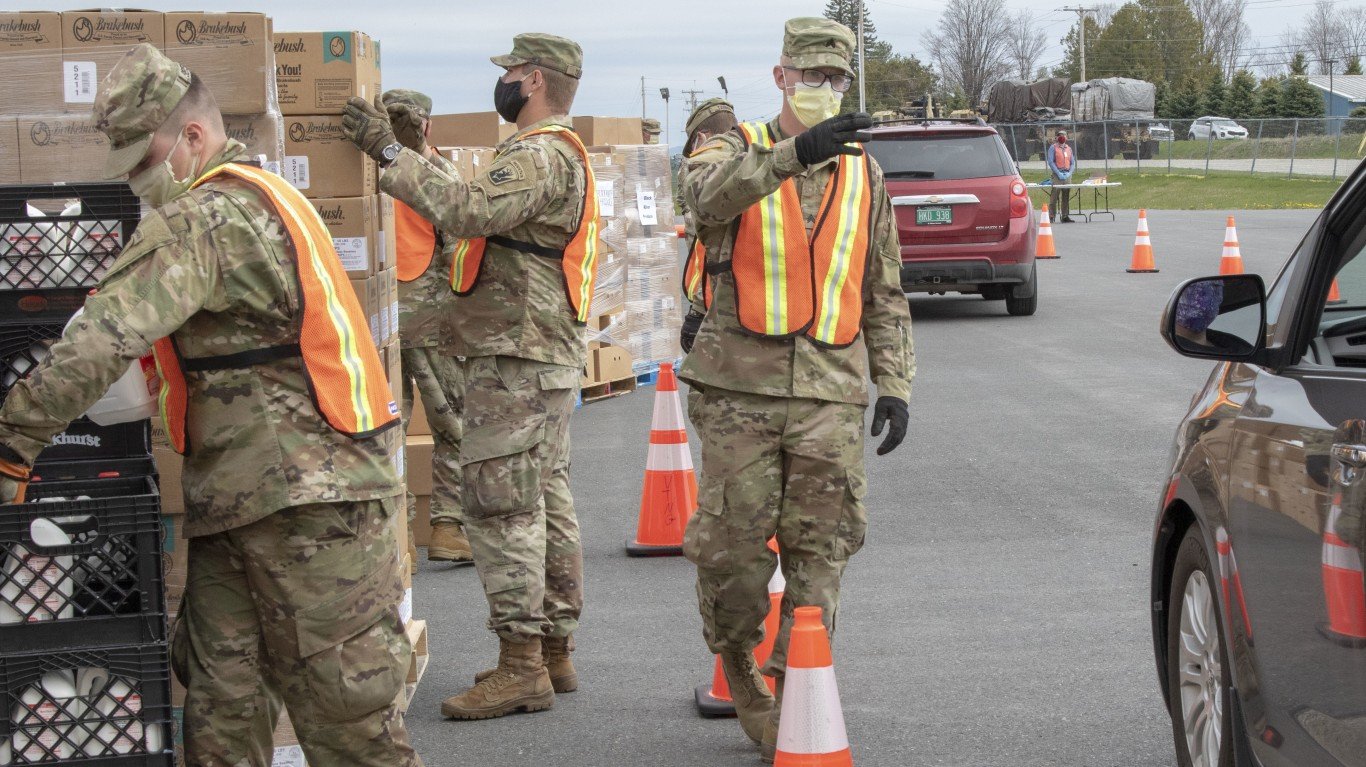
The coronavirus has spread to different parts of the country in different stages throughout the pandemic. In the spring, the worst hit states were in the Northeast, as New York City became the epicenter of the nation’s crisis. The virus spread to states throughout the Sun Belt in the summer, and hit states in the Midwest and West during the fall. Now, nearly every state is categorized as a COVID-19 hotspot, according to definitions based on new cases per capita from the nonprofit health organization Kaiser Family Foundation.
To determine the county in each state with the highest rate of daily cases of the virus, 24/7 Wall St. compiled and reviewed data from state and local health departments. We ranked counties according to the average new number of cases per 100,000 residents per day during the week ending Mar. 2, 2021. Population data used to adjust case and death totals came from the U.S. Census Bureau’s 2018 American Community Survey and are five-year estimates.
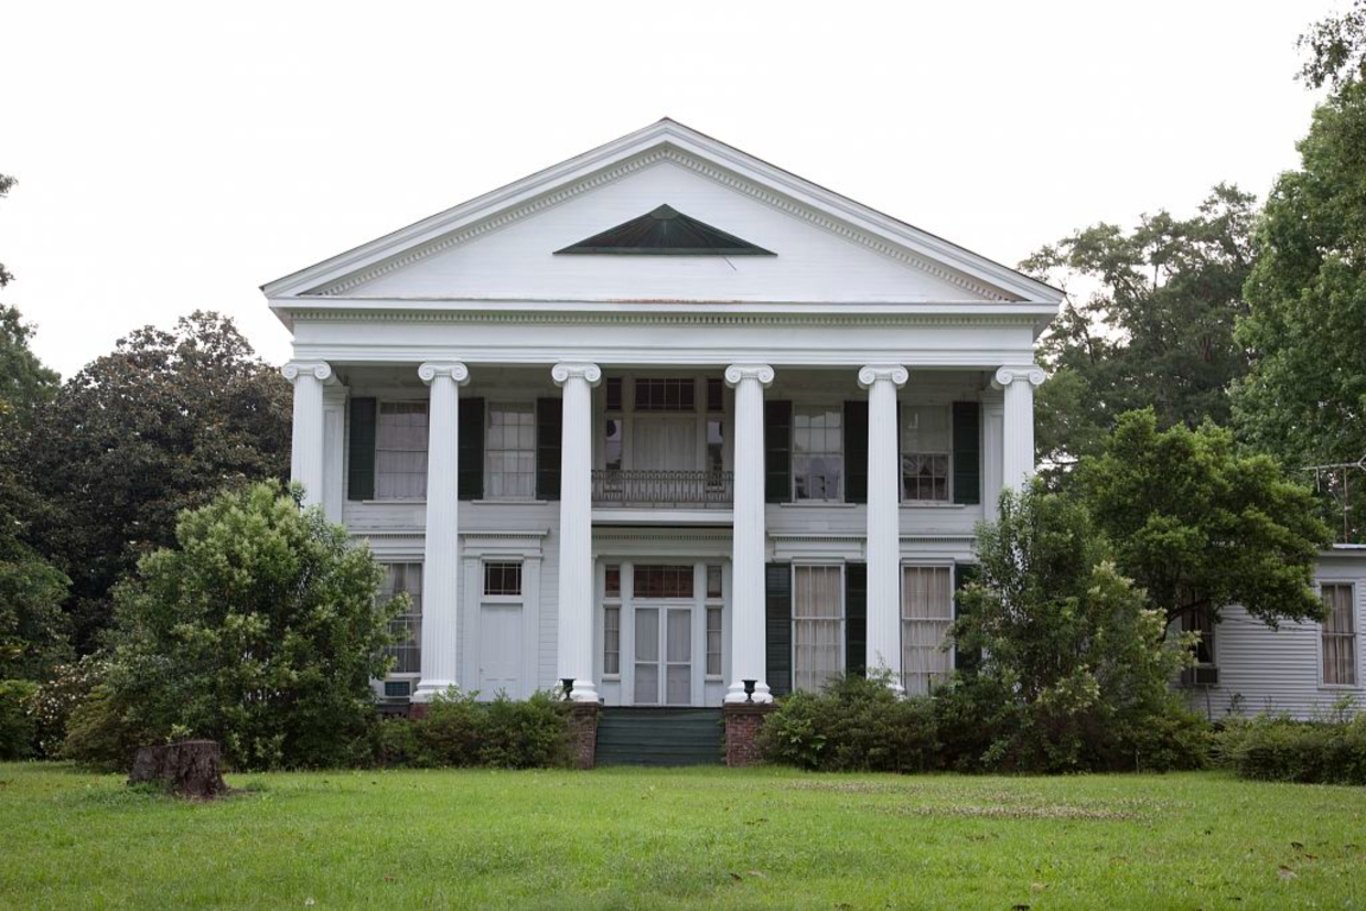
Source: Carol M. Highsmith / Wikimedia Commons
Alabama: Hale County
> Avg. new daily cases in Hale County in week ending Mar. 2, 2021: 47.8 per 100,000
> Cumulative confirmed COVID-19 cases in Hale County as of Mar. 2, 2021: 2,106 (14,146.6 per 100,000)
> Cumulative confirmed COVID-19 deaths in Hale County as of Mar. 2, 2021: 68 (456.8 per 100,000)
> Population: 14,887
> Largest place in Hale County: Moundville
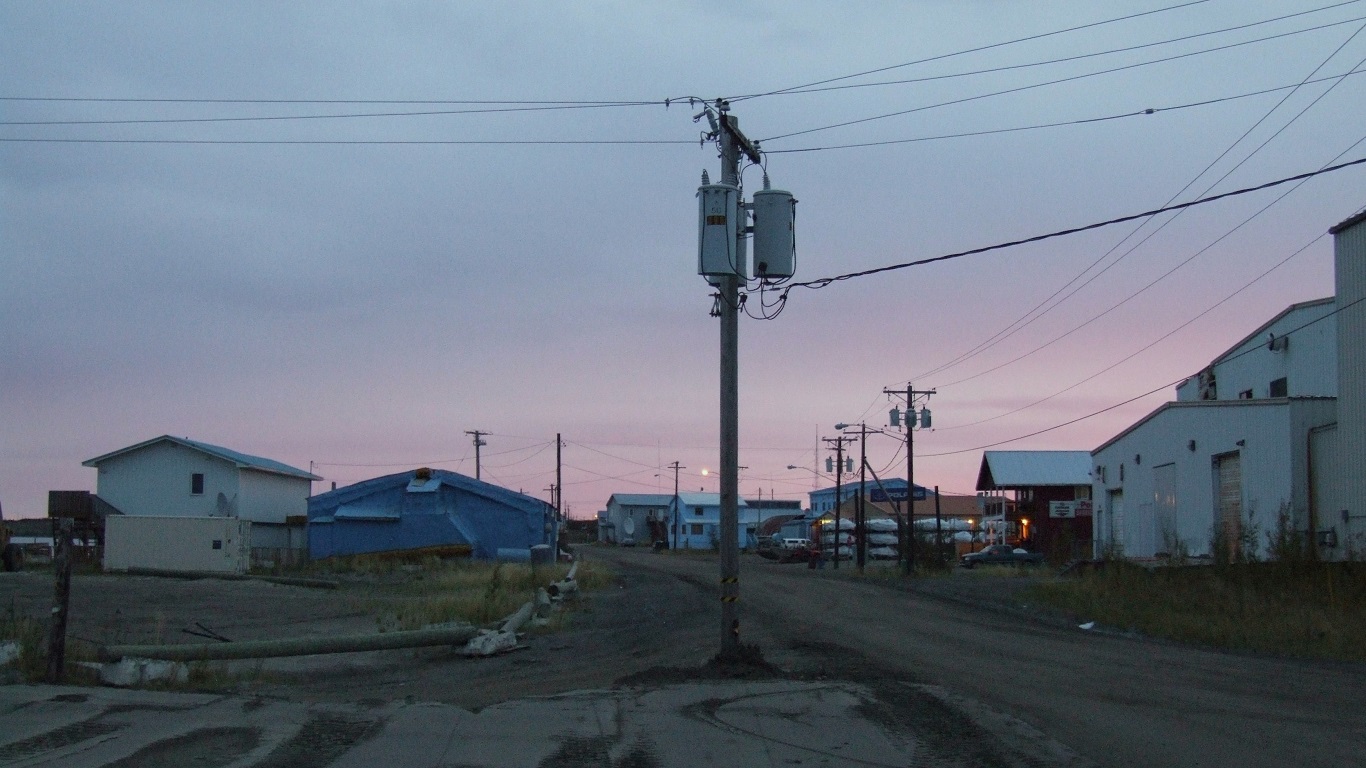
Source: Travis / Flickr
Alaska: Bethel Census Area
> Avg. new daily cases in Bethel Census Area in week ending Mar. 2, 2021: 1,443.70 per 100,000
> Cumulative confirmed COVID-19 cases in Bethel Census Area as of Mar. 2, 2021: 3,572 (19,800.4 per 100,000)
> Cumulative confirmed COVID-19 deaths in Bethel Census Area as of Mar. 2, 2021: 19 (105.3 per 100,000)
> Population: 18,040
> Largest place in Bethel Census Area: Bethel
These are all the counties in Alaska where COVID-19 is slowing (and where it’s still getting worse).

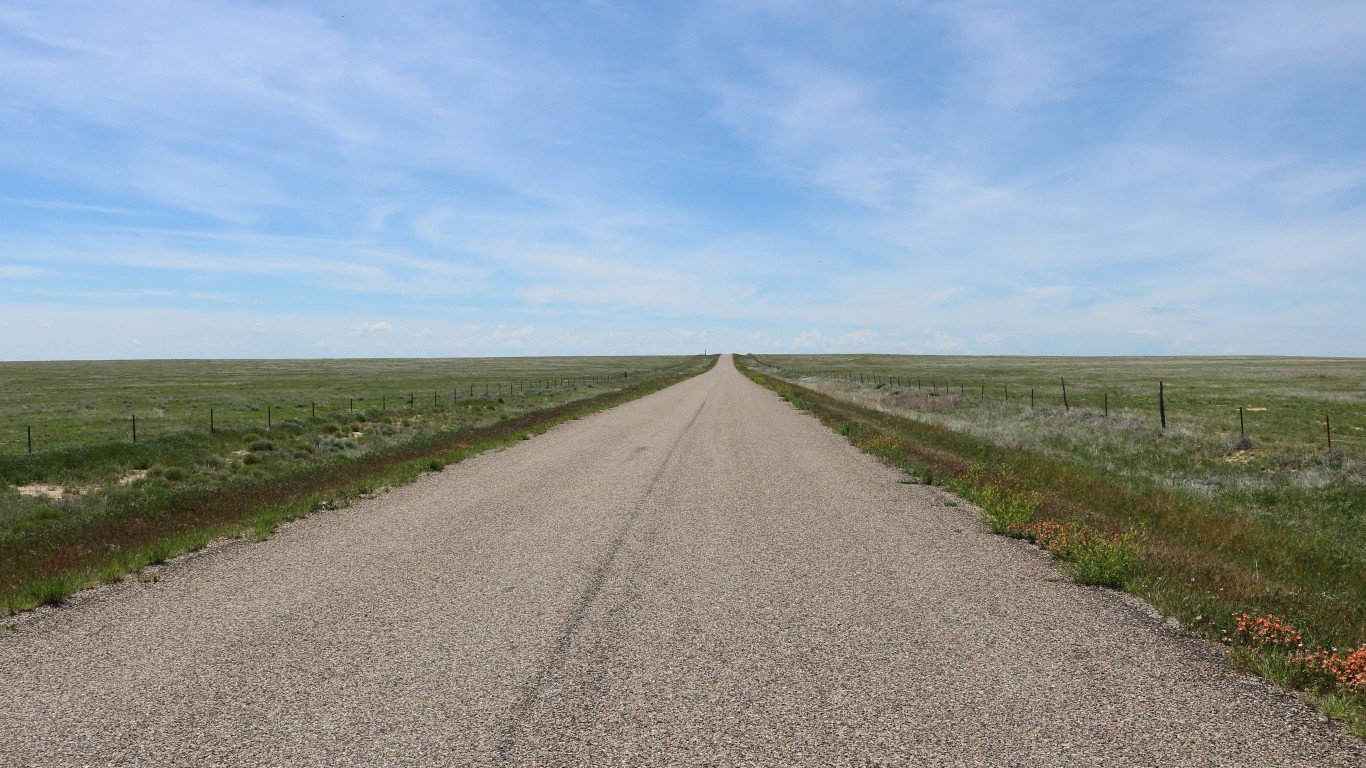
Source: CampPhoto / Getty Images
Arizona: Apache County
> Avg. new daily cases in Apache County in week ending Mar. 2, 2021: 42.3 per 100,000
> Cumulative confirmed COVID-19 cases in Apache County as of Mar. 2, 2021: 10,469 (14,637.5 per 100,000)
> Cumulative confirmed COVID-19 deaths in Apache County as of Mar. 2, 2021: 389 (543.9 per 100,000)
> Population: 71,522
> Largest place in Apache County: Chinle

Source: BOB WESTON / iStock via Getty Images
Arkansas: Sevier County
> Avg. new daily cases in Sevier County in week ending Mar. 2, 2021: 150.7 per 100,000
> Cumulative confirmed COVID-19 cases in Sevier County as of Mar. 2, 2021: 3,680 (21,404.1 per 100,000)
> Cumulative confirmed COVID-19 deaths in Sevier County as of Mar. 2, 2021: 29 (168.7 per 100,000)
> Population: 17,193
> Largest place in Sevier County: De Queen

Source: Chuck Abbe / Wikimedia Commons
California: Inyo County
> Avg. new daily cases in Inyo County in week ending Mar. 2, 2021: 48.1 per 100,000
> Cumulative confirmed COVID-19 cases in Inyo County as of Mar. 2, 2021: 1,285 (7,105.3 per 100,000)
> Cumulative confirmed COVID-19 deaths in Inyo County as of Mar. 2, 2021: 37 (204.6 per 100,000)
> Population: 18,085
> Largest place in Inyo County: Bishop
Source: denverjeffrey / Flickr
Colorado: Crowley County
> Avg. new daily cases in Crowley County in week ending Mar. 2, 2021: 71.5 per 100,000
> Cumulative confirmed COVID-19 cases in Crowley County as of Mar. 2, 2021: 2,048 (36,376.6 per 100,000)
> Cumulative confirmed COVID-19 deaths in Crowley County as of Mar. 2, 2021: 14 (248.7 per 100,000)
> Population: 5,630
> Largest place in Crowley County: Ordway

Source: pabradyphoto / iStock via Getty Images
Connecticut: New Haven County
> Avg. new daily cases in New Haven County in week ending Mar. 2, 2021: 35.5 per 100,000
> Cumulative confirmed COVID-19 cases in New Haven County as of Mar. 2, 2021: 72,163 (8,397.5 per 100,000)
> Cumulative confirmed COVID-19 deaths in New Haven County as of Mar. 2, 2021: 1,926 (224.1 per 100,000)
> Population: 859,339
> Largest place in New Haven County: New Haven

Source: JERRYE & ROY KLOTZ, M.D. / Wikimedia Commons
Delaware: New Castle County
> Avg. new daily cases in New Castle County in week ending Mar. 2, 2021: 36.4 per 100,000
> Cumulative confirmed COVID-19 cases in New Castle County as of Mar. 2, 2021: 49,817 (8,973.9 per 100,000)
> Cumulative confirmed COVID-19 deaths in New Castle County as of Mar. 2, 2021: 697 (125.6 per 100,000)
> Population: 555,133
> Largest place in New Castle County: Wilmington

Source: BOB WESTON / Getty Images
Florida: DeSoto County
> Avg. new daily cases in DeSoto County in week ending Mar. 2, 2021: 51.5 per 100,000
> Cumulative confirmed COVID-19 cases in DeSoto County as of Mar. 2, 2021: 3,823 (10,503.0 per 100,000)
> Cumulative confirmed COVID-19 deaths in DeSoto County as of Mar. 2, 2021: 75 (206 per 100,000)
> Population: 36,399
> Largest place in DeSoto County: Arcadia

Source: thenationalguard / Flickr
Georgia: Gordon County
> Avg. new daily cases in Gordon County in week ending Mar. 2, 2021: 83.6 per 100,000
> Cumulative confirmed COVID-19 cases in Gordon County as of Mar. 2, 2021: 7,561 (13,314.0 per 100,000)
> Cumulative confirmed COVID-19 deaths in Gordon County as of Mar. 2, 2021: 102 (179.6 per 100,000)
> Population: 56,790
> Largest place in Gordon County: Calhoun

Source: Eric Broder Van Dyke / Getty Images
Hawaii: Maui County
> Avg. new daily cases in Maui County in week ending Mar. 2, 2021: 15.1 per 100,000
> Cumulative confirmed COVID-19 cases in Maui County as of Mar. 2, 2021: 2,366 (1,431.5 per 100,000)
> Cumulative confirmed COVID-19 deaths in Maui County as of Mar. 2, 2021: 33 (20 per 100,000)
> Population: 165,281
> Largest place in Maui County: Kahului
These are all the counties in Hawaii where COVID-19 is slowing (and where it’s still getting worse).
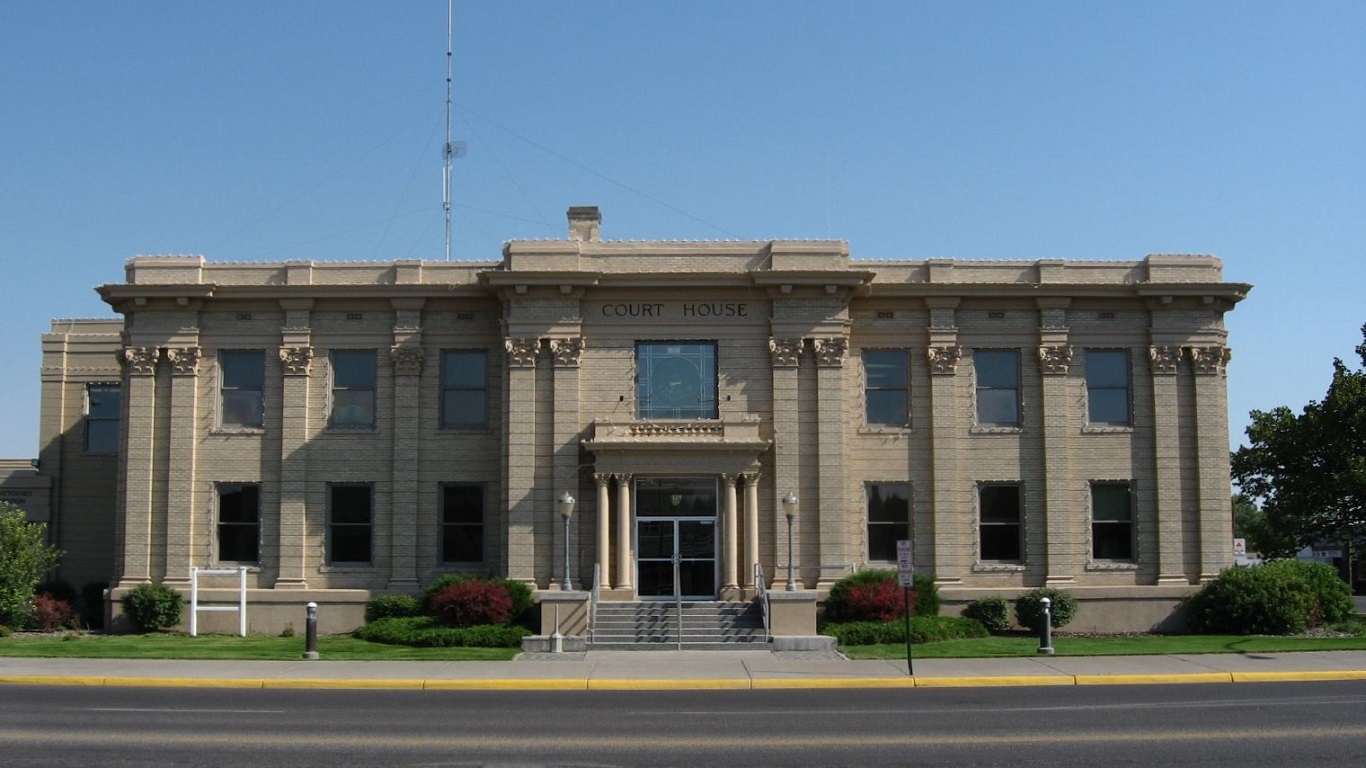
Source: Ken Lund / Flickr
Idaho: Madison County
> Avg. new daily cases in Madison County in week ending Mar. 2, 2021: 60 per 100,000
> Cumulative confirmed COVID-19 cases in Madison County as of Mar. 2, 2021: 6,373 (16,465.6 per 100,000)
> Cumulative confirmed COVID-19 deaths in Madison County as of Mar. 2, 2021: 22 (56.8 per 100,000)
> Population: 38,705
> Largest place in Madison County: Rexburg
These are all the counties in Idaho where COVID-19 is slowing (and where it’s still getting worse).

Source: navymedicine / Flickr
Illinois: Douglas County
> Avg. new daily cases in Douglas County in week ending Mar. 2, 2021: 65.2 per 100,000
> Cumulative confirmed COVID-19 cases in Douglas County as of Mar. 2, 2021: 2,461 (12,483.5 per 100,000)
> Cumulative confirmed COVID-19 deaths in Douglas County as of Mar. 2, 2021: 33 (167.4 per 100,000)
> Population: 19,714
> Largest place in Douglas County: Tuscola

Source: William Reagan / iStock via Getty Images
Indiana: Cass County
> Avg. new daily cases in Cass County in week ending Mar. 2, 2021: 53.9 per 100,000
> Cumulative confirmed COVID-19 cases in Cass County as of Mar. 2, 2021: 5,450 (14,310.5 per 100,000)
> Cumulative confirmed COVID-19 deaths in Cass County as of Mar. 2, 2021: 99 (260 per 100,000)
> Population: 38,084
> Largest place in Cass County: Logansport

Source: Public Domain / Wikimedia Commons
Iowa: Page County
> Avg. new daily cases in Page County in week ending Mar. 2, 2021: 76.2 per 100,000
> Cumulative confirmed COVID-19 cases in Page County as of Mar. 2, 2021: 1,772 (11,534.2 per 100,000)
> Cumulative confirmed COVID-19 deaths in Page County as of Mar. 2, 2021: 19 (123.7 per 100,000)
> Population: 15,363
> Largest place in Page County: Clarinda
These are all the counties in Iowa where COVID-19 is slowing (and where it’s still getting worse).

Source: Ammodramus / Wikimedia Commons
Kansas: Hodgeman County
> Avg. new daily cases in Hodgeman County in week ending Mar. 2, 2021: 51.7 per 100,000
> Cumulative confirmed COVID-19 cases in Hodgeman County as of Mar. 2, 2021: 203 (11,020.6 per 100,000)
> Cumulative confirmed COVID-19 deaths in Hodgeman County as of Mar. 2, 2021: N/A (N/A per 100,000)
> Population: 1,842
> Largest place in Hodgeman County: Jetmore
These are all the counties in Kansas where COVID-19 is slowing (and where it’s still getting worse).

Source: BOB WESTON / iStock via Getty Images
Kentucky: Caldwell County
> Avg. new daily cases in Caldwell County in week ending Mar. 2, 2021: 227.3 per 100,000
> Cumulative confirmed COVID-19 cases in Caldwell County as of Mar. 2, 2021: 1,543 (12,123.8 per 100,000)
> Cumulative confirmed COVID-19 deaths in Caldwell County as of Mar. 2, 2021: 23 (180.7 per 100,000)
> Population: 12,727
> Largest place in Caldwell County: Princeton

Source: BOB WESTON / iStock via Getty Images
Louisiana: St. Bernard Parish
> Avg. new daily cases in St. Bernard Parish in week ending Mar. 2, 2021: 42.9 per 100,000
> Cumulative confirmed COVID-19 cases in St. Bernard Parish as of Mar. 2, 2021: 3,758 (8,224.3 per 100,000)
> Cumulative confirmed COVID-19 deaths in St. Bernard Parish as of Mar. 2, 2021: 46 (100.7 per 100,000)
> Population: 45,694
> Largest place in St. Bernard Parish: Chalmette

Source: EJJohnsonPhotography / Getty Images
Maine: Piscataquis County
> Avg. new daily cases in Piscataquis County in week ending Mar. 2, 2021: 21.7 per 100,000
> Cumulative confirmed COVID-19 cases in Piscataquis County as of Mar. 2, 2021: 293 (1,735.1 per 100,000)
> Cumulative confirmed COVID-19 deaths in Piscataquis County as of Mar. 2, 2021: 1 (5.9 per 100,000)
> Population: 16,887
> Largest place in Piscataquis County: Dover-Foxcroft
These are all the counties in Maine where COVID-19 is slowing (and where it’s still getting worse).

Source: Courtesy of Eli Pousson via Wikimedia Commons
Maryland: Dorchester County
> Avg. new daily cases in Dorchester County in week ending Mar. 2, 2021: 28.1 per 100,000
> Cumulative confirmed COVID-19 cases in Dorchester County as of Mar. 2, 2021: 2,354 (7,296.7 per 100,000)
> Cumulative confirmed COVID-19 deaths in Dorchester County as of Mar. 2, 2021: 45 (139.5 per 100,000)
> Population: 32,261
> Largest place in Dorchester County: Cambridge

Source: takomabibelot / Flickr
Massachusetts: Hampden County
> Avg. new daily cases in Hampden County in week ending Mar. 2, 2021: 34.3 per 100,000
> Cumulative confirmed COVID-19 cases in Hampden County as of Mar. 2, 2021: 41,941 (8,940.4 per 100,000)
> Cumulative confirmed COVID-19 deaths in Hampden County as of Mar. 2, 2021: 1,340 (285.6 per 100,000)
> Population: 469,116
> Largest place in Hampden County: Springfield
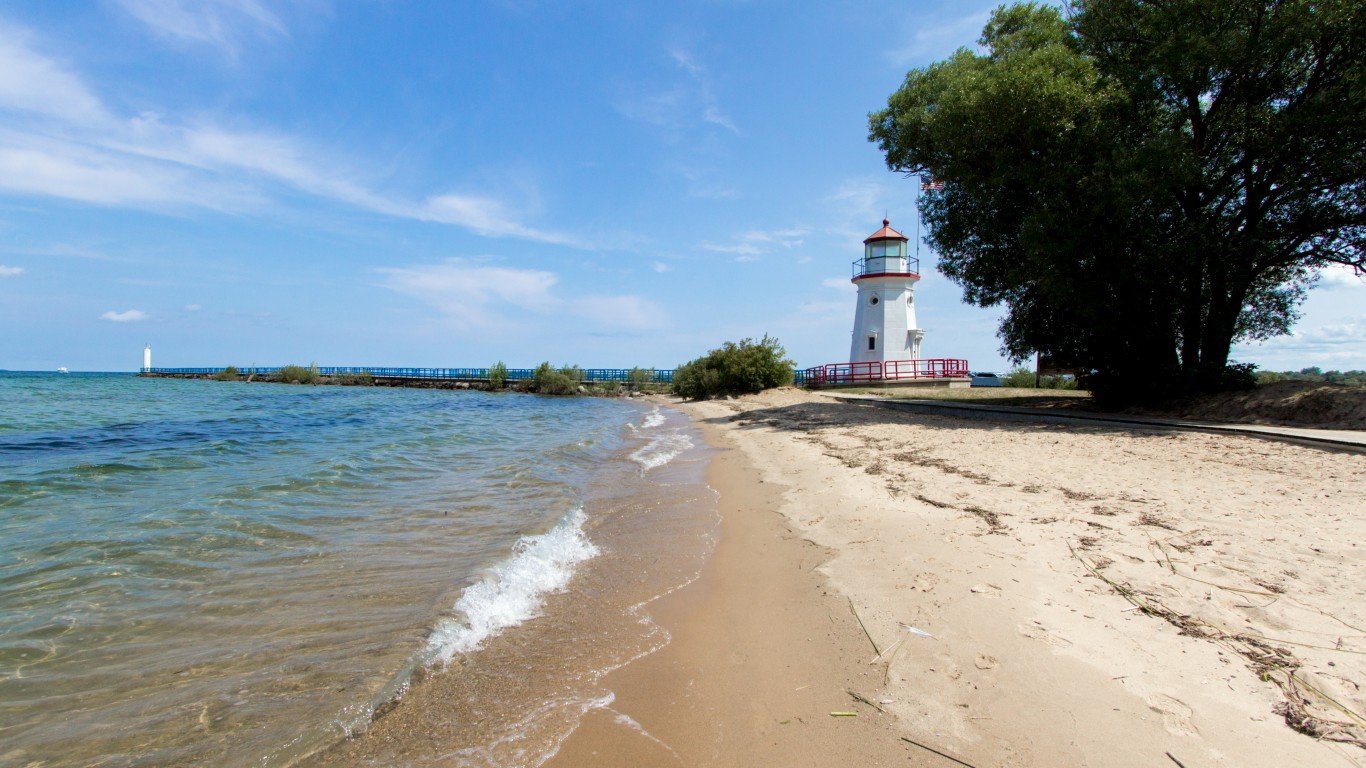
Source: ehrlif / iStock via Getty Images
Michigan: Cheboygan County
> Avg. new daily cases in Cheboygan County in week ending Mar. 2, 2021: 43.6 per 100,000
> Cumulative confirmed COVID-19 cases in Cheboygan County as of Mar. 2, 2021: 1,014 (3,983.0 per 100,000)
> Cumulative confirmed COVID-19 deaths in Cheboygan County as of Mar. 2, 2021: 37 (145.3 per 100,000)
> Population: 25,458
> Largest place in Cheboygan County: Cheboygan

Source: thenationalguard / Flickr
Minnesota: Pennington County
> Avg. new daily cases in Pennington County in week ending Mar. 2, 2021: 89.6 per 100,000
> Cumulative confirmed COVID-19 cases in Pennington County as of Mar. 2, 2021: 1,344 (9,475.5 per 100,000)
> Cumulative confirmed COVID-19 deaths in Pennington County as of Mar. 2, 2021: 16 (112.8 per 100,000)
> Population: 14,184
> Largest place in Pennington County: Thief River Falls
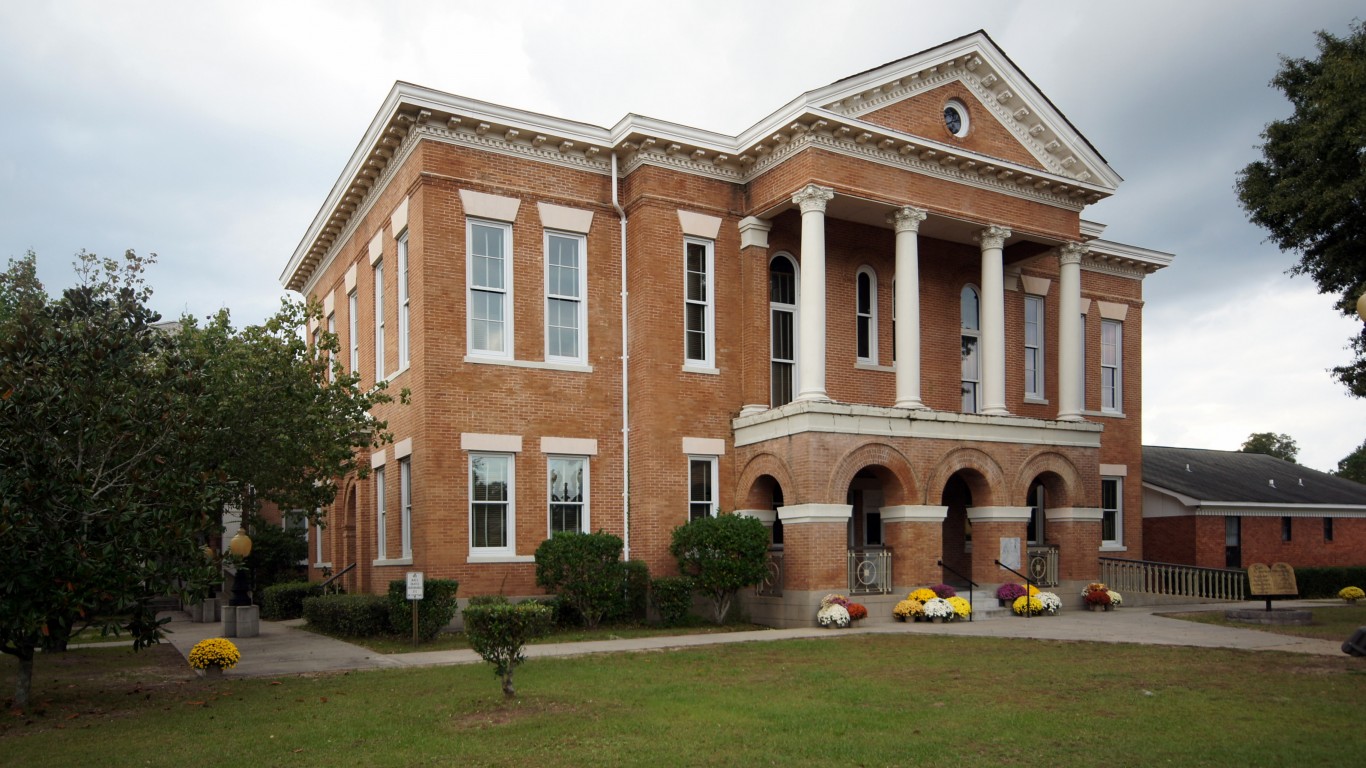
Source: BOB WESTON / iStock via Getty Images
Mississippi: Perry County
> Avg. new daily cases in Perry County in week ending Mar. 2, 2021: 47.7 per 100,000
> Cumulative confirmed COVID-19 cases in Perry County as of Mar. 2, 2021: 1,217 (10,118.1 per 100,000)
> Cumulative confirmed COVID-19 deaths in Perry County as of Mar. 2, 2021: 34 (282.7 per 100,000)
> Population: 12,028
> Largest place in Perry County: Beaumont
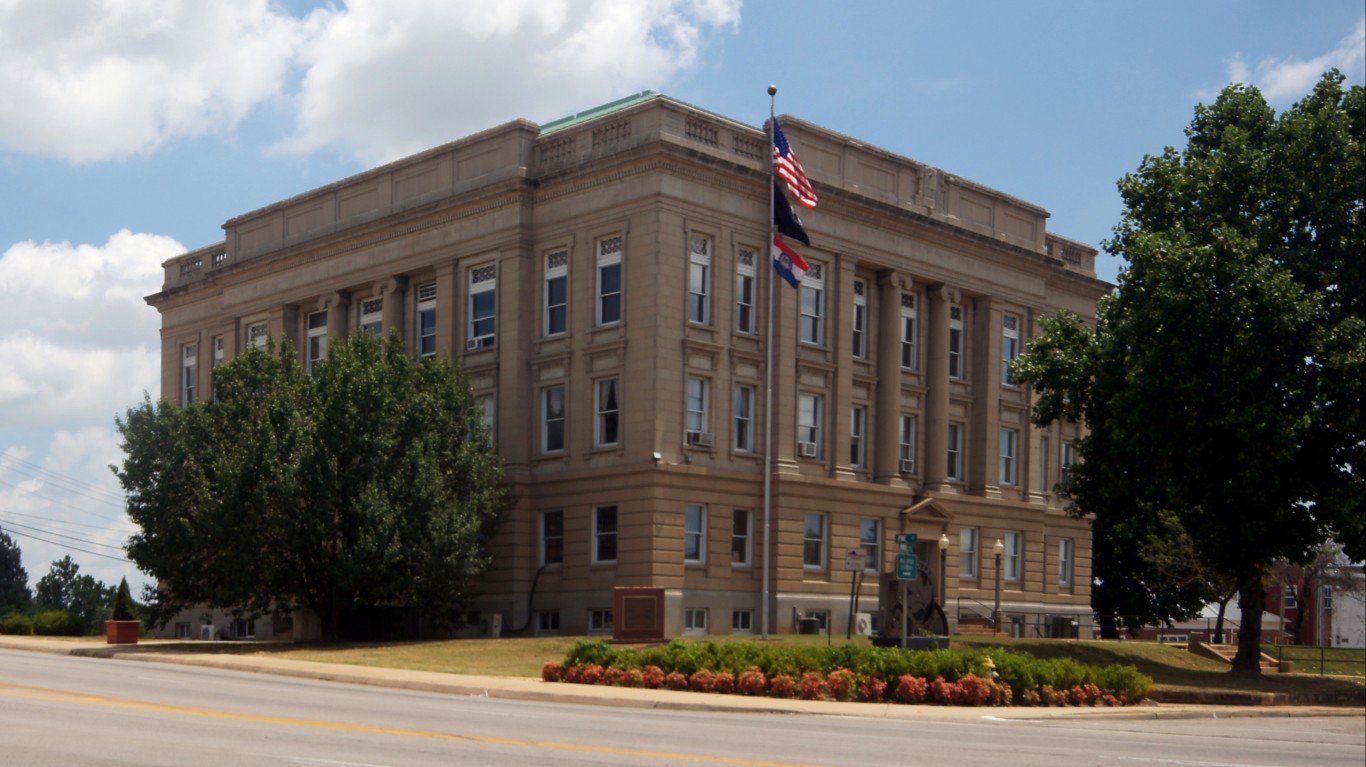
Source: BOB WESTON / iStock via Getty Images
Missouri: Butler County
> Avg. new daily cases in Butler County in week ending Mar. 2, 2021: 26.2 per 100,000
> Cumulative confirmed COVID-19 cases in Butler County as of Mar. 2, 2021: 3,508 (8,209.1 per 100,000)
> Cumulative confirmed COVID-19 deaths in Butler County as of Mar. 2, 2021: 34 (79.6 per 100,000)
> Population: 42,733
> Largest place in Butler County: Poplar Bluff

Source: J.B. Chandler / Wikimedia Commons
Montana: Wheatland County
> Avg. new daily cases in Wheatland County in week ending Mar. 2, 2021: 41 per 100,000
> Cumulative confirmed COVID-19 cases in Wheatland County as of Mar. 2, 2021: 174 (8,096.8 per 100,000)
> Cumulative confirmed COVID-19 deaths in Wheatland County as of Mar. 2, 2021: 6 (279.2 per 100,000)
> Population: 2,149
> Largest place in Wheatland County: Harlowton
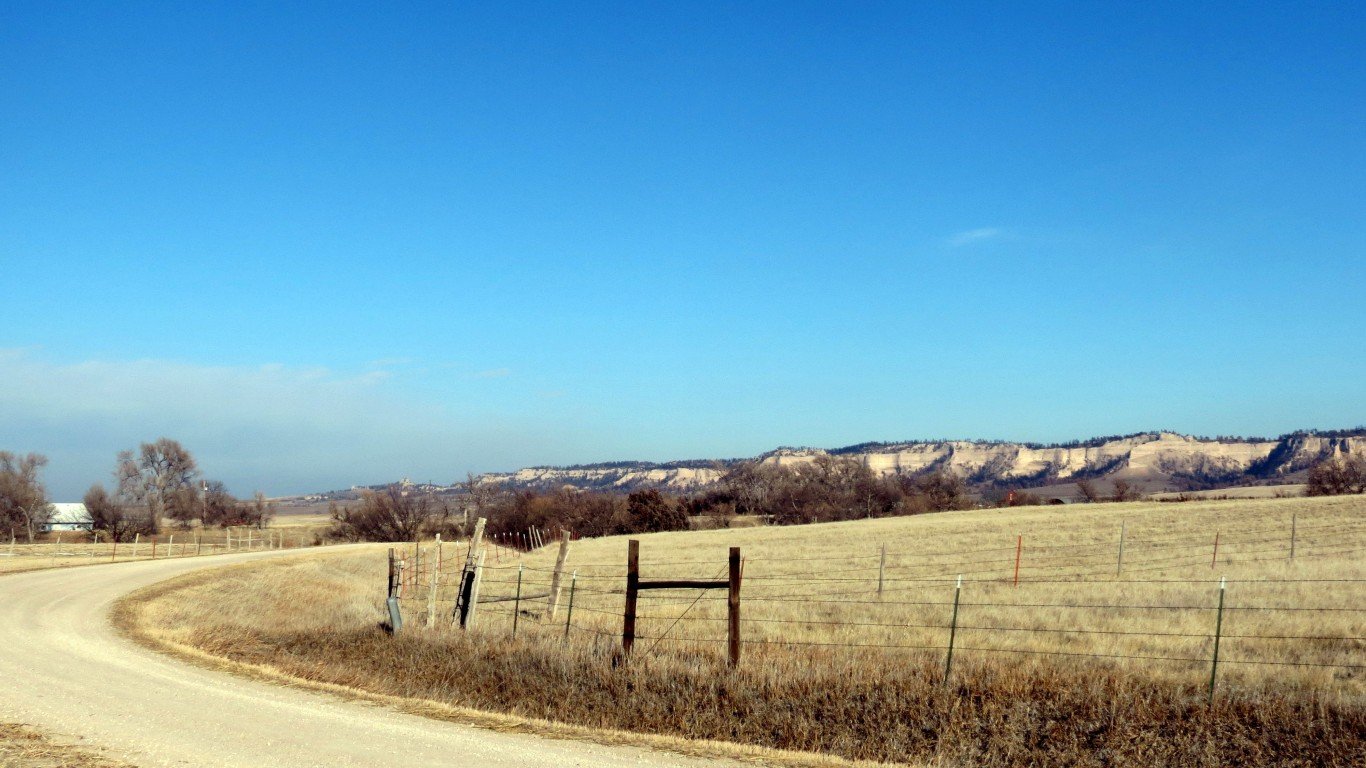
Source: 156513724@N05 / Flickr
Nebraska: Sheridan County
> Avg. new daily cases in Sheridan County in week ending Mar. 2, 2021: 48.2 per 100,000
> Cumulative confirmed COVID-19 cases in Sheridan County as of Mar. 2, 2021: 479 (9,151.7 per 100,000)
> Cumulative confirmed COVID-19 deaths in Sheridan County as of Mar. 2, 2021: 18 (343.9 per 100,000)
> Population: 5,234
> Largest place in Sheridan County: Gordon

Source: LPETTET / Getty Images
Nevada: Clark County
> Avg. new daily cases in Clark County in week ending Mar. 2, 2021: 16.2 per 100,000
> Cumulative confirmed COVID-19 cases in Clark County as of Mar. 2, 2021: 227,107 (10,604.7 per 100,000)
> Cumulative confirmed COVID-19 deaths in Clark County as of Mar. 2, 2021: 3,871 (180.8 per 100,000)
> Population: 2,141,574
> Largest place in Clark County: Las Vegas
These are all the counties in Nevada where COVID-19 is slowing (and where it’s still getting worse).

Source: DenisTangneyJr / iStock via Getty Images
New Hampshire: Strafford County
> Avg. new daily cases in Strafford County in week ending Mar. 2, 2021: 39.4 per 100,000
> Cumulative confirmed COVID-19 cases in Strafford County as of Mar. 2, 2021: 7,084 (5,524.1 per 100,000)
> Cumulative confirmed COVID-19 deaths in Strafford County as of Mar. 2, 2021: 74 (57.7 per 100,000)
> Population: 128,237
> Largest place in Strafford County: Dover

Source: Cwieders / iStock via Getty Images
New Jersey: Ocean County
> Avg. new daily cases in Ocean County in week ending Mar. 2, 2021: 51.2 per 100,000
> Cumulative confirmed COVID-19 cases in Ocean County as of Mar. 2, 2021: 59,147 (9,992.1 per 100,000)
> Cumulative confirmed COVID-19 deaths in Ocean County as of Mar. 2, 2021: 1,866 (315.2 per 100,000)
> Population: 591,939
> Largest place in Ocean County: Toms River

Source: mtcurado / iStock via Getty Images
New Mexico: Union County
> Avg. new daily cases in Union County in week ending Mar. 2, 2021: 73 per 100,000
> Cumulative confirmed COVID-19 cases in Union County as of Mar. 2, 2021: 237 (5,676.6 per 100,000)
> Cumulative confirmed COVID-19 deaths in Union County as of Mar. 2, 2021: 9 (215.6 per 100,000)
> Population: 4,175
> Largest place in Union County: Clayton

Source: dhdezvalle / iStock via Getty Images
New York: Bronx County
> Avg. new daily cases in Bronx County in week ending Mar. 2, 2021: 58.1 per 100,000
> Cumulative confirmed COVID-19 cases in Bronx County as of Mar. 2, 2021: 139,496 (9,701.6 per 100,000)
> Cumulative confirmed COVID-19 deaths in Bronx County as of Mar. 2, 2021: 4,115 (286.2 per 100,000)
> Population: 1,437,872
> Largest place in Bronx County: New York

Source: gerrydincher / Flickr
North Carolina: Robeson County
> Avg. new daily cases in Robeson County in week ending Mar. 2, 2021: 73.9 per 100,000
> Cumulative confirmed COVID-19 cases in Robeson County as of Mar. 2, 2021: 15,241 (11,421.4 per 100,000)
> Cumulative confirmed COVID-19 deaths in Robeson County as of Mar. 2, 2021: 209 (156.6 per 100,000)
> Population: 133,442
> Largest place in Robeson County: Lumberton

Source: thenationalguard / Flickr
North Dakota: Hettinger County
> Avg. new daily cases in Hettinger County in week ending Mar. 2, 2021: 63.8 per 100,000
> Cumulative confirmed COVID-19 cases in Hettinger County as of Mar. 2, 2021: 317 (12,305.9 per 100,000)
> Cumulative confirmed COVID-19 deaths in Hettinger County as of Mar. 2, 2021: 4 (155.3 per 100,000)
> Population: 2,576
> Largest place in Hettinger County: Mott

Source: OZinOH / Wikimedia Commons
Ohio: Ashtabula County
> Avg. new daily cases in Ashtabula County in week ending Mar. 2, 2021: 50.5 per 100,000
> Cumulative confirmed COVID-19 cases in Ashtabula County as of Mar. 2, 2021: 5,959 (6,072.2 per 100,000)
> Cumulative confirmed COVID-19 deaths in Ashtabula County as of Mar. 2, 2021: 147 (149.8 per 100,000)
> Population: 98,136
> Largest place in Ashtabula County: Ashtabula
These are all the counties in Ohio where COVID-19 is slowing (and where it’s still getting worse).

Source: GracedByTheLight / iStock via Getty Images
Oklahoma: Cimarron County
> Avg. new daily cases in Cimarron County in week ending Mar. 2, 2021: 221.9 per 100,000
> Cumulative confirmed COVID-19 cases in Cimarron County as of Mar. 2, 2021: 190 (8,679.8 per 100,000)
> Cumulative confirmed COVID-19 deaths in Cimarron County as of Mar. 2, 2021: 1 (45.7 per 100,000)
> Population: 2,189
> Largest place in Cimarron County: Boise City

Source: Public Domain / Wikimedia Commons
Oregon: Morrow County
> Avg. new daily cases in Morrow County in week ending Mar. 2, 2021: 27 per 100,000
> Cumulative confirmed COVID-19 cases in Morrow County as of Mar. 2, 2021: 1,049 (9,353.5 per 100,000)
> Cumulative confirmed COVID-19 deaths in Morrow County as of Mar. 2, 2021: 14 (124.8 per 100,000)
> Population: 11,215
> Largest place in Morrow County: Boardman
These are all the counties in Oregon where COVID-19 is slowing (and where it’s still getting worse).

Source: gerrydincher / Flickr
Pennsylvania: Union County
> Avg. new daily cases in Union County in week ending Mar. 2, 2021: 46.6 per 100,000
> Cumulative confirmed COVID-19 cases in Union County as of Mar. 2, 2021: 5,261 (11,661.6 per 100,000)
> Cumulative confirmed COVID-19 deaths in Union County as of Mar. 2, 2021: 81 (179.5 per 100,000)
> Population: 45,114
> Largest place in Union County: Lewisburg

Source: kapstun / Getty Images
Rhode Island: Washington County
> Avg. new daily cases in Washington County in week ending Mar. 2, 2021: 31.7 per 100,000
> Cumulative confirmed COVID-19 cases in Washington County as of Mar. 2, 2021: 7,625 (6,040.0 per 100,000)
> Cumulative confirmed COVID-19 deaths in Washington County as of Mar. 2, 2021: N/A (N/A per 100,000)
> Population: 126,242
> Largest place in Washington County: Westerly

Source: digidreamgrafix / iStock via Getty Images
South Carolina: York County
> Avg. new daily cases in York County in week ending Mar. 2, 2021: 74.1 per 100,000
> Cumulative confirmed COVID-19 cases in York County as of Mar. 2, 2021: 26,745 (10,340.6 per 100,000)
> Cumulative confirmed COVID-19 deaths in York County as of Mar. 2, 2021: 333 (128.7 per 100,000)
> Population: 258,641
> Largest place in York County: Rock Hill

Source: Michael Ciaglo / Getty Images
South Dakota: Douglas County
> Avg. new daily cases in Douglas County in week ending Mar. 2, 2021: 65 per 100,000
> Cumulative confirmed COVID-19 cases in Douglas County as of Mar. 2, 2021: 434 (14,812.3 per 100,000)
> Cumulative confirmed COVID-19 deaths in Douglas County as of Mar. 2, 2021: 9 (307.2 per 100,000)
> Population: 2,930
> Largest place in Douglas County: Armour

Source: thenationalguard / Flickr
Tennessee: Claiborne County
> Avg. new daily cases in Claiborne County in week ending Mar. 2, 2021: 53.2 per 100,000
> Cumulative confirmed COVID-19 cases in Claiborne County as of Mar. 2, 2021: 2,797 (8,847.6 per 100,000)
> Cumulative confirmed COVID-19 deaths in Claiborne County as of Mar. 2, 2021: 68 (215.1 per 100,000)
> Population: 31,613
> Largest place in Claiborne County: Harrogate-Shawanee

Source: usdagov / Flickr
Texas: La Salle County
> Avg. new daily cases in La Salle County in week ending Mar. 2, 2021: 234.6 per 100,000
> Cumulative confirmed COVID-19 cases in La Salle County as of Mar. 2, 2021: 985 (13,294.6 per 100,000)
> Cumulative confirmed COVID-19 deaths in La Salle County as of Mar. 2, 2021: 22 (296.9 per 100,000)
> Population: 7,409
> Largest place in La Salle County: Cotulla
These are all the counties in Texas where COVID-19 is slowing (and where it’s still getting worse).

Source: George Frey / Getty Images News via Getty Images
Utah: Tooele County
> Avg. new daily cases in Tooele County in week ending Mar. 2, 2021: 33.8 per 100,000
> Cumulative confirmed COVID-19 cases in Tooele County as of Mar. 2, 2021: 6,565 (10,071.3 per 100,000)
> Cumulative confirmed COVID-19 deaths in Tooele County as of Mar. 2, 2021: 37 (56.8 per 100,000)
> Population: 65,185
> Largest place in Tooele County: Tooele
These are all the counties in Utah where COVID-19 is slowing (and where it’s still getting worse).
Source: thenationalguard / Flickr
Vermont: Franklin County
> Avg. new daily cases in Franklin County in week ending Mar. 2, 2021: 33.7 per 100,000
> Cumulative confirmed COVID-19 cases in Franklin County as of Mar. 2, 2021: 1,264 (2,578.3 per 100,000)
> Cumulative confirmed COVID-19 deaths in Franklin County as of Mar. 2, 2021: 35 (71.4 per 100,000)
> Population: 49,025
> Largest place in Franklin County: St. Albans
Source: krblokhin / iStock Editorial via Getty Images
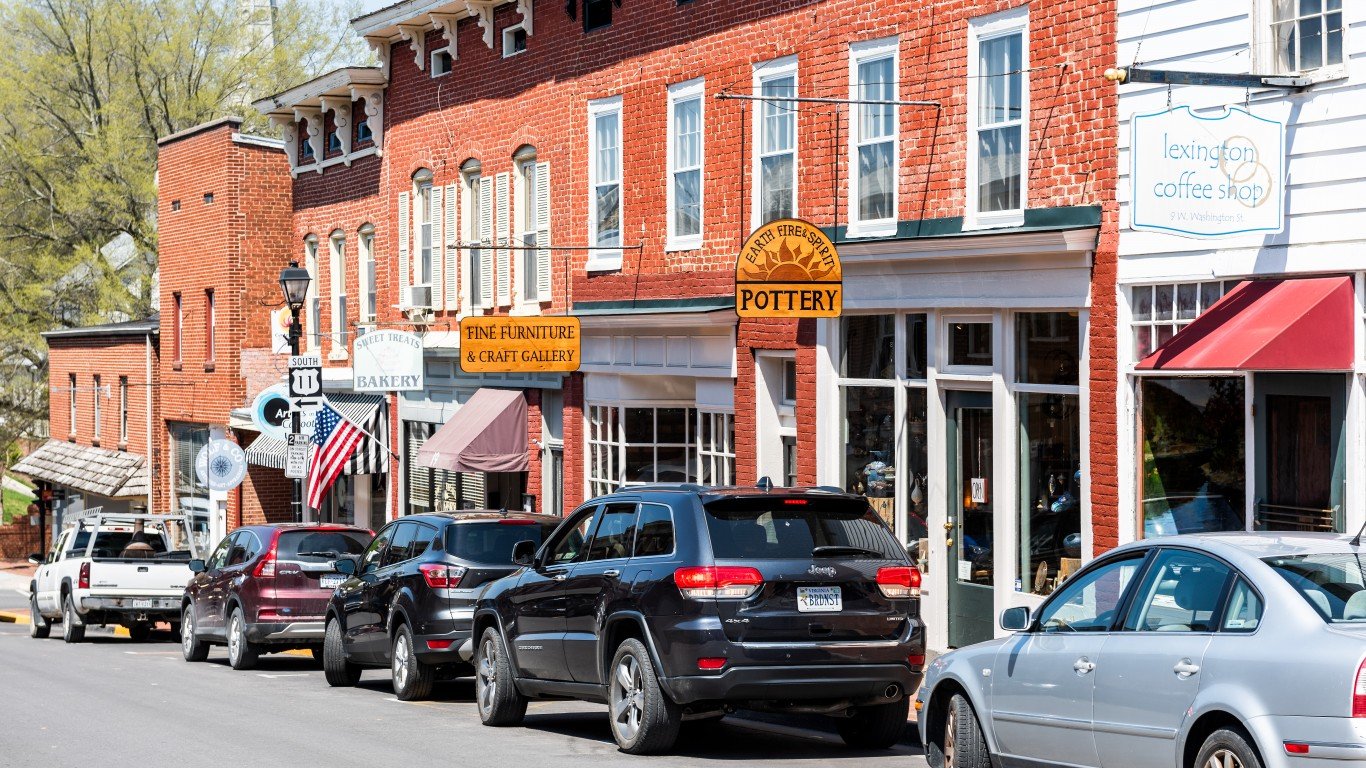
Virginia: Lexington city
> Avg. new daily cases in Lexington city in week ending Mar. 2, 2021: 92.8 per 100,000
> Cumulative confirmed COVID-19 cases in Lexington city as of Mar. 2, 2021: 1,120 (15,752.5 per 100,000)
> Cumulative confirmed COVID-19 deaths in Lexington city as of Mar. 2, 2021: 24 (337.6 per 100,000)
> Population: 7,110
> Largest place in Lexington city: Lexington

Source: GarysFRP / iStock Unreleased via Getty Images
Washington: Wahkiakum County
> Avg. new daily cases in Wahkiakum County in week ending Mar. 2, 2021: 42.6 per 100,000
> Cumulative confirmed COVID-19 cases in Wahkiakum County as of Mar. 2, 2021: 95 (2,267.8 per 100,000)
> Cumulative confirmed COVID-19 deaths in Wahkiakum County as of Mar. 2, 2021: 0 (0 per 100,000)
> Population: 4,189
> Largest place in Wahkiakum County: Cathlamet

Source: puroticorico / Flickr
West Virginia: Roane County
> Avg. new daily cases in Roane County in week ending Mar. 2, 2021: 82 per 100,000
> Cumulative confirmed COVID-19 cases in Roane County as of Mar. 2, 2021: 603 (4,245.0 per 100,000)
> Cumulative confirmed COVID-19 deaths in Roane County as of Mar. 2, 2021: 7 (49.3 per 100,000)
> Population: 14,205
> Largest place in Roane County: Spencer

Source: thenationalguard / Flickr
Wisconsin: Green County
> Avg. new daily cases in Green County in week ending Mar. 2, 2021: 35 per 100,000
> Cumulative confirmed COVID-19 cases in Green County as of Mar. 2, 2021: 3,152 (8,550.3 per 100,000)
> Cumulative confirmed COVID-19 deaths in Green County as of Mar. 2, 2021: 16 (43.4 per 100,000)
> Population: 36,864
> Largest place in Green County: Monroe
Source: Jasperdo / Flickr
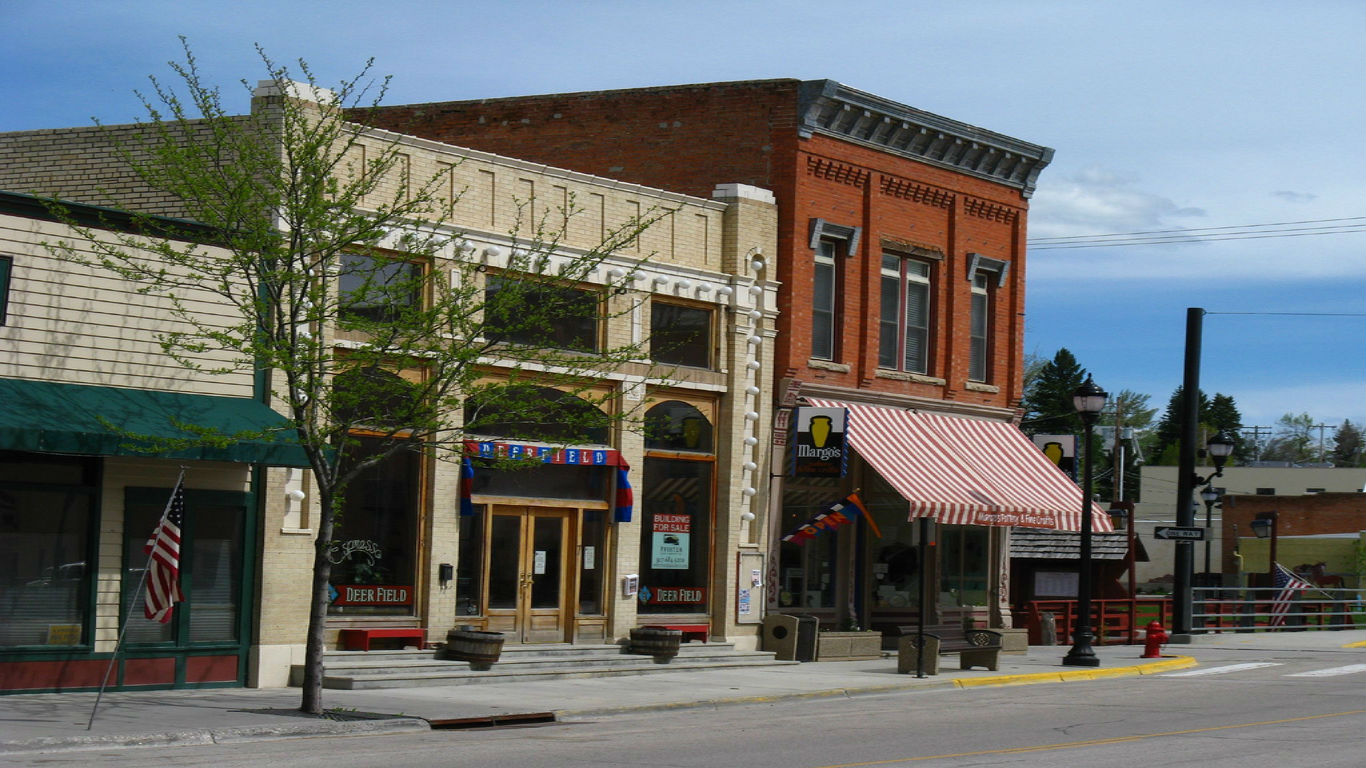
Wyoming: Johnson County
> Avg. new daily cases in Johnson County in week ending Mar. 2, 2021: 132 per 100,000
> Cumulative confirmed COVID-19 cases in Johnson County as of Mar. 2, 2021: 712 (8,361.7 per 100,000)
> Cumulative confirmed COVID-19 deaths in Johnson County as of Mar. 2, 2021: 9 (105.7 per 100,000)
> Population: 8,515
> Largest place in Johnson County: Buffalo
Click here to see all coronavirus data for every state.
Essential Tips for Investing: Sponsored
A financial advisor can help you understand the advantages and disadvantages of investment properties. Finding a qualified financial advisor doesn’t have to be hard. SmartAsset’s free tool matches you with up to three financial advisors who serve your area, and you can interview your advisor matches at no cost to decide which one is right for you. If you’re ready to find an advisor who can help you achieve your financial goals, get started now.
Investing in real estate can diversify your portfolio. But expanding your horizons may add additional costs. If you’re an investor looking to minimize expenses, consider checking out online brokerages. They often offer low investment fees, helping you maximize your profit.
Thank you for reading! Have some feedback for us?
Contact the 24/7 Wall St. editorial team.
Editors' Picks


