
There were 1.2 million violent crimes — murders, rapes, robberies, and aggravated assaults — committed in the United States in 2019, according to the most recent available FBI data. The 2019 national crime rate of 367 incidents for every 100,000 Americans is almost exactly in line with where it was five years ago.
A handful of major metropolitan areas have not followed the national trend, however. Dozens of U.S. cities are reporting violent crime rates over 20% higher than they were five years ago. Not confined to one specific region, these cities span the country, from the deep South to the upper Midwest, and from the Northeast to the Southwest.
Using data from the FBI’s Uniform Crime report, 24/7 Wall St. identified 25 cities to be finalists in an exercise to find the one where crime is soaring the most. In each metro area that was a finalist, the population-adjusted violent crime rate climbed by at least 32.5% between 2014 and 2019.
It is important to note that in the past year, the COVID-19 pandemic appears to have had an impact on crime patterns in the United States. Preliminary data from major cities across the country reveal a decline in crime during the pandemic, despite an uptick in shootings and killings. Exactly how these trends will impact the overall violent crime rate in the finalists for the city where crime is rising the most and nationwide remains to be seen.
While every city that was a finalist has reported a surge in violent crime in recent years, not every city is especially dangerous. Despite rising crime rates, many of these cities remain far safer than the U.S. as a whole. Others, however, may have been safer or as safe as the U.S. five years ago but now have violent crime rates two and even three times higher than the national average.
Kokomo, Indiana, the American city where crime is soaring the most, reported a 144.6% increase in violent crime between 2014 and 2019, according to FBI data. As is often the case in areas with rising rates of violence, aggravated assault was the primary driver of the increase, as the population-adjusted number of cases surged by 221.2%. The annual violent crime rate in the Kokomo area stands at 555 incidents per 100,000 people, well above the 367 per 100,000 national rate.
According to local law enforcement officials, the nation-leading spike in the violent crime rate is not necessarily attributable to a surge in crime. In 2015, Kokomo switched to a new reporting system that broadened the types of crime classified as aggravated assaults. However, homicides, rapes, and robberies have also each increased in the metro area far more than they have nationwide since 2014.
Our methodology: To determine the city where crime is soaring the most, 24/7 Wall St. reviewed data from the FBI’s Uniform Crime Report. We ranked cities based on the percentage increase in violent crimes — which include murder, rape, robbery, and aggravated assault — per 100,000 residents from 2014 to 2019. Data on population also came from the FBI. Supplemental data on poverty came from the U.S. Census Bureau’s 2019 American Community Survey. Data on unemployment came from the Bureau of Labor Statistics.
Click here to see 25 cities where crime is soaring.
Click here to read our detailed methodology.

Source: miroslav_1 / Getty Images
25. Flagstaff, AZ
> 5-yr. change in violent crime rate: +32.5%
> Violent crimes in 2019: 461 per 100,000 people (total: 664)
> Violent crimes in 2014: 348 per 100,000 people (total: 481)
> Violent crime with largest pop.-adj. 5-yr. increase: Aggravated assault (+42.2%)
The 2019 violent crime rate in the Flagstaff metro area was 32.5% higher than it was half a decade ago. There were 461 violent crimes reported for every 100,000 people in Flagstaff in 2019, compared to 348 per 100,000 in 2014.
The increase in the overall violent crime rate was driven by a 42.2% surge in aggravated assault — which is the most commonly reported violent crime, both in Flagstaff and the U.S. as a whole. Meanwhile, rates of some other less common forms of violence, like homicide and robbery, actually declined in Flagstaff between 2014 and 2019.
[in-text-ad]
Source: chapin31 / Getty Images
24. Columbus, IN
> 5-yr. change in violent crime rate: +33.2%
> Violent crimes in 2019: 146 per 100,000 people (total: 122)
> Violent crimes in 2014: 110 per 100,000 people (total: 88)
> Violent crime with largest pop.-adj. 5-yr. increase: Rape (+298.3%)
Columbus, Indiana, reported a 33.2% increase in its population-adjusted violent crime rate between 2014 and 2019. Meanwhile, over the same period, the national violent crime rate remained effectively flat.
Despite the uptick, Columbus remains a relatively safe city. There were 146 violent crimes reported for every 100,000 people in the Columbus metro area in 2019, less than half the U.S. violent crime rate of 367 incidents per 100,000 people.
 24/7 Wall St.
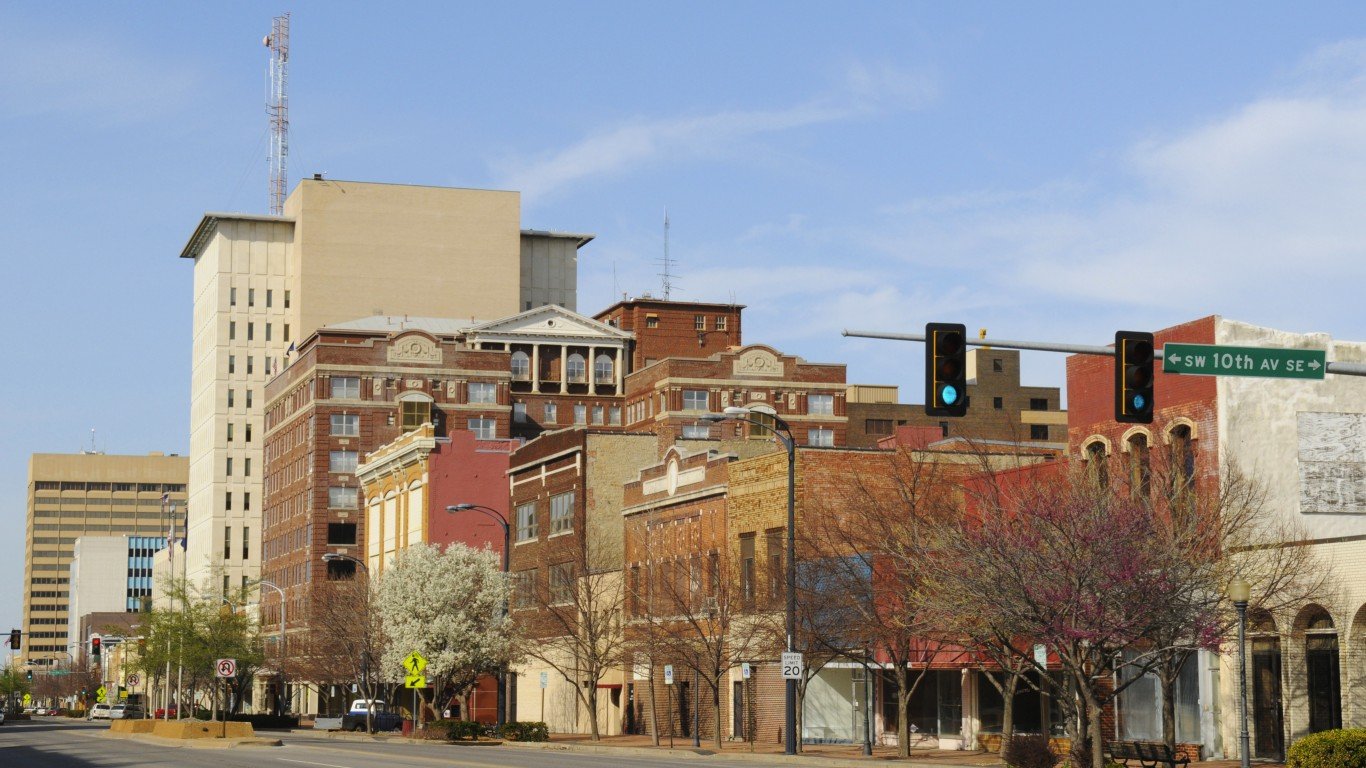
Source: LawrenceSawyer / Getty Images
23. Topeka, KS
> 5-yr. change in violent crime rate: +33.8%
> Violent crimes in 2019: 493 per 100,000 people (total: 1,143)
> Violent crimes in 2014: 368 per 100,000 people (total: 863)
> Violent crime with largest pop.-adj. 5-yr. increase: Murder (+81.6%)
In 2014, the violent crime rate in Topeka, Kansas, of 368 incidents per 100,000 people was closely in line with the national violent crime rate that year. As of 2019, Topeka’s violent crime rate stood at 493 incidents per 100,000 people, well above the comparable national rate, which is little changed from where it stood five years ago.
The 33.8% five-year increase in the population-adjusted violent crime rate in Topeka is among the largest of any U.S. metro area. Of the four categories of offences classified as violent crimes, murder climbed the most. There were 16 cases of homicide reported in the metro area in 2019, up from nine in 2014.
Source: Thomas R Machnitzki ([email protected]) / Wikimedia Commons
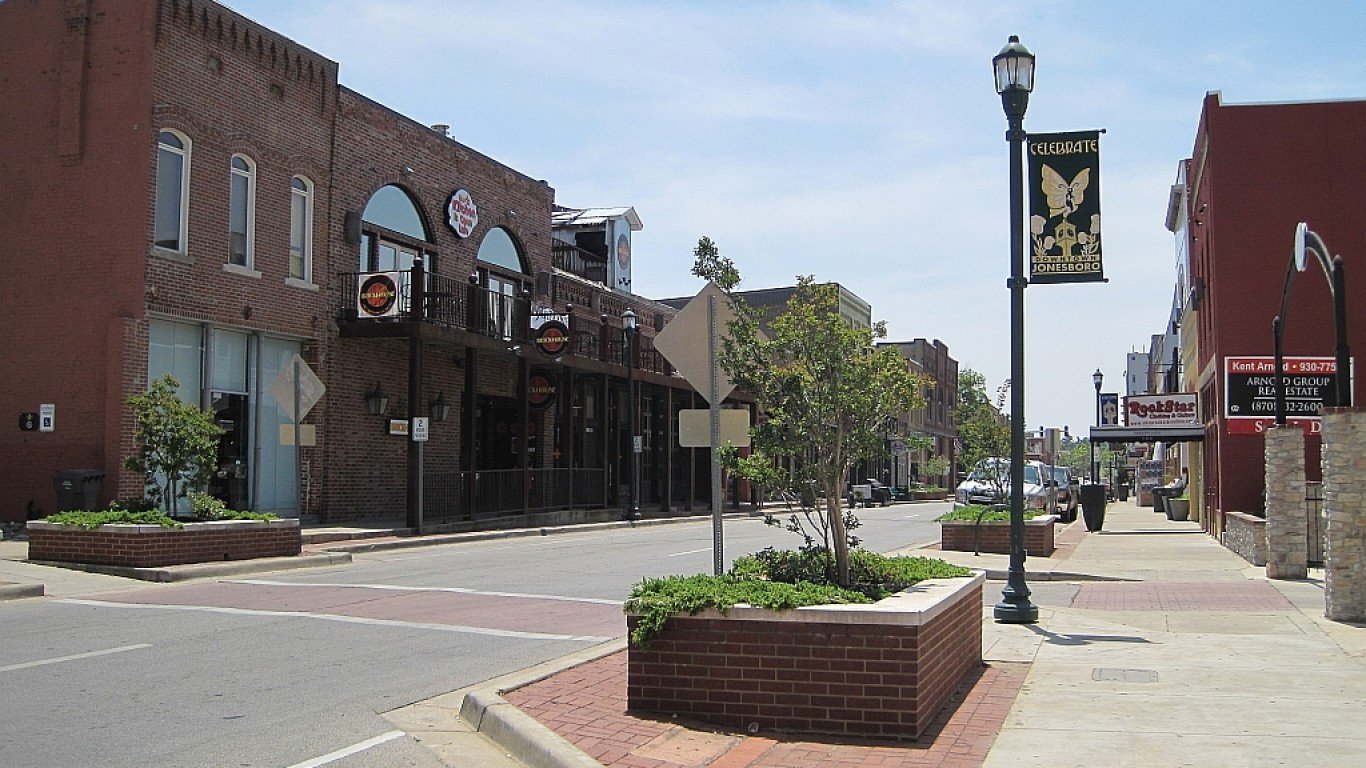
22. Jonesboro, AR
> 5-yr. change in violent crime rate: +34.9%
> Violent crimes in 2019: 556 per 100,000 people (total: 743)
> Violent crimes in 2014: 412 per 100,000 people (total: 522)
> Violent crime with largest pop.-adj. 5-yr. increase: Murder (+57.7%)
The numbers of homicides and rapes reported for every 100,000 people in Jonesboro, Arkansas, each increased by over 50% between 2014 and 2019. The population-adjusted aggravated assault rate increased by 38.5% over the same period. All told, the 2019 violent crime rate in Jonesboro of 556 incidents per 100,000 people is 34.9% higher than it was five years earlier.
Higher levels of violent crime can reduce overall quality of life in an area and result in depressed real estate values. Over the five years from 2014 to 2019, the median home value in Jonesboro rose by 23.8%, well below the national increase of 32.7% over that time.
[in-text-ad-2]
Source: benkrut / Getty Images
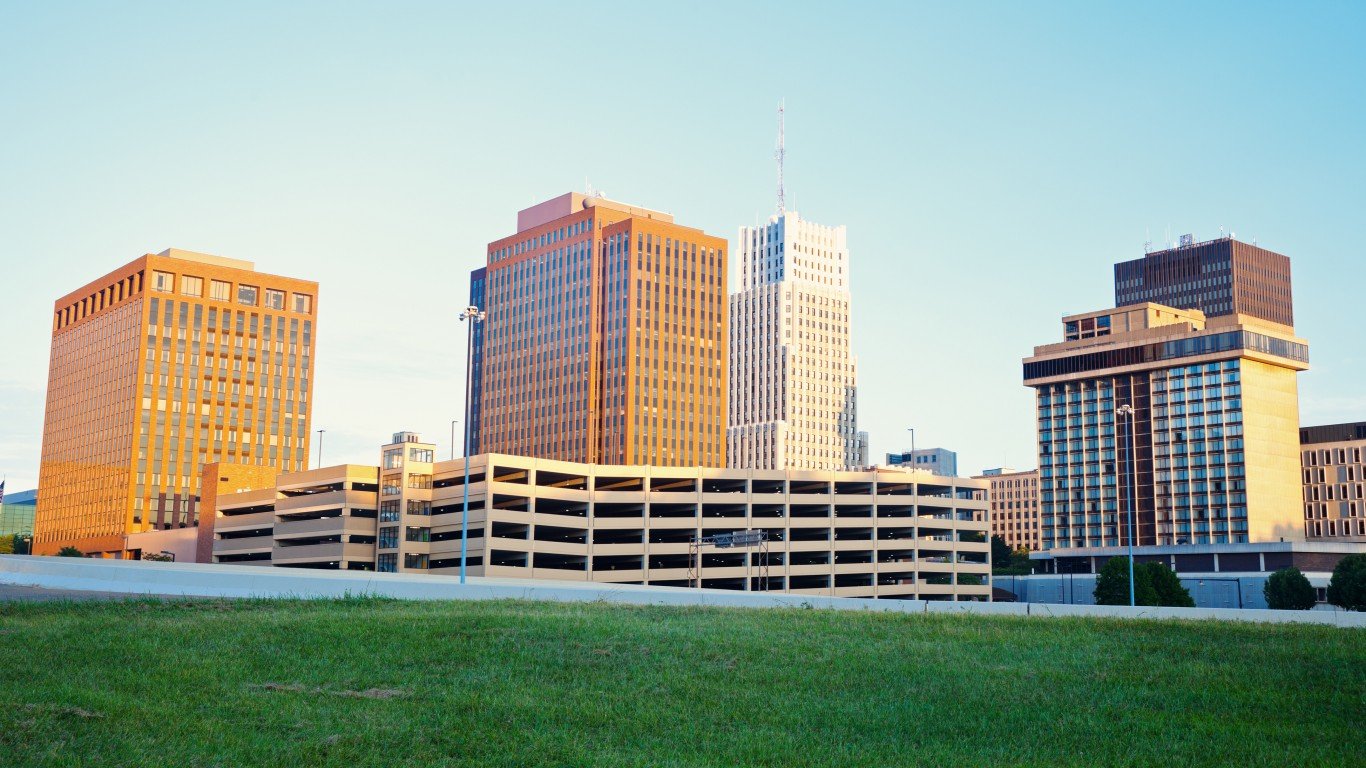
21. Akron, OH
> 5-yr. change in violent crime rate: +35.1%
> Violent crimes in 2019: 372 per 100,000 people (total: 2,616)
> Violent crimes in 2014: 275 per 100,000 people (total: 1,944)
> Violent crime with largest pop.-adj. 5-yr. increase: Aggravated assault (+75.4%)
Akron is the only metro area in Ohio — but one of many in the Midwest — to report near-nation leading increases in violent crime over the last five years of available data. The number of violent offenses reported in the city for every 100,000 people was 35.1% higher in 2019 than it was in 2014.
Despite the large increase, Akron is about as safe as the U.S. as a whole. The metro area violent crime rate of 372 per 100,000 is closely in line with the national rate of 367 per 100,000.

Source: Andrew Jameson / Wikimedia Commons
20. Bay City, MI
> 5-yr. change in violent crime rate: +38.3%
> Violent crimes in 2019: 384 per 100,000 people (total: 396)
> Violent crimes in 2014: 277 per 100,000 people (total: 296)
> Violent crime with largest pop.-adj. 5-yr. increase: Aggravated assault (+80.3%)
The 2014 violent crime rate in Bay City, Michigan, of 277 incidents per 100,000 people was well below the comparable national rate of 366 per 100,000. As of 2019, however, after a 38.3% increase in population-adjusted violent crime, driven primarily by a surge in cases of aggravated assault, the violent crime in Bay City stands at 384 per 100,000, slightly higher than the national rate of 367 per 100,000.
Crime can make any area less desirable as a place to live and result in stagnant or depressed property values. In Bay City, the median home value increased by just 4.1% between 2014 and 2019. Meanwhile, the typical American home increased by 32.7% from half a decade ago.
[in-text-ad]
Source: Edfallere / Wikimedia Commons
19. Albany-Lebanon, OR
> 5-yr. change in violent crime rate: +39.8%
> Violent crimes in 2019: 137 per 100,000 people (total: 175)
> Violent crimes in 2014: 98 per 100,000 people (total: 117)
> Violent crime with largest pop.-adj. 5-yr. increase: Murder (+88.0%)
The violent crime rate in the Albany-Lebanon, Oregon, metro area is 39.8% higher now than it was five years ago. Despite the increase, the metro area remains among the safest in the country. The local violent crime rate of 137 incidents per 100,000 people is less than half the comparable national rate of 367 per 100,000.
Of the four categories of offences classified as violent crimes, murder climbed the most in Albany-Lebanon. There were six cases of homicide reported in the metro area in 2019, up from three in 2014.
 24/7 Wall St.
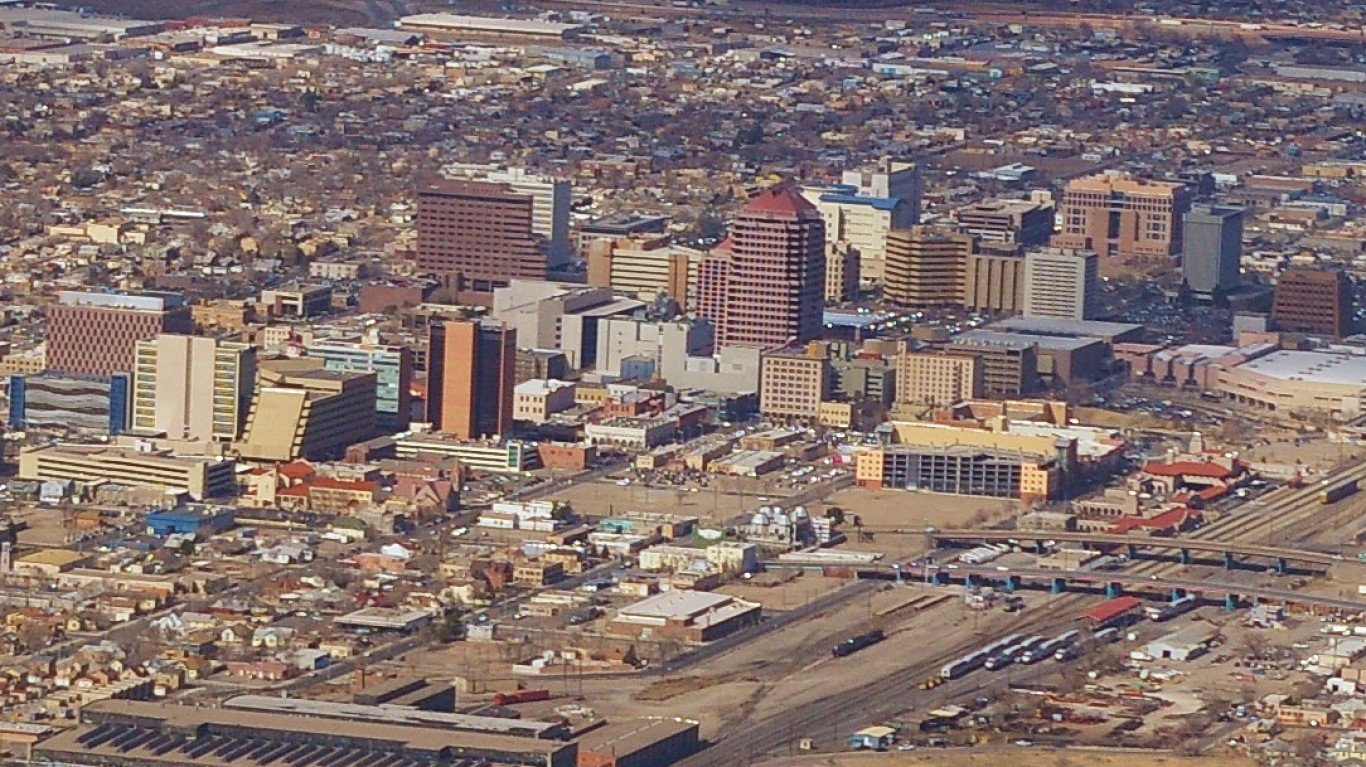
Source: Ron Reiring / Wikimedia Commons
18. Albuquerque, NM
> 5-yr. change in violent crime rate: +40.9%
> Violent crimes in 2019: 1,043 per 100,000 people (total: 9,580)
> Violent crimes in 2014: 740 per 100,000 people (total: 6,692)
> Violent crime with largest pop.-adj. 5-yr. increase: Murder (+110.4%)
Crime is a growing problem in Albuquerque, New Mexico. There were a total of 9,580 violent crimes reported in the city in 2019, or 1,043 for every 100,000 people — nearly triple the national violent crime rate of 367 incidents per 100,000 people.
Now one of the most dangerous metro areas in the country, Albuquerque’s violent crime rate is 40.9% higher than it was half a decade ago. Homicide had the largest population-adjusted increase among violent offences in Albuquerque. There were 10 murders for every 100,000 people in the metro area in 2019, up from 4.8 per 100,000 in 2014.
Source: yenwen / Getty Images
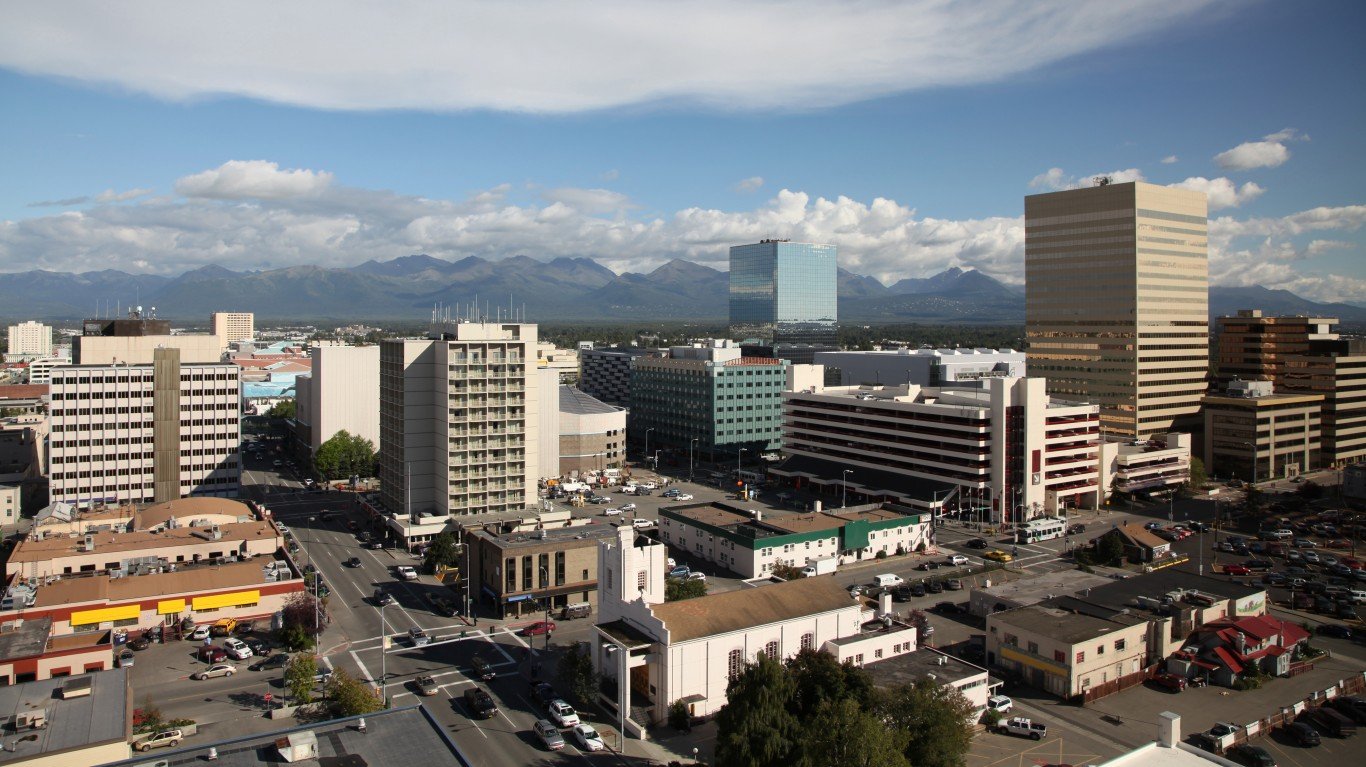
17. Anchorage, AK
> 5-yr. change in violent crime rate: +41.6%
> Violent crimes in 2019: 1,195 per 100,000 people (total: 3,657)
> Violent crimes in 2014: 844 per 100,000 people (total: 2,672)
> Violent crime with largest pop.-adj. 5-yr. increase: Murder (+170.7%)
Anchorage is one of only 18 U.S. metro areas to report a more than 40% increase in violent crime between 2014 and 2019. Not only does Anchorage have one of the fastest growing violent crime rates, it also has the highest. There were 1,195 violent crimes reported for every 100,000 people in the metro area in 2019, more than three times the national violent crime rate of 367 incidents for every 100,000 people.
No type of violent crime increased faster in Anchorage than homicide in the last five years. There were a total of 13 murders reported in the metro area in 2014. In 2019, there were 34. Many homicides committed locally that year were attributed to drug-related activity.
[in-text-ad-2]

Source: https://www.flickr.com/photos/roadgeek/
16. Altoona, PA
> 5-yr. change in violent crime rate: +43.0%
> Violent crimes in 2019: 333 per 100,000 people (total: 406)
> Violent crimes in 2014: 233 per 100,000 people (total: 294)
> Violent crime with largest pop.-adj. 5-yr. increase: Rape (+130.3%)
Altoona, Pennsylvania, reported a 43% increase in its population-adjusted violent crime rate between 2014 and 2019. There were 333 violent incidents in the city for every 100,000 people in 2019, up from 233 per 100,000 five years earlier.
Crime detracts from overall quality of life in any city, and the uptick in violence in the metro area may be driving some people away. Altoona’s population declined by 3.4% over the same five-year period, even as the U.S. population expanded by 2.9%.

Source: Spondylolithesis / Getty Images
15. Napa, CA
> 5-yr. change in violent crime rate: +44.5%
> Violent crimes in 2019: 543 per 100,000 people (total: 753)
> Violent crimes in 2014: 376 per 100,000 people (total: 534)
> Violent crime with largest pop.-adj. 5-yr. increase: Rape (+104.7%)
As recently as 2014, Napa, California, was about as dangerous as the U.S. as a whole. That year, there were 376 violent crimes reported for every 100,000 people, nearly in line with the national rate of 366 per 100,000. As of 2019, Napa has become far more dangerous than the U.S. as a whole. The metro area violent crime rate climbed 44.5% to 543 incidents per 100,000 in 2019, even as the national rate remained effectively unchanged.
Though there were fewer homicides in Napa in 2019 than in 2014, the number of reported rapes, robberies, and aggravated assaults in the metro area increased substantially.
[in-text-ad]
Source: DenisTangneyJr / Getty Images
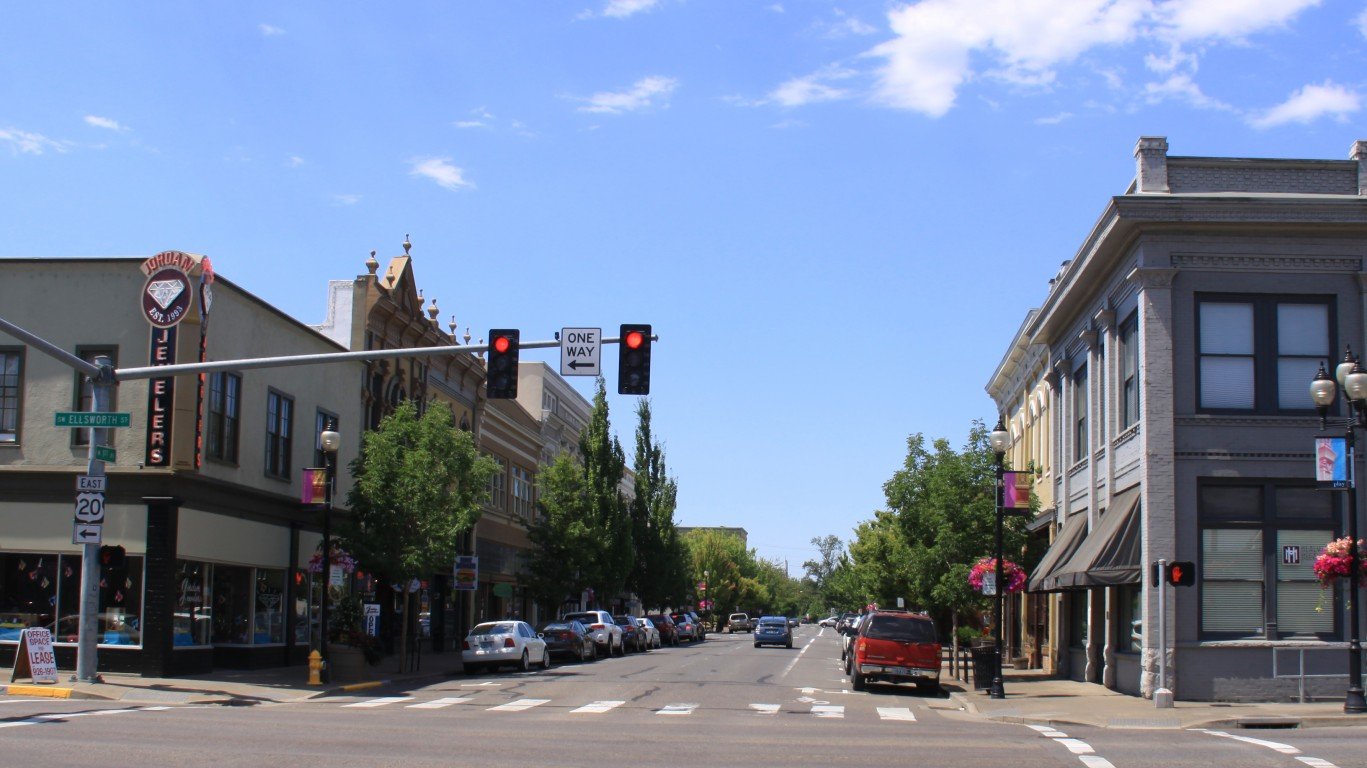
14. Brownsville-Harlingen, TX
> 5-yr. change in violent crime rate: +44.8%
> Violent crimes in 2019: 375 per 100,000 people (total: 1,588)
> Violent crimes in 2014: 259 per 100,000 people (total: 1,095)
> Violent crime with largest pop.-adj. 5-yr. increase: Aggravated assault (+63.0%)
In 2014, the violent crime rate in Brownsville-Harlingen, Texas, of 259 incidents per 100,000 people was well below the national violent crime rate that year of 366 per 100,000. As of 2019, Brownsville’s violent crime rate stood at 375 incidents per 100,000 people, in line with the comparable national rate, which is little changed from where it stood five years ago.
As is the case nationwide, aggravated assault is by far the most commonly committed violent crime in Brownsville. It also drove the overall increase in violence in the metro area, surging 63% from 162 incidents per 100,000 people in 2014 to 263 per 100,000 in 2019.
Source: aguilar3137 / Getty Images
13. Chico, CA
> 5-yr. change in violent crime rate: +46.6%
> Violent crimes in 2019: 444 per 100,000 people (total: 1,024)
> Violent crimes in 2014: 303 per 100,000 people (total: 678)
> Violent crime with largest pop.-adj. 5-yr. increase: Rape (+130.1%)
Just five years ago, violent crime was less common in Chico, California, than it was nationwide. Now, it is considerably more common. The violent crime rate in the northern California metro area climbed from 303 incidents per 100,000 people in 2014 to 444 per 100,000 in 2019, a 46.6% surge.
While violent crime is now more common in Chico than it was half a decade ago, property crime in the metro area has become less common. There were 2,306 incidents of property crime, like burglary and motor vehicle theft, for every 100,000 people in the city in 2019, a 22.1% decline from 2,962 per 100,000 in 2014.

Source: benedek / Getty Images
12. State College, PA
> 5-yr. change in violent crime rate: +49.8%
> Violent crimes in 2019: 122 per 100,000 people (total: 200)
> Violent crimes in 2014: 82 per 100,000 people (total: 127)
> Violent crime with largest pop.-adj. 5-yr. increase: Rape (+141.0%)
State College, Pennsylvania, reported a near 50% increase in violent crime from 2014 to 2019. Despite the increase, the metro area remains among the safest in the country. The current violent crime rate in the area of 122 incidents per 100,000 people annually is just a third of the national violent crime rate of 367 per 100,000.
While violent crime is now more common in State College than it was half a decade ago, property crime in the metro area has become less common. There were 896 incidents of property crime, like burglary and motor vehicle theft, for every 100,000 people in the city in 2019, down 24.3% from 1,184 per 100,000 in 2014.
[in-text-ad-2]
Source: Sean Pavone / Getty Images
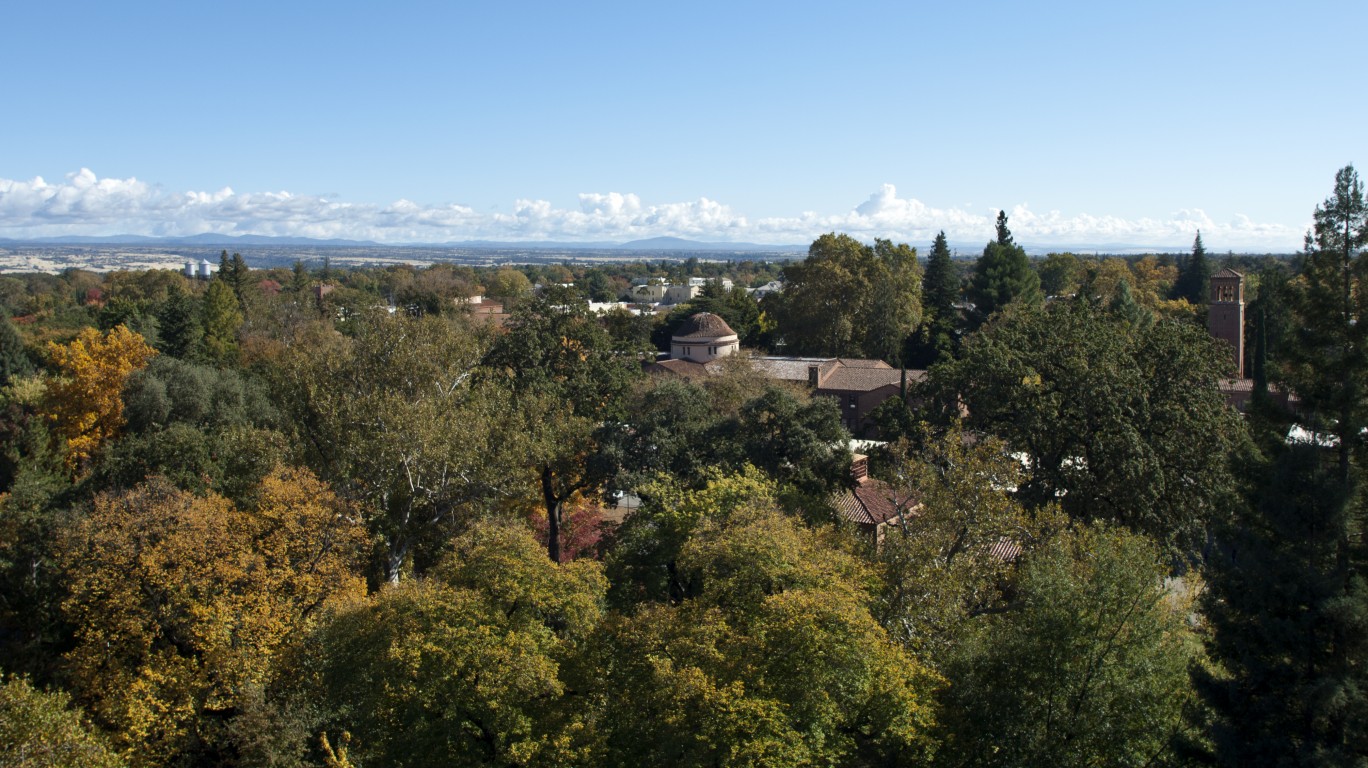
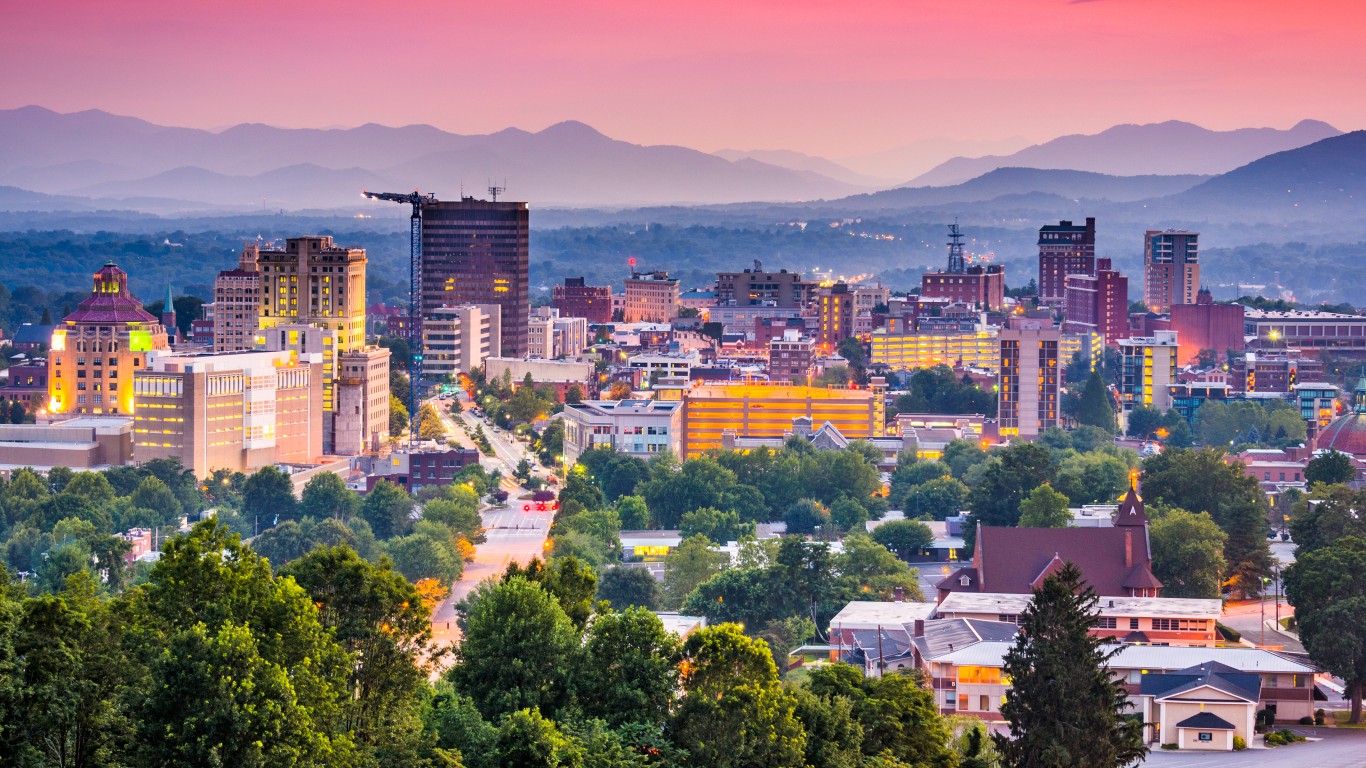
11. Asheville, NC
> 5-yr. change in violent crime rate: +53.7%
> Violent crimes in 2019: 316 per 100,000 people (total: 1,466)
> Violent crimes in 2014: 206 per 100,000 people (total: 908)
> Violent crime with largest pop.-adj. 5-yr. increase: Aggravated assault (+84.3%)
Asheville, North Carolina, is one of only 11 metro areas to report a 50% or greater increase in violent crime in the last five years. There were 316 violent crimes reported for every 100,000 people in the metro area in 2019, up 53.7% from 206 per 100,000 in 2014. Despite the increase, violent crime is still less common in the metro area than it is nationwide, where the violent crime rate stands at 367 per 100,000.
As is the case nationwide, aggravated assault is by far the most commonly committed violent crime in Asheville. It also drove the overall increase in violence in the metro area, surging 84.3% from 125 incidents per 100,000 people in 2014 to 230 per 100,000 in 2019.
 by Ken Lund")
10. Houma-Thibodaux, LA
> 5-yr. change in violent crime rate: +54.6%
> Violent crimes in 2019: 375 per 100,000 people (total: 779)
> Violent crimes in 2014: 242 per 100,000 people (total: 510)
> Violent crime with largest pop.-adj. 5-yr. increase: Rape (+194.7%)
Houma-Thibodaux is the only metro area in Louisiana to report a double digit increase in the population-adjusted violent crime rate between 2014 and 2019. The 2014 violent crime rate in the metro area, of 242 incidents per 100,000 people, was well below the national rate of 366 per 100,000 that year. As of 2019, however, after surging by 54.6%, the local violent crime rate stands at 375 per 100,000, nearly in line with the national rate of 367 per 100,000.
Though the number of reported robberies in the metro area fell during that five-year period, aggravated assaults jumped by 85.5%, homicides spiked by 123.3%, and the number of reported rapes increased by nearly 200%.
[in-text-ad]
Source: Public Domain / Wikimedia Commons
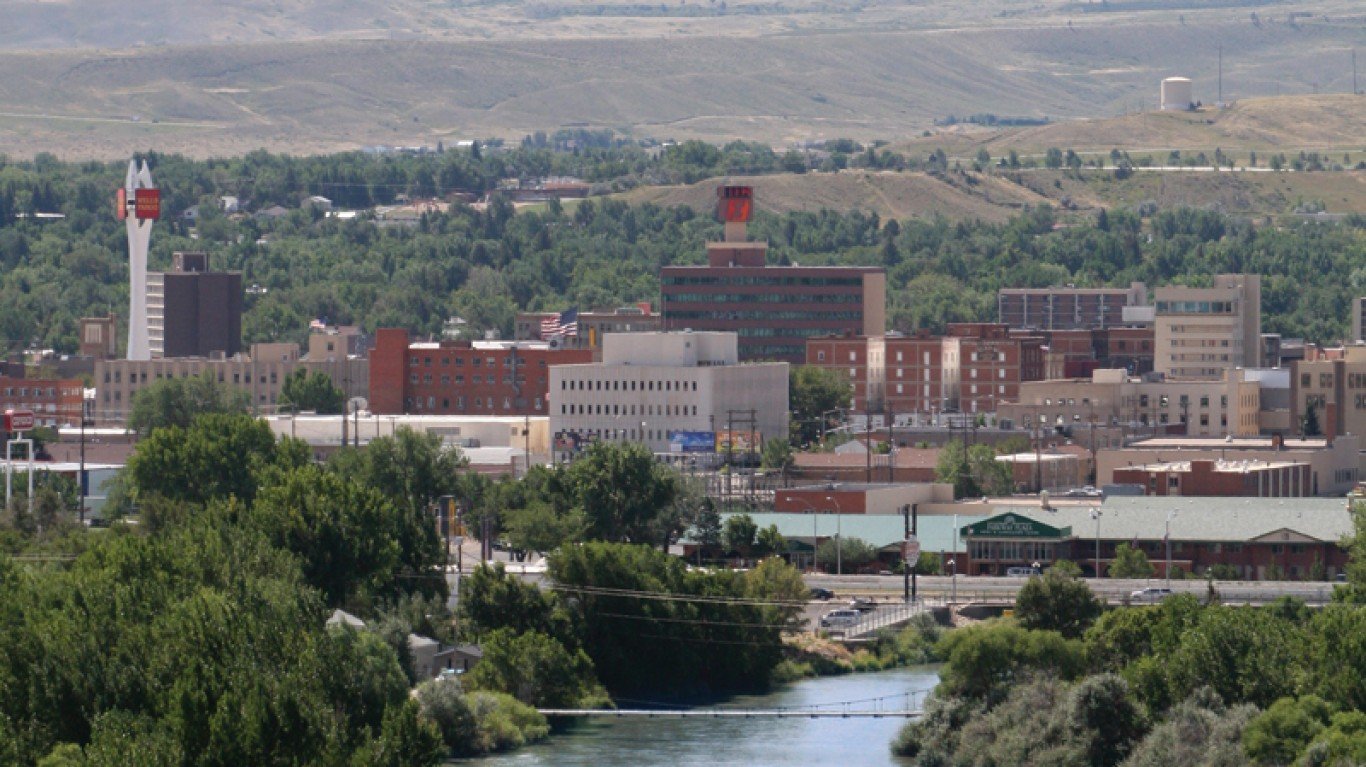
9. Casper, WY
> 5-yr. change in violent crime rate: +55.0%
> Violent crimes in 2019: 286 per 100,000 people (total: 227)
> Violent crimes in 2014: 184 per 100,000 people (total: 151)
> Violent crime with largest pop.-adj. 5-yr. increase: Rape (+268.5%)
Driven by a 268.5% increase in reported rapes per 100,000 people and a near 100% surge in reported robberies, the Casper, Wyoming, metro area reported a near-nation leading 55% increase in violent crime in the last five years. There were 286 reported violent crimes for every 100,000 people in the metro area in 2019, compared to just 184 per 100,000 in 2014.
Increasing crime rates can push people away from areas and result in stagnant real estate values. The number of people living in Casper has fallen by 3% in the last five years, and the typical area home appreciated in value by only 9.1% over the same period. Meanwhile, the U.S. population grew by 2.9%, and the national median home value climbed by 32.7% over the last half decade.
Source: DenisTangneyJr / iStock via Getty Images
8. Florence, SC
> 5-yr. change in violent crime rate: +57.8%
> Violent crimes in 2019: 823 per 100,000 people (total: 1,688)
> Violent crimes in 2014: 522 per 100,000 people (total: 1,082)
> Violent crime with largest pop.-adj. 5-yr. increase: Murder (+213.2%)
Florence is the only South Carolina metro area, and one of only 11 U.S. metro areas to report a more than 50% increase in violent crime between 2014 and 2019. Not only does Florence have one of the fastest growing violent crime rates, it also has one of the highest. There were 823 violent crimes reported for every 100,000 people in the metro area in 2019, more than double the national violent crime rate of 367 incidents for every 100,000 people.
No type of violent crime increased more in Florence than homicide in the last five years. There were a total of 11 murders reported in the metro area in 2014. In 2019, there were 34. Some murders were attributed to drug trafficking and others to domestic disputes. Gang activity also appears to be driving the increase in violent crime.
Source: Daniel Schwen / Wikimedia Commons
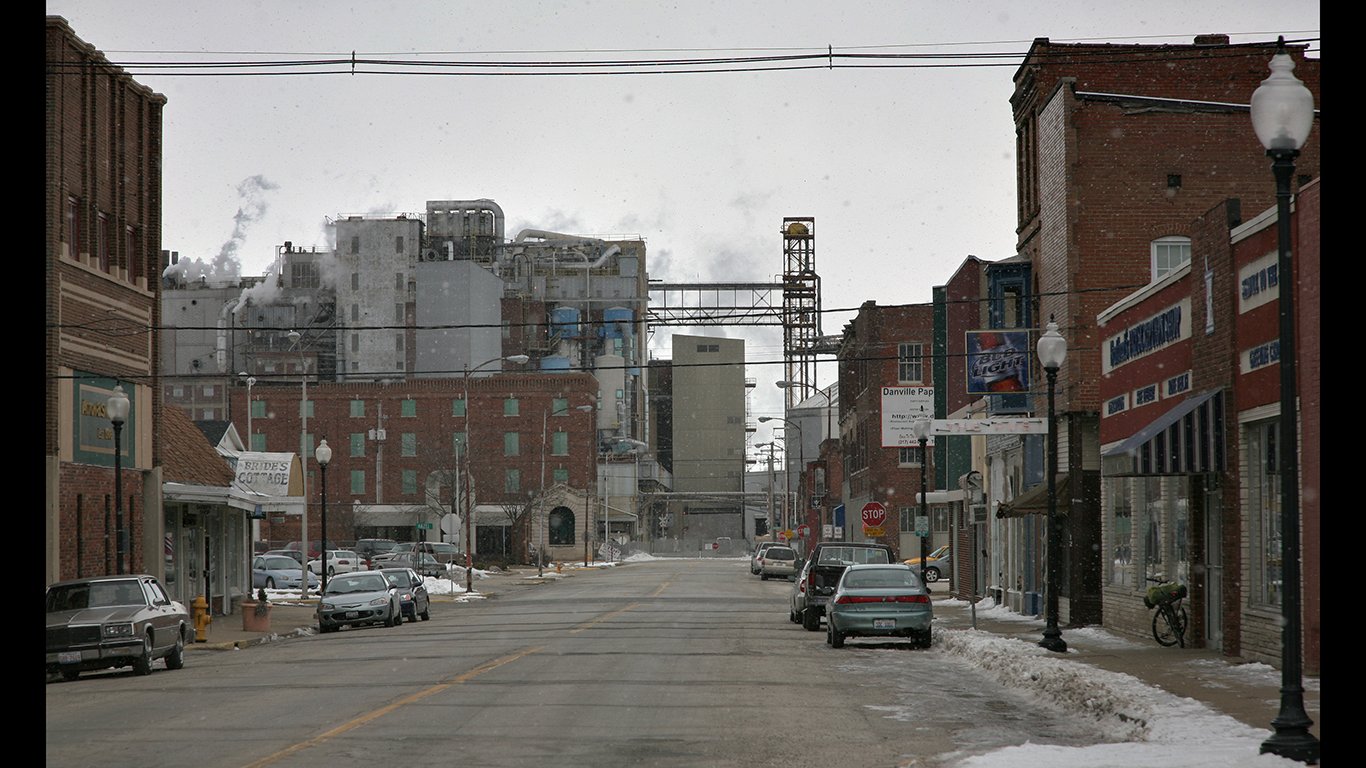
7. Danville, IL
> 5-yr. change in violent crime rate: +58.1%
> Violent crimes in 2019: 936 per 100,000 people (total: 710)
> Violent crimes in 2014: 592 per 100,000 people (total: 473)
> Violent crime with largest pop.-adj. 5-yr. increase: Murder (+607.7%)
Danville, Illinois, reported a 58.1% increase in its population-adjusted violent crime rate between 2014 and 2019, the seventh largest among U.S. metro areas. The local violent crime rate now stands at 936 incidents per 100,000 people, well more than double the comparable national violent crime rate.
Danville also reported a larger increase in its population-adjusted homicide rate over the last five years than any other U.S. metro area. There were 9.2 murders committed for every 100,000 people in the metro area in 2019, up 608% from the local 2014 murder rate of 1.3 per 100,000.
[in-text-ad-2]

Source: DenisTangneyJr / Getty Images
6. Racine, WI
> 5-yr. change in violent crime rate: +59.8%
> Violent crimes in 2019: 318 per 100,000 people (total: 625)
> Violent crimes in 2014: 199 per 100,000 people (total: 388)
> Violent crime with largest pop.-adj. 5-yr. increase: Aggravated assault (+199.0%)
Racine, Wisconsin’s violent crime rate of 318 incidents per 100,000 people is nearly 60% higher than it was five years earlier. The increase was driven by a surge in cases of aggravated assault. Despite the uptick in violence, Racine remains safer than the U.S. as a whole, where the violent crime rate stands at 367 incidents per 100,000 people.
Though violent crime is now more common in Racine than it was half a decade ago, property crime in the metro area has become less common. There were 1,426 incidents of property crime, like burglary and motor vehicle theft, for every 100,000 people in the city in 2019, down 37.4% from 2,279 per 100,000 in 2014.
Source: Thieded / Wikimedia Commons
5. Eau Claire, WI
> 5-yr. change in violent crime rate: +63.3%
> Violent crimes in 2019: 214 per 100,000 people (total: 363)
> Violent crimes in 2014: 131 per 100,000 people (total: 217)
> Violent crime with largest pop.-adj. 5-yr. increase: Murder (+400.0%)
The violent crime rate climbed by 63.3% from 2014 to 2019 in Eau Claire, Wisconsin, the second largest increase of any Midwestern metro area and fifth largest nationwide. Though the local violent crime rate of 214 incidents per 100,000 is considerably higher than it was half a decade ago, it remains well below the national violent crime rate of 367 per 100,000.
Often, an uptick in the overall violent crime rate can occur even as specific types of violent crime become less common. In Eau Claire, however, all major types of violent crime became more common in the last five years. Rates of robbery and aggravated assault each climbed by over 30%, while the number of rapes reported per 100,000 people surged 156%, and the murder rate spiked by 400%.
[in-text-ad]
Source: Kruck20 / Getty Images
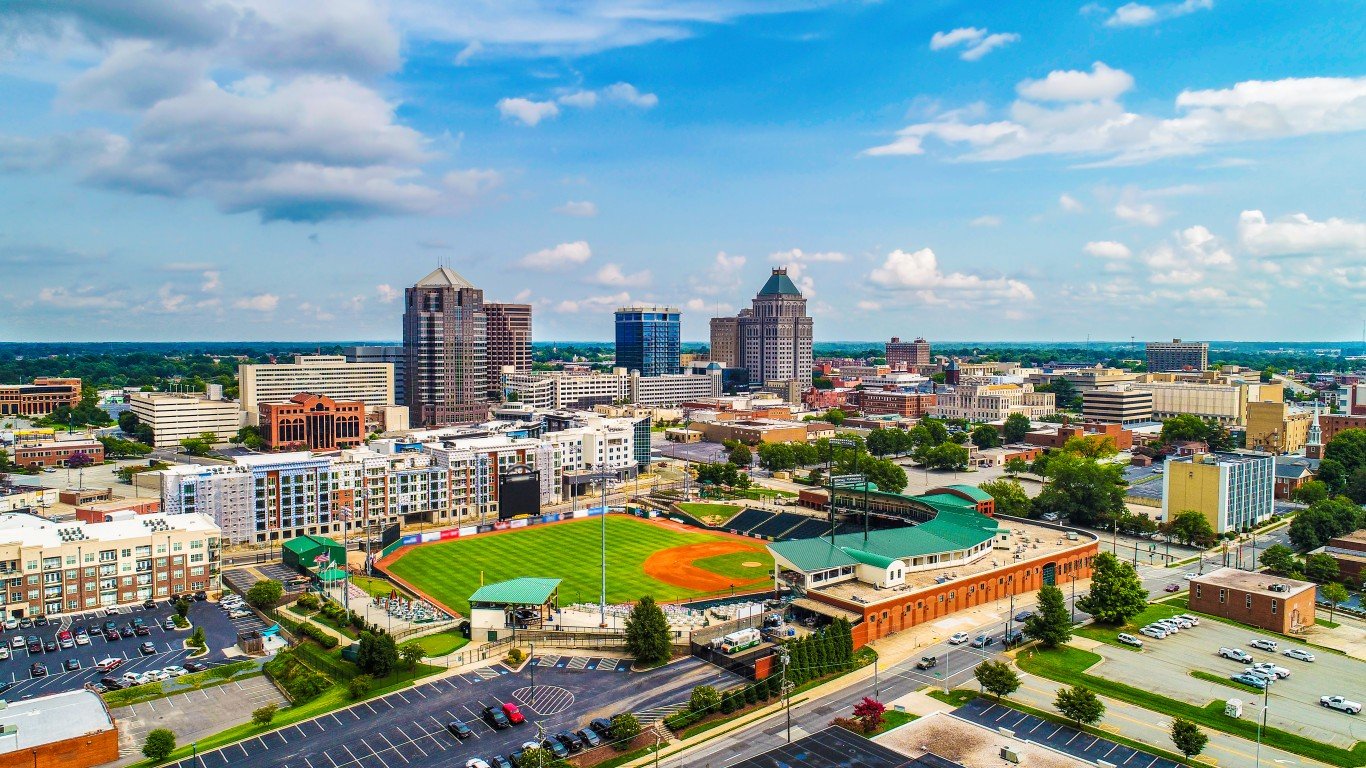
4. Greensboro-High Point, NC
> 5-yr. change in violent crime rate: +65.2%
> Violent crimes in 2019: 530 per 100,000 people (total: 4,098)
> Violent crimes in 2014: 321 per 100,000 people (total: 2,396)
> Violent crime with largest pop.-adj. 5-yr. increase: Rape (+132.4%)
The Greensboro-High Point, North Carolina, metro area reported a 65.2% jump in its population-adjusted violent crime rate over the last five years, more than any other metro area in the South.
Though just five years ago violent crime was less common in the metro area than it was nationwide, it is now considerably more common. The violent crime rate in the metro area climbed from 321 incidents per 100,000 people in 2014 to 530 per 100,000 in 2019. Nationwide, the violent crime rate is effectively unchanged at 367 per 100,000 people.
Source: traveler1116 / iStock via Getty Images
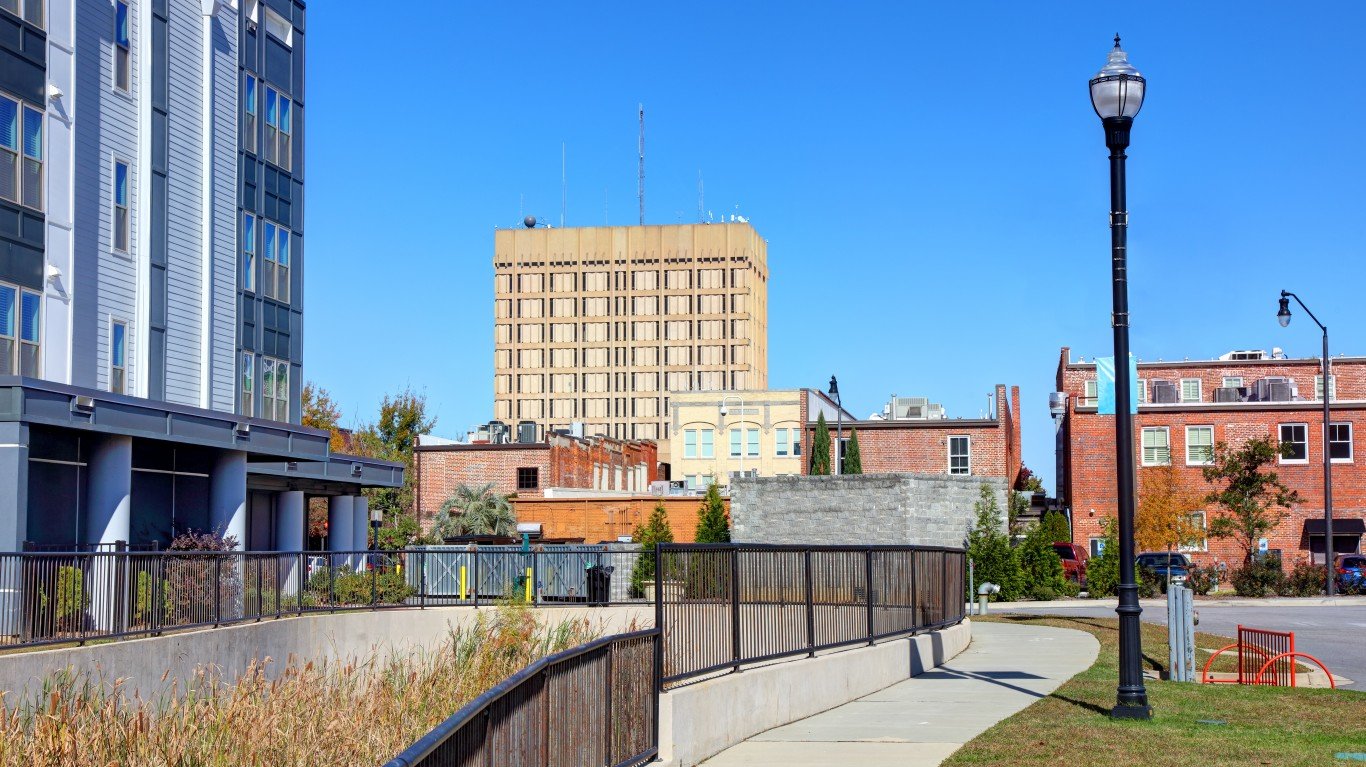
3. Scranton – Wilkes-Barre, PA
> 5-yr. change in violent crime rate: +77.0%
> Violent crimes in 2019: 401 per 100,000 people (total: 2,220)
> Violent crimes in 2014: 227 per 100,000 people (total: 1,272)
> Violent crime with largest pop.-adj. 5-yr. increase: Aggravated assault (+133.5%)
The Scranton metro area in northeastern Pennsylvania reported a 77% increase in violent crime between 2014 and 2019. The increase was driven in large part by a 133.5% increase in the number of aggravated assaults for every 100,000 people. The annual violent crime rate in the Scranton area stands at 401 incidents per 100,000 people, above the 367 per 100,00 national rate.
Though violent crime is now more common in Scranton than it was half a decade ago, property crime in the metro area has become less common. There were 1,260 incidents of property crime, like burglary and motor vehicle theft, for every 100,000 people in the city in 2019, down 38.5% from 2,048 per 100,000 in 2014.
Source: renal / Getty Images
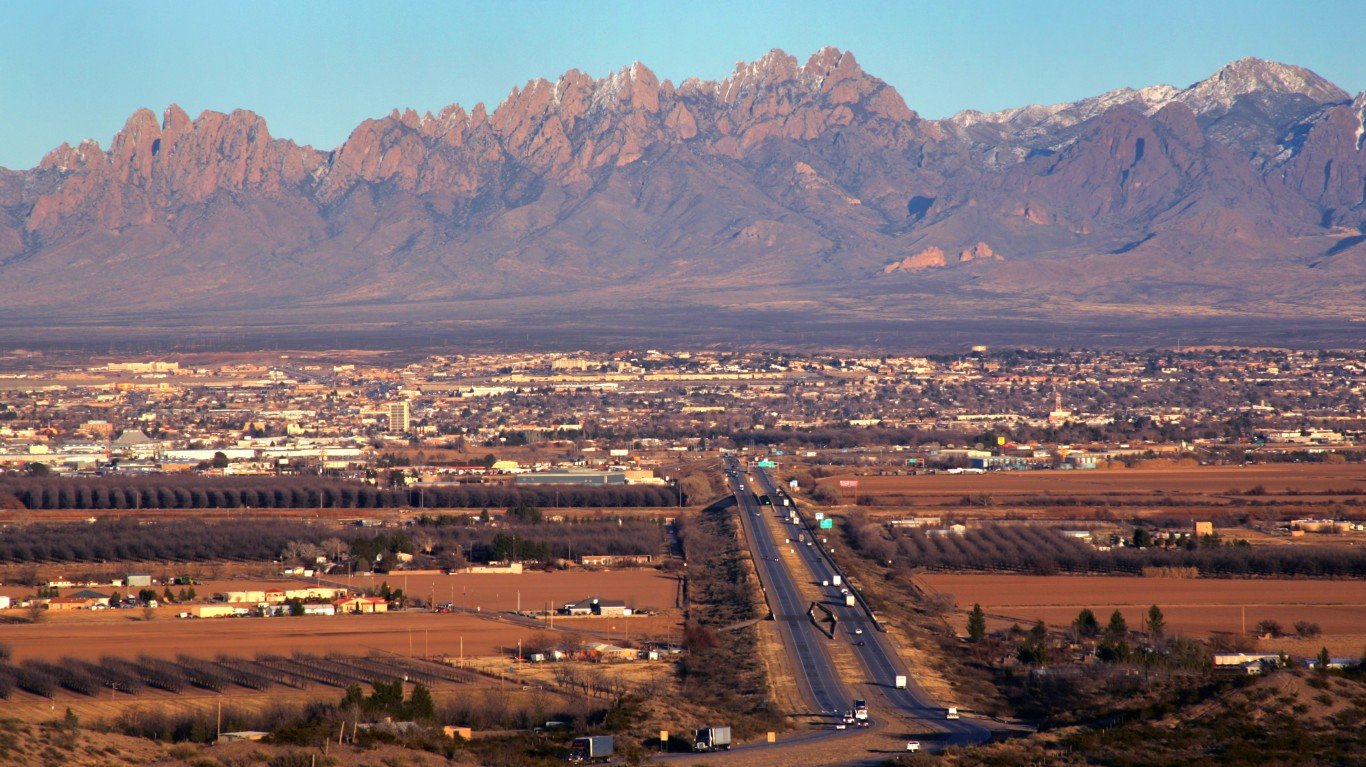
2. Las Cruces, NM
> 5-yr. change in violent crime rate: +94.9%
> Violent crimes in 2019: 557 per 100,000 people (total: 1,215)
> Violent crimes in 2014: 286 per 100,000 people (total: 611)
> Violent crime with largest pop.-adj. 5-yr. increase: Aggravated assault (+151.2%)
The 2019 violent crime rate in Las Cruces, New Mexico, is nearly double what it was five years earlier. Driven by a surge in cases of aggravated assault and an increase in homicides, the metro area’s annual violent crime rate stands at 557 incidents per 100,000, compared to 286 per 100,000 in 2014.
Murders committed in the city in 2019, as well as many other felonies, were drug related, according to local officials. The city, located in southern New Mexico near Mexico, has been inundated in recent years by illegal drugs from south of the border.
[in-text-ad-2]
Source: Public Domain / Wikimedia Commons
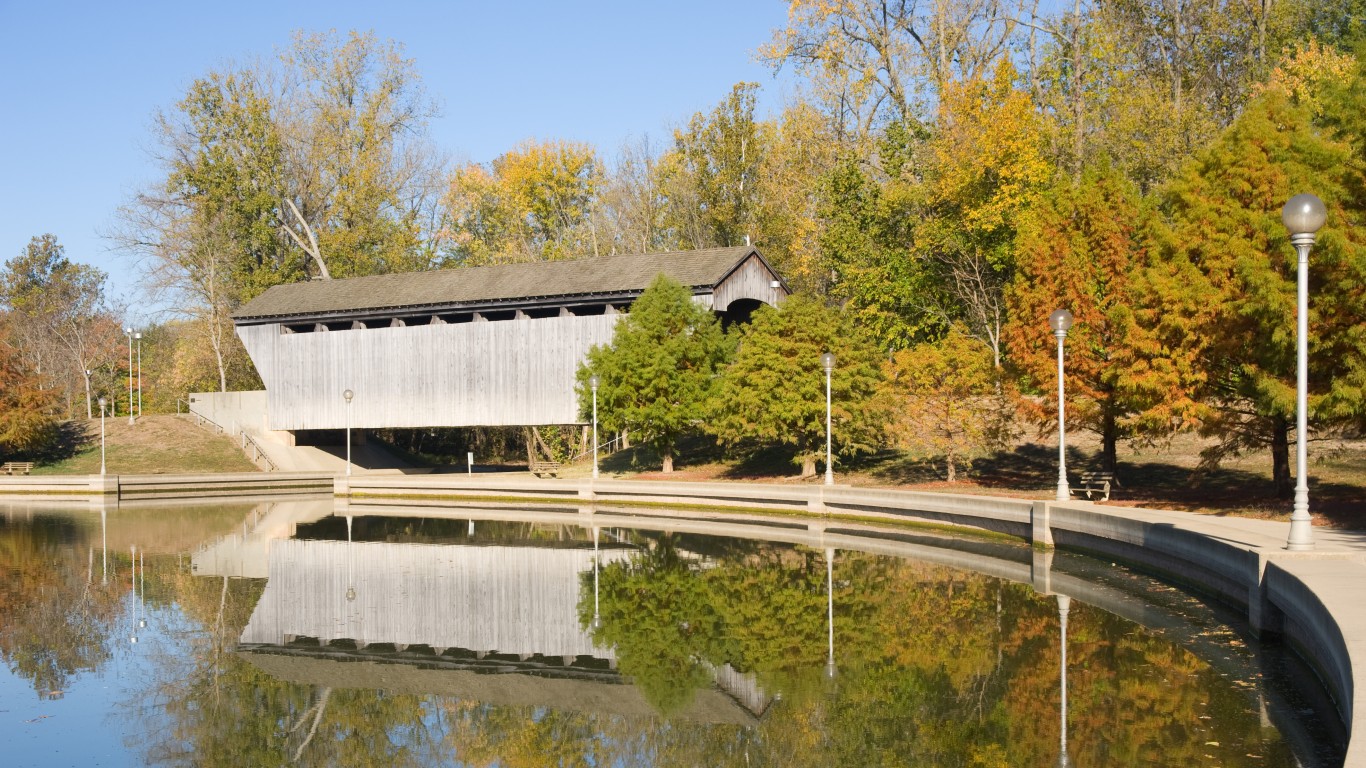
1. Kokomo, IN
> 5-yr. change in violent crime rate: +144.6%
> Violent crimes in 2019: 555 per 100,000 people (total: 458)
> Violent crimes in 2014: 227 per 100,000 people (total: 188)
> Violent crime with largest pop.-adj. 5-yr. increase: Aggravated assault (+221.2%)
Kokomo, Indiana reported a 144.6% increase in violent crime between 2014 and 2019, according to FBI data. As is often the case in areas with rising rates of violence, aggravated assault was the primary driver of the increase, as the population-adjusted number of cases surged by 221.2%. The annual violent crime rate in the Kokomo area stands at 555 incidents per 100,000 people, well above the 367 per 100,00 national rate.
According to local law enforcement officials, the nation-leading spike in the violent crime rate is not necessarily attributable to a surge in crime. In 2015, Kokomo switched to a new reporting system that broadened the types of crime classified as aggravated assaults. However, homicides, rapes, and robberies have also each increased in the metro area far more than they have nationwide since 2014 .
Methodology
To determine the cities where crime is soaring, 24/7 Wall St. reviewed data from the FBI’s Uniform Crime Report. We ranked cities based on the percentage increase in violent crimes — which include murder, rape, robbery, and aggravated assault — per 100,000 residents from 2014 to 2019. Data on population also came from the FBI. Supplemental data on poverty came from the U.S. Census Bureau’s 2019 American Community Survey. Data on unemployment came from the Bureau of Labor Statistics.
Sponsored: Want to Retire Early? Here’s a Great First Step
Want retirement to come a few years earlier than you’d planned? Or are you ready to retire now, but want an extra set of eyes on your finances?
Now you can speak with up to 3 financial experts in your area for FREE. By simply clicking here you can begin to match with financial professionals who can help you build your plan to retire early. And the best part? The first conversation with them is free.
Click here to match with up to 3 financial pros who would be excited to help you make financial decisions.
Thank you for reading! Have some feedback for us?
Contact the 24/7 Wall St. editorial team.
Editors' Picks