
Vaccine distribution is well underway across the United States. Still, the novel coronavirus continues to spread and claim American lives. In the past week alone, there were an average of 1,177 new deaths attributed to the virus every day.
Since the first COVID-19-related death was reported in the United States on Feb. 29, 2020, there have been a total of 545,022 COVID-19 deaths nationwide, equal to about 167 for every 100,000 Americans.
Of course, deaths attributable to the virus are not evenly spread across the country. While there are still counties and county equivalents that have not reported a single COVID-19 death, nearly every state has at least one county where the number of deaths attributable to the virus per capita exceeds the national rate — sometimes by orders of magnitude. There are 17 states home to at least one county where COVID-19 deaths per capita are at least three times higher than they are nationwide. In one county in South Dakota, there have been a total of 789 coronavirus deaths for every 100,000 people.
Counties and county equivalents where COVID-19 deaths are highly concentrated are often home to larger populations of individuals at increased risk of severe illness if they are infected. One such group is retirement-age Americans. Americans 65 and older are at least 90 times more likely to die from the virus, if infected, than those in the 18 to 29 age range. The vast majority of the places on this list are home to a larger concentration of 65 and older residents than the state as a whole.
In addition to more vulnerable populations, the places on this list also tend to have a higher than average per capita COVID-19 cases. In 40 states, the county or county equivalent with the most COVID-19 deaths per 100,000 also has a higher number of confirmed cases per 100,000 than the state as a whole.
All COVID-19 data used in this story are current as of March 31, 2021.

Source: Jacqueline Nix / iStock Editorial via Getty Images
Alabama: Lowndes County
> COVID-19 deaths in Lowndes: 518 per 100,000 people (total: 53)
> COVID-19 deaths in Alabama: 215 per 100,000 people (total: 10,526)
> COVID-19 cases in Lowndes: 13,277 per 100,000 people (total: 1,359)
> COVID-19 cases in Alabama: 10,528 per 100,000 people (total: 514,619)
> 65 and older population: 18.4% in Lowndes, 16.5% in Alabama

Source: Mitchell Forbes / iStock via Getty Images
Alaska: Bethel Census Area
> COVID-19 deaths in Bethel: 111 per 100,000 people (total: 20)
> COVID-19 deaths in Alaska: 42 per 100,000 people (total: 309)
> COVID-19 cases in Bethel: 20,798 per 100,000 people (total: 3,752)
> COVID-19 cases in Alaska: 8,097 per 100,000 people (total: 59,710)
> 65 and older population: 7.2% in Bethel, 11.2% in Alaska
These are all the counties in Alaska where COVID-19 is slowing (and where it’s still getting worse).

Source: CampPhoto / Getty Images
Arizona: Apache County
> COVID-19 deaths in Apache: 577 per 100,000 people (total: 413)
> COVID-19 deaths in Arizona: 236 per 100,000 people (total: 16,918)
> COVID-19 cases in Apache: 15,102 per 100,000 people (total: 10,801)
> COVID-19 cases in Arizona: 11,720 per 100,000 people (total: 840,492)
> 65 and older population: 15.0% in Apache, 17.1% in Arizona

Source: BOB WESTON / iStock via Getty Images
Arkansas: Fulton County
> COVID-19 deaths in Fulton: 387 per 100,000 people (total: 47)
> COVID-19 deaths in Arkansas: 186 per 100,000 people (total: 5,601)
> COVID-19 cases in Fulton: 9,053 per 100,000 people (total: 1,099)
> COVID-19 cases in Arkansas: 10,950 per 100,000 people (total: 330,008)
> 65 and older population: 25.5% in Fulton, 16.6% in Arkansas

Source: santalechuga / iStock via Getty Images
California: Imperial County
> COVID-19 deaths in Imperial: 397 per 100,000 people (total: 715)
> COVID-19 deaths in California: 146 per 100,000 people (total: 57,778)
> COVID-19 cases in Imperial: 15,218 per 100,000 people (total: 27,426)
> COVID-19 cases in California: 9,011 per 100,000 people (total: 3,564,468)
> 65 and older population: 12.6% in Imperial, 14.0% in California

Source: denverjeffrey / Flickr
Colorado: Bent County
> COVID-19 deaths in Bent: 362 per 100,000 people (total: 21)
> COVID-19 deaths in Colorado: 107 per 100,000 people (total: 6,092)
> COVID-19 cases in Bent: 25,529 per 100,000 people (total: 1,483)
> COVID-19 cases in Colorado: 8,065 per 100,000 people (total: 459,361)
> 65 and older population: 17.9% in Bent, 13.8% in Colorado

Source: DenisTangneyJr / Getty Images
Connecticut: Hartford County
> COVID-19 deaths in Hartford: 262 per 100,000 people (total: 2,345)
> COVID-19 deaths in Connecticut: 221 per 100,000 people (total: 7,883)
> COVID-19 cases in Hartford: 8,415 per 100,000 people (total: 75,294)
> COVID-19 cases in Connecticut: 8,633 per 100,000 people (total: 308,439)
> 65 and older population: 16.8% in Hartford, 16.8% in Connecticut

Source: aimintang / Getty Images
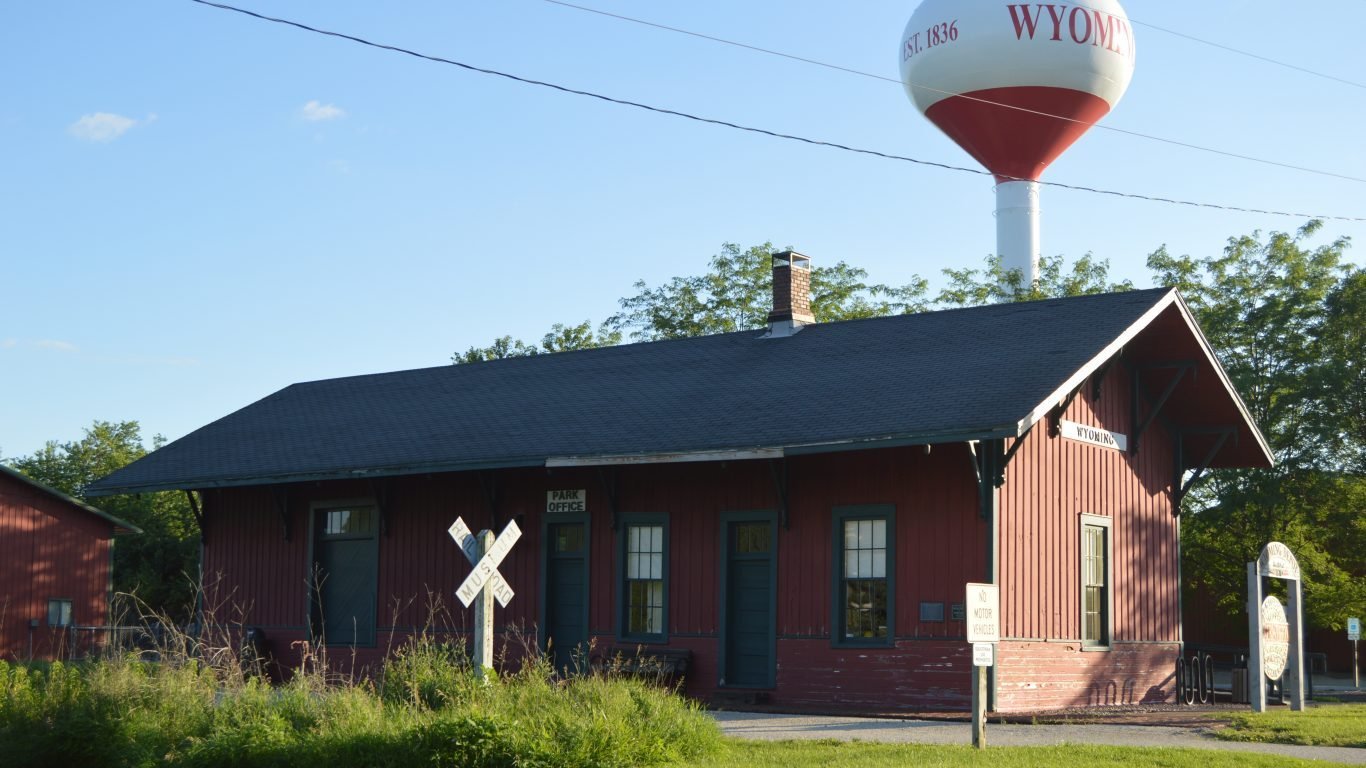
Delaware: Sussex County
> COVID-19 deaths in Sussex: 207 per 100,000 people (total: 455)
> COVID-19 deaths in Delaware: 160 per 100,000 people (total: 1,552)
> COVID-19 cases in Sussex: 10,791 per 100,000 people (total: 23,691)
> COVID-19 cases in Delaware: 9,761 per 100,000 people (total: 94,402)
> 65 and older population: 27.0% in Sussex, 18.2% in Delaware
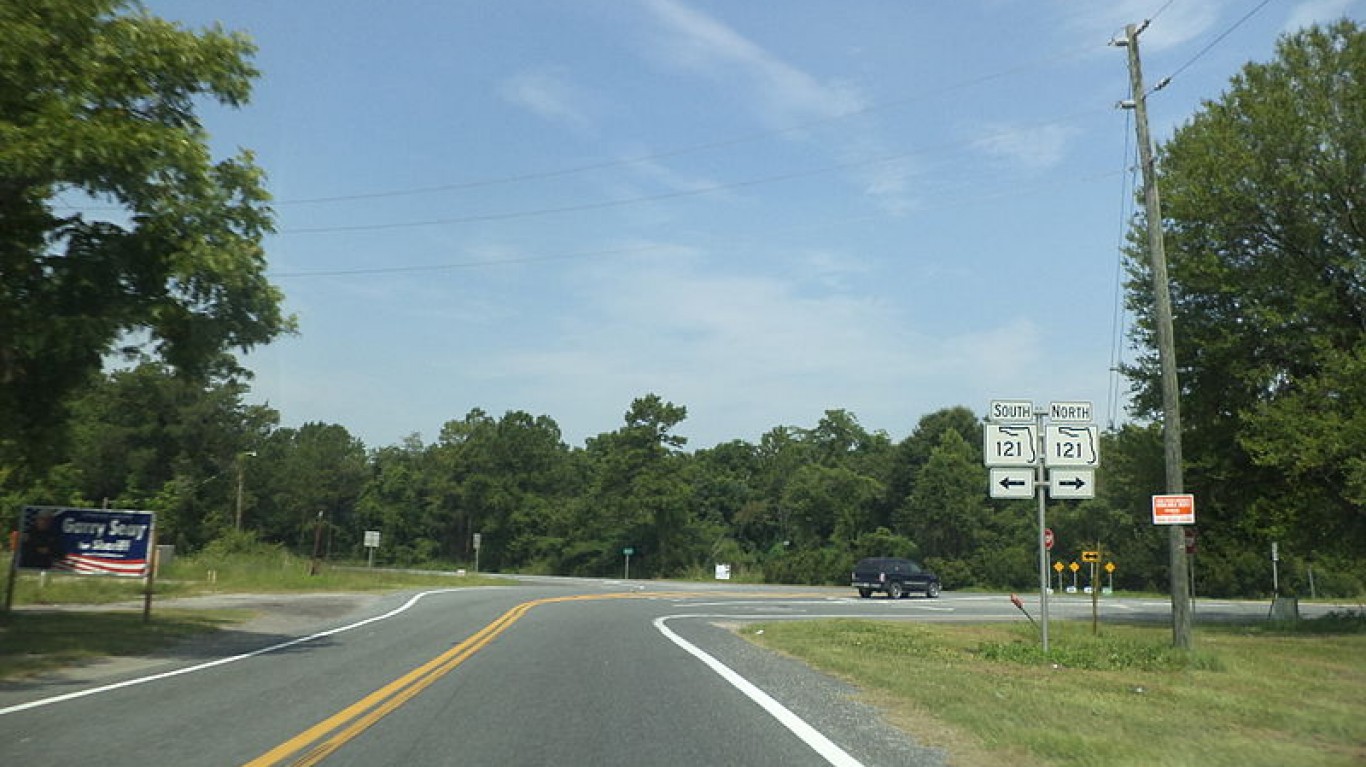
Source: Michael Rivera / Wikimedia Commons
Florida: Union County
> COVID-19 deaths in Union: 459 per 100,000 people (total: 70)
> COVID-19 deaths in Florida: 156 per 100,000 people (total: 33,247)
> COVID-19 cases in Union: 11,628 per 100,000 people (total: 1,772)
> COVID-19 cases in Florida: 9,434 per 100,000 people (total: 2,009,408)
> 65 and older population: 15.0% in Union, 20.1% in Florida

Source: BOB WESTON / iStock via Getty Images
Georgia: Hancock County
> COVID-19 deaths in Hancock: 703 per 100,000 people (total: 60)
> COVID-19 deaths in Georgia: 180 per 100,000 people (total: 18,962)
> COVID-19 cases in Hancock: 10,498 per 100,000 people (total: 896)
> COVID-19 cases in Georgia: 10,043 per 100,000 people (total: 1,056,421)
> 65 and older population: 22.4% in Hancock, 13.5% in Georgia

Source: sorincolac / iStock
Hawaii: Honolulu County
> COVID-19 deaths in Honolulu: 37 per 100,000 people (total: 365)
> COVID-19 deaths in Hawaii: 32 per 100,000 people (total: 459)
> COVID-19 cases in Honolulu: 2,367 per 100,000 people (total: 23,376)
> COVID-19 cases in Hawaii: 2,005 per 100,000 people (total: 28,483)
> 65 and older population: 17.3% in Honolulu, 17.8% in Hawaii
These are all the counties in Hawaii where COVID-19 is slowing (and where it’s still getting worse).

Source: csfotoimages / iStock Editorial via Getty Images
Idaho: Shoshone County
> COVID-19 deaths in Shoshone: 271 per 100,000 people (total: 34)
> COVID-19 deaths in Idaho: 112 per 100,000 people (total: 1,957)
> COVID-19 cases in Shoshone: 8,351 per 100,000 people (total: 1,046)
> COVID-19 cases in Idaho: 10,248 per 100,000 people (total: 179,763)
> 65 and older population: 22.3% in Shoshone, 15.4% in Idaho
These are all the counties in Idaho where COVID-19 is slowing (and where it’s still getting worse).
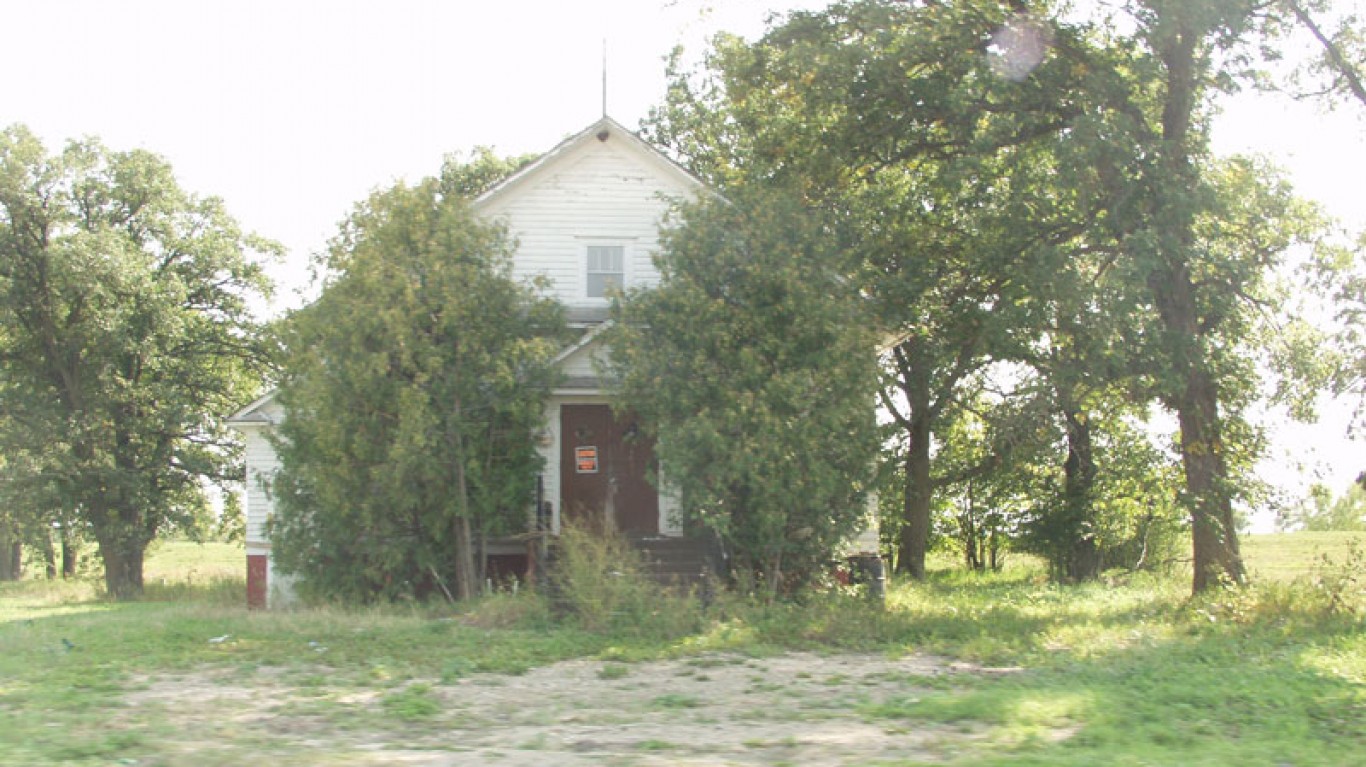
Source: Nyttend / Wikimedia Commons
Illinois: Stark County
> COVID-19 deaths in Stark: 418 per 100,000 people (total: 23)
> COVID-19 deaths in Illinois: 185 per 100,000 people (total: 23,527)
> COVID-19 cases in Stark: 10,073 per 100,000 people (total: 554)
> COVID-19 cases in Illinois: 9,729 per 100,000 people (total: 1,239,589)
> 65 and older population: 21.9% in Stark, 15.2% in Illinois

Source: Chris Light / Wikimedia Commons
Indiana: Pulaski County
> COVID-19 deaths in Pulaski: 355 per 100,000 people (total: 45)
> COVID-19 deaths in Indiana: 195 per 100,000 people (total: 13,028)
> COVID-19 cases in Pulaski: 8,728 per 100,000 people (total: 1,105)
> COVID-19 cases in Indiana: 10,232 per 100,000 people (total: 684,733)
> 65 and older population: 18.9% in Pulaski, 15.4% in Indiana

Source: BOB WESTON / iStock via Getty Images
Iowa: Harrison County
> COVID-19 deaths in Harrison: 502 per 100,000 people (total: 71)
> COVID-19 deaths in Iowa: 182 per 100,000 people (total: 5,729)
> COVID-19 cases in Harrison: 12,084 per 100,000 people (total: 1,709)
> COVID-19 cases in Iowa: 11,086 per 100,000 people (total: 349,885)
> 65 and older population: 19.4% in Harrison, 16.7% in Iowa
These are all the counties in Iowa where COVID-19 is slowing (and where it’s still getting worse).

Source: marekuliasz / iStock via Getty Images
Kansas: Gove County
> COVID-19 deaths in Gove: 725 per 100,000 people (total: 19)
> COVID-19 deaths in Kansas: 168 per 100,000 people (total: 4,902)
> COVID-19 cases in Gove: 14,700 per 100,000 people (total: 385)
> COVID-19 cases in Kansas: 10,368 per 100,000 people (total: 301,862)
> 65 and older population: 26.6% in Gove, 15.4% in Kansas
These are all the counties in Kansas where COVID-19 is slowing (and where it’s still getting worse).

Source: BOB WESTON / iStock via Getty Images
Kentucky: Robertson County
> COVID-19 deaths in Robertson: 653 per 100,000 people (total: 14)
> COVID-19 deaths in Kentucky: 135 per 100,000 people (total: 6,042)
> COVID-19 cases in Robertson: 9,239 per 100,000 people (total: 198)
> COVID-19 cases in Kentucky: 9,519 per 100,000 people (total: 425,333)
> 65 and older population: 21.5% in Robertson, 16.0% in Kentucky

Source: BOB WESTON / iStock via Getty Images
Louisiana: Bienville Parish
> COVID-19 deaths in Bienville: 585 per 100,000 people (total: 80)
> COVID-19 deaths in Louisiana: 217 per 100,000 people (total: 10,122)
> COVID-19 cases in Bienville: 11,933 per 100,000 people (total: 1,631)
> COVID-19 cases in Louisiana: 9,526 per 100,000 people (total: 443,905)
> 65 and older population: 20.3% in Bienville, 15.0% in Louisiana

Source: Holcy / iStock via Getty Images
Maine: Oxford County
> COVID-19 deaths in Oxford: 96 per 100,000 people (total: 55)
> COVID-19 deaths in Maine: 55 per 100,000 people (total: 738)
> COVID-19 cases in Oxford: 4,412 per 100,000 people (total: 2,529)
> COVID-19 cases in Maine: 3,755 per 100,000 people (total: 50,253)
> 65 and older population: 21.2% in Oxford, 20.0% in Maine
These are all the counties in Maine where COVID-19 is slowing (and where it’s still getting worse).
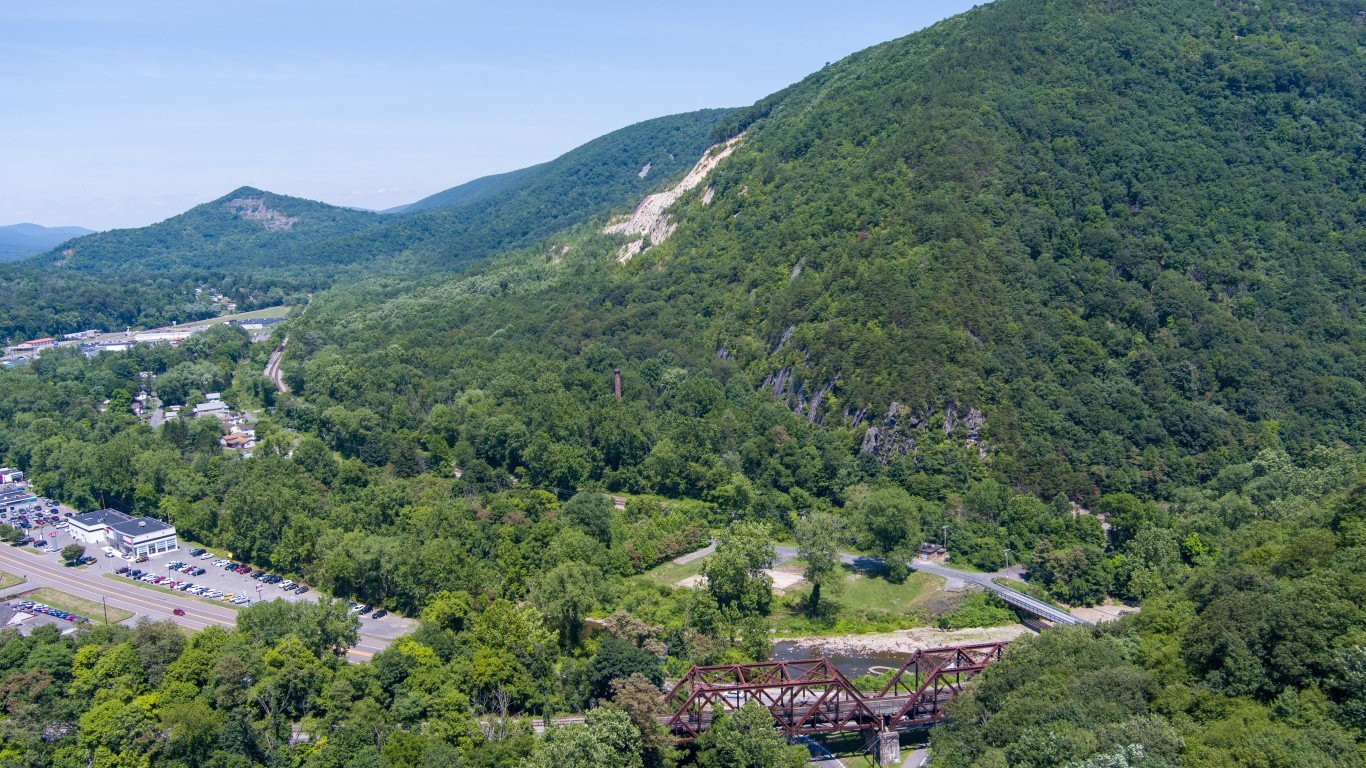
Source: Matthew Van Dyke / iStock via Getty Images
Maryland: Allegany County
> COVID-19 deaths in Allegany: 281 per 100,000 people (total: 202)
> COVID-19 deaths in Maryland: 137 per 100,000 people (total: 8,273)
> COVID-19 cases in Allegany: 9,042 per 100,000 people (total: 6,508)
> COVID-19 cases in Maryland: 6,785 per 100,000 people (total: 409,978)
> 65 and older population: 19.8% in Allegany, 15.0% in Maryland

Source: takomabibelot / Flickr
Massachusetts: Hampden County
> COVID-19 deaths in Hampden: 307 per 100,000 people (total: 1,441)
> COVID-19 deaths in Massachusetts: 246 per 100,000 people (total: 16,998)
> COVID-19 cases in Hampden: 9,698 per 100,000 people (total: 45,497)
> COVID-19 cases in Massachusetts: 8,753 per 100,000 people (total: 604,138)
> 65 and older population: 16.5% in Hampden, 16.2% in Massachusetts

Source: SteveDeming / iStock via Getty Images
Michigan: Iron County
> COVID-19 deaths in Iron: 455 per 100,000 people (total: 51)
> COVID-19 deaths in Michigan: 171 per 100,000 people (total: 17,056)
> COVID-19 cases in Iron: 8,366 per 100,000 people (total: 938)
> COVID-19 cases in Michigan: 7,332 per 100,000 people (total: 732,938)
> 65 and older population: 30.0% in Iron, 16.7% in Michigan
Source: afiler / Flickr
Minnesota: Kittson County
> COVID-19 deaths in Kittson: 507 per 100,000 people (total: 22)
> COVID-19 deaths in Minnesota: 123 per 100,000 people (total: 6,913)
> COVID-19 cases in Kittson: 9,822 per 100,000 people (total: 426)
> COVID-19 cases in Minnesota: 9,207 per 100,000 people (total: 516,608)
> 65 and older population: 23.9% in Kittson, 15.4% in Minnesota

Source: BOB WESTON / Getty Images
Mississippi: Neshoba County
> COVID-19 deaths in Neshoba: 592 per 100,000 people (total: 174)
> COVID-19 deaths in Mississippi: 235 per 100,000 people (total: 7,013)
> COVID-19 cases in Neshoba: 13,453 per 100,000 people (total: 3,952)
> COVID-19 cases in Mississippi: 10,208 per 100,000 people (total: 304,858)
> 65 and older population: 15.7% in Neshoba, 15.4% in Mississippi
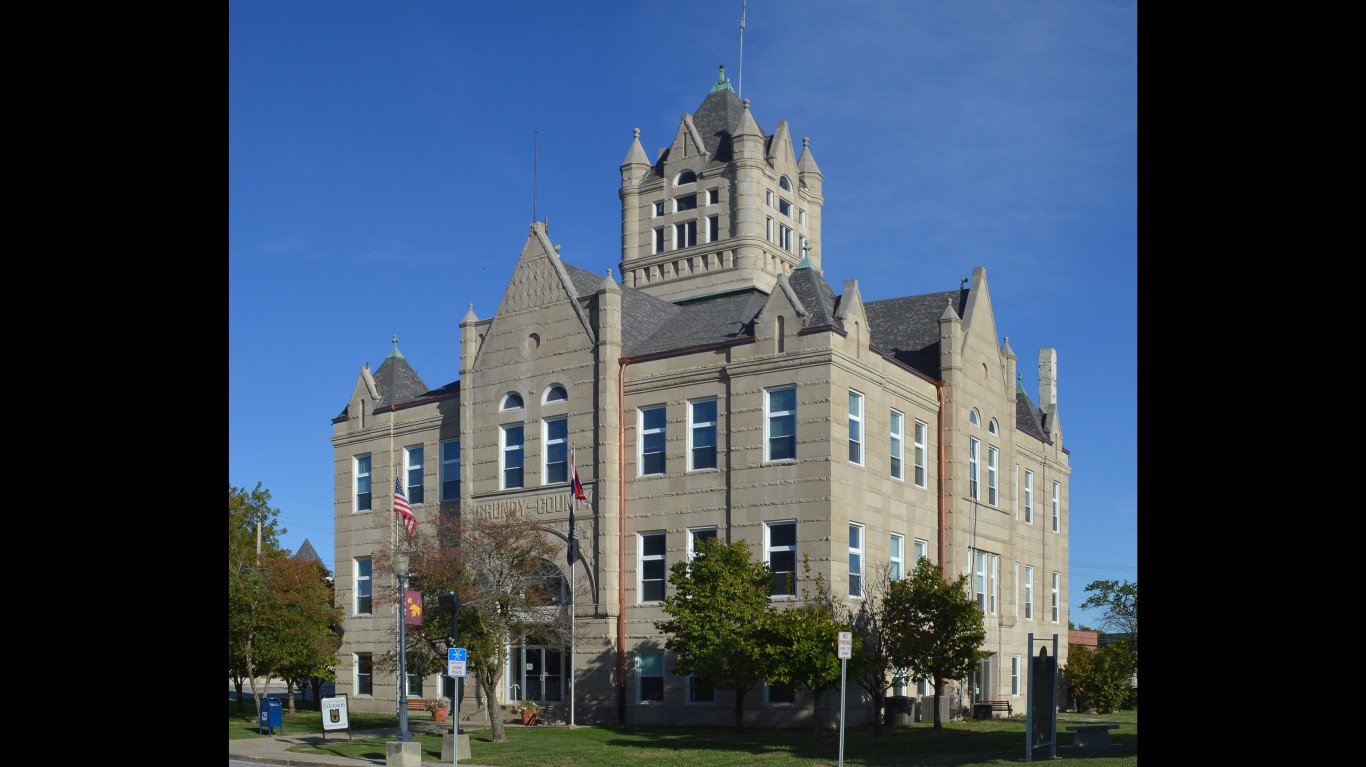
Source: iip-photo-archive / Flickr
Missouri: Grundy County
> COVID-19 deaths in Grundy: 339 per 100,000 people (total: 34)
> COVID-19 deaths in Missouri: 139 per 100,000 people (total: 8,495)
> COVID-19 cases in Grundy: 10,061 per 100,000 people (total: 1,010)
> COVID-19 cases in Missouri: 9,407 per 100,000 people (total: 576,310)
> 65 and older population: 21.7% in Grundy, 16.5% in Missouri

Source: RiverNorthPhotography / iStock via Getty Images
Montana: Big Horn County
> COVID-19 deaths in Big Horn: 531 per 100,000 people (total: 71)
> COVID-19 deaths in Montana: 135 per 100,000 people (total: 1,436)
> COVID-19 cases in Big Horn: 18,369 per 100,000 people (total: 2,457)
> COVID-19 cases in Montana: 9,805 per 100,000 people (total: 104,163)
> 65 and older population: 12.1% in Big Horn, 18.2% in Montana

Source: Public Domain / Wikimedia Commons
Nebraska: Grant County
> COVID-19 deaths in Grant: 557 per 100,000 people (total: 4)
> COVID-19 deaths in Nebraska: 113 per 100,000 people (total: 2,177)
> COVID-19 cases in Grant: 5,292 per 100,000 people (total: 38)
> COVID-19 cases in Nebraska: 10,829 per 100,000 people (total: 208,912)
> 65 and older population: 21.1% in Grant, 15.4% in Nebraska

Source: BOB WESTON / iStock via Getty Images
Nevada: Pershing County
> COVID-19 deaths in Pershing: 303 per 100,000 people (total: 20)
> COVID-19 deaths in Nevada: 173 per 100,000 people (total: 5,237)
> COVID-19 cases in Pershing: 14,264 per 100,000 people (total: 943)
> COVID-19 cases in Nevada: 9,995 per 100,000 people (total: 303,273)
> 65 and older population: 15.7% in Pershing, 15.4% in Nevada
These are all the counties in Nevada where COVID-19 is slowing (and where it’s still getting worse).

Source: DenisTangneyJr / iStock via Getty Images
New Hampshire: Belknap County
> COVID-19 deaths in Belknap: 157 per 100,000 people (total: 95)
> COVID-19 deaths in New Hampshire: 91 per 100,000 people (total: 1,237)
> COVID-19 cases in Belknap: 5,500 per 100,000 people (total: 3,335)
> COVID-19 cases in New Hampshire: 6,144 per 100,000 people (total: 83,340)
> 65 and older population: 21.4% in Belknap, 17.5% in New Hampshire

Source: dougtone / Flickr
New Jersey: Passaic County
> COVID-19 deaths in Passaic: 354 per 100,000 people (total: 1,782)
> COVID-19 deaths in New Jersey: 274 per 100,000 people (total: 24,404)
> COVID-19 cases in Passaic: 12,641 per 100,000 people (total: 63,717)
> COVID-19 cases in New Jersey: 10,106 per 100,000 people (total: 900,273)
> 65 and older population: 14.3% in Passaic, 15.9% in New Jersey

Source: wolfgangstaudt / Flickr
New Mexico: McKinley County
> COVID-19 deaths in McKinley: 625 per 100,000 people (total: 455)
> COVID-19 deaths in New Mexico: 187 per 100,000 people (total: 3,925)
> COVID-19 cases in McKinley: 16,665 per 100,000 people (total: 12,140)
> COVID-19 cases in New Mexico: 9,126 per 100,000 people (total: 191,230)
> 65 and older population: 11.9% in McKinley, 16.9% in New Mexico

Source: kenlund / Flickr
New York: Bronx County
> COVID-19 deaths in Bronx: 432 per 100,000 people (total: 6,212)
> COVID-19 deaths in New York: 255 per 100,000 people (total: 49,888)
> COVID-19 cases in Bronx: 11,405 per 100,000 people (total: 163,984)
> COVID-19 cases in New York: 9,527 per 100,000 people (total: 1,861,733)
> 65 and older population: 12.5% in Bronx, 16.1% in New York

Source: oldrebel / Flickr
North Carolina: Montgomery County
> COVID-19 deaths in Montgomery: 329 per 100,000 people (total: 90)
> COVID-19 deaths in North Carolina: 116 per 100,000 people (total: 12,085)
> COVID-19 cases in Montgomery: 11,702 per 100,000 people (total: 3,199)
> COVID-19 cases in North Carolina: 8,772 per 100,000 people (total: 910,833)
> 65 and older population: 19.7% in Montgomery, 15.9% in North Carolina

Source: usfwsmtnprairie / Flickr
North Dakota: Dickey County
> COVID-19 deaths in Dickey: 644 per 100,000 people (total: 32)
> COVID-19 deaths in North Dakota: 193 per 100,000 people (total: 1,466)
> COVID-19 cases in Dickey: 15,352 per 100,000 people (total: 763)
> COVID-19 cases in North Dakota: 13,535 per 100,000 people (total: 102,880)
> 65 and older population: 20.4% in Dickey, 14.9% in North Dakota

Source: Art Anderson / Wikimedia Commons
Ohio: Putnam County
> COVID-19 deaths in Putnam: 288 per 100,000 people (total: 98)
> COVID-19 deaths in Ohio: 159 per 100,000 people (total: 18,530)
> COVID-19 cases in Putnam: 11,982 per 100,000 people (total: 4,070)
> COVID-19 cases in Ohio: 8,667 per 100,000 people (total: 1,013,119)
> 65 and older population: 16.9% in Putnam, 16.7% in Ohio
These are all the counties in Ohio where COVID-19 is slowing (and where it’s still getting worse).

Source: thenationalguard / Flickr
Oklahoma: Greer County
> COVID-19 deaths in Greer: 286 per 100,000 people (total: 17)
> COVID-19 deaths in Oklahoma: 126 per 100,000 people (total: 4,953)
> COVID-19 cases in Greer: 9,591 per 100,000 people (total: 570)
> COVID-19 cases in Oklahoma: 11,107 per 100,000 people (total: 437,974)
> 65 and older population: 17.5% in Greer, 15.3% in Oklahoma

Source: icetsarina / Flickr
Oregon: Malheur County
> COVID-19 deaths in Malheur: 191 per 100,000 people (total: 58)
> COVID-19 deaths in Oregon: 57 per 100,000 people (total: 2,375)
> COVID-19 cases in Malheur: 11,147 per 100,000 people (total: 3,392)
> COVID-19 cases in Oregon: 3,917 per 100,000 people (total: 164,164)
> 65 and older population: 16.4% in Malheur, 17.2% in Oregon
These are all the counties in Oregon where COVID-19 is slowing (and where it’s still getting worse).
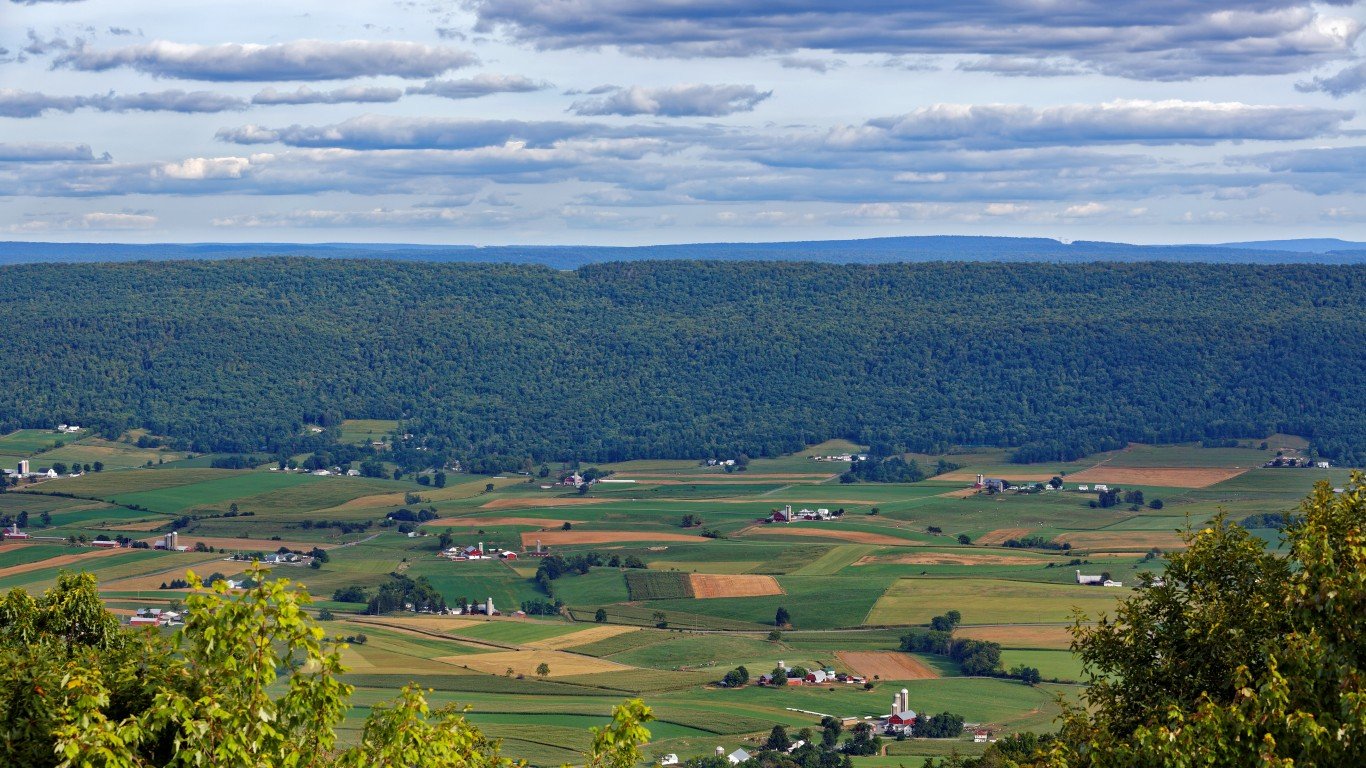
Source: Delmas Lehman / iStock via Getty Images
Pennsylvania: Mifflin County
> COVID-19 deaths in Mifflin: 377 per 100,000 people (total: 175)
> COVID-19 deaths in Pennsylvania: 195 per 100,000 people (total: 25,015)
> COVID-19 cases in Mifflin: 10,286 per 100,000 people (total: 4,769)
> COVID-19 cases in Pennsylvania: 7,927 per 100,000 people (total: 1,015,268)
> 65 and older population: 21.1% in Mifflin, 17.8% in Pennsylvania

Source: cmh2315fl / Flickr
Rhode Island: Providence County
> COVID-19 deaths in Providence: 300 per 100,000 people (total: 1,902)
> COVID-19 deaths in Rhode Island: 247 per 100,000 people (total: 2,613)
> COVID-19 cases in Providence: 13,793 per 100,000 people (total: 87,520)
> COVID-19 cases in Rhode Island: 12,910 per 100,000 people (total: 136,498)
> 65 and older population: 15.0% in Providence, 16.8% in Rhode Island

Source: Courtesy of Bamberg County Government
South Carolina: Bamberg County
> COVID-19 deaths in Bamberg: 349 per 100,000 people (total: 51)
> COVID-19 deaths in South Carolina: 179 per 100,000 people (total: 9,117)
> COVID-19 cases in Bamberg: 10,322 per 100,000 people (total: 1,507)
> COVID-19 cases in South Carolina: 10,775 per 100,000 people (total: 547,797)
> 65 and older population: 21.0% in Bamberg, 17.2% in South Carolina

Source: Ammodramus / Wikimedia Commons
South Dakota: Jerauld County
> COVID-19 deaths in Jerauld: 789 per 100,000 people (total: 16)
> COVID-19 deaths in South Dakota: 219 per 100,000 people (total: 1,933)
> COVID-19 cases in Jerauld: 13,553 per 100,000 people (total: 275)
> COVID-19 cases in South Dakota: 13,300 per 100,000 people (total: 117,336)
> 65 and older population: 29.6% in Jerauld, 16.3% in South Dakota

Source: ehrlif / iStock via Getty Images
Tennessee: Pickett County
> COVID-19 deaths in Pickett: 472 per 100,000 people (total: 24)
> COVID-19 deaths in Tennessee: 175 per 100,000 people (total: 11,866)
> COVID-19 cases in Pickett: 14,800 per 100,000 people (total: 753)
> COVID-19 cases in Tennessee: 11,960 per 100,000 people (total: 809,692)
> 65 and older population: 26.9% in Pickett, 16.0% in Tennessee

Source: Go Nakamura / Getty Images News via Getty Images
Texas: McMullen County
> COVID-19 deaths in McMullen: 755 per 100,000 people (total: 5)
> COVID-19 deaths in Texas: 164 per 100,000 people (total: 47,169)
> COVID-19 cases in McMullen: 12,538 per 100,000 people (total: 83)
> COVID-19 cases in Texas: 9,671 per 100,000 people (total: 2,775,669)
> 65 and older population: 18.3% in McMullen, 12.3% in Texas
These are all the counties in Texas where COVID-19 is slowing (and where it’s still getting worse).
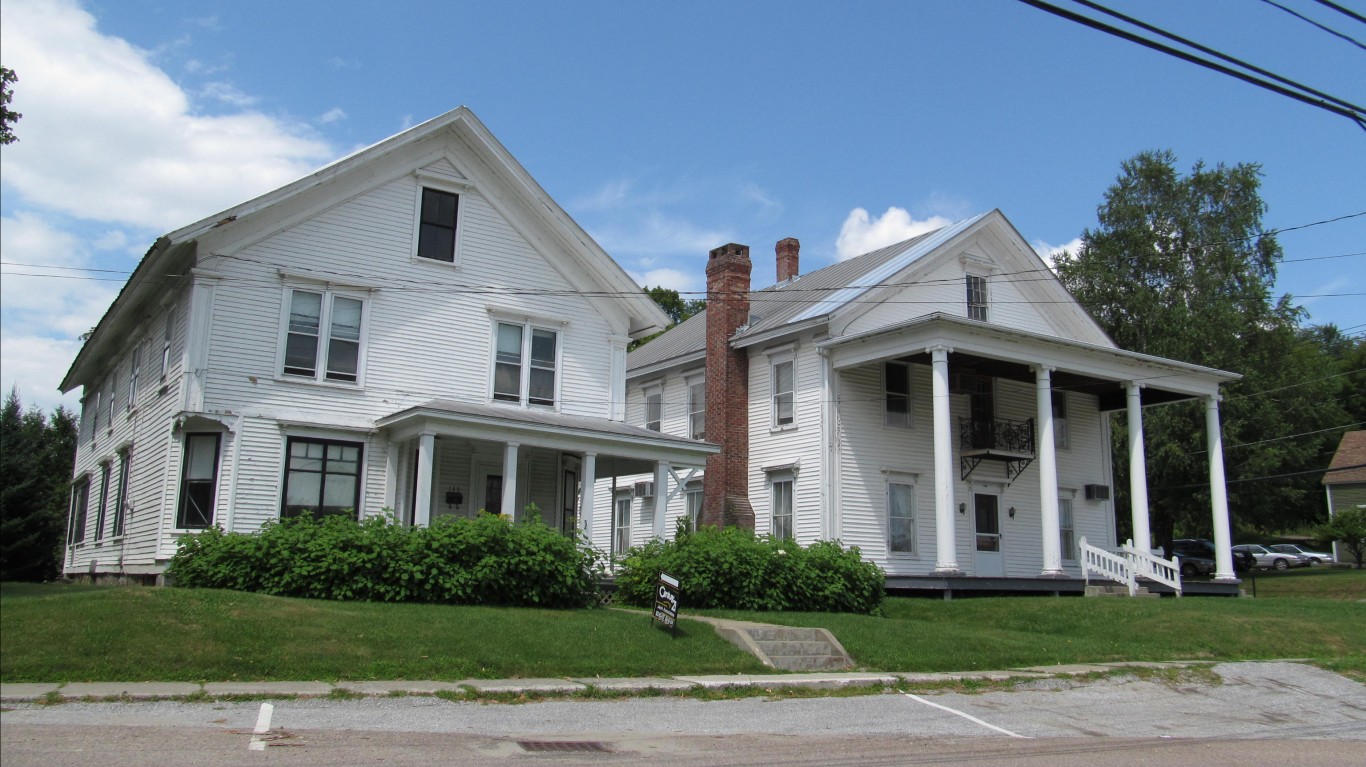
Source: dougtone / Flickr
Vermont: Franklin County
> COVID-19 deaths in Franklin: 75 per 100,000 people (total: 37)
> COVID-19 deaths in Vermont: 36 per 100,000 people (total: 225)
> COVID-19 cases in Franklin: 3,406 per 100,000 people (total: 1,670)
> COVID-19 cases in Vermont: 3,034 per 100,000 people (total: 19,002)
> 65 and older population: 15.6% in Franklin, 18.8% in Vermont

Source: macbeck / Flickr
Virginia: Emporia
> COVID-19 deaths in Emporia: 781 per 100,000 people (total: 42)
> COVID-19 deaths in Virginia: 120 per 100,000 people (total: 10,242)
> COVID-19 cases in Emporia: 12,117 per 100,000 people (total: 652)
> COVID-19 cases in Virginia: 7,255 per 100,000 people (total: 617,941)
> 65 and older population: 16.8% in Emporia, 15.0% in Virginia

Source: JeffGoulden / Getty Images
Washington: Garfield County
> COVID-19 deaths in Garfield: 225 per 100,000 people (total: 5)
> COVID-19 deaths in Washington: 69 per 100,000 people (total: 5,226)
> COVID-19 cases in Garfield: 5,396 per 100,000 people (total: 120)
> COVID-19 cases in Washington: 4,809 per 100,000 people (total: 362,385)
> 65 and older population: 24.7% in Garfield, 15.1% in Washington

Source: andrewbain / Flickr
West Virginia: Hancock County
> COVID-19 deaths in Hancock: 320 per 100,000 people (total: 95)
> COVID-19 deaths in West Virginia: 146 per 100,000 people (total: 2,638)
> COVID-19 cases in Hancock: 8,858 per 100,000 people (total: 2,629)
> COVID-19 cases in West Virginia: 7,808 per 100,000 people (total: 140,991)
> 65 and older population: 22.6% in Hancock, 19.4% in West Virginia

Source: Royalbroil / Wikimedia Commons
Wisconsin: Iron County
> COVID-19 deaths in Iron: 700 per 100,000 people (total: 40)
> COVID-19 deaths in Wisconsin: 125 per 100,000 people (total: 7,277)
> COVID-19 cases in Iron: 11,951 per 100,000 people (total: 683)
> COVID-19 cases in Wisconsin: 10,913 per 100,000 people (total: 634,453)
> 65 and older population: 30.1% in Iron, 16.5% in Wisconsin
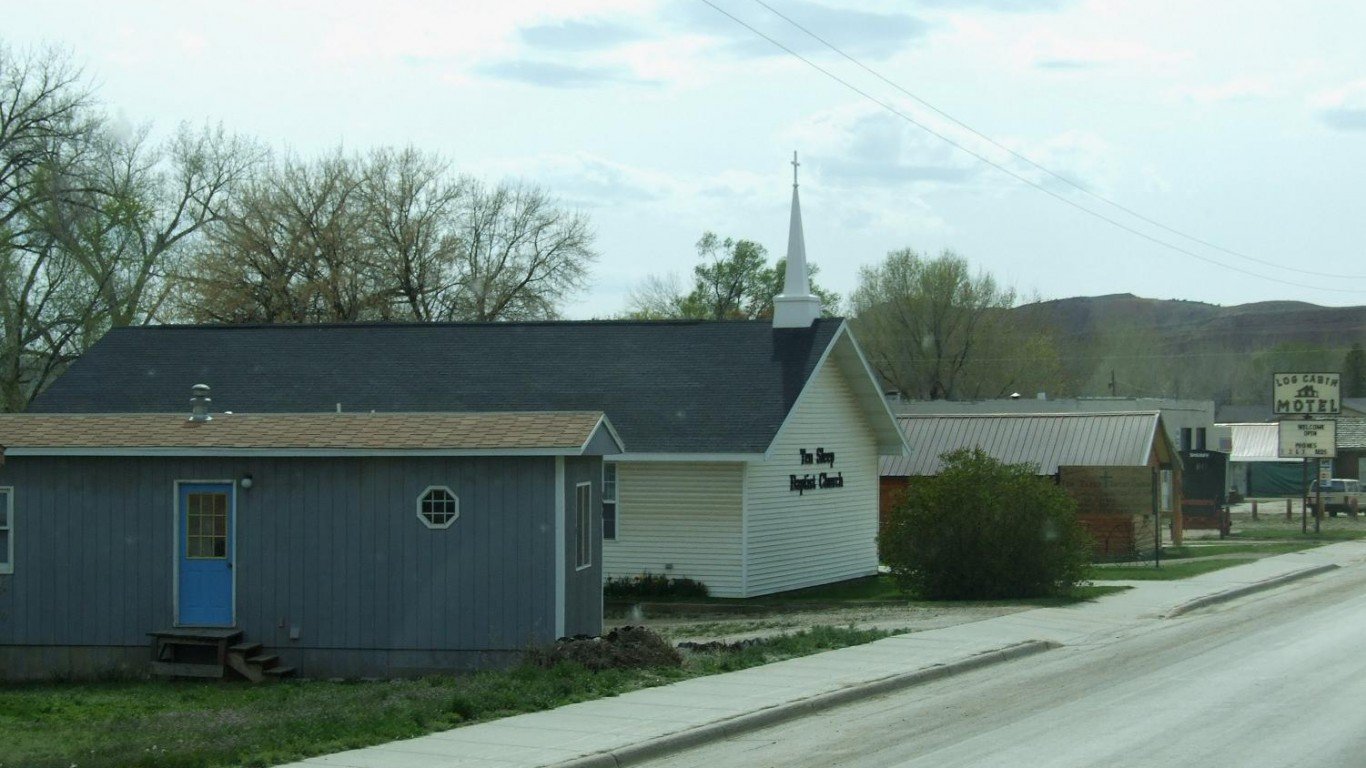
Source: panr / Flickr
Wyoming: Washakie County
> COVID-19 deaths in Washakie: 320 per 100,000 people (total: 26)
> COVID-19 deaths in Wyoming: 120 per 100,000 people (total: 695)
> COVID-19 cases in Washakie: 10,961 per 100,000 people (total: 891)
> COVID-19 cases in Wyoming: 9,726 per 100,000 people (total: 56,190)
> 65 and older population: 21.1% in Washakie, 15.7% in Wyoming

Source: AlexMcGuffie / Getty Images
Utah: San Juan County
> COVID-19 deaths in San Juan: 242 per 100,000 people (total: 37)
> COVID-19 deaths in Utah: 67 per 100,000 people (total: 2,114)
> COVID-19 cases in San Juan: 12,107 per 100,000 people (total: 1,850)
> COVID-19 cases in Utah: 12,172 per 100,000 people (total: 384,756)
> 65 and older population: 13.7% in San Juan, 10.8% in Utah
These are all the counties in Utah where COVID-19 is slowing (and where it’s still getting worse).
Take This Retirement Quiz To Get Matched With A Financial Advisor (Sponsored)
Take the quiz below to get matched with a financial advisor today.
Each advisor has been vetted by SmartAsset and is held to a fiduciary standard to act in your best interests.
Here’s how it works:
1. Answer SmartAsset advisor match quiz
2. Review your pre-screened matches at your leisure. Check out the
advisors’ profiles.
3. Speak with advisors at no cost to you. Have an introductory call on the phone or introduction in person and choose whom to work with in the future
Take the retirement quiz right here.
Thank you for reading! Have some feedback for us?
Contact the 24/7 Wall St. editorial team.
Editors' Picks


