
The U.S. has reported more than 30.4 million confirmed COVID-19 cases as of Apr. 7, 2021. More than 550,000 Americans have died of COVID-19 — the highest death toll of any country.
The virus has spread throughout the country in a way that has been difficult to predict, surging in one region, then showing signs of improvement, and then reappearing in other regions. Though local outbreaks may ebb and flow, the current surge in cases has been felt nearly nationwide, leading to new travel restrictions and business closures around the country.
Nationwide, there were an average of 18.7 daily new coronavirus cases per 100,000 Americans in the week ending Apr. 7, 2021. Cumulatively, the U.S. has reported 9,315.1 cases per 100,000 Americans, and 168.8 deaths per 100,000 Americans.
The extent of the spread of the novel coronavirus continues to vary considerably from state to state, and even from county to county. Even as the number of daily new cases is flattening or even declining in some parts of the country, new cases are surging at a growing rate in others.
The coronavirus has spread to different parts of the country in different stages throughout the pandemic. In the spring, the worst hit states were in the Northeast, as New York City became the epicenter of the nation’s crisis. The virus spread to states throughout the Sun Belt in the summer, and hit states in the Midwest and West during the fall. Now, nearly every state is categorized as a COVID-19 hotspot, according to definitions based on new cases per capita from the nonprofit health organization Kaiser Family Foundation.
To determine the county in each state with the highest rate of daily cases of the virus, 24/7 Wall St. compiled and reviewed data from state and local health departments. We ranked counties according to the average new number of cases per 100,000 residents per day during the week ending Apr. 7, 2021. Population data used to adjust case and death totals came from the U.S. Census Bureau’s 2018 American Community Survey and are five-year estimates.

Source: Jacqueline Nix / iStock Editorial via Getty Images
Alabama: Elmore County
> Avg. new daily cases in Elmore County in week ending Apr. 7, 2021: 13.7 per 100,000
> Cumulative confirmed COVID-19 cases in Elmore County as of Apr. 7, 2021: 10,004 (12,318.0 per 100,000)
> Cumulative confirmed COVID-19 deaths in Elmore County as of Apr. 7, 2021: 201 (247.5 per 100,000)
> Population: 81,212
> Largest place in Elmore County: Millbrook

Source: ChrisBoswell / Getty Images
Alaska: Matanuska-Susitna Borough
> Avg. new daily cases in Matanuska-Susitna Borough in week ending Apr. 7, 2021: 52.1 per 100,000
> Cumulative confirmed COVID-19 cases in Matanuska-Susitna Borough as of Apr. 7, 2021: 10,283 (9,938.6 per 100,000)
> Cumulative confirmed COVID-19 deaths in Matanuska-Susitna Borough as of Apr. 7, 2021: 37 (35.8 per 100,000)
> Population: 103,464
> Largest place in Matanuska-Susitna Borough: Knik-Fairview
These are all the counties in Alaska where COVID-19 is slowing (and where it’s still getting worse).

Source: CampPhoto / Getty Images
Arizona: Apache County
> Avg. new daily cases in Apache County in week ending Apr. 7, 2021: 48.9 per 100,000
> Cumulative confirmed COVID-19 cases in Apache County as of Apr. 7, 2021: 11,198 (15,657.2 per 100,000)
> Cumulative confirmed COVID-19 deaths in Apache County as of Apr. 7, 2021: 420 (587.2 per 100,000)
> Population: 71,522
> Largest place in Apache County: Chinle
Source: Public Domain / Wikimedia Commons
Arkansas: Arkansas County
> Avg. new daily cases in Arkansas County in week ending Apr. 7, 2021: 15.1 per 100,000
> Cumulative confirmed COVID-19 cases in Arkansas County as of Apr. 7, 2021: 2,082 (11,488.5 per 100,000)
> Cumulative confirmed COVID-19 deaths in Arkansas County as of Apr. 7, 2021: 36 (198.6 per 100,000)
> Population: 18,124
> Largest place in Arkansas County: Stuttgart

Source: Jeffrey Schwartz / iStock via Getty Images
California: Del Norte County
> Avg. new daily cases in Del Norte County in week ending Apr. 7, 2021: 37.0 per 100,000
> Cumulative confirmed COVID-19 cases in Del Norte County as of Apr. 7, 2021: 1,230 (4,484.0 per 100,000)
> Cumulative confirmed COVID-19 deaths in Del Norte County as of Apr. 7, 2021: 6 (21.9 per 100,000)
> Population: 27,424
> Largest place in Del Norte County: Crescent City North

Source: Darren_Bridges_Photography / iStock
Colorado: Pitkin County
> Avg. new daily cases in Pitkin County in week ending Apr. 7, 2021: 85.5 per 100,000
> Cumulative confirmed COVID-19 cases in Pitkin County as of Apr. 7, 2021: 2,489 (13,900.4 per 100,000)
> Cumulative confirmed COVID-19 deaths in Pitkin County as of Apr. 7, 2021: 4 (22.3 per 100,000)
> Population: 17,909
> Largest place in Pitkin County: Aspen

Source: pabradyphoto / iStock via Getty Images
Connecticut: New Haven County
> Avg. new daily cases in New Haven County in week ending Apr. 7, 2021: 44.1 per 100,000
> Cumulative confirmed COVID-19 cases in New Haven County as of Apr. 7, 2021: 82,698 (9,623.4 per 100,000)
> Cumulative confirmed COVID-19 deaths in New Haven County as of Apr. 7, 2021: 2,006 (233.4 per 100,000)
> Population: 859,339
> Largest place in New Haven County: New Haven

Source: JERRYE & ROY KLOTZ, M.D. / Wikimedia Commons
Delaware: New Castle County
> Avg. new daily cases in New Castle County in week ending Apr. 7, 2021: 36.3 per 100,000
> Cumulative confirmed COVID-19 cases in New Castle County as of Apr. 7, 2021: 56,573 (10,190.9 per 100,000)
> Cumulative confirmed COVID-19 deaths in New Castle County as of Apr. 7, 2021: 781 (140.7 per 100,000)
> Population: 555,133
> Largest place in New Castle County: Wilmington

Source: Sean Pavone / Getty Images
Florida: Miami-Dade County
> Avg. new daily cases in Miami-Dade County in week ending Apr. 7, 2021: 42.2 per 100,000
> Cumulative confirmed COVID-19 cases in Miami-Dade County as of Apr. 7, 2021: 452,086 (16,648.3 per 100,000)
> Cumulative confirmed COVID-19 deaths in Miami-Dade County as of Apr. 7, 2021: 5,917 (217.9 per 100,000)
> Population: 2,715,516
> Largest place in Miami-Dade County: Miami

Source: Rivers Langley; SaveRivers / Wikimedia Commons
Georgia: Chattahoochee County
> Avg. new daily cases in Chattahoochee County in week ending Apr. 7, 2021: 126.1 per 100,000
> Cumulative confirmed COVID-19 cases in Chattahoochee County as of Apr. 7, 2021: 3,569 (33,147.9 per 100,000)
> Cumulative confirmed COVID-19 deaths in Chattahoochee County as of Apr. 7, 2021: 14 (130.0 per 100,000)
> Population: 10,767
> Largest place in Chattahoochee County: Fort Benning South

Source: Hotaik Sung / Getty Images
Hawaii: Maui County
> Avg. new daily cases in Maui County in week ending Apr. 7, 2021: 20.0 per 100,000
> Cumulative confirmed COVID-19 cases in Maui County as of Apr. 7, 2021: 3,806 (2,302.8 per 100,000)
> Cumulative confirmed COVID-19 deaths in Maui County as of Apr. 7, 2021: 41 (24.8 per 100,000)
> Population: 165,281
> Largest place in Maui County: Kahului
These are all the counties in Hawaii where COVID-19 is slowing (and where it’s still getting worse).

Source: Ken Lund / Flickr
Idaho: Madison County
> Avg. new daily cases in Madison County in week ending Apr. 7, 2021: 41.1 per 100,000
> Cumulative confirmed COVID-19 cases in Madison County as of Apr. 7, 2021: 6,976 (18,023.4 per 100,000)
> Cumulative confirmed COVID-19 deaths in Madison County as of Apr. 7, 2021: 23 (59.4 per 100,000)
> Population: 38,705
> Largest place in Madison County: Rexburg
These are all the counties in Idaho where COVID-19 is slowing (and where it’s still getting worse).

Source: ghornephoto / iStock via Getty Images
Illinois: Peoria County
> Avg. new daily cases in Peoria County in week ending Apr. 7, 2021: 60.6 per 100,000
> Cumulative confirmed COVID-19 cases in Peoria County as of Apr. 7, 2021: 19,244 (10,432.4 per 100,000)
> Cumulative confirmed COVID-19 deaths in Peoria County as of Apr. 7, 2021: 273 (148.0 per 100,000)
> Population: 184,463
> Largest place in Peoria County: Peoria

Source: jhutchin / iStock via Getty Images
Indiana: St. Joseph County
> Avg. new daily cases in St. Joseph County in week ending Apr. 7, 2021: 33.5 per 100,000
> Cumulative confirmed COVID-19 cases in St. Joseph County as of Apr. 7, 2021: 32,750 (12,163.7 per 100,000)
> Cumulative confirmed COVID-19 deaths in St. Joseph County as of Apr. 7, 2021: 531 (197.2 per 100,000)
> Population: 269,240
> Largest place in St. Joseph County: South Bend

Source: Public Domain / Wikimedia Commons
Iowa: Dickinson County
> Avg. new daily cases in Dickinson County in week ending Apr. 7, 2021: 59.1 per 100,000
> Cumulative confirmed COVID-19 cases in Dickinson County as of Apr. 7, 2021: 2,333 (13,680.4 per 100,000)
> Cumulative confirmed COVID-19 deaths in Dickinson County as of Apr. 7, 2021: 43 (252.1 per 100,000)
> Population: 17,056
> Largest place in Dickinson County: Spirit Lake
These are all the counties in Iowa where COVID-19 is slowing (and where it’s still getting worse).
Source: Ammodramus / Wikimedia Commons
Kansas: Graham County
> Avg. new daily cases in Graham County in week ending Apr. 7, 2021: 59.5 per 100,000
> Cumulative confirmed COVID-19 cases in Graham County as of Apr. 7, 2021: 263 (10,339.9 per 100,000)
> Cumulative confirmed COVID-19 deaths in Graham County as of Apr. 7, 2021: N/A (N/A per 100,000)
> Population: 2,545
> Largest place in Graham County: Hill City
These are all the counties in Kansas where COVID-19 is slowing (and where it’s still getting worse).

Source: W.marsh / Wikimedia Commons
Kentucky: Adair County
> Avg. new daily cases in Adair County in week ending Apr. 7, 2021: 60.1 per 100,000
> Cumulative confirmed COVID-19 cases in Adair County as of Apr. 7, 2021: 1,791 (9,308.3 per 100,000)
> Cumulative confirmed COVID-19 deaths in Adair County as of Apr. 7, 2021: 53 (275.5 per 100,000)
> Population: 19,241
> Largest place in Adair County: Columbia

Source: BOB WESTON / iStock via Getty Images
Louisiana: Catahoula Parish
> Avg. new daily cases in Catahoula Parish in week ending Apr. 7, 2021: 22.8 per 100,000
> Cumulative confirmed COVID-19 cases in Catahoula Parish as of Apr. 7, 2021: 1,085 (10,963.5 per 100,000)
> Cumulative confirmed COVID-19 deaths in Catahoula Parish as of Apr. 7, 2021: 38 (384.1 per 100,000)
> Population: 9,893
> Largest place in Catahoula Parish: Jonesville

Source: DenisTangneyJr / iStock via Getty Images
Maine: Androscoggin County
> Avg. new daily cases in Androscoggin County in week ending Apr. 7, 2021: 27.9 per 100,000
> Cumulative confirmed COVID-19 cases in Androscoggin County as of Apr. 7, 2021: 5,596 (5,208.5 per 100,000)
> Cumulative confirmed COVID-19 deaths in Androscoggin County as of Apr. 7, 2021: 59 (54.9 per 100,000)
> Population: 107,444
> Largest place in Androscoggin County: Lewiston
These are all the counties in Maine where COVID-19 is slowing (and where it’s still getting worse).

Source: peeterv / Getty Images
Maryland: Baltimore city
> Avg. new daily cases in Baltimore city in week ending Apr. 7, 2021: 34.1 per 100,000
> Cumulative confirmed COVID-19 cases in Baltimore city as of Apr. 7, 2021: 45,851 (7,459.1 per 100,000)
> Cumulative confirmed COVID-19 deaths in Baltimore city as of Apr. 7, 2021: 951 (154.7 per 100,000)
> Population: 614,700
> Largest place in Baltimore city: Baltimore

Source: grantreig / iStock via Getty Images
Massachusetts: Nantucket County
> Avg. new daily cases in Nantucket County in week ending Apr. 7, 2021: 77.2 per 100,000
> Cumulative confirmed COVID-19 cases in Nantucket County as of Apr. 7, 2021: 1,356 (12,213.1 per 100,000)
> Cumulative confirmed COVID-19 deaths in Nantucket County as of Apr. 7, 2021: 4 (36.0 per 100,000)
> Population: 11,101
> Largest place in Nantucket County: Nantucket

Source: usnavy / Flickr
Michigan: St. Clair County
> Avg. new daily cases in St. Clair County in week ending Apr. 7, 2021: 127.5 per 100,000
> Cumulative confirmed COVID-19 cases in St. Clair County as of Apr. 7, 2021: 13,290 (8,328.6 per 100,000)
> Cumulative confirmed COVID-19 deaths in St. Clair County as of Apr. 7, 2021: 285 (178.6 per 100,000)
> Population: 159,566
> Largest place in St. Clair County: Port Huron

Source: Jonathunder / Wikimedia Commons
Minnesota: Jackson County
> Avg. new daily cases in Jackson County in week ending Apr. 7, 2021: 84.4 per 100,000
> Cumulative confirmed COVID-19 cases in Jackson County as of Apr. 7, 2021: 1,083 (10,775.5 per 100,000)
> Cumulative confirmed COVID-19 deaths in Jackson County as of Apr. 7, 2021: 10 (99.5 per 100,000)
> Population: 10,047
> Largest place in Jackson County: Jackson

Source: BOB WESTON / iStock via Getty Images
Mississippi: Yalobusha County
> Avg. new daily cases in Yalobusha County in week ending Apr. 7, 2021: 22.7 per 100,000
> Cumulative confirmed COVID-19 cases in Yalobusha County as of Apr. 7, 2021: 1,572 (12,655.1 per 100,000)
> Cumulative confirmed COVID-19 deaths in Yalobusha County as of Apr. 7, 2021: 36 (289.8 per 100,000)
> Population: 12,421
> Largest place in Yalobusha County: Water Valley

Source: thenationalguard / Flickr
Missouri: Lewis County
> Avg. new daily cases in Lewis County in week ending Apr. 7, 2021: 80.5 per 100,000
> Cumulative confirmed COVID-19 cases in Lewis County as of Apr. 7, 2021: 1,043 (10,397.9 per 100,000)
> Cumulative confirmed COVID-19 deaths in Lewis County as of Apr. 7, 2021: 12 (119.7 per 100,000)
> Population: 10,027
> Largest place in Lewis County: Canton
Source: anniam / Getty Images
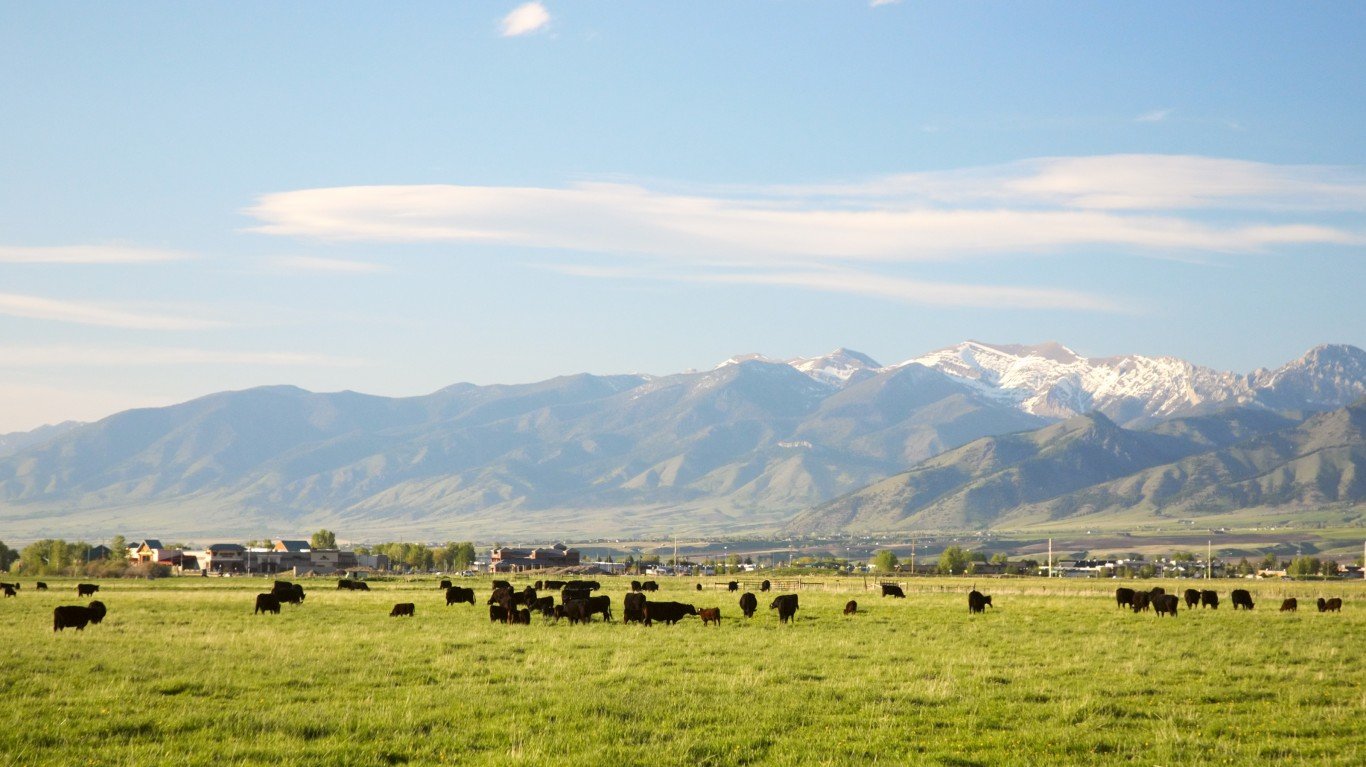
Montana: Gallatin County
> Avg. new daily cases in Gallatin County in week ending Apr. 7, 2021: 38.8 per 100,000
> Cumulative confirmed COVID-19 cases in Gallatin County as of Apr. 7, 2021: 13,344 (12,741.1 per 100,000)
> Cumulative confirmed COVID-19 deaths in Gallatin County as of Apr. 7, 2021: 57 (54.4 per 100,000)
> Population: 104,729
> Largest place in Gallatin County: Bozeman

Source: BOB WESTON / iStock via Getty Images
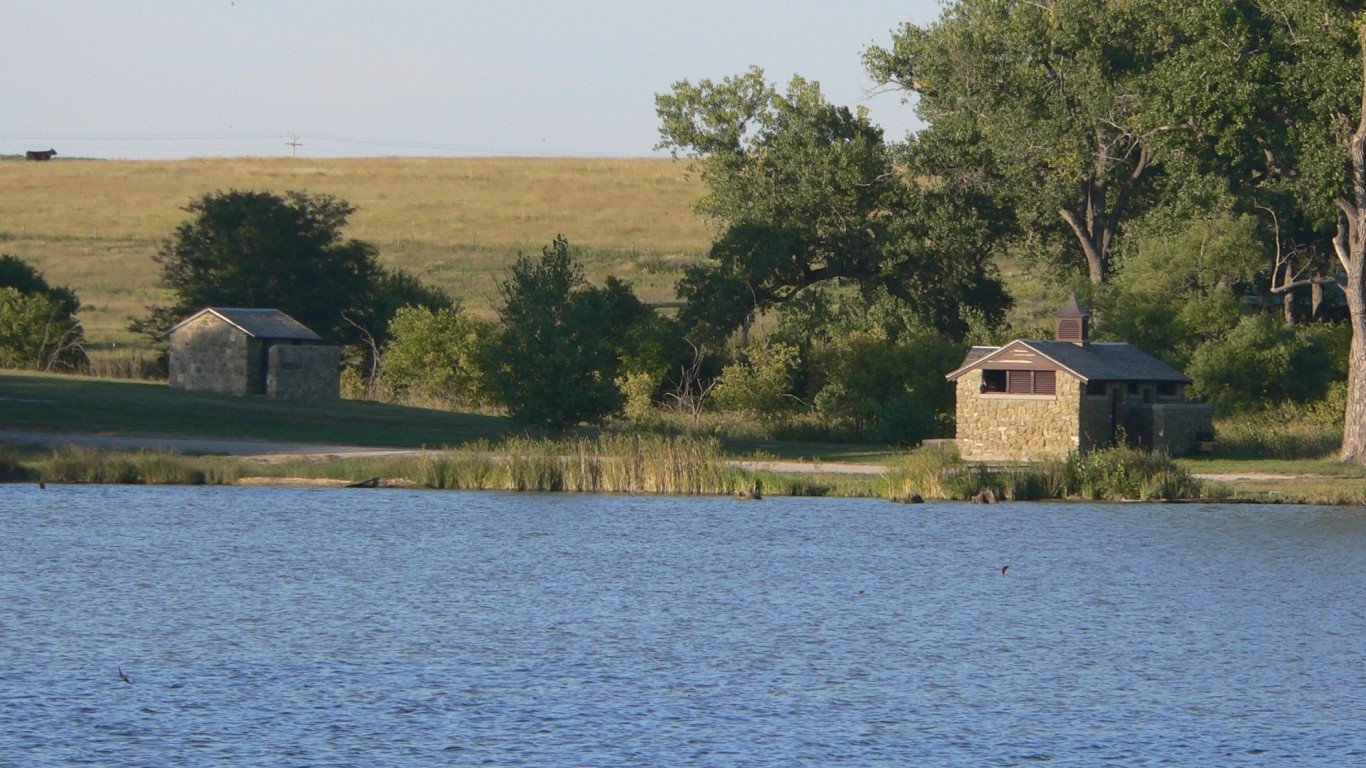
Nebraska: Seward County
> Avg. new daily cases in Seward County in week ending Apr. 7, 2021: 57.2 per 100,000
> Cumulative confirmed COVID-19 cases in Seward County as of Apr. 7, 2021: 1,660 (9,692.0 per 100,000)
> Cumulative confirmed COVID-19 deaths in Seward County as of Apr. 7, 2021: 30 (175.2 per 100,000)
> Population: 17,127
> Largest place in Seward County: Seward

Source: DenisTangneyJr / Getty Images
Nevada: Carson City
> Avg. new daily cases in Carson City in week ending Apr. 7, 2021: 20.7 per 100,000
> Cumulative confirmed COVID-19 cases in Carson City as of Apr. 7, 2021: 6,221 (11,420.7 per 100,000)
> Cumulative confirmed COVID-19 deaths in Carson City as of Apr. 7, 2021: 122 (224.0 per 100,000)
> Population: 54,467
> Largest place in Carson City: Carson City
These are all the counties in Nevada where COVID-19 is slowing (and where it’s still getting worse).

Source: DenisTangneyJr / iStock via Getty Images
New Hampshire: Strafford County
> Avg. new daily cases in Strafford County in week ending Apr. 7, 2021: 32.4 per 100,000
> Cumulative confirmed COVID-19 cases in Strafford County as of Apr. 7, 2021: 8,301 (6,473.0 per 100,000)
> Cumulative confirmed COVID-19 deaths in Strafford County as of Apr. 7, 2021: 76 (59.3 per 100,000)
> Population: 128,237
> Largest place in Strafford County: Dover

Source: dougtone / Flickr
New Jersey: Sussex County
> Avg. new daily cases in Sussex County in week ending Apr. 7, 2021: 75.2 per 100,000
> Cumulative confirmed COVID-19 cases in Sussex County as of Apr. 7, 2021: 12,121 (8,518.0 per 100,000)
> Cumulative confirmed COVID-19 deaths in Sussex County as of Apr. 7, 2021: 284 (199.6 per 100,000)
> Population: 142,298
> Largest place in Sussex County: Hopatcong

Source: BOB WESTON / iStock via Getty Images
New Mexico: Guadalupe County
> Avg. new daily cases in Guadalupe County in week ending Apr. 7, 2021: 16.4 per 100,000
> Cumulative confirmed COVID-19 cases in Guadalupe County as of Apr. 7, 2021: 377 (8,608.3 per 100,000)
> Cumulative confirmed COVID-19 deaths in Guadalupe County as of Apr. 7, 2021: 9 (205.4 per 100,000)
> Population: 4,382
> Largest place in Guadalupe County: Santa Rosa

Source: Matthew Trump / Wikimedia Commons
New York: Richmond County
> Avg. new daily cases in Richmond County in week ending Apr. 7, 2021: 69.4 per 100,000
> Cumulative confirmed COVID-19 cases in Richmond County as of Apr. 7, 2021: 67,401 (14,216.7 per 100,000)
> Cumulative confirmed COVID-19 deaths in Richmond County as of Apr. 7, 2021: 1,709 (360.5 per 100,000)
> Population: 474,101
> Largest place in Richmond County: New York

Source: gerrydincher / Flickr
North Carolina: Alexander County
> Avg. new daily cases in Alexander County in week ending Apr. 7, 2021: 32.5 per 100,000
> Cumulative confirmed COVID-19 cases in Alexander County as of Apr. 7, 2021: 4,187 (11,281.0 per 100,000)
> Cumulative confirmed COVID-19 deaths in Alexander County as of Apr. 7, 2021: 82 (220.9 per 100,000)
> Population: 37,119
> Largest place in Alexander County: Bethlehem

Source: thenationalguard / Flickr
North Dakota: Sheridan County
> Avg. new daily cases in Sheridan County in week ending Apr. 7, 2021: 61.1 per 100,000
> Cumulative confirmed COVID-19 cases in Sheridan County as of Apr. 7, 2021: 112 (7,976.1 per 100,000)
> Cumulative confirmed COVID-19 deaths in Sheridan County as of Apr. 7, 2021: 2 (142.3 per 100,000)
> Population: 1,405
> Largest place in Sheridan County: McClusky

Source: Jacqueline Nix / iStock Editorial via Getty Images
Ohio: Belmont County
> Avg. new daily cases in Belmont County in week ending Apr. 7, 2021: 29.8 per 100,000
> Cumulative confirmed COVID-19 cases in Belmont County as of Apr. 7, 2021: 5,442 (7,947.9 per 100,000)
> Cumulative confirmed COVID-19 deaths in Belmont County as of Apr. 7, 2021: 158 (230.8 per 100,000)
> Population: 68,472
> Largest place in Belmont County: Martins Ferry
These are all the counties in Ohio where COVID-19 is slowing (and where it’s still getting worse).

Source: GracedByTheLight / iStock via Getty Images
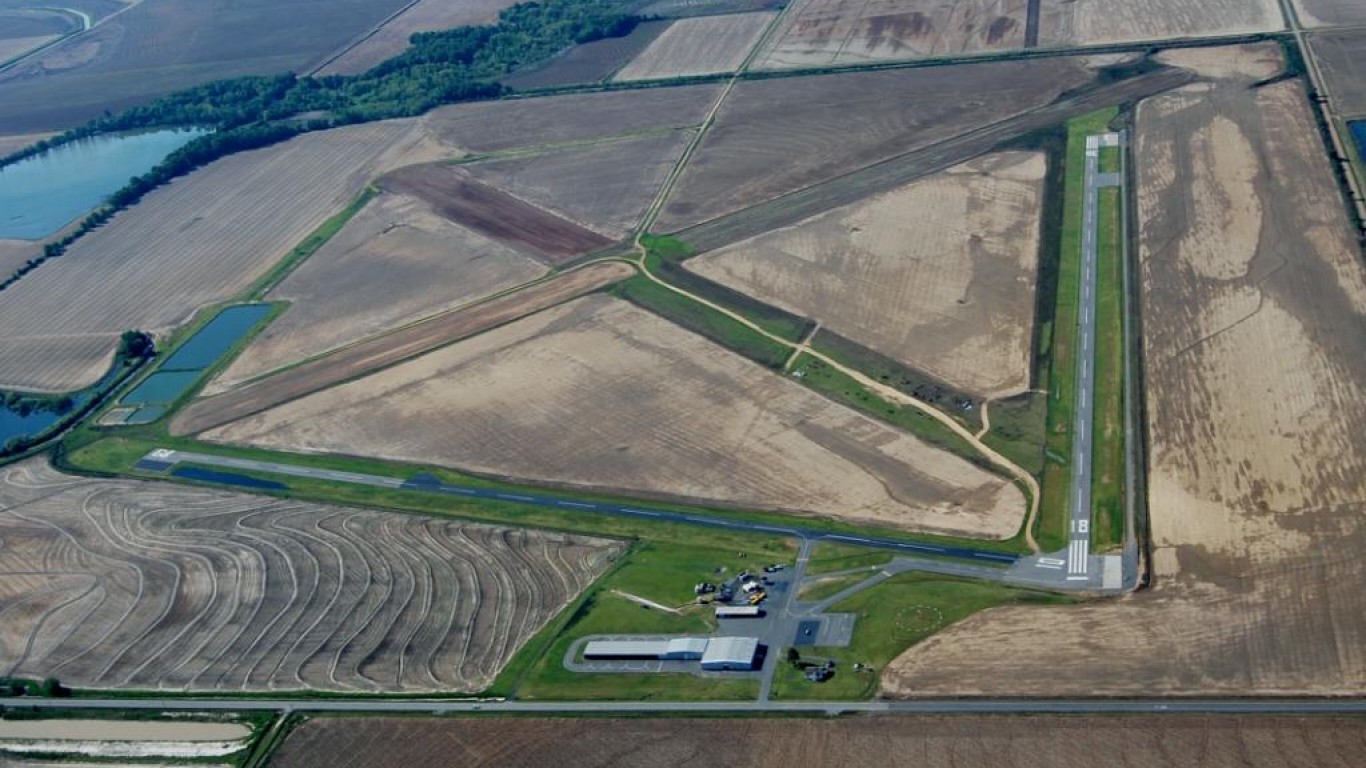
Oklahoma: Cimarron County
> Avg. new daily cases in Cimarron County in week ending Apr. 7, 2021: 33.7 per 100,000
> Cumulative confirmed COVID-19 cases in Cimarron County as of Apr. 7, 2021: 209 (9,553.2 per 100,000)
> Cumulative confirmed COVID-19 deaths in Cimarron County as of Apr. 7, 2021: 1 (45.7 per 100,000)
> Population: 2,189
> Largest place in Cimarron County: Boise City

Source: peeterv / iStock via Getty Images
Oregon: Baker County
> Avg. new daily cases in Baker County in week ending Apr. 7, 2021: 36.4 per 100,000
> Cumulative confirmed COVID-19 cases in Baker County as of Apr. 7, 2021: 779 (4,876.4 per 100,000)
> Cumulative confirmed COVID-19 deaths in Baker County as of Apr. 7, 2021: 12 (75.1 per 100,000)
> Population: 15,984
> Largest place in Baker County: Baker City
These are all the counties in Oregon where COVID-19 is slowing (and where it’s still getting worse).

Source: iip-photo-archive / Flickr
Pennsylvania: Wyoming County
> Avg. new daily cases in Wyoming County in week ending Apr. 7, 2021: 59.0 per 100,000
> Cumulative confirmed COVID-19 cases in Wyoming County as of Apr. 7, 2021: 1,516 (5,494.6 per 100,000)
> Cumulative confirmed COVID-19 deaths in Wyoming County as of Apr. 7, 2021: 44 (159.5 per 100,000)
> Population: 27,588
> Largest place in Wyoming County: Tunkhannock

Source: cmh2315fl / Flickr
Rhode Island: Providence County
> Avg. new daily cases in Providence County in week ending Apr. 7, 2021: 29.2 per 100,000
> Cumulative confirmed COVID-19 cases in Providence County as of Apr. 7, 2021: 88,838 (14,000.5 per 100,000)
> Cumulative confirmed COVID-19 deaths in Providence County as of Apr. 7, 2021: N/A (N/A per 100,000)
> Population: 634,533
> Largest place in Providence County: Providence

Source: Kruck20 / iStock via Getty Images
South Carolina: Greenville County
> Avg. new daily cases in Greenville County in week ending Apr. 7, 2021: 37.7 per 100,000
> Cumulative confirmed COVID-19 cases in Greenville County as of Apr. 7, 2021: 70,366 (14,118.3 per 100,000)
> Cumulative confirmed COVID-19 deaths in Greenville County as of Apr. 7, 2021: 952 (191.0 per 100,000)
> Population: 498,402
> Largest place in Greenville County: Greenville

Source: dasqfamily / Flickr
South Dakota: Kingsbury County
> Avg. new daily cases in Kingsbury County in week ending Apr. 7, 2021: 108.6 per 100,000
> Cumulative confirmed COVID-19 cases in Kingsbury County as of Apr. 7, 2021: 753 (15,168.7 per 100,000)
> Cumulative confirmed COVID-19 deaths in Kingsbury County as of Apr. 7, 2021: 14 (281.9 per 100,000)
> Population: 4,967
> Largest place in Kingsbury County: De Smet

Source: BOB WESTON / iStock via Getty Images
Tennessee: Cheatham County
> Avg. new daily cases in Cheatham County in week ending Apr. 7, 2021: 31.9 per 100,000
> Cumulative confirmed COVID-19 cases in Cheatham County as of Apr. 7, 2021: 4,318 (10,815.3 per 100,000)
> Cumulative confirmed COVID-19 deaths in Cheatham County as of Apr. 7, 2021: 50 (125.2 per 100,000)
> Population: 39,929
> Largest place in Cheatham County: Ashland City

Source: BOB WESTON / iStock via Getty Images
Texas: Dimmit County
> Avg. new daily cases in Dimmit County in week ending Apr. 7, 2021: 100.9 per 100,000
> Cumulative confirmed COVID-19 cases in Dimmit County as of Apr. 7, 2021: 1,795 (16,834.1 per 100,000)
> Cumulative confirmed COVID-19 deaths in Dimmit County as of Apr. 7, 2021: 30 (281.3 per 100,000)
> Population: 10,663
> Largest place in Dimmit County: Carrizo Springs
These are all the counties in Texas where COVID-19 is slowing (and where it’s still getting worse).

Source: Different_Brian / iStock via Getty Images
Utah: Kane County
> Avg. new daily cases in Kane County in week ending Apr. 7, 2021: 31.2 per 100,000
> Cumulative confirmed COVID-19 cases in Kane County as of Apr. 7, 2021: 647 (8,807.7 per 100,000)
> Cumulative confirmed COVID-19 deaths in Kane County as of Apr. 7, 2021: 5 (68.0 per 100,000)
> Population: 7,350
> Largest place in Kane County: Kanab
These are all the counties in Utah where COVID-19 is slowing (and where it’s still getting worse).

Source: John Jewell / Flickr
Vermont: Orleans County
> Avg. new daily cases in Orleans County in week ending Apr. 7, 2021: 53.2 per 100,000
> Cumulative confirmed COVID-19 cases in Orleans County as of Apr. 7, 2021: 983 (3,651.1 per 100,000)
> Cumulative confirmed COVID-19 deaths in Orleans County as of Apr. 7, 2021: 7 (26.0 per 100,000)
> Population: 26,911
> Largest place in Orleans County: Newport

Source: Public Domain
Virginia: Galax city
> Avg. new daily cases in Galax city in week ending Apr. 7, 2021: 70.0 per 100,000
> Cumulative confirmed COVID-19 cases in Galax city as of Apr. 7, 2021: 1,069 (16,098.3 per 100,000)
> Cumulative confirmed COVID-19 deaths in Galax city as of Apr. 7, 2021: 50 (753.2 per 100,000)
> Population: 6,638
> Largest place in Galax city: Galax

Source: kirt_edblom / Flickr
Washington: Lincoln County
> Avg. new daily cases in Lincoln County in week ending Apr. 7, 2021: 28.8 per 100,000
> Cumulative confirmed COVID-19 cases in Lincoln County as of Apr. 7, 2021: 397 (3,806.7 per 100,000)
> Cumulative confirmed COVID-19 deaths in Lincoln County as of Apr. 7, 2021: 6 (57.5 per 100,000)
> Population: 10,435
> Largest place in Lincoln County: Davenport

Source: thenationalguard / Flickr
West Virginia: Raleigh County
> Avg. new daily cases in Raleigh County in week ending Apr. 7, 2021: 52.5 per 100,000
> Cumulative confirmed COVID-19 cases in Raleigh County as of Apr. 7, 2021: 5,725 (7,510.3 per 100,000)
> Cumulative confirmed COVID-19 deaths in Raleigh County as of Apr. 7, 2021: 72 (94.4 per 100,000)
> Population: 76,232
> Largest place in Raleigh County: Beckley

Source: Wolterk / iStock via Getty Images
Wisconsin: St. Croix County
> Avg. new daily cases in St. Croix County in week ending Apr. 7, 2021: 24.7 per 100,000
> Cumulative confirmed COVID-19 cases in St. Croix County as of Apr. 7, 2021: 8,581 (9,760.2 per 100,000)
> Cumulative confirmed COVID-19 deaths in St. Croix County as of Apr. 7, 2021: 55 (62.6 per 100,000)
> Population: 87,917
> Largest place in St. Croix County: Hudson

Source: Justinreznick / iStock
Wyoming: Teton County
> Avg. new daily cases in Teton County in week ending Apr. 7, 2021: 37.2 per 100,000
> Cumulative confirmed COVID-19 cases in Teton County as of Apr. 7, 2021: 3,634 (15,759.9 per 100,000)
> Cumulative confirmed COVID-19 deaths in Teton County as of Apr. 7, 2021: 9 (39.0 per 100,000)
> Population: 23,059
> Largest place in Teton County: Jackson
Click here to see all coronavirus data for every state.
Sponsored: Attention Savvy Investors: Speak to 3 Financial Experts – FREE
Ever wanted an extra set of eyes on an investment you’re considering? Now you can speak with up to 3 financial experts in your area for FREE. By simply
clicking here you can begin to match with financial professionals who can help guide you through the financial decisions you’re making. And the best part? The first conversation with them is free.
Click here to match with up to 3 financial pros who would be excited to help you make financial decisions.
Thank you for reading! Have some feedback for us?
Contact the 24/7 Wall St. editorial team.
Editors' Picks


