
The U.S. has reported more than 32.0 million confirmed COVID-19 cases as of May 4, 2021. More than 570,000 Americans have died of COVID-19 — the highest death toll of any country.
The virus has spread throughout the country in a way that has been difficult to predict, surging in one region, then showing signs of improvement, and then reappearing in other regions. Though local outbreaks may ebb and flow, the current surge in cases has been felt nearly nationwide, leading to new travel restrictions and business closures around the country.
Nationwide, there were an average of 15.6 daily new coronavirus cases per 100,000 Americans in the week ending May 4, 2021. Cumulatively, the U.S. has reported 9,806.5 cases per 100,000 Americans, and 174.8 deaths per 100,000 Americans.
The extent of the spread of the novel coronavirus continues to vary considerably from state to state, and even from county to county. Even as the number of daily new cases is flattening or even declining in some parts of the country, new cases are surging at a growing rate in others.
The nation’s worst COVID-19 hot spot is in Texas. In Willacy County, there were an average of 218.0 daily new coronavirus cases per 100,000 Americans in the week ending May 4, 2021 — more than 13.0 times greater than the national case growth rate and the most of any county in the country. The dramatic increase is largely due to the large backlog of cases reported for Willacy County on April 26.
Other national hot spots include Chattahoochee County, Georgia; Grant County, Oregon; and Huron County, Michigan. Case growth in these counties range from 102.0 daily new cases per 100,000 residents to 92.0 daily new cases per 100,000.
To determine the county in each state with the highest rate of daily cases of the virus, 24/7 Wall St. compiled and reviewed data from state and local health departments. We ranked counties according to the average new number of cases per 100,000 residents per day during the week ending May 4, 2021. Population data used to adjust case and death totals came from the U.S. Census Bureau’s 2018 American Community Survey and are five-year estimates.
Source: Jacqueline Nix / iStock Editorial via Getty Images
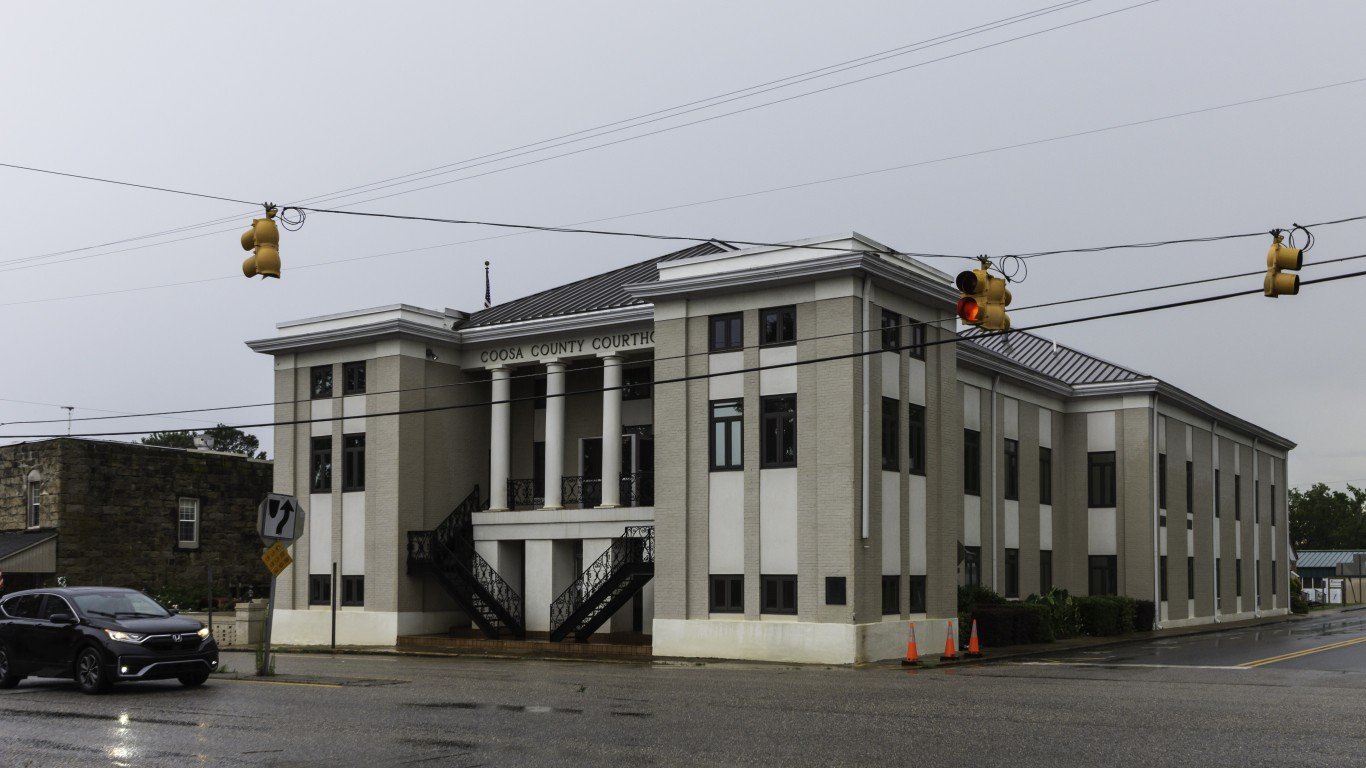
Alabama: Coosa County
> Avg. new daily cases in Coosa County in week ending May 4, 2021: 55.7 per 100,000
> Cumulative confirmed COVID-19 cases in Coosa County as of May 4, 2021: 1,068 (9,838.8 per 100,000)
> Cumulative confirmed COVID-19 deaths in Coosa County as of May 4, 2021: 28 (257.9 per 100,000)
> Population: 10,855
> Largest place in Coosa County: Goodwater

Source: DMartinez-Photo / Getty Images
Alaska: Fairbanks North Star Borough
> Avg. new daily cases in Fairbanks North Star Borough in week ending May 4, 2021: 63.2 per 100,000
> Cumulative confirmed COVID-19 cases in Fairbanks North Star Borough as of May 4, 2021: 7,643 (7,669.6 per 100,000)
> Cumulative confirmed COVID-19 deaths in Fairbanks North Star Borough as of May 4, 2021: 37 (37.1 per 100,000)
> Population: 99,653
> Largest place in Fairbanks North Star Borough: Fairbanks
These are all the counties in Alaska where COVID-19 is slowing (and where it’s still getting worse).

Source: fdastudillo / Getty Images
Arizona: Coconino County
> Avg. new daily cases in Coconino County in week ending May 4, 2021: 14.5 per 100,000
> Cumulative confirmed COVID-19 cases in Coconino County as of May 4, 2021: 17,745 (12,655.4 per 100,000)
> Cumulative confirmed COVID-19 deaths in Coconino County as of May 4, 2021: 329 (234.6 per 100,000)
> Population: 140,217
> Largest place in Coconino County: Flagstaff

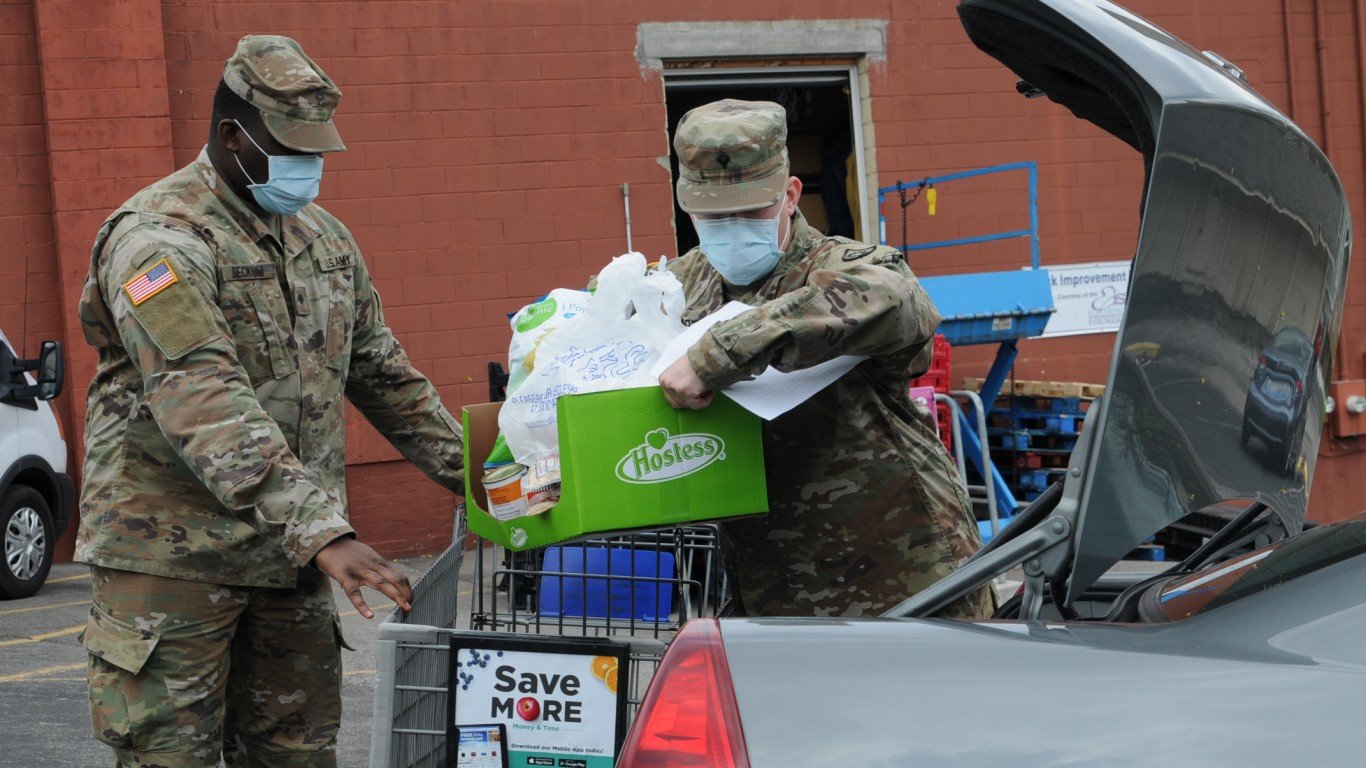
Source: thenationalguard / Flickr
Arkansas: Ashley County
> Avg. new daily cases in Ashley County in week ending May 4, 2021: 22.3 per 100,000
> Cumulative confirmed COVID-19 cases in Ashley County as of May 4, 2021: 1,998 (9,728.8 per 100,000)
> Cumulative confirmed COVID-19 deaths in Ashley County as of May 4, 2021: 34 (165.6 per 100,000)
> Population: 20,537
> Largest place in Ashley County: Crossett

Source: CampPhoto / iStock via Getty Images
California: Siskiyou County
> Avg. new daily cases in Siskiyou County in week ending May 4, 2021: 22.9 per 100,000
> Cumulative confirmed COVID-19 cases in Siskiyou County as of May 4, 2021: 2,071 (4,756.5 per 100,000)
> Cumulative confirmed COVID-19 deaths in Siskiyou County as of May 4, 2021: 21 (48.2 per 100,000)
> Population: 43,540
> Largest place in Siskiyou County: Yreka

Source: denverjeffrey / Flickr
Colorado: Bent County
> Avg. new daily cases in Bent County in week ending May 4, 2021: 60.4 per 100,000
> Cumulative confirmed COVID-19 cases in Bent County as of May 4, 2021: 1,524 (26,235.2 per 100,000)
> Cumulative confirmed COVID-19 deaths in Bent County as of May 4, 2021: 21 (361.5 per 100,000)
> Population: 5,809
> Largest place in Bent County: Las Animas

Source: pabradyphoto / iStock via Getty Images
Connecticut: New Haven County
> Avg. new daily cases in New Haven County in week ending May 4, 2021: 27.2 per 100,000
> Cumulative confirmed COVID-19 cases in New Haven County as of May 4, 2021: 89,526 (10,418.0 per 100,000)
> Cumulative confirmed COVID-19 deaths in New Haven County as of May 4, 2021: 2,069 (240.8 per 100,000)
> Population: 859,339
> Largest place in New Haven County: New Haven

Source: David Osberg / Getty Images
Delaware: Kent County
> Avg. new daily cases in Kent County in week ending May 4, 2021: 30.4 per 100,000
> Cumulative confirmed COVID-19 cases in Kent County as of May 4, 2021: 17,484 (10,001.0 per 100,000)
> Cumulative confirmed COVID-19 deaths in Kent County as of May 4, 2021: 334 (191.1 per 100,000)
> Population: 174,822
> Largest place in Kent County: Dover

Source: Carolyn Hutchins / iStock via Getty Images
Florida: Osceola County
> Avg. new daily cases in Osceola County in week ending May 4, 2021: 42.9 per 100,000
> Cumulative confirmed COVID-19 cases in Osceola County as of May 4, 2021: 44,302 (13,083.1 per 100,000)
> Cumulative confirmed COVID-19 deaths in Osceola County as of May 4, 2021: 500 (147.7 per 100,000)
> Population: 338,619
> Largest place in Osceola County: Kissimmee

Source: Rivers Langley; SaveRivers / Wikimedia Commons
Georgia: Chattahoochee County
> Avg. new daily cases in Chattahoochee County in week ending May 4, 2021: 102.0 per 100,000
> Cumulative confirmed COVID-19 cases in Chattahoochee County as of May 4, 2021: 3,940 (36,593.3 per 100,000)
> Cumulative confirmed COVID-19 deaths in Chattahoochee County as of May 4, 2021: 15 (139.3 per 100,000)
> Population: 10,767
> Largest place in Chattahoochee County: Fort Benning South

Source: Hotaik Sung / Getty Images
Hawaii: Maui County
> Avg. new daily cases in Maui County in week ending May 4, 2021: 7.5 per 100,000
> Cumulative confirmed COVID-19 cases in Maui County as of May 4, 2021: 4,348 (2,630.7 per 100,000)
> Cumulative confirmed COVID-19 deaths in Maui County as of May 4, 2021: 51 (30.9 per 100,000)
> Population: 165,281
> Largest place in Maui County: Kahului
These are all the counties in Hawaii where COVID-19 is slowing (and where it’s still getting worse).

Source: Larry D. Moore / Wikimedia Commons
Idaho: Elmore County
> Avg. new daily cases in Elmore County in week ending May 4, 2021: 21.5 per 100,000
> Cumulative confirmed COVID-19 cases in Elmore County as of May 4, 2021: 1,978 (7,483.1 per 100,000)
> Cumulative confirmed COVID-19 deaths in Elmore County as of May 4, 2021: 15 (56.7 per 100,000)
> Population: 26,433
> Largest place in Elmore County: Mountain Home
These are all the counties in Idaho where COVID-19 is slowing (and where it’s still getting worse).

Source: ghornephoto / iStock via Getty Images
Illinois: Peoria County
> Avg. new daily cases in Peoria County in week ending May 4, 2021: 53.4 per 100,000
> Cumulative confirmed COVID-19 cases in Peoria County as of May 4, 2021: 22,562 (12,231.2 per 100,000)
> Cumulative confirmed COVID-19 deaths in Peoria County as of May 4, 2021: 292 (158.3 per 100,000)
> Population: 184,463
> Largest place in Peoria County: Peoria

Source: thenationalguard / Flickr
Indiana: Steuben County
> Avg. new daily cases in Steuben County in week ending May 4, 2021: 33.5 per 100,000
> Cumulative confirmed COVID-19 cases in Steuben County as of May 4, 2021: 3,796 (11,011.2 per 100,000)
> Cumulative confirmed COVID-19 deaths in Steuben County as of May 4, 2021: 57 (165.3 per 100,000)
> Population: 34,474
> Largest place in Steuben County: Angola

Source: thenationalguard / Flickr
Iowa: Winnebago County
> Avg. new daily cases in Winnebago County in week ending May 4, 2021: 29.9 per 100,000
> Cumulative confirmed COVID-19 cases in Winnebago County as of May 4, 2021: 1,404 (13,281.6 per 100,000)
> Cumulative confirmed COVID-19 deaths in Winnebago County as of May 4, 2021: 31 (293.3 per 100,000)
> Population: 10,571
> Largest place in Winnebago County: Forest City
These are all the counties in Iowa where COVID-19 is slowing (and where it’s still getting worse).

Source: Redheadedhornet / iStock via Getty Images
Kansas: Marion County
> Avg. new daily cases in Marion County in week ending May 4, 2021: 35.3 per 100,000
> Cumulative confirmed COVID-19 cases in Marion County as of May 4, 2021: 1,095 (9,100.7 per 100,000)
> Cumulative confirmed COVID-19 deaths in Marion County as of May 4, 2021: N/A (N/A per 100,000)
> Population: 12,032
> Largest place in Marion County: Hillsboro
These are all the counties in Kansas where COVID-19 is slowing (and where it’s still getting worse).
Source: thenationalguard / Flickr
Kentucky: Lewis County
> Avg. new daily cases in Lewis County in week ending May 4, 2021: 45.5 per 100,000
> Cumulative confirmed COVID-19 cases in Lewis County as of May 4, 2021: 1,291 (9,570.1 per 100,000)
> Cumulative confirmed COVID-19 deaths in Lewis County as of May 4, 2021: 35 (259.5 per 100,000)
> Population: 13,490
> Largest place in Lewis County: Vanceburg

Source: BOB WESTON / iStock via Getty Images
Louisiana: Catahoula Parish
> Avg. new daily cases in Catahoula Parish in week ending May 4, 2021: 23.3 per 100,000
> Cumulative confirmed COVID-19 cases in Catahoula Parish as of May 4, 2021: 1,153 (11,654.7 per 100,000)
> Cumulative confirmed COVID-19 deaths in Catahoula Parish as of May 4, 2021: 38 (384.1 per 100,000)
> Population: 9,893
> Largest place in Catahoula Parish: Jonesville

Source: DenisTangneyJr / iStock via Getty Images
Maine: Androscoggin County
> Avg. new daily cases in Androscoggin County in week ending May 4, 2021: 53.3 per 100,000
> Cumulative confirmed COVID-19 cases in Androscoggin County as of May 4, 2021: 7,337 (6,828.7 per 100,000)
> Cumulative confirmed COVID-19 deaths in Androscoggin County as of May 4, 2021: 71 (66.1 per 100,000)
> Population: 107,444
> Largest place in Androscoggin County: Lewiston
These are all the counties in Maine where COVID-19 is slowing (and where it’s still getting worse).

Source: Win McNamee / Getty Images News via Getty Images
Maryland: Dorchester County
> Avg. new daily cases in Dorchester County in week ending May 4, 2021: 27.1 per 100,000
> Cumulative confirmed COVID-19 cases in Dorchester County as of May 4, 2021: 2,718 (8,425.0 per 100,000)
> Cumulative confirmed COVID-19 deaths in Dorchester County as of May 4, 2021: 51 (158.1 per 100,000)
> Population: 32,261
> Largest place in Dorchester County: Cambridge
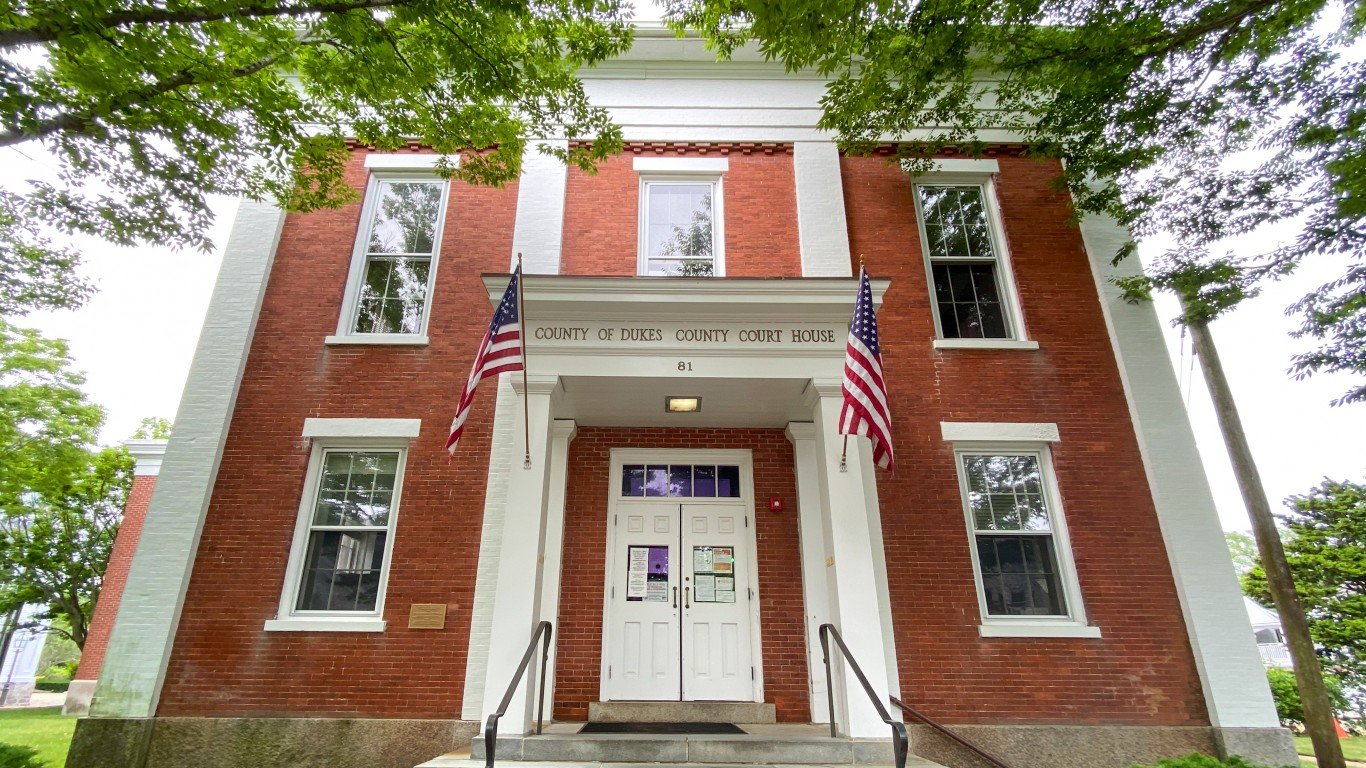
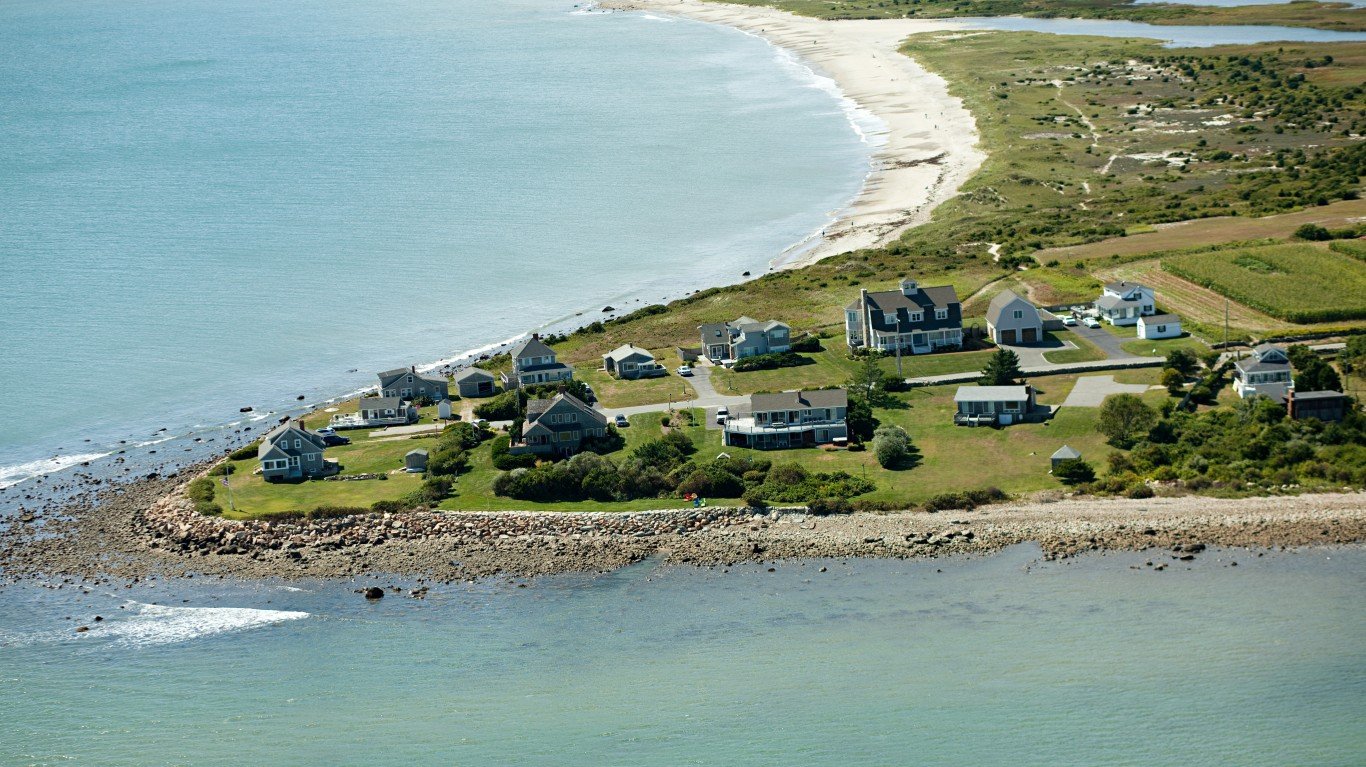
Source: demerzel21 / iStock via Getty Images
Massachusetts: Dukes County
> Avg. new daily cases in Dukes County in week ending May 4, 2021: 46.1 per 100,000
> Cumulative confirmed COVID-19 cases in Dukes County as of May 4, 2021: 1,278 (7,381.7 per 100,000)
> Cumulative confirmed COVID-19 deaths in Dukes County as of May 4, 2021: 0 (0.0 per 100,000)
> Population: 17,313
> Largest place in Dukes County: Vineyard Haven

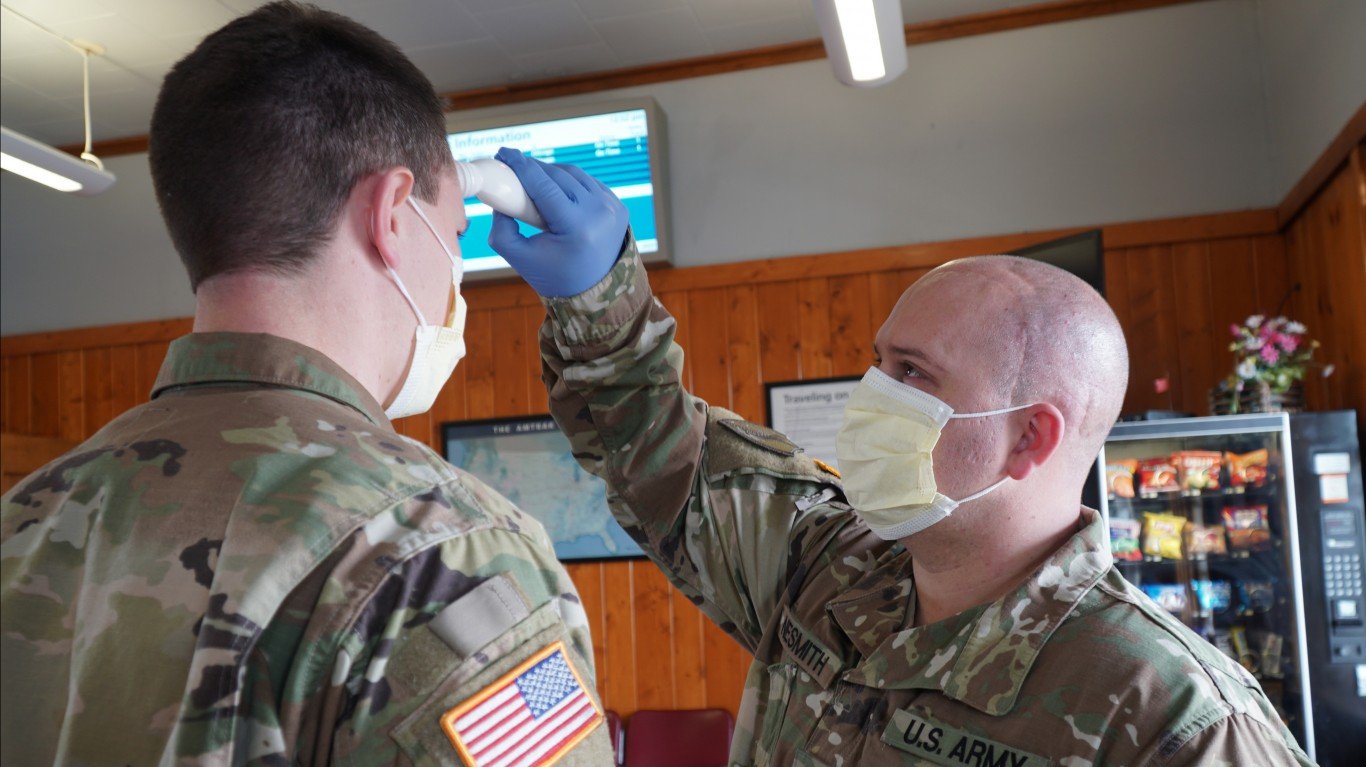
Source: usnavy / Flickr
Michigan: Huron County
> Avg. new daily cases in Huron County in week ending May 4, 2021: 92.0 per 100,000
> Cumulative confirmed COVID-19 cases in Huron County as of May 4, 2021: 3,969 (12,582.8 per 100,000)
> Cumulative confirmed COVID-19 deaths in Huron County as of May 4, 2021: 73 (231.4 per 100,000)
> Population: 31,543
> Largest place in Huron County: Bad Axe

Source: thenationalguard / Flickr
Minnesota: Clearwater County
> Avg. new daily cases in Clearwater County in week ending May 4, 2021: 60.4 per 100,000
> Cumulative confirmed COVID-19 cases in Clearwater County as of May 4, 2021: 846 (9,600.5 per 100,000)
> Cumulative confirmed COVID-19 deaths in Clearwater County as of May 4, 2021: 16 (181.6 per 100,000)
> Population: 8,812
> Largest place in Clearwater County: Bagley

Source: thenationalguard / Flickr
Mississippi: George County
> Avg. new daily cases in George County in week ending May 4, 2021: 23.2 per 100,000
> Cumulative confirmed COVID-19 cases in George County as of May 4, 2021: 2,452 (10,341.6 per 100,000)
> Cumulative confirmed COVID-19 deaths in George County as of May 4, 2021: 47 (198.2 per 100,000)
> Population: 23,710
> Largest place in George County: Lucedale

Source: thenationalguard / Flickr
Missouri: Lincoln County
> Avg. new daily cases in Lincoln County in week ending May 4, 2021: 22.2 per 100,000
> Cumulative confirmed COVID-19 cases in Lincoln County as of May 4, 2021: 5,818 (10,471.0 per 100,000)
> Cumulative confirmed COVID-19 deaths in Lincoln County as of May 4, 2021: 41 (73.8 per 100,000)
> Population: 55,563
> Largest place in Lincoln County: Troy
Source: thenationalguard / Flickr
Montana: Meagher County
> Avg. new daily cases in Meagher County in week ending May 4, 2021: 53.9 per 100,000
> Cumulative confirmed COVID-19 cases in Meagher County as of May 4, 2021: 153 (7,774.4 per 100,000)
> Cumulative confirmed COVID-19 deaths in Meagher County as of May 4, 2021: 7 (355.7 per 100,000)
> Population: 1,968
> Largest place in Meagher County: White Sulphur Springs

Source: RobertWaltman / iStock via Getty Images
Nebraska: Scotts Bluff County
> Avg. new daily cases in Scotts Bluff County in week ending May 4, 2021: 62.3 per 100,000
> Cumulative confirmed COVID-19 cases in Scotts Bluff County as of May 4, 2021: 4,120 (11,363.9 per 100,000)
> Cumulative confirmed COVID-19 deaths in Scotts Bluff County as of May 4, 2021: 92 (253.8 per 100,000)
> Population: 36,255
> Largest place in Scotts Bluff County: Scottsbluff

Source: walencienne / Getty Images
Nevada: Storey County
> Avg. new daily cases in Storey County in week ending May 4, 2021: 22.3 per 100,000
> Cumulative confirmed COVID-19 cases in Storey County as of May 4, 2021: 102 (2,588.2 per 100,000)
> Cumulative confirmed COVID-19 deaths in Storey County as of May 4, 2021: 3 (76.1 per 100,000)
> Population: 3,941
> Largest place in Storey County: N/A
These are all the counties in Nevada where COVID-19 is slowing (and where it’s still getting worse).

Source: BOB WESTON / Getty Images
New Hampshire: Coos County
> Avg. new daily cases in Coos County in week ending May 4, 2021: 68.2 per 100,000
> Cumulative confirmed COVID-19 cases in Coos County as of May 4, 2021: 1,888 (5,893.0 per 100,000)
> Cumulative confirmed COVID-19 deaths in Coos County as of May 4, 2021: 41 (128.0 per 100,000)
> Population: 32,038
> Largest place in Coos County: Berlin

Source: Eduardo Munoz Alvarez / Getty Images News via Getty Images
New Jersey: Salem County
> Avg. new daily cases in Salem County in week ending May 4, 2021: 28.8 per 100,000
> Cumulative confirmed COVID-19 cases in Salem County as of May 4, 2021: 5,903 (9,320.1 per 100,000)
> Cumulative confirmed COVID-19 deaths in Salem County as of May 4, 2021: 177 (279.5 per 100,000)
> Population: 63,336
> Largest place in Salem County: Pennsville

Source: thenationalguard / Flickr
New Mexico: De Baca County
> Avg. new daily cases in De Baca County in week ending May 4, 2021: 28.7 per 100,000
> Cumulative confirmed COVID-19 cases in De Baca County as of May 4, 2021: 146 (7,087.4 per 100,000)
> Cumulative confirmed COVID-19 deaths in De Baca County as of May 4, 2021: 1 (48.5 per 100,000)
> Population: 2,060
> Largest place in De Baca County: Fort Sumner

Source: Matthew Trump / Wikimedia Commons
New York: Richmond County
> Avg. new daily cases in Richmond County in week ending May 4, 2021: 33.0 per 100,000
> Cumulative confirmed COVID-19 cases in Richmond County as of May 4, 2021: 73,008 (15,399.3 per 100,000)
> Cumulative confirmed COVID-19 deaths in Richmond County as of May 4, 2021: 1,778 (375.0 per 100,000)
> Population: 474,101
> Largest place in Richmond County: New York

Source: thenationalguard / Flickr
North Carolina: Cherokee County
> Avg. new daily cases in Cherokee County in week ending May 4, 2021: 36.9 per 100,000
> Cumulative confirmed COVID-19 cases in Cherokee County as of May 4, 2021: 2,500 (9,035.7 per 100,000)
> Cumulative confirmed COVID-19 deaths in Cherokee County as of May 4, 2021: 20 (72.3 per 100,000)
> Population: 27,668
> Largest place in Cherokee County: Andrews

Source: thenationalguard / Flickr
North Dakota: Logan County
> Avg. new daily cases in Logan County in week ending May 4, 2021: 54.0 per 100,000
> Cumulative confirmed COVID-19 cases in Logan County as of May 4, 2021: 260 (13,492.5 per 100,000)
> Cumulative confirmed COVID-19 deaths in Logan County as of May 4, 2021: 8 (415.2 per 100,000)
> Population: 1,927
> Largest place in Logan County: Napoleon

Source: pabradyphoto / iStock Editorial via Getty Images
Ohio: Lucas County
> Avg. new daily cases in Lucas County in week ending May 4, 2021: 23.0 per 100,000
> Cumulative confirmed COVID-19 cases in Lucas County as of May 4, 2021: 41,645 (9,631.6 per 100,000)
> Cumulative confirmed COVID-19 deaths in Lucas County as of May 4, 2021: 781 (180.6 per 100,000)
> Population: 432,379
> Largest place in Lucas County: Toledo
These are all the counties in Ohio where COVID-19 is slowing (and where it’s still getting worse).
Source: thenationalguard / Flickr
Oklahoma: Jefferson County
> Avg. new daily cases in Jefferson County in week ending May 4, 2021: 15.1 per 100,000
> Cumulative confirmed COVID-19 cases in Jefferson County as of May 4, 2021: 700 (11,248.6 per 100,000)
> Cumulative confirmed COVID-19 deaths in Jefferson County as of May 4, 2021: 13 (208.9 per 100,000)
> Population: 6,223
> Largest place in Jefferson County: Waurika

Source: icetsarina / Flickr
Oregon: Grant County
> Avg. new daily cases in Grant County in week ending May 4, 2021: 98.6 per 100,000
> Cumulative confirmed COVID-19 cases in Grant County as of May 4, 2021: 493 (6,863.4 per 100,000)
> Cumulative confirmed COVID-19 deaths in Grant County as of May 4, 2021: 4 (55.7 per 100,000)
> Population: 7,183
> Largest place in Grant County: John Day
These are all the counties in Oregon where COVID-19 is slowing (and where it’s still getting worse).
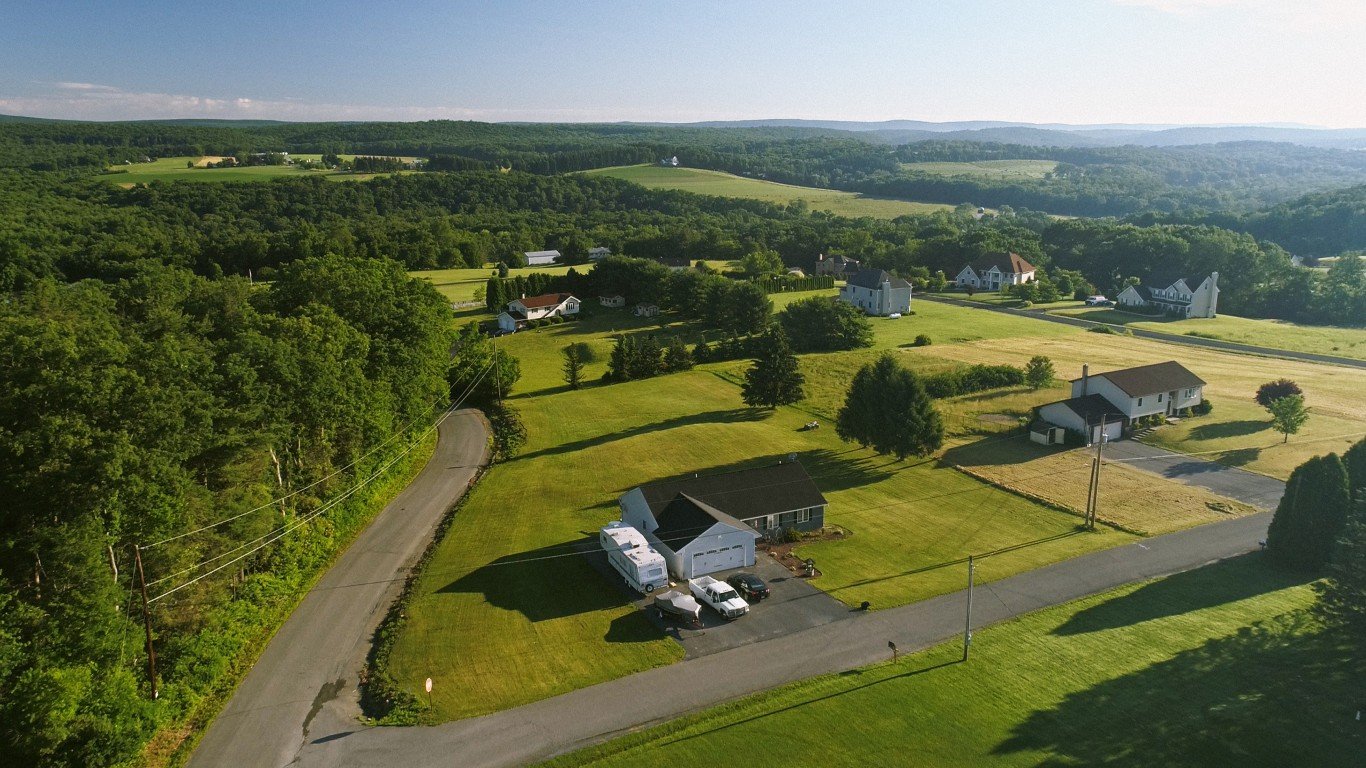
Source: Alex Potemkin / E+ via Getty Images
Pennsylvania: Monroe County
> Avg. new daily cases in Monroe County in week ending May 4, 2021: 42.9 per 100,000
> Cumulative confirmed COVID-19 cases in Monroe County as of May 4, 2021: 14,009 (8,359.3 per 100,000)
> Cumulative confirmed COVID-19 deaths in Monroe County as of May 4, 2021: 300 (179.0 per 100,000)
> Population: 167,586
> Largest place in Monroe County: East Stroudsburg
Source: Image Source / Getty Images
Rhode Island: Newport County
> Avg. new daily cases in Newport County in week ending May 4, 2021: 35.1 per 100,000
> Cumulative confirmed COVID-19 cases in Newport County as of May 4, 2021: 6,603 (7,948.2 per 100,000)
> Cumulative confirmed COVID-19 deaths in Newport County as of May 4, 2021: N/A (N/A per 100,000)
> Population: 83,075
> Largest place in Newport County: Newport
Source: thenationalguard / Flickr
South Carolina: Laurens County
> Avg. new daily cases in Laurens County in week ending May 4, 2021: 27.8 per 100,000
> Cumulative confirmed COVID-19 cases in Laurens County as of May 4, 2021: 7,312 (10,960.9 per 100,000)
> Cumulative confirmed COVID-19 deaths in Laurens County as of May 4, 2021: 170 (254.8 per 100,000)
> Population: 66,710
> Largest place in Laurens County: Laurens

Source: Michael Ciaglo / Getty Images
South Dakota: Hutchinson County
> Avg. new daily cases in Hutchinson County in week ending May 4, 2021: 31.5 per 100,000
> Cumulative confirmed COVID-19 cases in Hutchinson County as of May 4, 2021: 914 (12,494.9 per 100,000)
> Cumulative confirmed COVID-19 deaths in Hutchinson County as of May 4, 2021: 27 (369.1 per 100,000)
> Population: 7,315
> Largest place in Hutchinson County: Parkston

Source: Joel Carillet / iStock Unreleased via Getty Images
Tennessee: Unicoi County
> Avg. new daily cases in Unicoi County in week ending May 4, 2021: 33.9 per 100,000
> Cumulative confirmed COVID-19 cases in Unicoi County as of May 4, 2021: 2,013 (11,321.7 per 100,000)
> Cumulative confirmed COVID-19 deaths in Unicoi County as of May 4, 2021: 49 (275.6 per 100,000)
> Population: 17,780
> Largest place in Unicoi County: Erwin

Source: BOB WESTON / iStock via Getty Images
Texas: Willacy County
> Avg. new daily cases in Willacy County in week ending May 4, 2021: 218.0 per 100,000
> Cumulative confirmed COVID-19 cases in Willacy County as of May 4, 2021: 2,958 (13,597.5 per 100,000)
> Cumulative confirmed COVID-19 deaths in Willacy County as of May 4, 2021: 88 (404.5 per 100,000)
> Population: 21,754
> Largest place in Willacy County: Raymondville
These are all the counties in Texas where COVID-19 is slowing (and where it’s still getting worse).

Source: DenisTangneyJr / iStock via Getty Images
Utah: Box Elder County
> Avg. new daily cases in Box Elder County in week ending May 4, 2021: 16.0 per 100,000
> Cumulative confirmed COVID-19 cases in Box Elder County as of May 4, 2021: 5,281 (9,964.0 per 100,000)
> Cumulative confirmed COVID-19 deaths in Box Elder County as of May 4, 2021: 51 (96.2 per 100,000)
> Population: 53,001
> Largest place in Box Elder County: Brigham City
These are all the counties in Utah where COVID-19 is slowing (and where it’s still getting worse).

Source: DenisTangneyJr / E+ via Getty Images
Vermont: Caledonia County
> Avg. new daily cases in Caledonia County in week ending May 4, 2021: 19.3 per 100,000
> Cumulative confirmed COVID-19 cases in Caledonia County as of May 4, 2021: 986 (3,240.8 per 100,000)
> Cumulative confirmed COVID-19 deaths in Caledonia County as of May 4, 2021: 6 (19.7 per 100,000)
> Population: 30,425
> Largest place in Caledonia County: St. Johnsbury

Source: Public Domain / Wikimedia Commons
Virginia: Caroline County
> Avg. new daily cases in Caroline County in week ending May 4, 2021: 53.2 per 100,000
> Cumulative confirmed COVID-19 cases in Caroline County as of May 4, 2021: 2,555 (8,464.7 per 100,000)
> Cumulative confirmed COVID-19 deaths in Caroline County as of May 4, 2021: 35 (116.0 per 100,000)
> Population: 30,184
> Largest place in Caroline County: Bowling Green

Source: A. Balet / Wikimedia Commons
Washington: Ferry County
> Avg. new daily cases in Ferry County in week ending May 4, 2021: 66.5 per 100,000
> Cumulative confirmed COVID-19 cases in Ferry County as of May 4, 2021: 325 (4,289.9 per 100,000)
> Cumulative confirmed COVID-19 deaths in Ferry County as of May 4, 2021: 4 (52.8 per 100,000)
> Population: 7,576
> Largest place in Ferry County: Republic

Source: thenationalguard / Flickr
West Virginia: Wayne County
> Avg. new daily cases in Wayne County in week ending May 4, 2021: 45.6 per 100,000
> Cumulative confirmed COVID-19 cases in Wayne County as of May 4, 2021: 3,009 (7,391.7 per 100,000)
> Cumulative confirmed COVID-19 deaths in Wayne County as of May 4, 2021: 40 (98.3 per 100,000)
> Population: 40,708
> Largest place in Wayne County: Huntington
Source: Jacob Boomsma / iStock via Getty Images
Wisconsin: Sawyer County
> Avg. new daily cases in Sawyer County in week ending May 4, 2021: 34.9 per 100,000
> Cumulative confirmed COVID-19 cases in Sawyer County as of May 4, 2021: 1,715 (10,476.5 per 100,000)
> Cumulative confirmed COVID-19 deaths in Sawyer County as of May 4, 2021: 26 (158.8 per 100,000)
> Population: 16,370
> Largest place in Sawyer County: Hayward

Source: BOB WESTON / iStock via Getty Images
Wyoming: Albany County
> Avg. new daily cases in Albany County in week ending May 4, 2021: 22.9 per 100,000
> Cumulative confirmed COVID-19 cases in Albany County as of May 4, 2021: 4,242 (11,133.3 per 100,000)
> Cumulative confirmed COVID-19 deaths in Albany County as of May 4, 2021: 11 (28.9 per 100,000)
> Population: 38,102
> Largest place in Albany County: Laramie
Click here to see all coronavirus data for every state.
Sponsored: Attention Savvy Investors: Speak to 3 Financial Experts – FREE
Ever wanted an extra set of eyes on an investment you’re considering? Now you can speak with up to 3 financial experts in your area for FREE. By simply
clicking here you can begin to match with financial professionals who can help guide you through the financial decisions you’re making. And the best part? The first conversation with them is free.
Click here to match with up to 3 financial pros who would be excited to help you make financial decisions.
Thank you for reading! Have some feedback for us?
Contact the 24/7 Wall St. editorial team.
Editors' Picks


