
The U.S. reported over 61,000 new cases of coronavirus on May 11, bringing the total count to more than 32.3 million confirmed cases of COVID-19. There have been more than 576,000 COVID-19-related deaths — the highest death toll of any country.
New cases continue to rise at a steady rate. In the past week, there were an average of 14.1 daily new coronavirus cases per 100,000 Americans — essentially unchanged from the week prior, when there were an average of 15.7 daily new coronavirus cases per 100,000 people.
While new data shows that the risk of contracting COVID-19 is high in almost every part of the country, cities continue to be the sites of major outbreaks and superspreader events. Experts agree that the virus is more likely to spread in group settings where large numbers of people routinely have close contact with one another, such as colleges, nursing homes, bars, and restaurants. Metropolitan areas with a high degree of connectivity between different neighborhoods and a large population may be particularly at-risk.
The metro areas with the highest incidence of COVID-19 cases are distributed relatively unevenly across the United States. Of the 50 metro areas with the highest case counts per capita, 20 are in the South, 18 are in the Midwest, 11 are in the West, and one are in the Northeast.
The five metro areas with the highest number of coronavirus cases per capita are: Yuma, AZ; Bismarck, ND; Sioux Falls, SD; El Paso, TX; and Laredo, TX. The incidence of COVID-19 in these metro areas range from 17,733.5 cases per 100,000 to 15,990.4 cases per 100,000. For comparison, there are currently 10,032.8 cases per 100,000 Americans nationwide.
The 50 cities with the highest incidence of COVID-19 have over 3,400 more coronavirus cases per capita than the U.S. as a whole, and cases are still growing at a steady pace. There were an average of 14.5 daily new coronavirus cases per 100,000 people in the week ending May 11, roughly unchanged from the week prior, when there were an average of 16.9 daily new coronavirus cases per 100,000 people. In six of the 50 cities with the highest COVID-19 incidence, new cases are rising at an increasing rate.
To determine the cities with the most COVID-19 cases, 24/7 Wall St. compiled and reviewed data from state and local health departments. We ranked metro areas based on the number of confirmed COVID-19 cases per 100,000 residents as of May 11. To estimate the incidence of COVID-19 at the metropolitan level, we aggregated data from the county level using boundary definitions from the U.S. Census Bureau. Population data used to adjust case and death totals came from the U.S. Census Bureau’s 2019 American Community Survey and are five-year estimates. Unemployment data is from the Bureau of Labor Statistics and is seasonally adjusted.
Source: ghornephoto / Getty Images
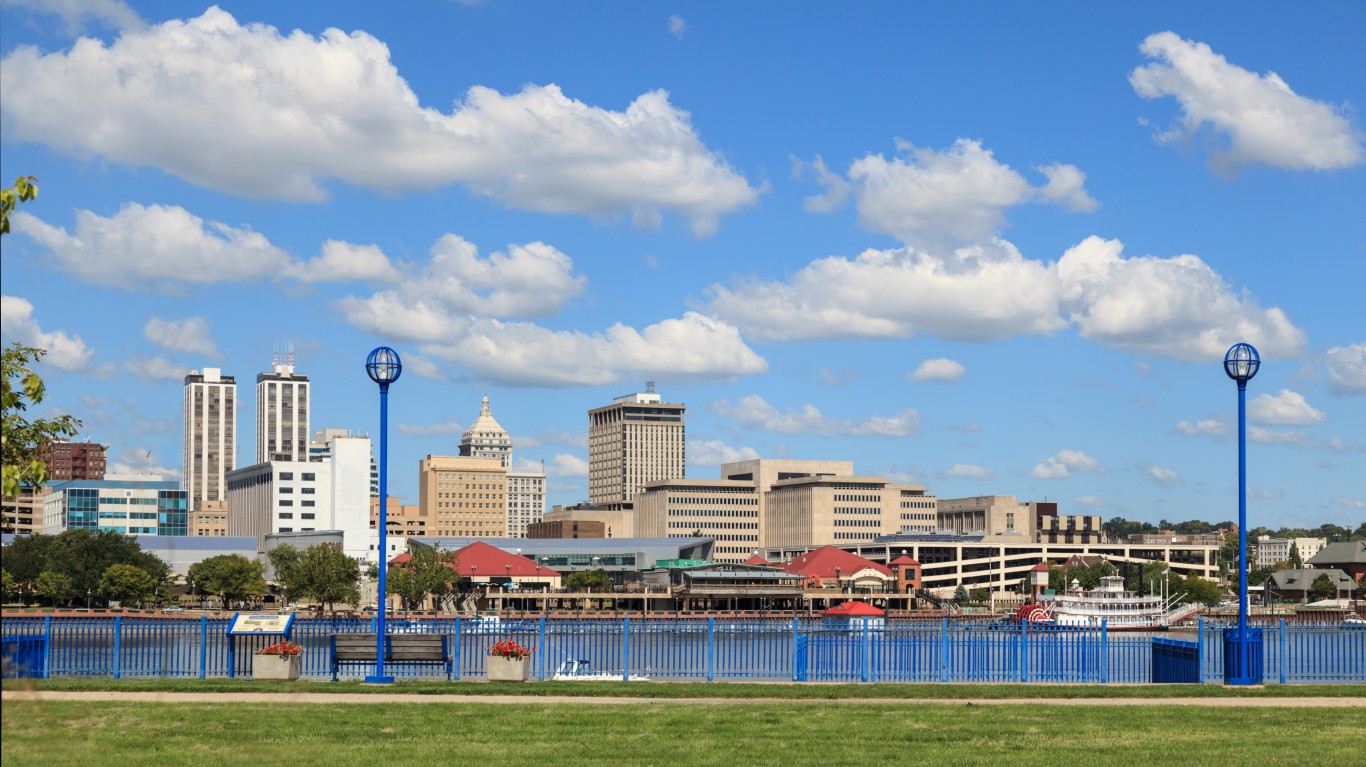
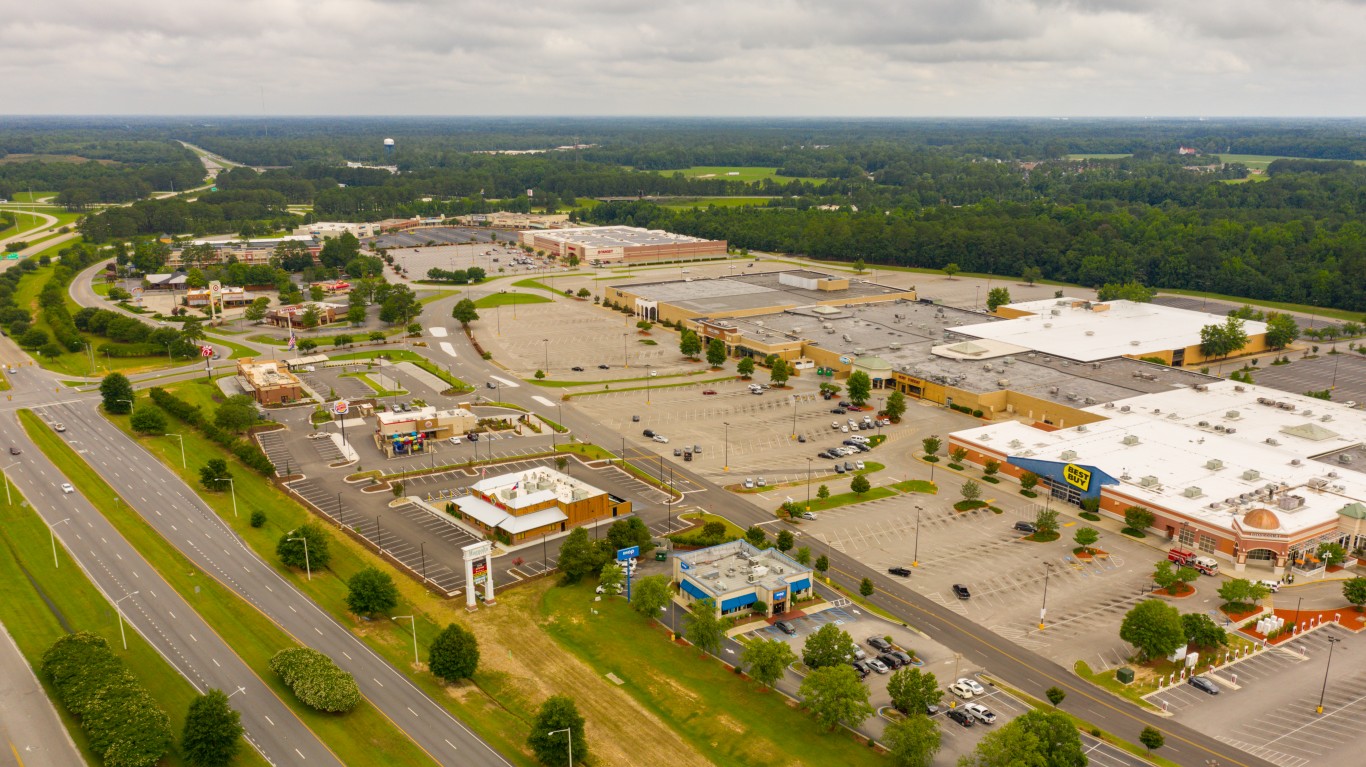
50. Peoria, IL
> Confirmed COVID-19 cases as of May 11: 50,103
> Confirmed COVID-19 cases as of May 11 per 100,000 residents: 12,313.9
> Cumulative COVID-19 deaths as of May 11: 754
> Cumulative COVID-19 deaths as of May 11 per 100,000 residents: 185.3
> Population: 406,883

Source: DenisTangneyJr / iStock via Getty Images
49. St. George, UT
> Confirmed COVID-19 cases as of May 11: 20,522
> Confirmed COVID-19 cases as of May 11 per 100,000 residents: 12,376.7
> Cumulative COVID-19 deaths as of May 11: 204
> Cumulative COVID-19 deaths as of May 11 per 100,000 residents: 123.0
> Population: 165,811
These are all the counties in Utah where COVID-19 is slowing (and where it’s still getting worse).

Source: Public Domain / Wikimedia Commons
48. Morristown, TN
> Confirmed COVID-19 cases as of May 11: 17,449
> Confirmed COVID-19 cases as of May 11 per 100,000 residents: 12,382.9
> Cumulative COVID-19 deaths as of May 11: 347
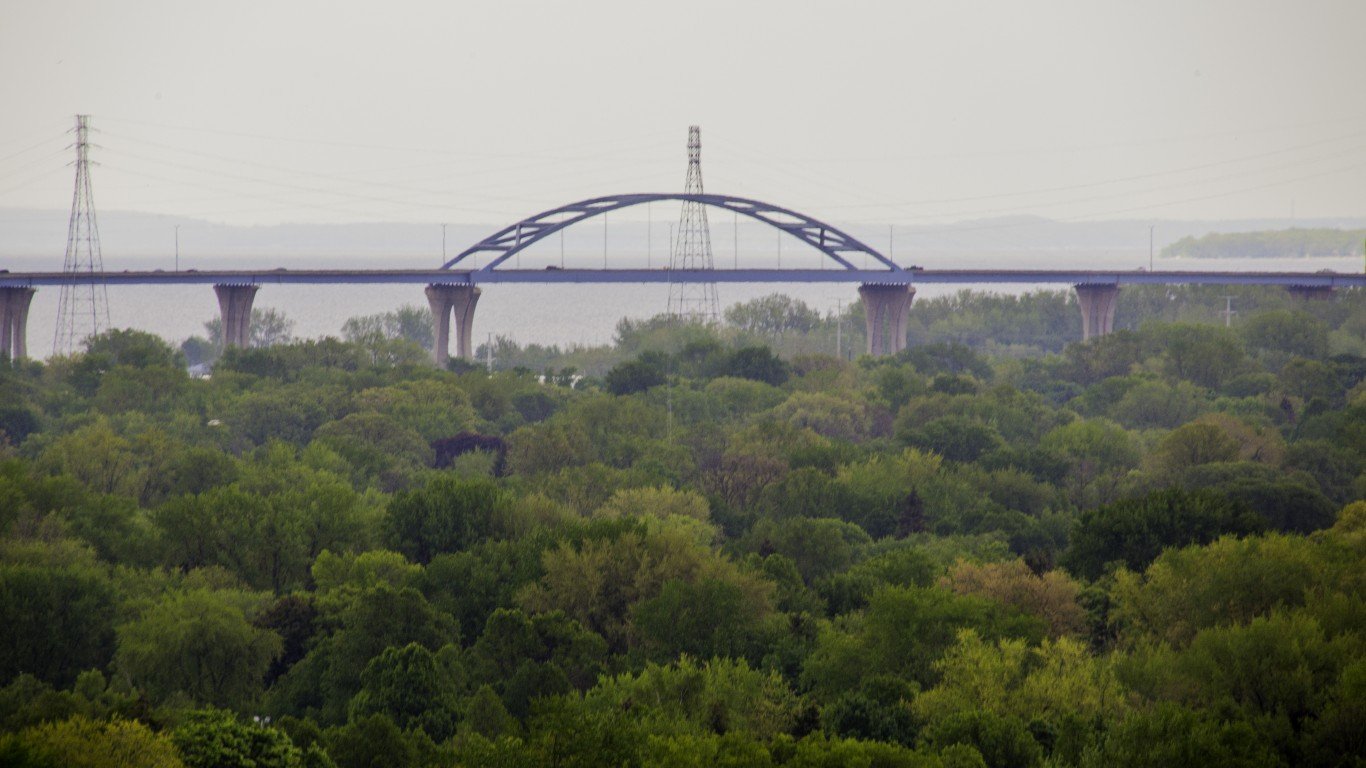
> Cumulative COVID-19 deaths as of May 11 per 100,000 residents: 246.3
> Population: 140,912

Source: DavidByronKeener / Getty Images
47. Idaho Falls, ID
> Confirmed COVID-19 cases as of May 11: 18,064
> Confirmed COVID-19 cases as of May 11 per 100,000 residents: 12,414.5
> Cumulative COVID-19 deaths as of May 11: 198
> Cumulative COVID-19 deaths as of May 11 per 100,000 residents: 136.1
> Population: 145,507
These are all the counties in Idaho where COVID-19 is slowing (and where it’s still getting worse).

Source: Davel5957 / iStock via Getty Images
46. Omaha-Council Bluffs, NE-IA
> Confirmed COVID-19 cases as of May 11: 115,773
> Confirmed COVID-19 cases as of May 11 per 100,000 residents: 12,424.9
> Cumulative COVID-19 deaths as of May 11: 1,120
> Cumulative COVID-19 deaths as of May 11 per 100,000 residents: 120.2
> Population: 931,779

Source: DenisTangneyJr / iStock via Getty Images
45. Oshkosh-Neenah, WI
> Confirmed COVID-19 cases as of May 11: 21,221
> Confirmed COVID-19 cases as of May 11 per 100,000 residents: 12,452.8
> Cumulative COVID-19 deaths as of May 11: 219
> Cumulative COVID-19 deaths as of May 11 per 100,000 residents: 128.5
> Population: 170,411

Source: Davel5957 / iStock via Getty Images
44. Phoenix-Mesa-Chandler, AZ
> Confirmed COVID-19 cases as of May 11: 593,370
> Confirmed COVID-19 cases as of May 11 per 100,000 residents: 12,461.6
> Cumulative COVID-19 deaths as of May 11: 10,798
> Cumulative COVID-19 deaths as of May 11 per 100,000 residents: 226.8
> Population: 4,761,603

Source: traveler1116 / iStock via Getty Images
43. Tuscaloosa, AL
> Confirmed COVID-19 cases as of May 11: 31,271
> Confirmed COVID-19 cases as of May 11 per 100,000 residents: 12,474.4
> Cumulative COVID-19 deaths as of May 11: 624
> Cumulative COVID-19 deaths as of May 11 per 100,000 residents: 248.9
> Population: 250,681

Source: Sean Pavone / iStock via Getty Images
42. Providence-Warwick, RI-MA
> Confirmed COVID-19 cases as of May 11: 202,419
> Confirmed COVID-19 cases as of May 11 per 100,000 residents: 12,508.4
> Cumulative COVID-19 deaths as of May 11: N/A
> Cumulative COVID-19 deaths as of May 11 per 100,000 residents: N/A
> Population: 1,618,268

Source: DenisTangneyJr / iStock via Getty Images
41. Logan, UT-ID
> Confirmed COVID-19 cases as of May 11: 17,235
> Confirmed COVID-19 cases as of May 11 per 100,000 residents: 12,522.8
> Cumulative COVID-19 deaths as of May 11: 64
> Cumulative COVID-19 deaths as of May 11 per 100,000 residents: 46.5
> Population: 137,629
These are all the counties in Utah where COVID-19 is slowing (and where it’s still getting worse).
Source: BOB WESTON / iStock via Getty Images
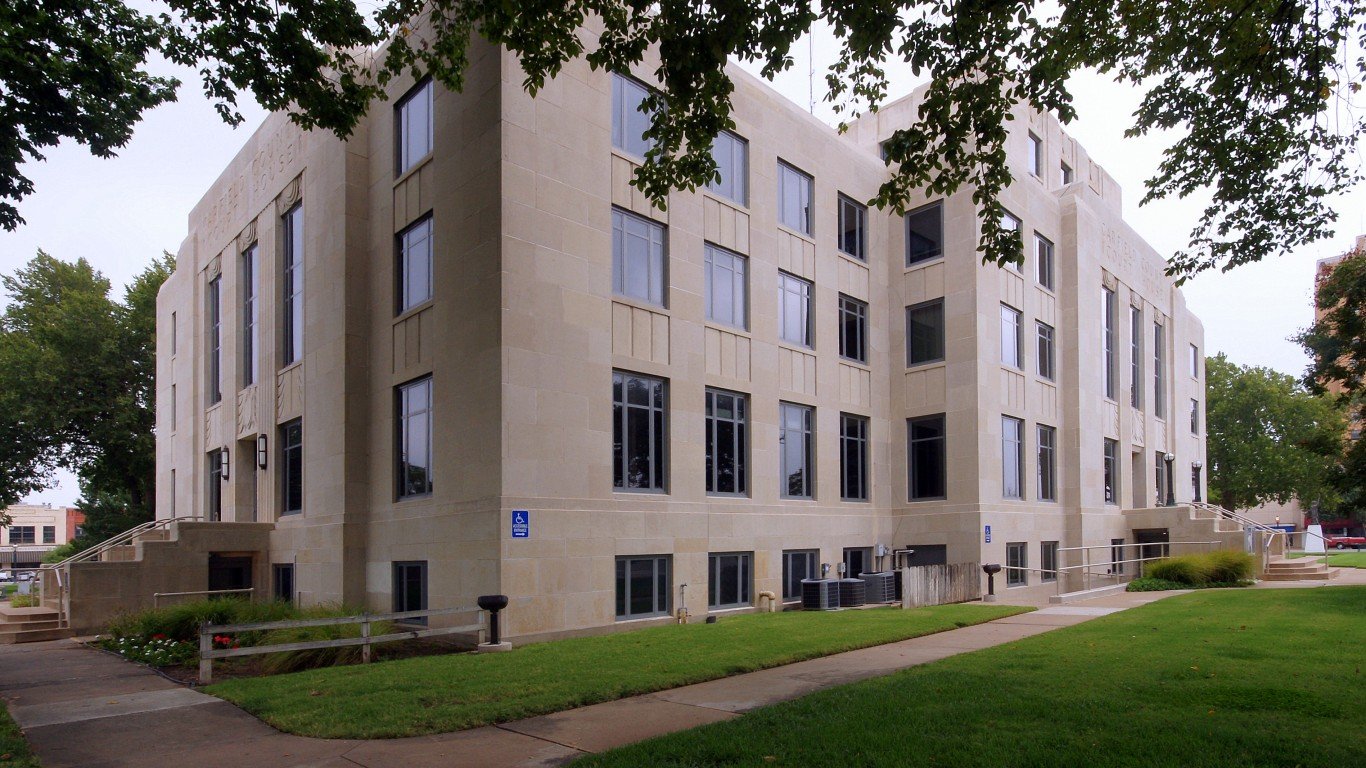
40. Enid, OK
> Confirmed COVID-19 cases as of May 11: 7,797
> Confirmed COVID-19 cases as of May 11 per 100,000 residents: 12,596.5
> Cumulative COVID-19 deaths as of May 11: 128
> Cumulative COVID-19 deaths as of May 11 per 100,000 residents: 206.8
> Population: 61,898

Source: frankix / Getty Images
39. Flagstaff, AZ
> Confirmed COVID-19 cases as of May 11: 17,841
> Confirmed COVID-19 cases as of May 11 per 100,000 residents: 12,628.7
> Cumulative COVID-19 deaths as of May 11: 330
> Cumulative COVID-19 deaths as of May 11 per 100,000 residents: 233.6
> Population: 141,274

Source: jjneff / Getty Images
38. Anniston-Oxford, AL
> Confirmed COVID-19 cases as of May 11: 14,501
> Confirmed COVID-19 cases as of May 11 per 100,000 residents: 12,651.6
> Cumulative COVID-19 deaths as of May 11: 314
> Cumulative COVID-19 deaths as of May 11 per 100,000 residents: 274.0
> Population: 114,618
Source: BOB WESTON / iStock via Getty Images
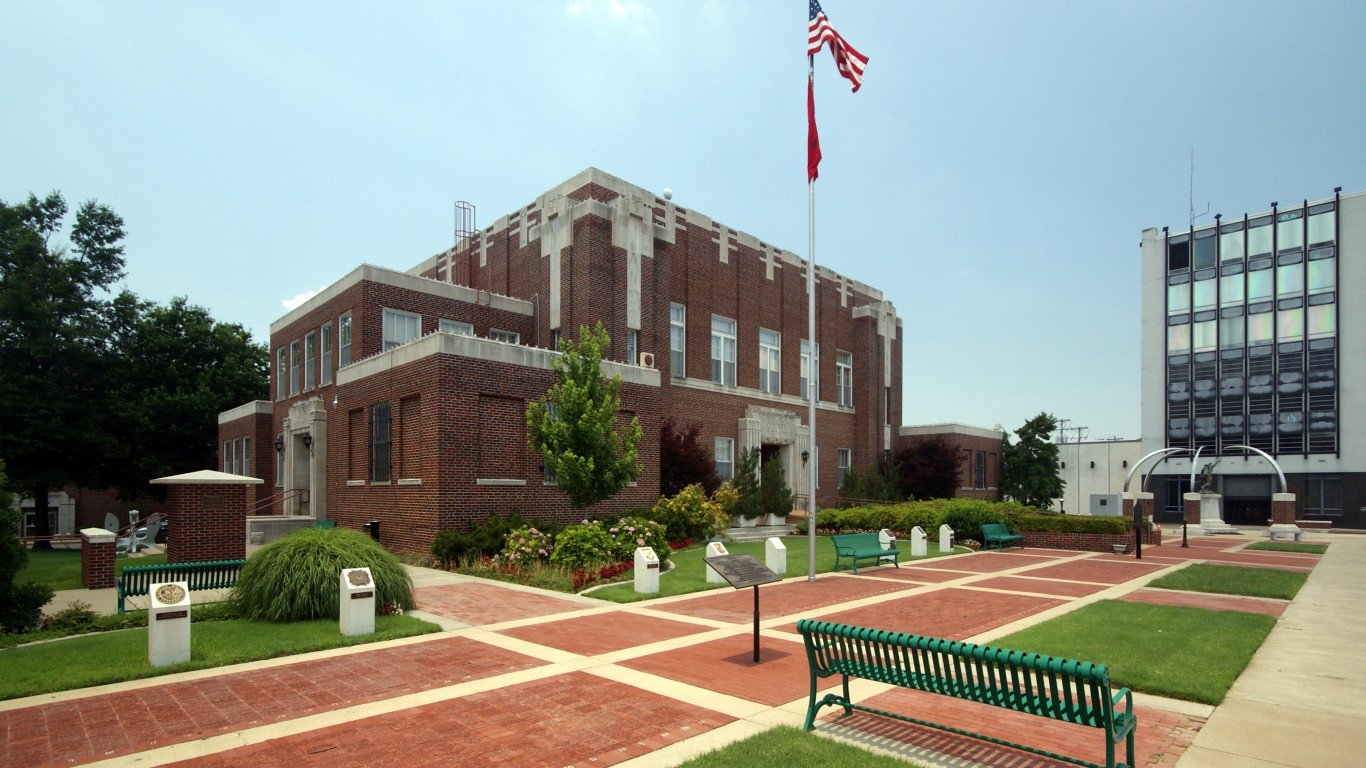
37. Jonesboro, AR
> Confirmed COVID-19 cases as of May 11: 16,612
> Confirmed COVID-19 cases as of May 11 per 100,000 residents: 12,657.6
> Cumulative COVID-19 deaths as of May 11: 256
> Cumulative COVID-19 deaths as of May 11 per 100,000 residents: 195.1
> Population: 131,241

Source: DenisTangneyJr / Getty Images
36. Racine, WI
> Confirmed COVID-19 cases as of May 11: 24,790
> Confirmed COVID-19 cases as of May 11 per 100,000 residents: 12,673.7
> Cumulative COVID-19 deaths as of May 11: 375
> Cumulative COVID-19 deaths as of May 11 per 100,000 residents: 191.7
> Population: 195,602
Source: DenisTangneyJr / iStock via Getty Images
35. Sheboygan, WI
> Confirmed COVID-19 cases as of May 11: 14,645
> Confirmed COVID-19 cases as of May 11 per 100,000 residents: 12,715.1
> Cumulative COVID-19 deaths as of May 11: 153
> Cumulative COVID-19 deaths as of May 11 per 100,000 residents: 132.8
> Population: 115,178

Source: Nicola Patterson / iStock via Getty Images
34. Kankakee, IL
> Confirmed COVID-19 cases as of May 11: 14,074
> Confirmed COVID-19 cases as of May 11 per 100,000 residents: 12,720.9
> Cumulative COVID-19 deaths as of May 11: 209
> Cumulative COVID-19 deaths as of May 11 per 100,000 residents: 188.9
> Population: 110,637
Source: felixmizioznikov / Getty Images
33. Florence, SC
> Confirmed COVID-19 cases as of May 11: 26,153
> Confirmed COVID-19 cases as of May 11 per 100,000 residents: 12,726.4
> Cumulative COVID-19 deaths as of May 11: 588
> Cumulative COVID-19 deaths as of May 11 per 100,000 residents: 286.1
> Population: 205,502
Source: Aaron Yoder / iStock via Getty Images
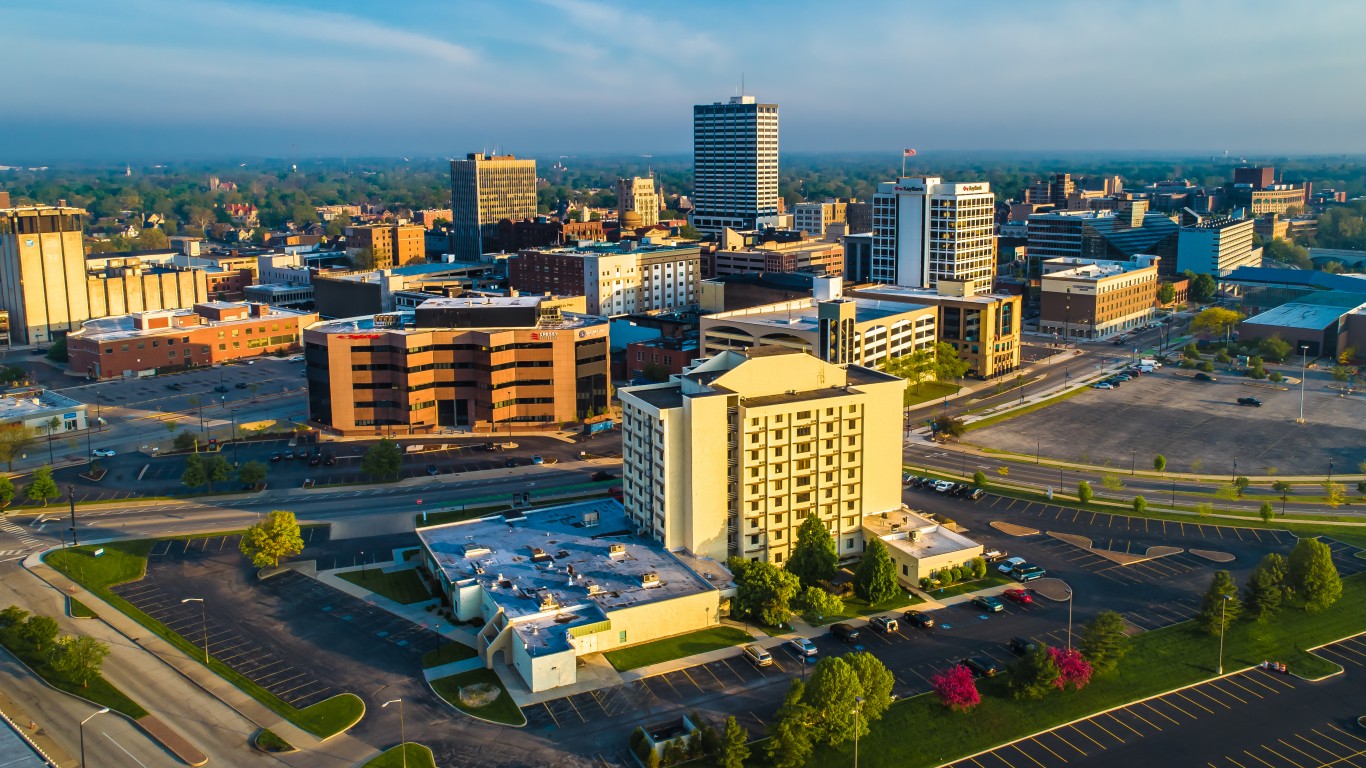
32. South Bend-Mishawaka, IN-MI
> Confirmed COVID-19 cases as of May 11: 40,946
> Confirmed COVID-19 cases as of May 11 per 100,000 residents: 12,726.5
> Cumulative COVID-19 deaths as of May 11: 624
> Cumulative COVID-19 deaths as of May 11 per 100,000 residents: 193.9
> Population: 321,739

Source: DenisTangneyJr / Getty Images
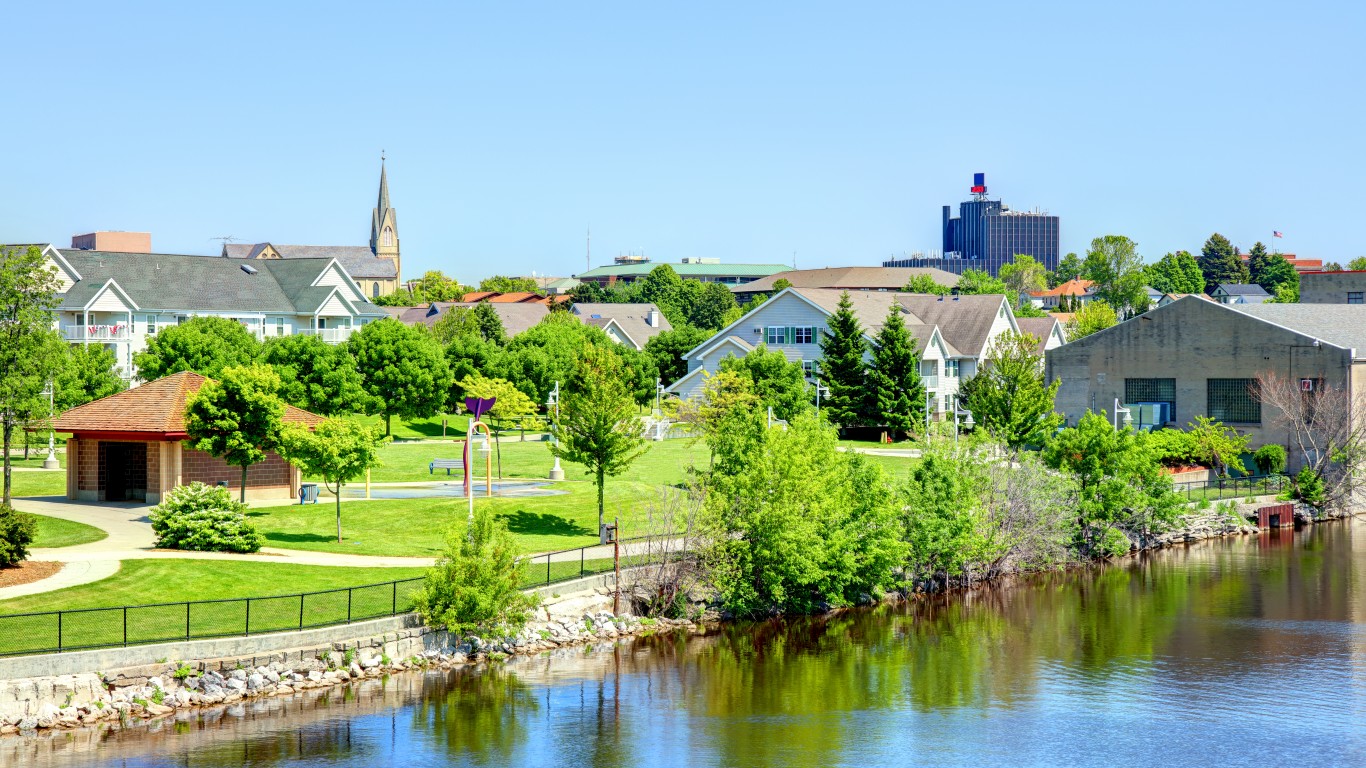
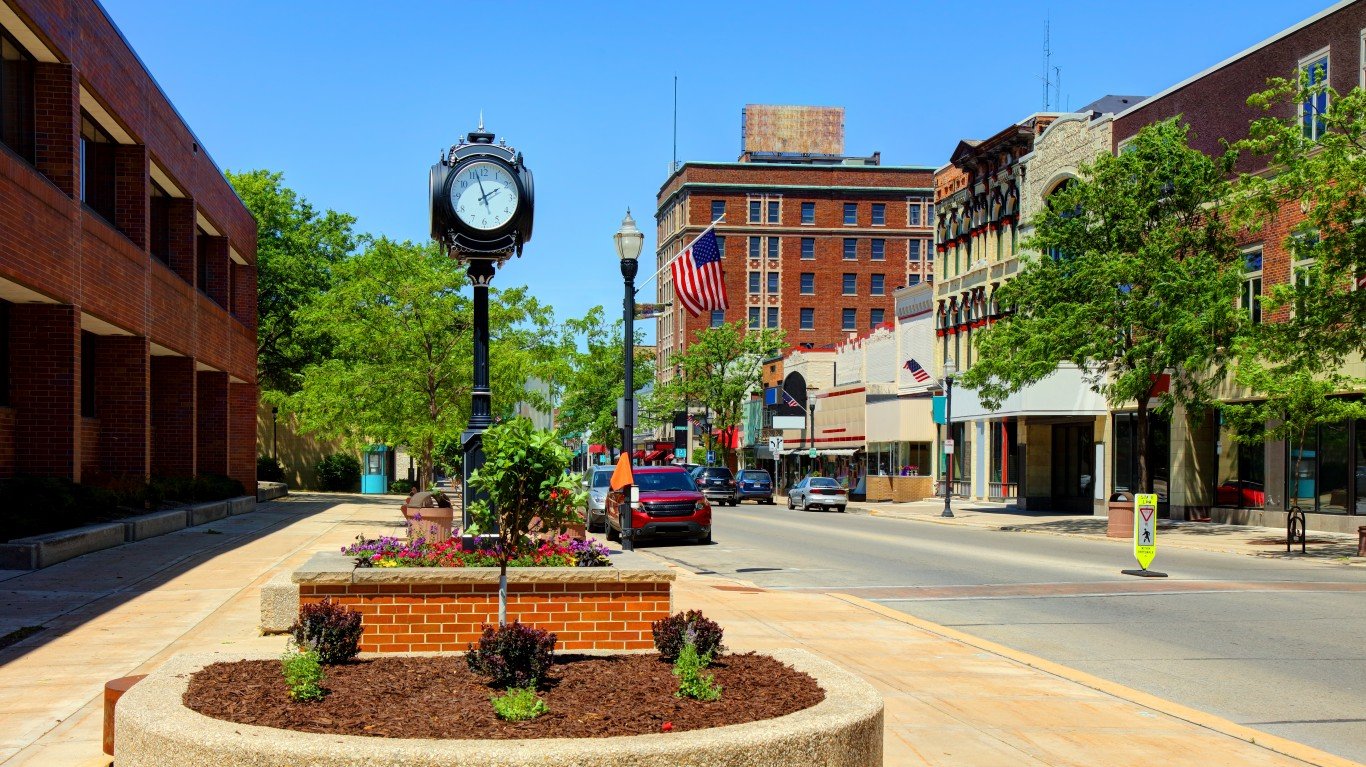
31. Appleton, WI
> Confirmed COVID-19 cases as of May 11: 30,022
> Confirmed COVID-19 cases as of May 11 per 100,000 residents: 12,741.3
> Cumulative COVID-19 deaths as of May 11: 277
> Cumulative COVID-19 deaths as of May 11 per 100,000 residents: 117.6
> Population: 235,628

Source: 4kodiak / Getty Images
30. Salt Lake City, UT
> Confirmed COVID-19 cases as of May 11: 156,328
> Confirmed COVID-19 cases as of May 11 per 100,000 residents: 13,016.0
> Cumulative COVID-19 deaths as of May 11: 898
> Cumulative COVID-19 deaths as of May 11 per 100,000 residents: 74.8
> Population: 1,201,043
These are all the counties in Utah where COVID-19 is slowing (and where it’s still getting worse).

Source: DenisTangneyJr / iStock via Getty Images
29. Riverside-San Bernardino-Ontario, CA
> Confirmed COVID-19 cases as of May 11: 595,660
> Confirmed COVID-19 cases as of May 11 per 100,000 residents: 13,061.4
> Cumulative COVID-19 deaths as of May 11: 9,294
> Cumulative COVID-19 deaths as of May 11 per 100,000 residents: 203.8
> Population: 4,560,470
Source: DenisTangneyJr / Getty Images
28. Fond du Lac, WI
> Confirmed COVID-19 cases as of May 11: 13,621
> Confirmed COVID-19 cases as of May 11 per 100,000 residents: 13,276.2
> Cumulative COVID-19 deaths as of May 11: 121
> Cumulative COVID-19 deaths as of May 11 per 100,000 residents: 117.9
> Population: 102,597

Source: Vito Palmisano / iStock via Getty Images
27. Nashville-Davidson–Murfreesboro–Franklin, TN
> Confirmed COVID-19 cases as of May 11: 248,698
> Confirmed COVID-19 cases as of May 11 per 100,000 residents: 13,285.8
> Cumulative COVID-19 deaths as of May 11: 2,805
> Cumulative COVID-19 deaths as of May 11 per 100,000 residents: 149.8
> Population: 1,871,903
Source: DenisTangneyJr / Getty Images
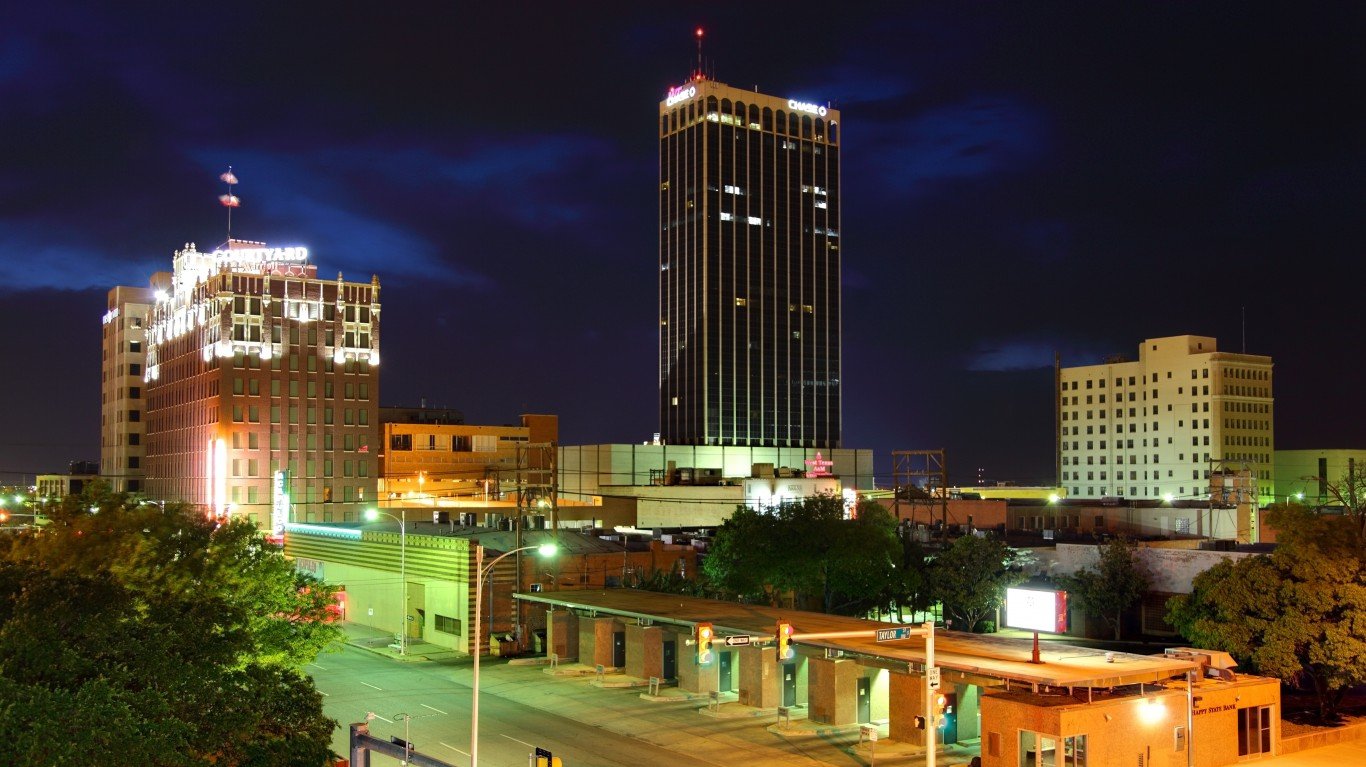
26. Amarillo, TX
> Confirmed COVID-19 cases as of May 11: 35,128
> Confirmed COVID-19 cases as of May 11 per 100,000 residents: 13,317.4
> Cumulative COVID-19 deaths as of May 11: 755
> Cumulative COVID-19 deaths as of May 11 per 100,000 residents: 286.2
> Population: 263,776
These are all the counties in Texas where COVID-19 is slowing (and where it’s still getting worse).
Source: ImagesbyK / Getty Images
25. Green Bay, WI
> Confirmed COVID-19 cases as of May 11: 42,815
> Confirmed COVID-19 cases as of May 11 per 100,000 residents: 13,404.8
> Cumulative COVID-19 deaths as of May 11: 388
> Cumulative COVID-19 deaths as of May 11 per 100,000 residents: 121.5
> Population: 319,401
Source: Kruck20 / Getty Images
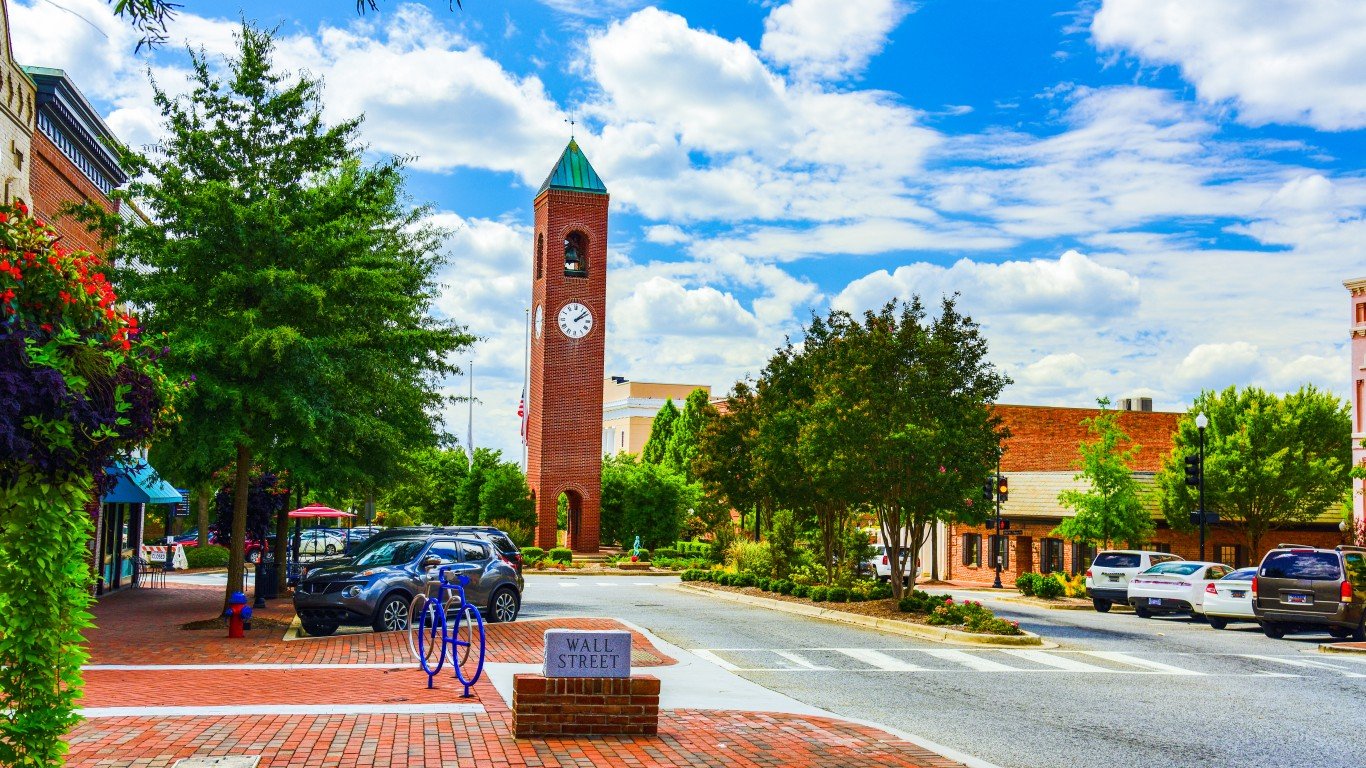
24. Spartanburg, SC
> Confirmed COVID-19 cases as of May 11: 41,249
> Confirmed COVID-19 cases as of May 11 per 100,000 residents: 13,409.2
> Cumulative COVID-19 deaths as of May 11: 806
> Cumulative COVID-19 deaths as of May 11 per 100,000 residents: 262.0
> Population: 307,617
Source: Public Domain / Wikimedia Commons
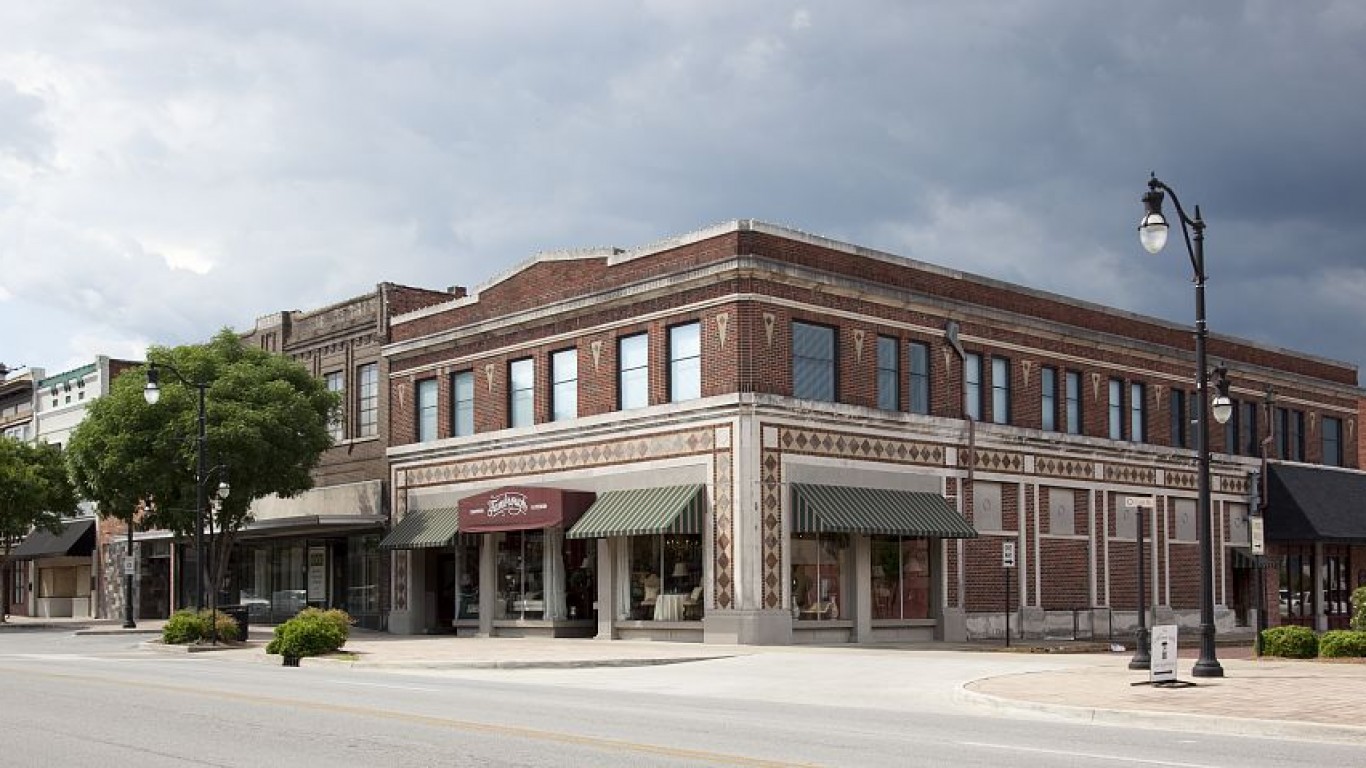
23. Gadsden, AL
> Confirmed COVID-19 cases as of May 11: 13,831
> Confirmed COVID-19 cases as of May 11 per 100,000 residents: 13,461.1
> Cumulative COVID-19 deaths as of May 11: 353
> Cumulative COVID-19 deaths as of May 11 per 100,000 residents: 343.6
> Population: 102,748
Source: DenisTangneyJr / iStock Unreleased via Getty Images
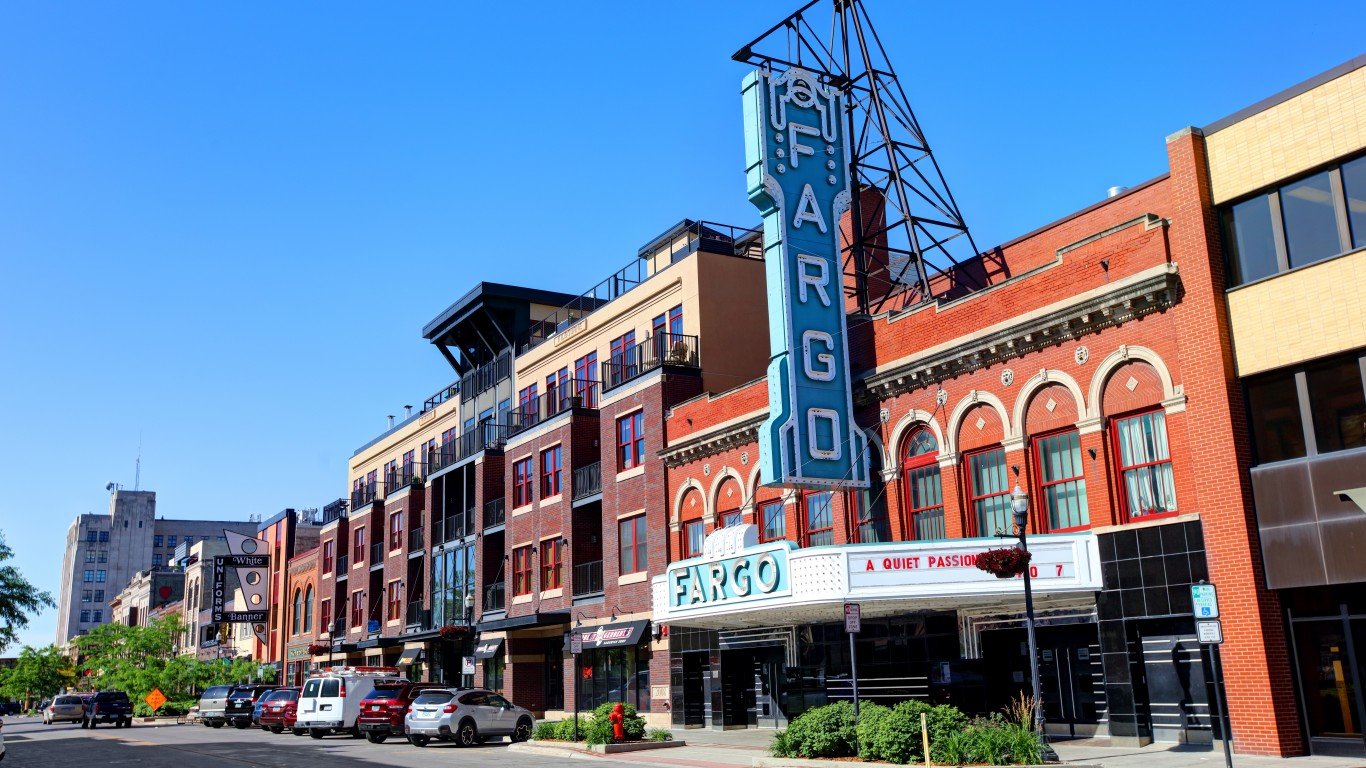
22. Fargo, ND-MN
> Confirmed COVID-19 cases as of May 11: 32,537
> Confirmed COVID-19 cases as of May 11 per 100,000 residents: 13,533.3
> Cumulative COVID-19 deaths as of May 11: 300
> Cumulative COVID-19 deaths as of May 11 per 100,000 residents: 124.8
> Population: 240,421

Source: BOB WESTON / Getty Images
21. Gainesville, GA
> Confirmed COVID-19 cases as of May 11: 27,242
> Confirmed COVID-19 cases as of May 11 per 100,000 residents: 13,712.4
> Cumulative COVID-19 deaths as of May 11: 468
> Cumulative COVID-19 deaths as of May 11 per 100,000 residents: 235.6
> Population: 198,667

Source: SeanPavonePhoto / iStock
20. Greenville-Anderson, SC
> Confirmed COVID-19 cases as of May 11: 123,125
> Confirmed COVID-19 cases as of May 11 per 100,000 residents: 13,742.5
> Cumulative COVID-19 deaths as of May 11: 1,992
> Cumulative COVID-19 deaths as of May 11 per 100,000 residents: 222.3
> Population: 895,942

Source: cosmonaut / Getty Images
19. Dubuque, IA
> Confirmed COVID-19 cases as of May 11: 13,351
> Confirmed COVID-19 cases as of May 11 per 100,000 residents: 13,766.5
> Cumulative COVID-19 deaths as of May 11: 209
> Cumulative COVID-19 deaths as of May 11 per 100,000 residents: 215.5
> Population: 96,982
These are all the counties in Iowa where COVID-19 is slowing (and where it’s still getting worse).
Source: Tiago_Fernandez / iStock Editorial via Getty Images
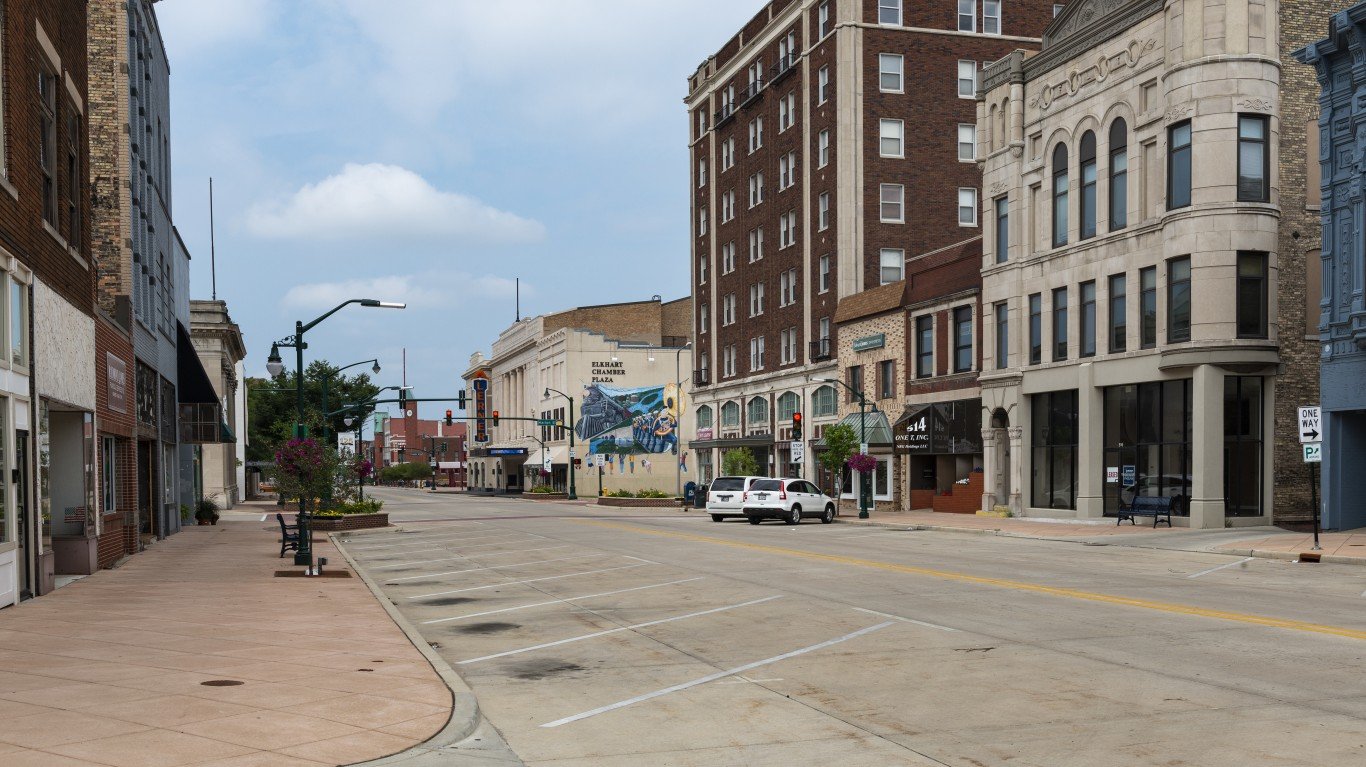
18. Elkhart-Goshen, IN
> Confirmed COVID-19 cases as of May 11: 28,514
> Confirmed COVID-19 cases as of May 11 per 100,000 residents: 13,939.3
> Cumulative COVID-19 deaths as of May 11: 442
> Cumulative COVID-19 deaths as of May 11 per 100,000 residents: 216.1
> Population: 204,558

17. St. Cloud, MN
> Confirmed COVID-19 cases as of May 11: 27,713
> Confirmed COVID-19 cases as of May 11 per 100,000 residents: 13,955.5
> Cumulative COVID-19 deaths as of May 11: 318
> Cumulative COVID-19 deaths as of May 11 per 100,000 residents: 160.1
> Population: 198,581

16. Cleveland, TN
> Confirmed COVID-19 cases as of May 11: 17,110
> Confirmed COVID-19 cases as of May 11 per 100,000 residents: 13,960.2
> Cumulative COVID-19 deaths as of May 11: 174
> Cumulative COVID-19 deaths as of May 11 per 100,000 residents: 142.0
> Population: 122,563
Source: DenisTangneyJr / Getty Images
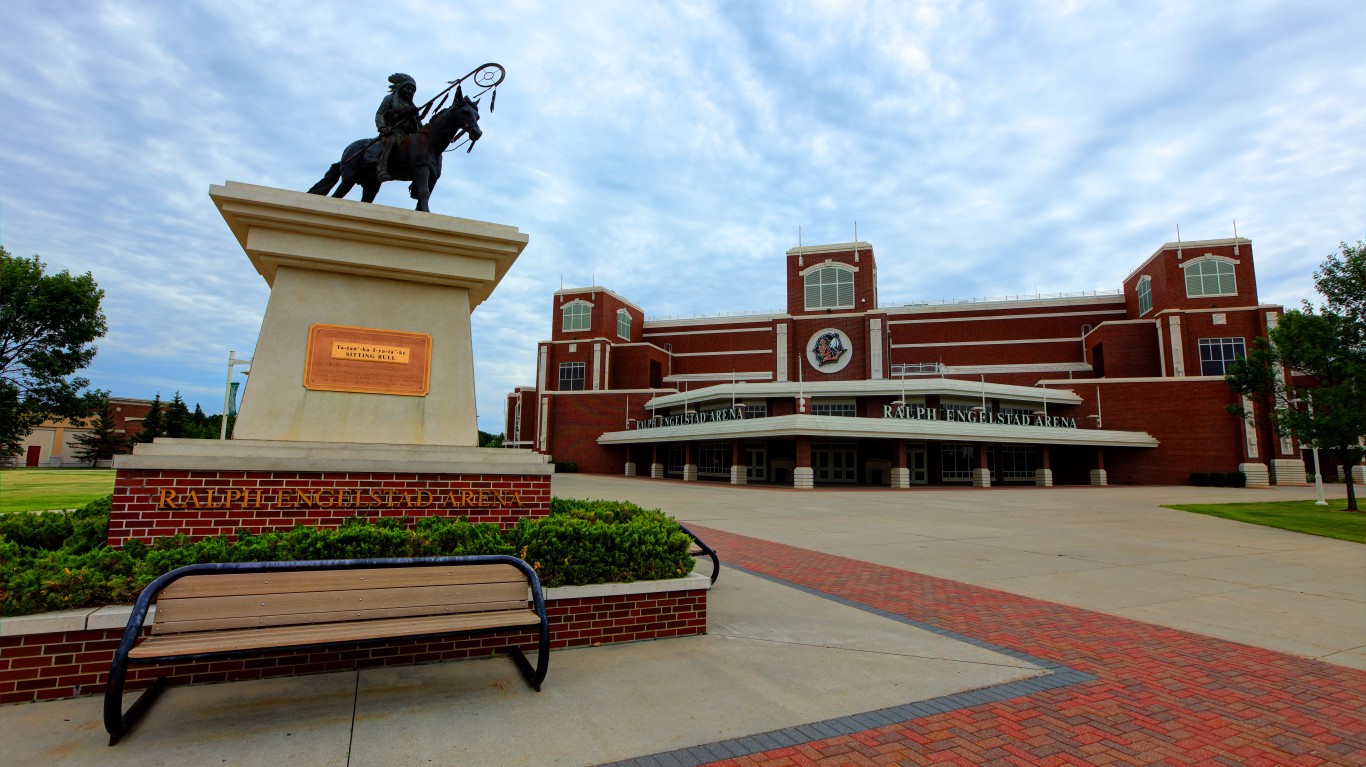
15. Grand Forks, ND-MN
> Confirmed COVID-19 cases as of May 11: 14,406
> Confirmed COVID-19 cases as of May 11 per 100,000 residents: 14,158.9
> Cumulative COVID-19 deaths as of May 11: 145
> Cumulative COVID-19 deaths as of May 11 per 100,000 residents: 142.5
> Population: 101,745
Source: DenisTangneyJr / Getty Images
14. San Angelo, TX
> Confirmed COVID-19 cases as of May 11: 16,809
> Confirmed COVID-19 cases as of May 11 per 100,000 residents: 14,246.6
> Cumulative COVID-19 deaths as of May 11: 269
> Cumulative COVID-19 deaths as of May 11 per 100,000 residents: 228.0
> Population: 117,986
These are all the counties in Texas where COVID-19 is slowing (and where it’s still getting worse).

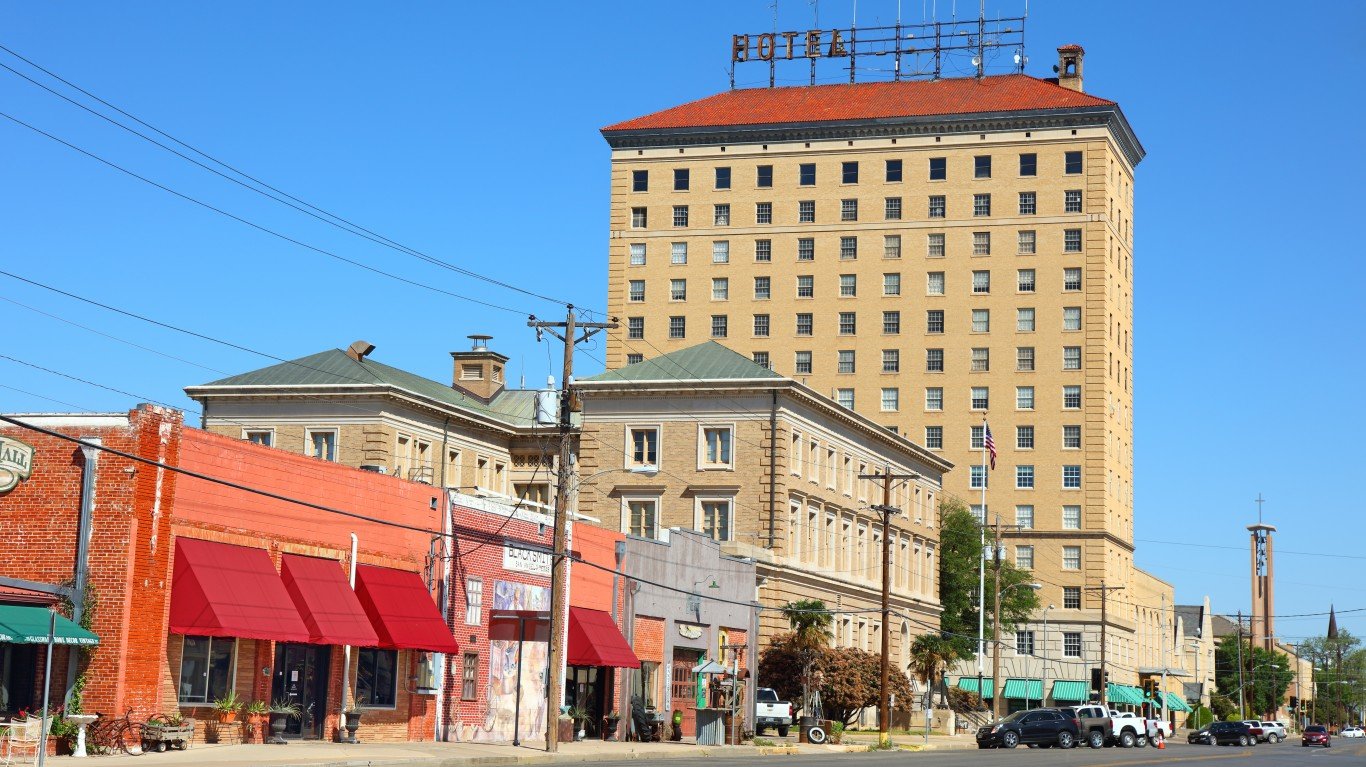
13. Pine Bluff, AR
> Confirmed COVID-19 cases as of May 11: 13,039
> Confirmed COVID-19 cases as of May 11 per 100,000 residents: 14,349.9
> Cumulative COVID-19 deaths as of May 11: 239
> Cumulative COVID-19 deaths as of May 11 per 100,000 residents: 263.0
> Population: 90,865
Source: Art Wager / E+ via Getty Images
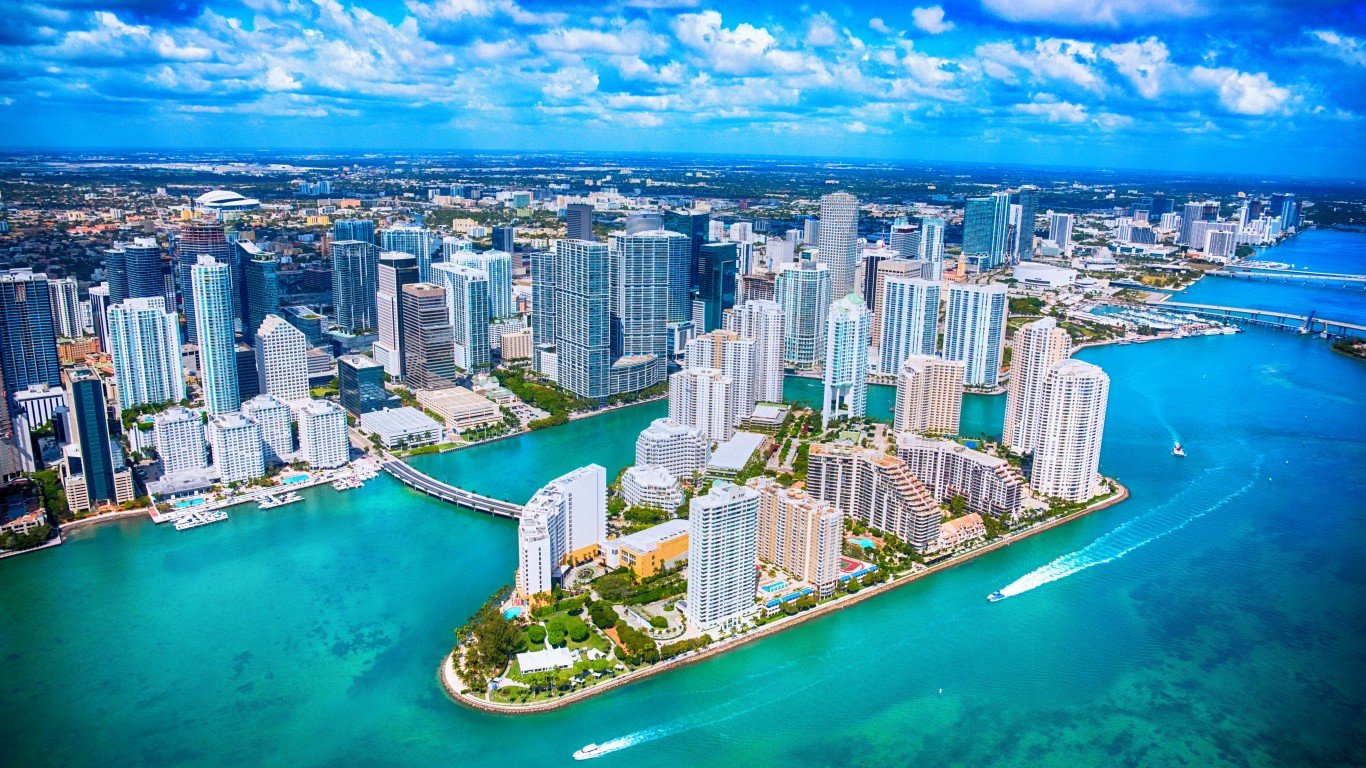
12. Miami-Fort Lauderdale-Pompano Beach, FL
> Confirmed COVID-19 cases as of May 11: 875,771
> Confirmed COVID-19 cases as of May 11 per 100,000 residents: 14,378.9
> Cumulative COVID-19 deaths as of May 11: 12,004
> Cumulative COVID-19 deaths as of May 11 per 100,000 residents: 197.1
> Population: 6,090,660
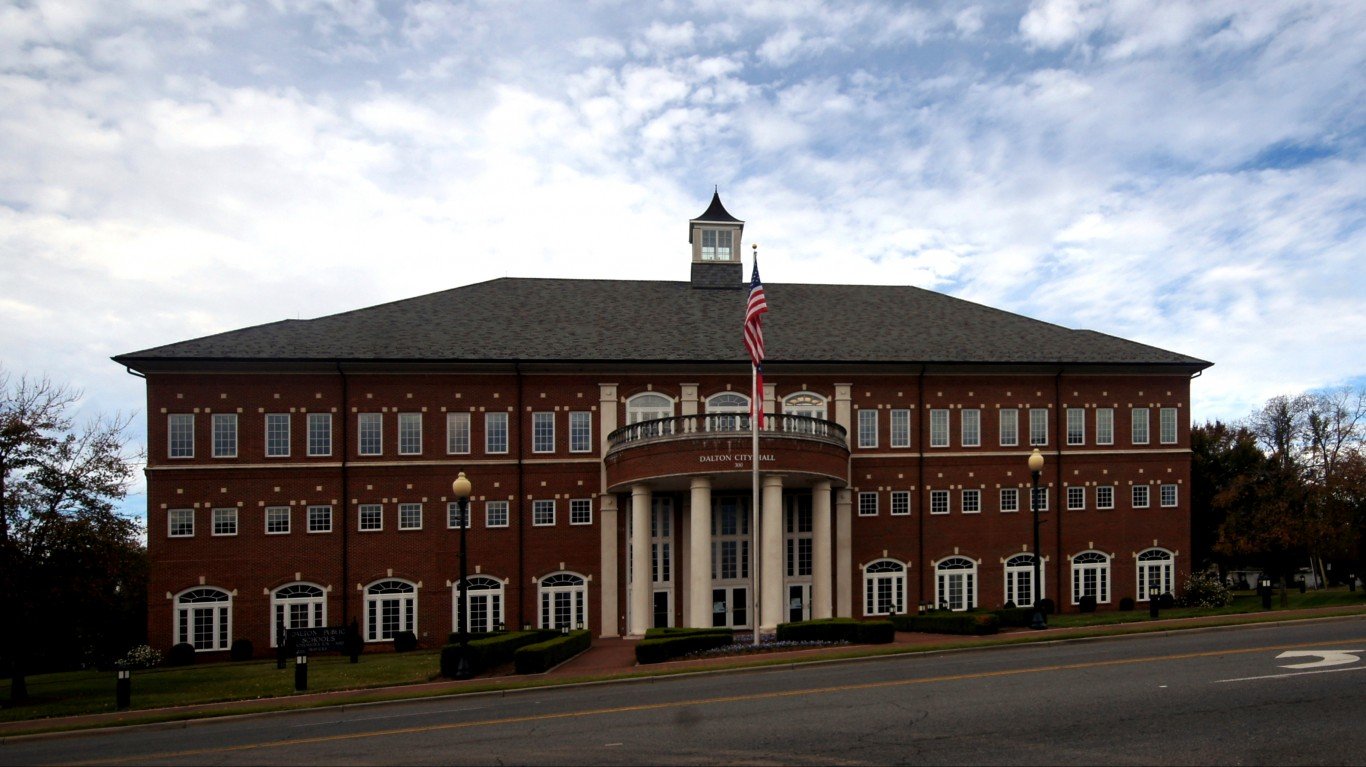
Source: BOB WESTON / Getty Images
11. Dalton, GA
> Confirmed COVID-19 cases as of May 11: 21,762
> Confirmed COVID-19 cases as of May 11 per 100,000 residents: 15,116.6
> Cumulative COVID-19 deaths as of May 11: 331
> Cumulative COVID-19 deaths as of May 11 per 100,000 residents: 229.9
> Population: 143,961

Source: DenisTangneyJr / iStock via Getty Images
10. Sioux City, IA-NE-SD
> Confirmed COVID-19 cases as of May 11: 21,852
> Confirmed COVID-19 cases as of May 11 per 100,000 residents: 15,191.2
> Cumulative COVID-19 deaths as of May 11: 343
> Cumulative COVID-19 deaths as of May 11 per 100,000 residents: 238.4
> Population: 143,846
These are all the counties in Iowa where COVID-19 is slowing (and where it’s still getting worse).

Source: David Crockett Photo / Getty Images
9. Hanford-Corcoran, CA
> Confirmed COVID-19 cases as of May 11: 22,971
> Confirmed COVID-19 cases as of May 11 per 100,000 residents: 15,243.8
> Cumulative COVID-19 deaths as of May 11: 246
> Cumulative COVID-19 deaths as of May 11 per 100,000 residents: 163.2
> Population: 150,691
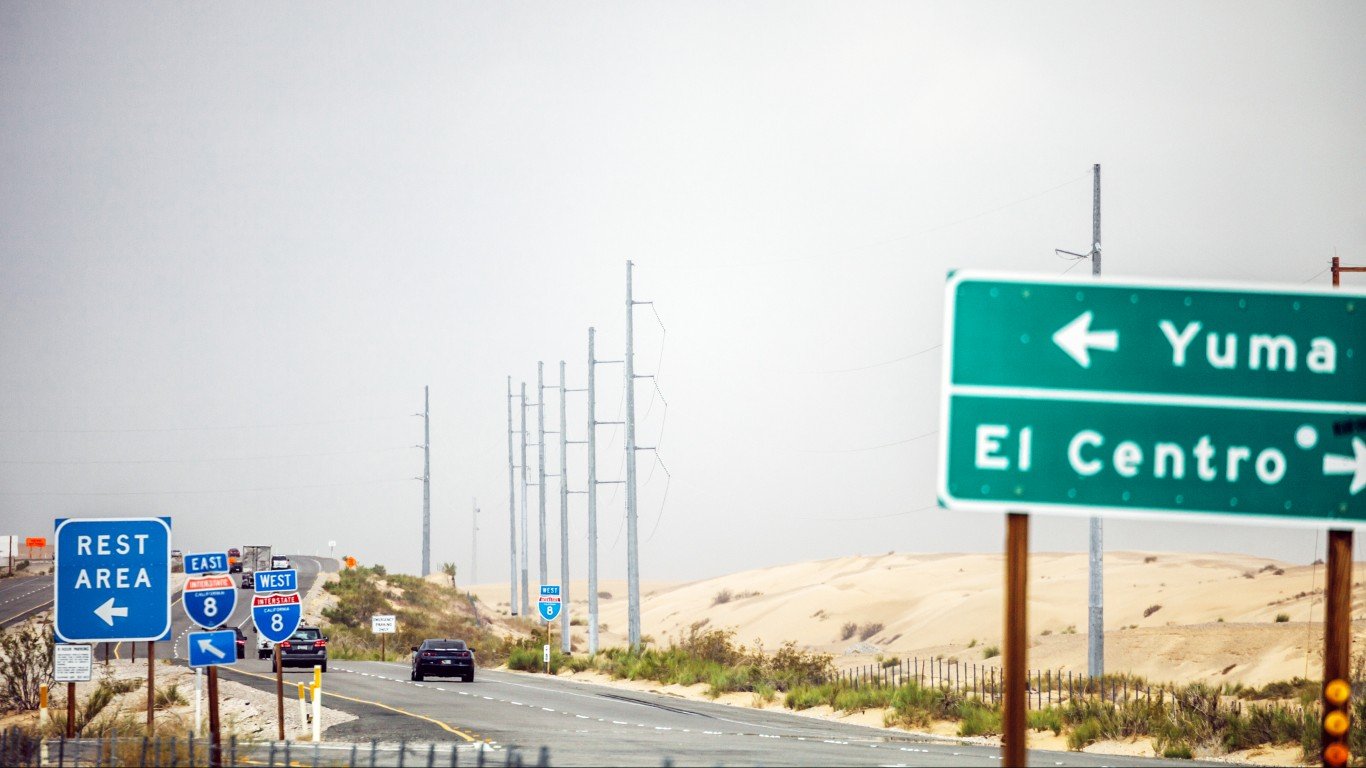
Source: peeterv / iStock via Getty Images
8. El Centro, CA
> Confirmed COVID-19 cases as of May 11: 28,373
> Confirmed COVID-19 cases as of May 11 per 100,000 residents: 15,701.6
> Cumulative COVID-19 deaths as of May 11: 721
> Cumulative COVID-19 deaths as of May 11 per 100,000 residents: 399.0
> Population: 180,701

7. Provo-Orem, UT
> Confirmed COVID-19 cases as of May 11: 97,120
> Confirmed COVID-19 cases as of May 11 per 100,000 residents: 15,746.0
> Cumulative COVID-19 deaths as of May 11: 393
> Cumulative COVID-19 deaths as of May 11 per 100,000 residents: 63.7
> Population: 616,791
These are all the counties in Utah where COVID-19 is slowing (and where it’s still getting worse).

Source: Ron and Patty Thomas / Getty Images
6. Lubbock, TX
> Confirmed COVID-19 cases as of May 11: 50,304
> Confirmed COVID-19 cases as of May 11 per 100,000 residents: 15,895.1
> Cumulative COVID-19 deaths as of May 11: 838
> Cumulative COVID-19 deaths as of May 11 per 100,000 residents: 264.8
> Population: 316,474
These are all the counties in Texas where COVID-19 is slowing (and where it’s still getting worse).

Source: DenisTangneyJr / Getty Images
5. Laredo, TX
> Confirmed COVID-19 cases as of May 11: 43,738
> Confirmed COVID-19 cases as of May 11 per 100,000 residents: 15,990.4
> Cumulative COVID-19 deaths as of May 11: 788
> Cumulative COVID-19 deaths as of May 11 per 100,000 residents: 288.1
> Population: 273,526
These are all the counties in Texas where COVID-19 is slowing (and where it’s still getting worse).

Source: DenisTangneyJr / Getty Images
4. El Paso, TX
> Confirmed COVID-19 cases as of May 11: 134,825
> Confirmed COVID-19 cases as of May 11 per 100,000 residents: 16,126.2
> Cumulative COVID-19 deaths as of May 11: 2,676
> Cumulative COVID-19 deaths as of May 11 per 100,000 residents: 320.1
> Population: 836,062
These are all the counties in Texas where COVID-19 is slowing (and where it’s still getting worse).

Source: DenisTangneyJr / Getty Images
3. Sioux Falls, SD
> Confirmed COVID-19 cases as of May 11: 42,145
> Confirmed COVID-19 cases as of May 11 per 100,000 residents: 16,250.4
> Cumulative COVID-19 deaths as of May 11: 513
> Cumulative COVID-19 deaths as of May 11 per 100,000 residents: 197.8
> Population: 259,348
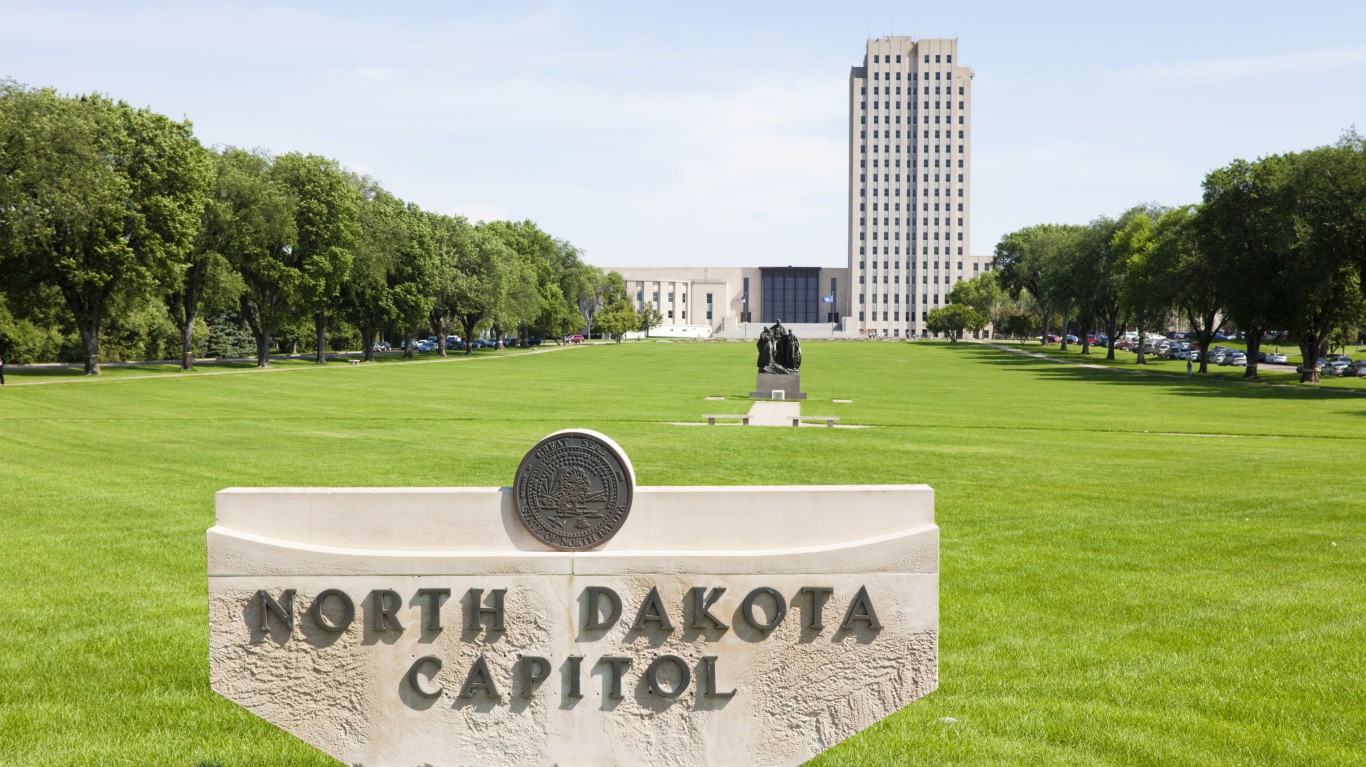
Source: powerofforever / Getty Images
2. Bismarck, ND
> Confirmed COVID-19 cases as of May 11: 21,089
> Confirmed COVID-19 cases as of May 11 per 100,000 residents: 16,540.0
> Cumulative COVID-19 deaths as of May 11: 294
> Cumulative COVID-19 deaths as of May 11 per 100,000 residents: 230.6
> Population: 127,503
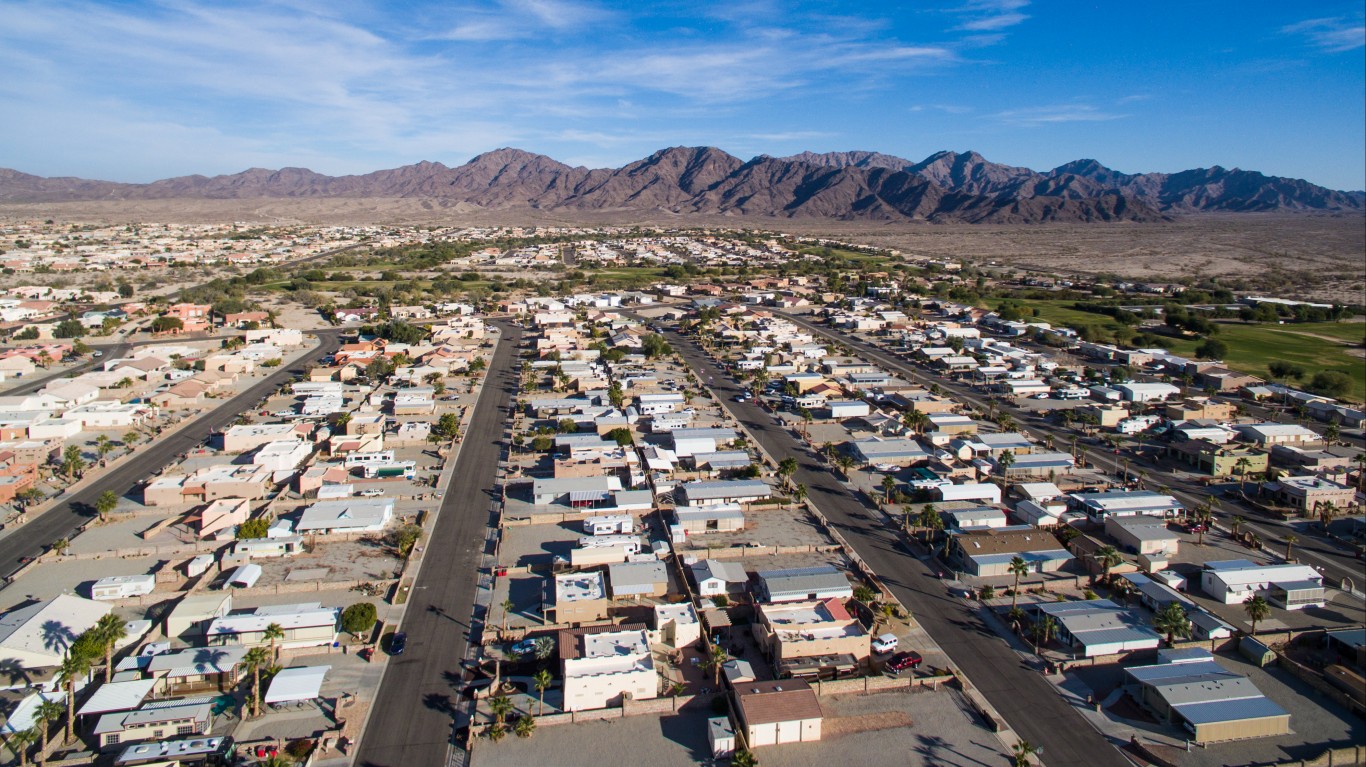
Source: ianmcdonnell / Getty Images
1. Yuma, AZ
> Confirmed COVID-19 cases as of May 11: 37,146
> Confirmed COVID-19 cases as of May 11 per 100,000 residents: 17,733.5
> Cumulative COVID-19 deaths as of May 11: 834
> Cumulative COVID-19 deaths as of May 11 per 100,000 residents: 398.2
> Population: 209,468
Click here to see all coronavirus data for every state.
Sponsored: Attention Savvy Investors: Speak to 3 Financial Experts – FREE
Ever wanted an extra set of eyes on an investment you’re considering? Now you can speak with up to 3 financial experts in your area for FREE. By simply
clicking here you can begin to match with financial professionals who can help guide you through the financial decisions you’re making. And the best part? The first conversation with them is free.
Click here to match with up to 3 financial pros who would be excited to help you make financial decisions.
Thank you for reading! Have some feedback for us?
Contact the 24/7 Wall St. editorial team.
Editors' Picks


