The COVID-19 pandemic sent economic shockwaves through the U.S. economy, tripling the monthly unemployment to nearly 15% and leading to a more than 30% quarterly decline in GDP — by far the largest economic contraction in U.S. history.
No corner of the country was untouched by the pandemic’s economic consequences — but some states have emerged better off than others. A range of factors, including industrial diversity, labor force education levels, household income, and long-term GDP growth, have an effect on a state’s overall economic strength — and its ability to withstand the impact of the pandemic.
To determine the states with the best and worst economies, both in the years leading up to the pandemic and during it, 24/7 Wall St. created an index of five measures — five-year economic growth, five-year employment growth, the poverty rate, unemployment rate, and share of adults with a bachelor’s degree or higher.
Many of the states with economies that rank on the lower end of this list depend on industries that were hit hard by the COVID-19 pandemic. States like Hawaii and Nevada, where tourism is an economic pillar, as well as states like Wyoming and Alaska that depend on resource extraction, rank lower on this list than they perhaps otherwise would if not for the pandemic. Here is a look at the states where people gave up looking for jobs during the pandemic.
GDP growth, one of the index components, is commonly used to gauge the relative economic vitality of a given geography. Economic growth is often fueled by population growth, and many of the states with the fastest growing economies — indeed, many of the states with the best economies — also have rapidly growing populations. Americans are relocating to many of the higher-ranked states on this list, and these same states also often have far higher than average birth rates. Here is a look at how every state’s population has changed since 2010.
Click here to see the states with the best and worst economies.
To determine the states with the best and worst economies, 24/7 Wall St. ranked states based on an index comprising five measures: GDP growth, job growth, unemployment rate, poverty rate, and the bachelor’s degree attainment rate among adults. The average annual GDP growth rate from Q4 2015 to Q4 2020 came from the Bureau of Economic Analysis and was included in the index at full weight. The average annual employment growth rate from March 2016 to March 2021 came from the Bureau of Labor Statistics and was included in the index at full weight. The seasonally-adjusted unemployment rate as of March 2021 also came from the BLS and was included in the index at full weight. The share of the population living below the poverty line and the share of adults with a bachelor’s degree or higher came from the U.S. Census Bureau’s 2019 American Community Survey and were included in the index at full weight.
In addition to the components in the index, we considered additional state data. Real GDP and contributions to real GDP growth by industry came from the BEA. Median household income, bachelor’s degree attainment rate, and the share of workers commuting outside of the state for work came from the 2019 ACS. The affordability ratio of median home value to median household income is a 24/7 Wall St. calculation based on ACS data. Data on regional price parity, a measure of cost of living, came from the BEA and is for 2019. Population change due to natural causes and net migration from 2010 to 2020 came from the U.S. Census Bureau. All data are for the most recent period available.
Source: johnnya123 / Getty Images
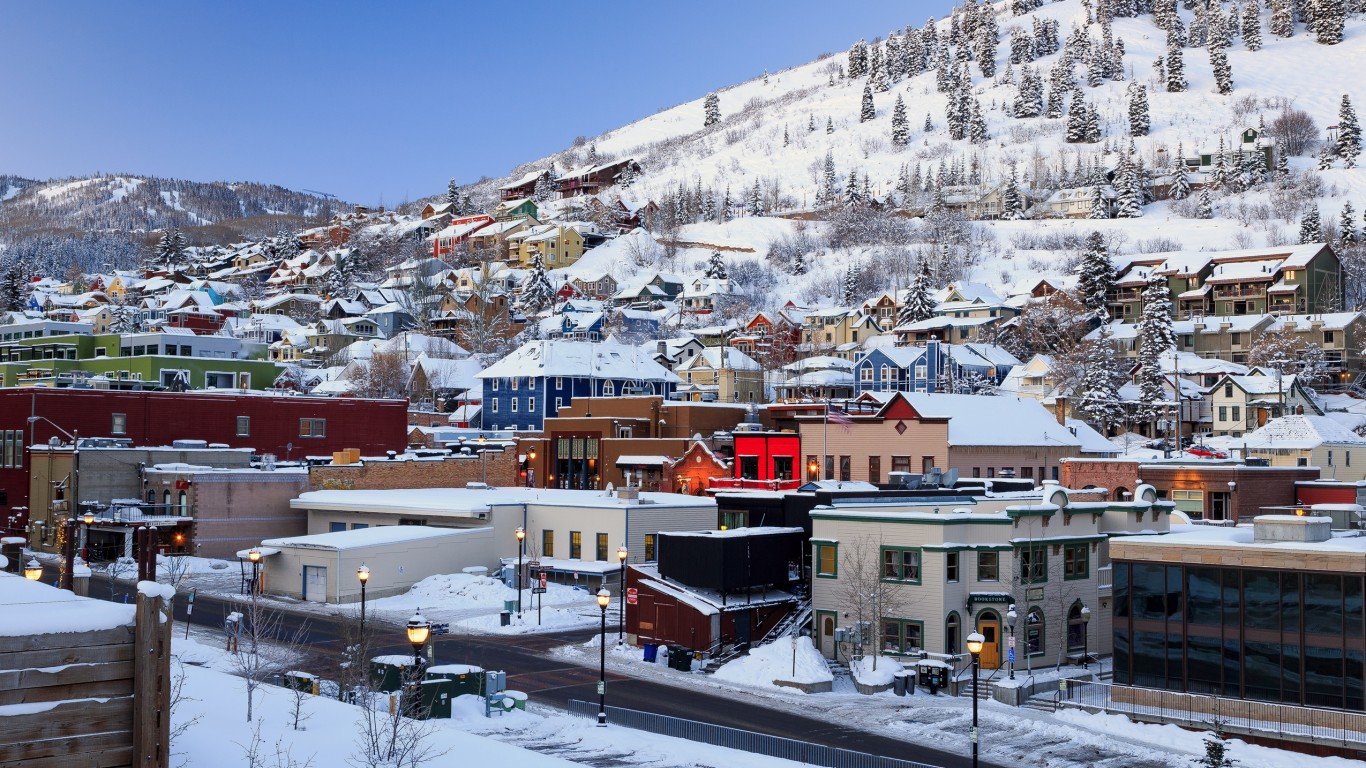
1. Utah
> 5-yr. annualized GDP growth through Q4 2020: +3.9% (2nd highest)
> 5-yr. annualized employment growth through March 2021: +2.0% (2nd highest)
> March 2021 unemployment rate: 2.9% (4th lowest)
> Poverty rate: 8.9% (2nd lowest)
Despite the challenges posed by the COVID-19 pandemic, economic conditions in Utah remain relatively strong. As of March 2021, only 2.9% of the state’s labor force were out of work, nearly the smallest share of any state and less than half the 6.0% national unemployment rate.
Utah’s GDP has also grown by 3.9% over the five years ending in the fourth quarter of 2020, the second highest growth of any state. A near 6% decline in output in the state’s arts, entertainment, and recreation industry — precipitated in large part by efforts to contain the spread of the coronavirus — was offset by strong growth in the state’s real estate, construction, and information sectors. Economic growth is often attributable to population growth, and partially due to the state’s high birth rate, there are nearly half a million more people in Utah today than there were in 2010.
[in-text-ad]

Source: knowlesgallery / Getty Images
2. Idaho
> 5-yr. annualized GDP growth through Q4 2020: +3.9% (3rd highest)
> 5-yr. annualized employment growth through March 2021: +2.3% (the highest)
> March 2021 unemployment rate: 3.2% (6th lowest)
> Poverty rate: 11.2% (21st lowest)
No state reported stronger job growth over the last five years than Idaho. Employment in the state grew at an average of 2.3% annual pace since early 2016, while nationwide, due in large part to the COVID-19 pandemic, employment only grew at an average of 0.1% annually over the same period. Partially as a result, only 3.2% of the labor force are unemployed in Idaho, well below the 6.0% national jobless rate.
GDP growth has also been strong in Idaho, averaging nearly 4% in each of the last five years. Like many states with rapid economic growth, Idaho’s population growth is also strong. Idaho ranks in the top five states for population growth due to migration and in the top 10 for population growth due to its birth rate.
Source: benedek / iStock via Getty Images
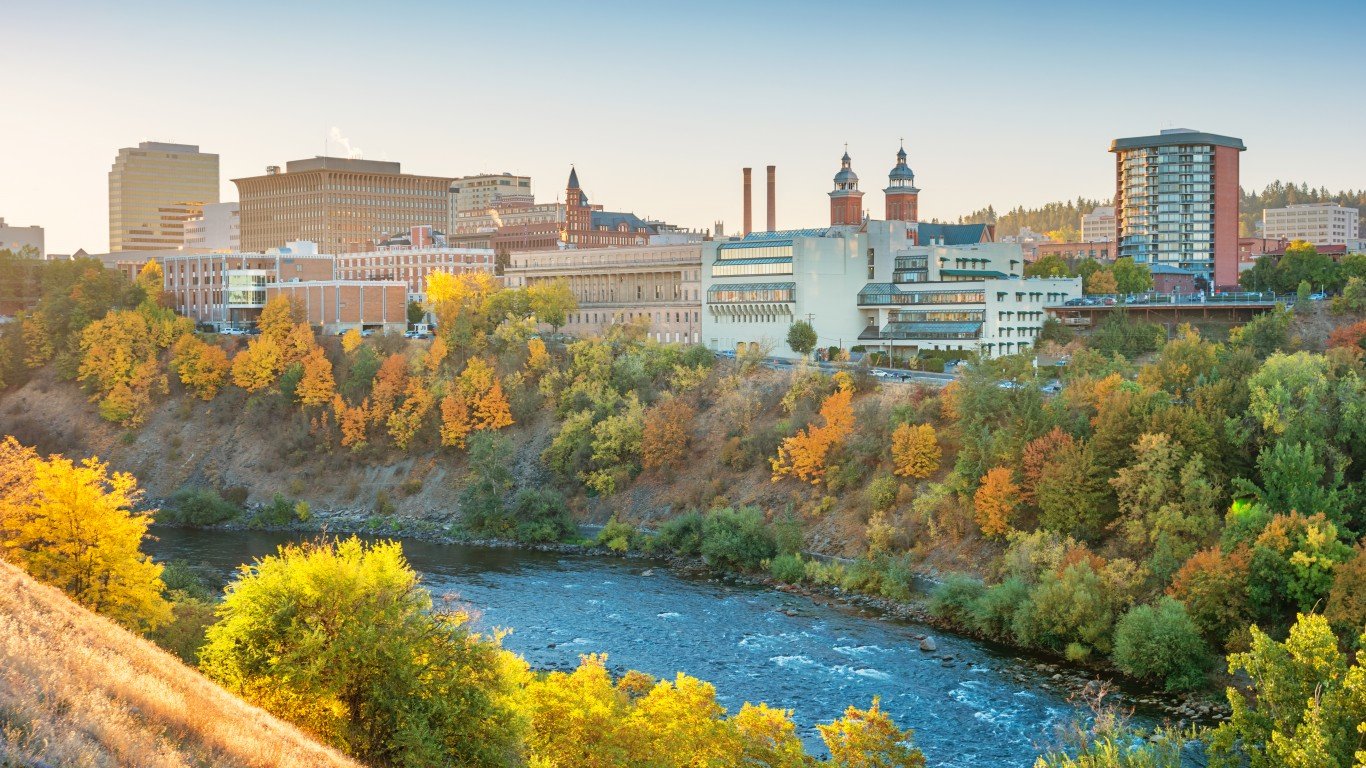
3. Washington
> 5-yr. annualized GDP growth through Q4 2020: +4.3% (the highest)
> 5-yr. annualized employment growth through March 2021: +1.2% (9th highest)
> March 2021 unemployment rate: 5.4% (22nd highest)
> Poverty rate: 9.8% (9th lowest)
Washington’s economy grew at a faster rate than that of any other state in the country. Over the last half decade, Washington’s GDP grew at an average of 4.3% a year. For context, the annual growth rate for the U.S. as whole was 1.4% over the same period. Economic growth was hampered in much of the country during the COVID-19 pandemic, but Washington is one of only five states that reported an increase in GDP from the end of 2019 to the end of 2020.
Economic growth in Washington was driven by the information sector. The state is home to the headquarters of some of the world’s largest technology companies, like Amazon and Microsoft, and since the fourth quarter of 2015, economic output in Washington’s information sector climbed at an average rate of 15.1% a year.

Source: Planet Unicorn / Getty Images
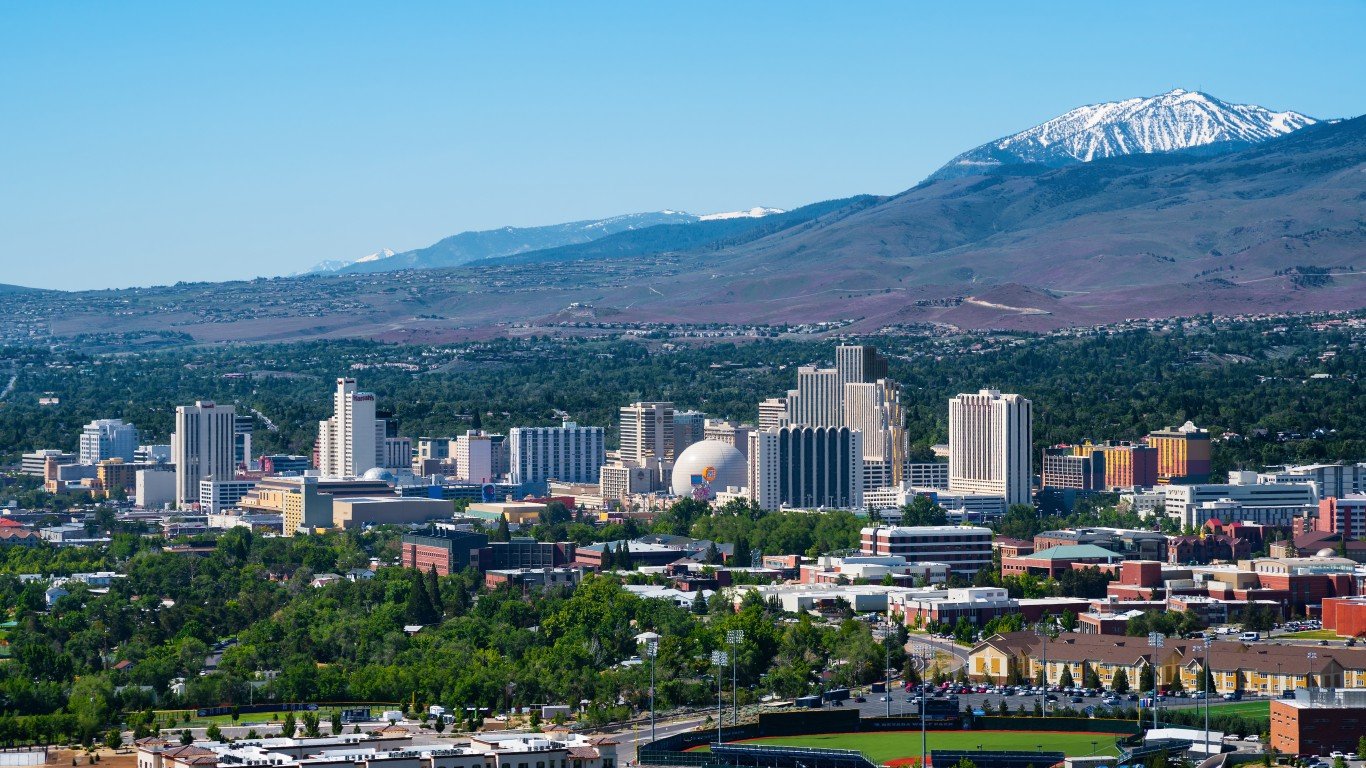
4. Colorado
> 5-yr. annualized GDP growth through Q4 2020: +2.8% (5th highest)
> 5-yr. annualized employment growth through March 2021: +1.4% (6th highest)
> March 2021 unemployment rate: 6.4% (17th highest)
> Poverty rate: 9.3% (7th lowest)
Colorado has a strong socioeconomic foundation with a well-educated workforce and a financially secure tax base. Nearly 43% of adults in the state have a bachelor’s degree, the second largest share in the country. The state is also one of less than a dozen with a poverty rate below 10%. Additionally, the typical Colorado household earns $77,127 a year, well above the national median of $65,712.
Though the COVID-19 pandemic resulted in an economic downturn in Colorado, the state still reported far faster than average longer-term GDP growth. Over the last five years, Colorado’s GDP grew at an average rate of 2.8% a year, faster than all but four other states.
[in-text-ad-2]

Source: DenisTangneyJr / Getty Images
5. New Hampshire
> 5-yr. annualized GDP growth through Q4 2020: +0.6% (18th lowest)
> 5-yr. annualized employment growth through March 2021: +0.2% (22nd highest)
> March 2021 unemployment rate: 3.0% (5th lowest)
> Poverty rate: 7.3% (the lowest)
New Hampshire’s economy is the strongest of any state in the Northeast. In New Hampshire, 37.6% of the 25 and older population have a bachelor’s degree or higher, well above the 33.1% share of adults nationwide. Better-educated Americans are generally less susceptible to job loss during an economic downturn, and unemployment in the state is just 3.0%, half the comparable 6.0% jobless rate nationwide.
New Hampshire’s economic growth was hit harder than in most of the country during the COVID-19 pandemic, and partially as a result, annual GDP growth in the state averaged just 0.6% over the last half decade. Still, state residents are generally better positioned than most Americans to weather weak growth. The typical household in the state earns nearly $78,000 a year, about $12,000 more than the national median, and just 7.3% of the state population live below the poverty line, the lowest poverty rate of any state.

Source: Davel5957 / Getty Images
6. Nebraska
> 5-yr. annualized GDP growth through Q4 2020: +1.2% (17th highest)
> 5-yr. annualized employment growth through March 2021: +0.0% (25th lowest)
> March 2021 unemployment rate: 2.9% (4th lowest)
> Poverty rate: 9.9% (10th lowest)
COVID-19 has taken a greater overall public health toll in Nebraska — infecting more people per capita than it has nationwide. The virus’s economic toll appears to have been less pronounced in the state, however. Unemployment is just 2.9% in Nebraska, 0.1 percentage points lower than it was in March 2019. Meanwhile, the national jobless rate is 6.0% — 2.2 percentage points above where it was two years ago.
Strong economic conditions in Nebraska have made residents less susceptible to serious financial hardship than most other Americans. Nebraska is one of only 11 states where fewer than one in every 10 residents live below the poverty line.
[in-text-ad]

Source: RudyBalasko / Getty Images
7. Minnesota
> 5-yr. annualized GDP growth through Q4 2020: +1.1% (21st highest)
> 5-yr. annualized employment growth through March 2021: -0.1% (21st lowest)
> March 2021 unemployment rate: 4.2% (15th lowest)
> Poverty rate: 9.0% (3rd lowest)
Economic conditions in Minnesota have created one of the most financially secure populations of any state. The median household income of $74,593 is about $9,000 greater than the national median. Additionally, only 9.0% of state residents live below the poverty line, the third smallest share of any state. Better-educated Americans are more likely to have high paying occupations and less likely to face financial hardship — and in Minnesota, 37.3% of adults have a bachelor’s degree, compared to 33.1% of adults nationwide.
Minnesota’s job market was hit harder by the COVID-19 pandemic than the country overall. In fact, there are fewer people working in the state now than there were even five years ago. Still, Minnesota’s unemployment rate of 4.2% remains lower than the comparable 6.0% national rate.
 24/7 Wall St.
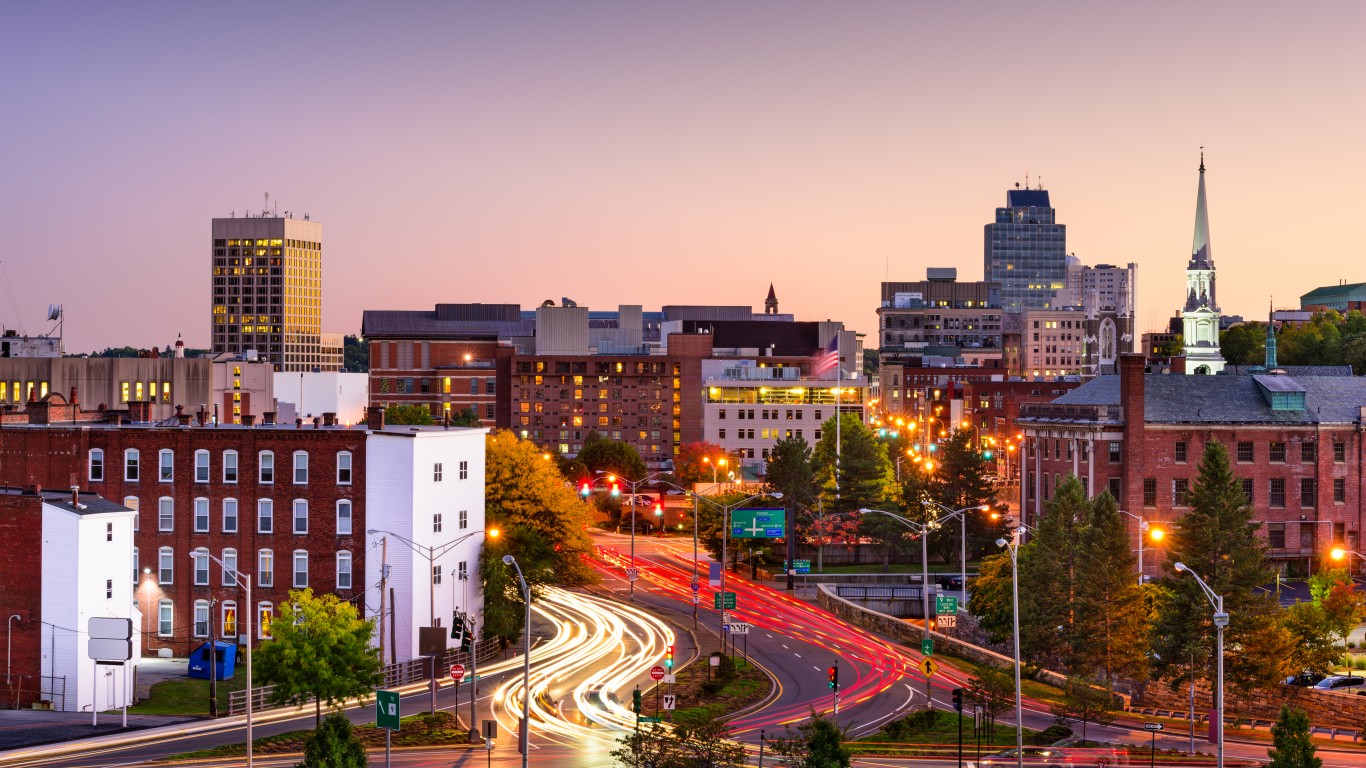
Source: SeanPavonePhoto / Getty Images
8. Massachusetts
> 5-yr. annualized GDP growth through Q4 2020: +1.4% (15th highest)
> 5-yr. annualized employment growth through March 2021: +0.2% (20th highest)
> March 2021 unemployment rate: 6.8% (13th highest)
> Poverty rate: 9.4% (8th lowest)
Massachusetts is home to the best-educated workforce in the country. An estimated 45% of adults in the state have a bachelor’s degree or higher, more than every other state and well above the 33.1% share of adults nationwide.
While the COVID-19 pandemic resulted in massive job losses in Massachusetts, these employment declines were not enough to erase the progress of the last five years as they were in other other parts of the country. Additionally, due in part to strong growth in the information and professional, scientific, and technical services industries, Massachusetts’s GDP expanded at an average annual rate of 1.4% since the fourth quarter of 2015, a faster rate than most states.

Source: Sean Pavone / Getty Images
9. Georgia
> 5-yr. annualized GDP growth through Q4 2020: +2.2% (8th highest)
> 5-yr. annualized employment growth through March 2021: +1.7% (4th highest)
> March 2021 unemployment rate: 4.5% (18th lowest)
> Poverty rate: 13.3% (14th highest)
The public health toll caused by the coronavirus was heavier in Georgia than it was in most of the country, as the state has more cumulative infections per capita than average. The pandemic’s economic consequences have been less pronounced, however. Only 4.5% of Georgia’s labor force are unemployed, well below the comparable 6.0% national jobless rate. Additionally, employment growth in the Peach State has averaged 1.7% per year since 2016, faster than in all but three other states.
Georgia also reported faster than average GDP growth in the last five years. The state’s economy expanded at an average rate of 2.2% each year since the end of 2015, well above the comparable 1.4% national annualized growth rate.
[in-text-ad-2]

Source: 4nadia / Getty Images
10. Oregon
> 5-yr. annualized GDP growth through Q4 2020: +2.8% (6th highest)
> 5-yr. annualized employment growth through March 2021: +0.9% (10th highest)
> March 2021 unemployment rate: 6.0% (20th highest)
> Poverty rate: 11.4% (23rd lowest)
Half of the 10 states with the best economies are in the West — and Oregon is one of them. The state’s high rank is due in large part to strong GDP growth in recent years, despite the significant setbacks caused by the COVID-19 pandemic. Over the last half decade, the state’s economy expanded at an average of 2.8% each year — even with a 2.4% contraction from the end of 2019 through 2020.
One of the fastest growing industries in Oregon is construction. The sector’s growth is fueled in part by population growth. Oregon’s population expanded by 8.2% from net migration alone from 2010 to 2020, more than in all but eight other states.

Source: SeanPavonePhoto / Getty Images
11. Virginia
> 5-yr. annualized GDP growth through Q4 2020: +1.2% (16th highest)
> 5-yr. annualized employment growth through March 2021: -0.2% (19th lowest)
> March 2021 unemployment rate: 5.1% (25th highest)
> Poverty rate: 9.9% (11th lowest)
Virginia’s economy ranks as the second best in the South and eleventh best among all states. The state benefits from a well-educated workforce and a relatively financially stable population. An estimated 39.6% of adults in Virginia have a bachelor’s degree or higher, a larger share than in all but five other states. Additionally, the state’s poverty rate of 9.9% is considerably lower than the 12.3% national average.
In recent years, economic growth in Virginia has outpaced that of much of the nation. State GDP expanded at an average annual rate of 1.2% over the last half decade — faster than most other states — even when factoring in a 1.5% contraction during the COVID-19 pandemic.
[in-text-ad]

Source: Davel5957 / Getty Images
12. Kansas
> 5-yr. annualized GDP growth through Q4 2020: +1.1% (19th highest)
> 5-yr. annualized employment growth through March 2021: +0.2% (21st highest)
> March 2021 unemployment rate: 3.7% (8th lowest)
> Poverty rate: 11.4% (24th lowest)
Kansas was hit harder than most states by the COVID-19 pandemic, reporting a higher than average number of confirmed coronavirus cases per capita. The state’s job market, however, has emerged stronger from the pandemic than most other states. As of March, 3.7% of the labor force in Kansas were unemployed, well below the 6.0% national jobless rate.
Kansas also reported stronger GDP growth in recent years than most states. Driven by strong growth in the agriculture, information, and manufacturing sectors, Kansas’ GDP expanded at an average rate of 1.1% per year since the end of 2015. The growth would have been far stronger if not for a 1.6% contraction during the worst of the COVID-19 pandemic.

Source: peeterv / Getty Images
13. Montana
> 5-yr. annualized GDP growth through Q4 2020: +1.2% (18th highest)
> 5-yr. annualized employment growth through March 2021: +0.5% (16th highest)
> March 2021 unemployment rate: 3.8% (11th lowest)
> Poverty rate: 12.6% (20th highest)
Montana’s economy is healthier than that of most states. Despite having an economy more dependent than most on industries that faced the greatest level of disruption during the pandemic, only 3.8% of the state’s labor force were unemployed in March 2021, well below the 6.0% national jobless rate.
Because of the COVID-19 pandemic, Montana’s economy contracted by 2.8% over the past year — a larger contraction than most states reported. Still, the setback was not enough to offset gains of the preceding years. Over the last half decade, Montana’s economy expanded at an average rate of 1.2% a year, more than most states.

Source: EunikaSopotnicka / Getty Images
14. South Dakota
> 5-yr. annualized GDP growth through Q4 2020: +0.8% (24th lowest)
> 5-yr. annualized employment growth through March 2021: +0.6% (14th highest)
> March 2021 unemployment rate: 2.9% (4th lowest)
> Poverty rate: 11.9% (23rd highest)
South Dakota has a better economy than most states, due in large part to the strength of its job market. Only 2.9% of the labor force are out of work, less than half the 6.0% national unemployment rate.
South Dakota was also one of only five states to report economic growth from the end of 2019 through the end of 2020, a year in which the COVID-19 pandemic resulted in a 2.4% economic contraction nationwide. Still, over the last half decade, South Dakota’s 0.8% average annual GDP growth rate was slower than most other states and well below the comparable 1.4% national GDP growth.
[in-text-ad-2]
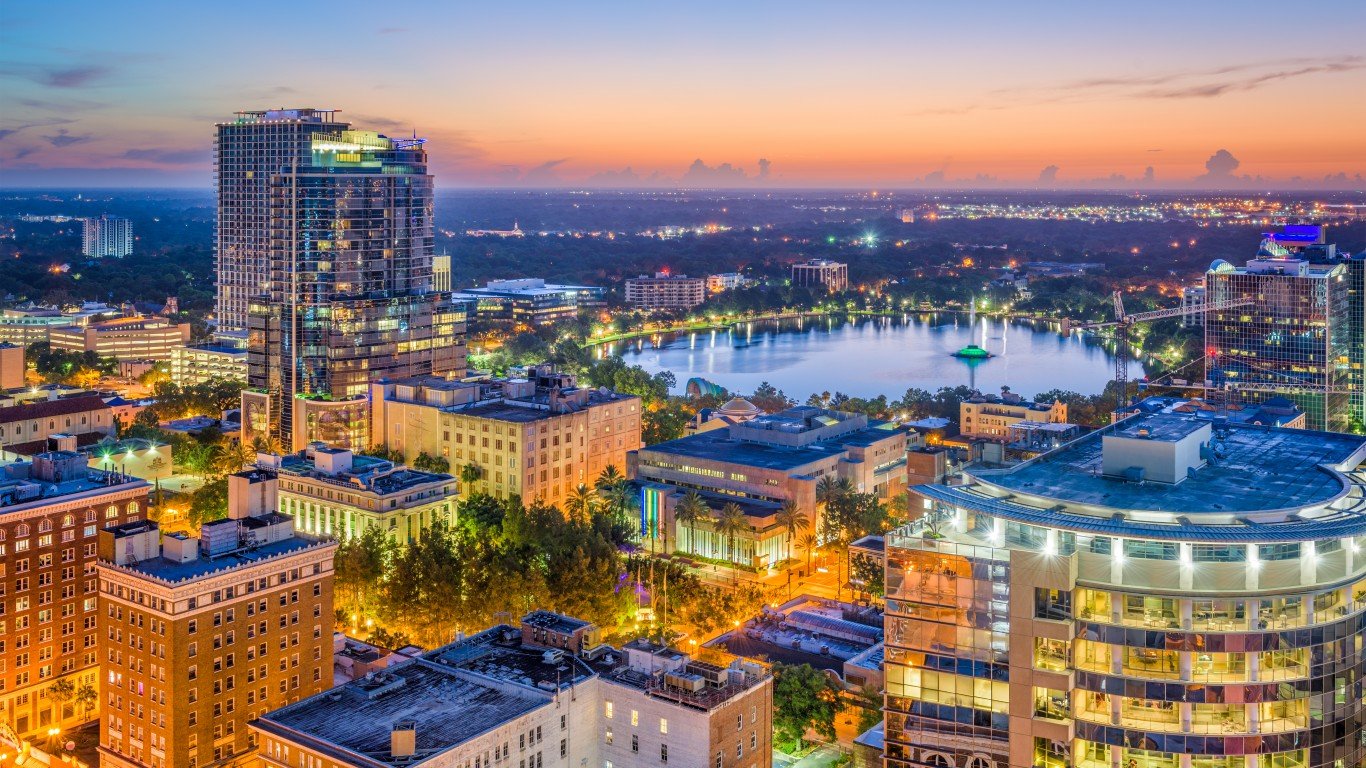
Source: Sean Pavone / Getty Images
15. Florida
> 5-yr. annualized GDP growth through Q4 2020: +2.2% (9th highest)
> 5-yr. annualized employment growth through March 2021: +0.9% (12th highest)
> March 2021 unemployment rate: 4.7% (20th lowest)
> Poverty rate: 12.7% (19th highest)
Florida’s economy is heavily dependent on tourism — one of the sectors hit hardest by the pandemic. Partially as a result, the state’s economy contracted by 2.1% from the end of 2019 through the end of 2020. Despite the setback, Florida’s economy still expanded by an annual average of 2.2% over the last five years, well above the comparable 1.4% national annualized growth rate.
One of the fastest growing industries in the last half decade in the Sunshine State was construction — a sector that often benefits from population growth. In Florida, the population grew by a net of nearly 2.7 million people between 2010 and 2020 from new residents moving in alone, the most of any state in the country.

Source: Davel5957 / Getty Images
16. Maryland
> 5-yr. annualized GDP growth through Q4 2020: +1.0% (24th highest)
> 5-yr. annualized employment growth through March 2021: -0.6% (14th lowest)
> March 2021 unemployment rate: 6.2% (19th highest)
> Poverty rate: 9.0% (4th lowest)
Economic conditions are better in Maryland than they are in most other states. The state benefits from a well-educated workforce and a relatively financially stable population. An estimated 40.9% of adults in Maryland have a bachelor’s degree or higher, a larger share than in all but three other states. Additionally, the state’s poverty rate of 9.0% is considerably lower than the 12.3% national average. The median household income in Maryland of $86,738 is also the highest of any state in the country.
Maryland’s economy was hit hard by the COVID-19 pandemic. Over the last year, economic output in the state fell by 1.7%. Additionally, job losses in the last year have more than erased the gains of the previous four years.
[in-text-ad]
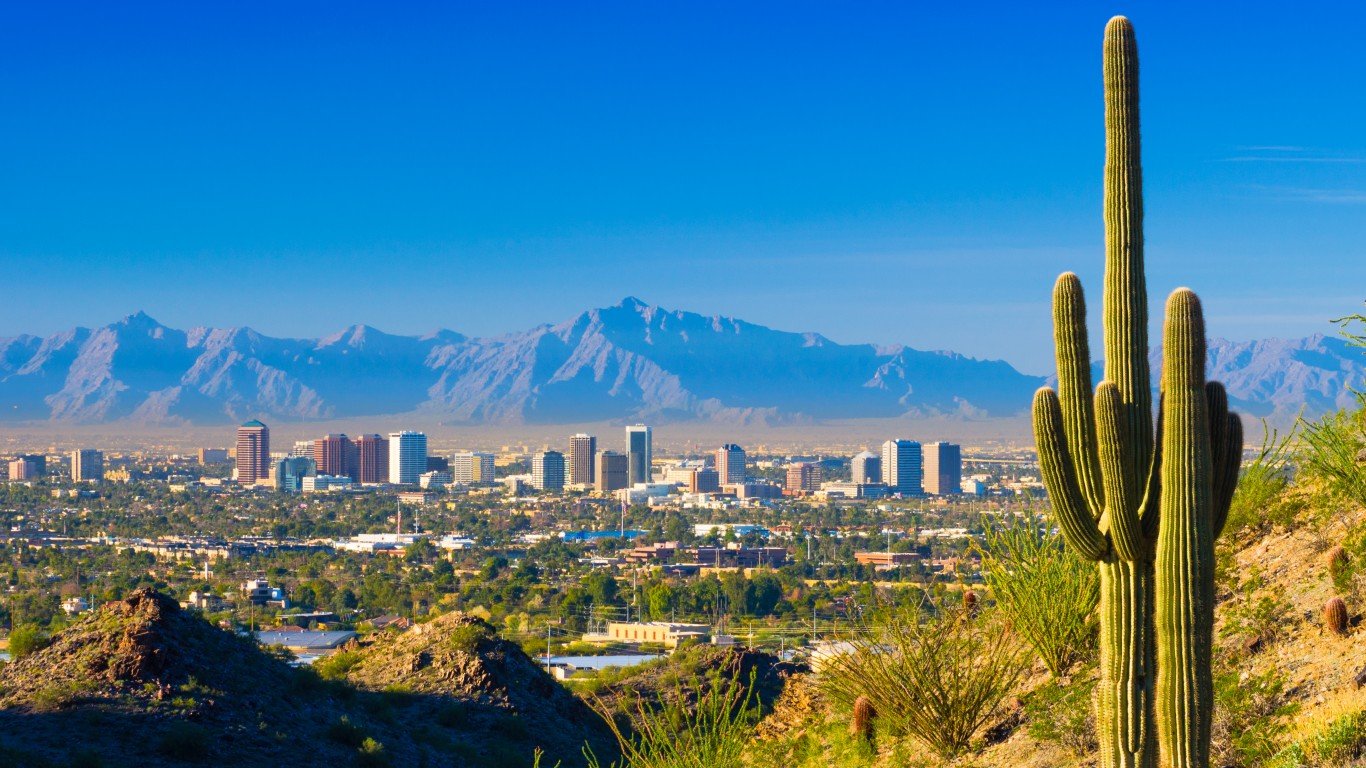
Source: Davel5957 / Getty Images
17. Arizona
> 5-yr. annualized GDP growth through Q4 2020: +2.9% (4th highest)
> 5-yr. annualized employment growth through March 2021: +1.9% (3rd highest)
> March 2021 unemployment rate: 6.7% (14th highest)
> Poverty rate: 13.5% (13th highest)
Few states have reported stronger GDP growth than Arizona in recent years. Over the last half decade, Arizona’s economy has expanded at an average rate of 2.9% annually, more than double the comparable 1.4% national growth rate. GDP growth in Arizona was driven in part by construction — a sector that typically benefits from population growth. Between 2010 and 2020, Arizona’s population grew by 11.3% from new residents moving in alone, faster growth due to net migration than all but two other states.
Still, Arizona is struggling with high unemployment in the wake of the pandemic. As of March, 6.7% of its labor force were out of work, well above the 6.0% national unemployment rate.
 24/7 Wall St.
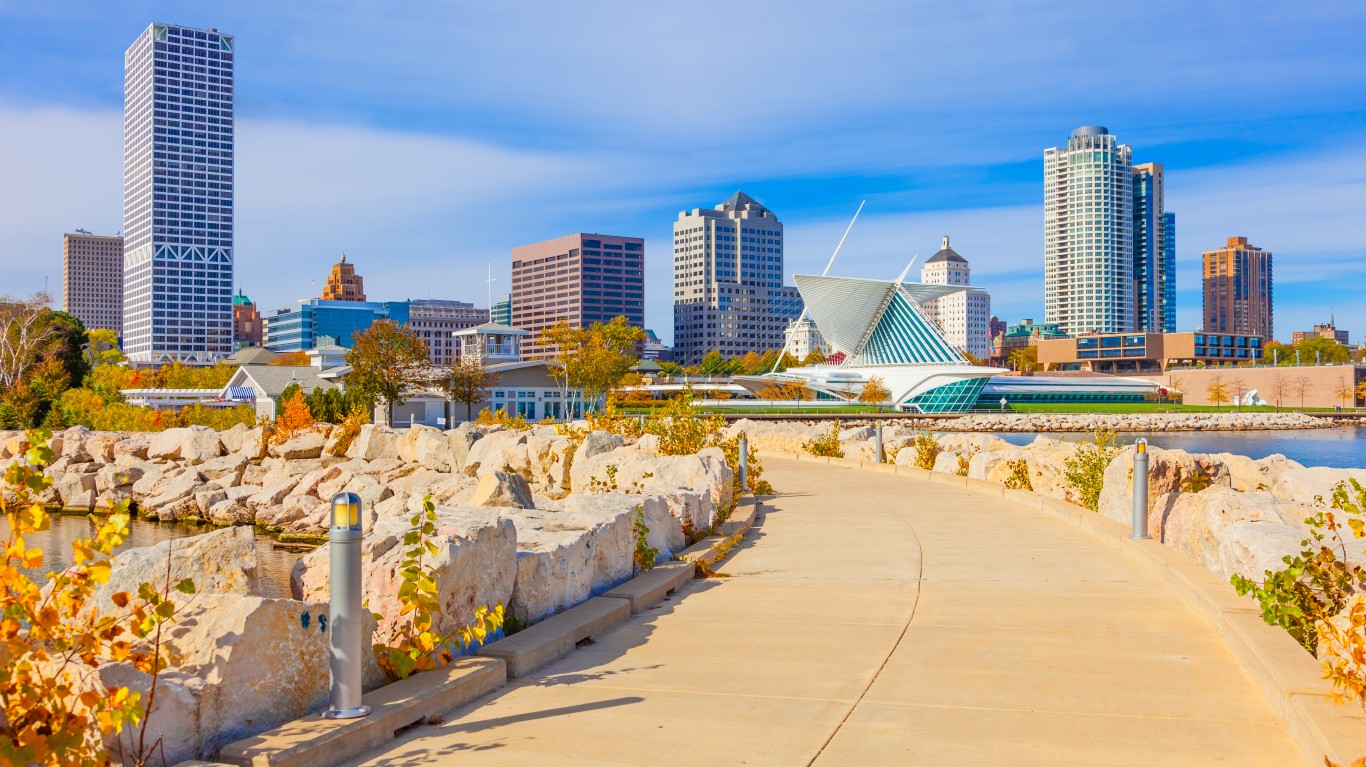
Source: Ron_Thomas / Getty Images
18. Wisconsin
> 5-yr. annualized GDP growth through Q4 2020: +0.8% (23rd lowest)
> 5-yr. annualized employment growth through March 2021: -0.2% (18th lowest)
> March 2021 unemployment rate: 3.8% (11th lowest)
> Poverty rate: 10.4% (16th lowest)
Like many other parts of the Midwest, Wisconsin suffered a greater than average public health toll during the COVID-19 pandemic, with a high concentration of infections per capita. Still, the state’s job market has emerged in better shape than most other states, as unemployment stands at 3.8%, well below the national rate of 6.0%. However, the number of people working in the state has fallen by an average of 0.2% annually over the last half decade.
Due in part to relatively strong economic conditions in the state, Wisconsin residents are less likely to face serious financial hardship than most other Americans. The state’s poverty rate of 10.4% is considerably lower than the 12.3% national rate.
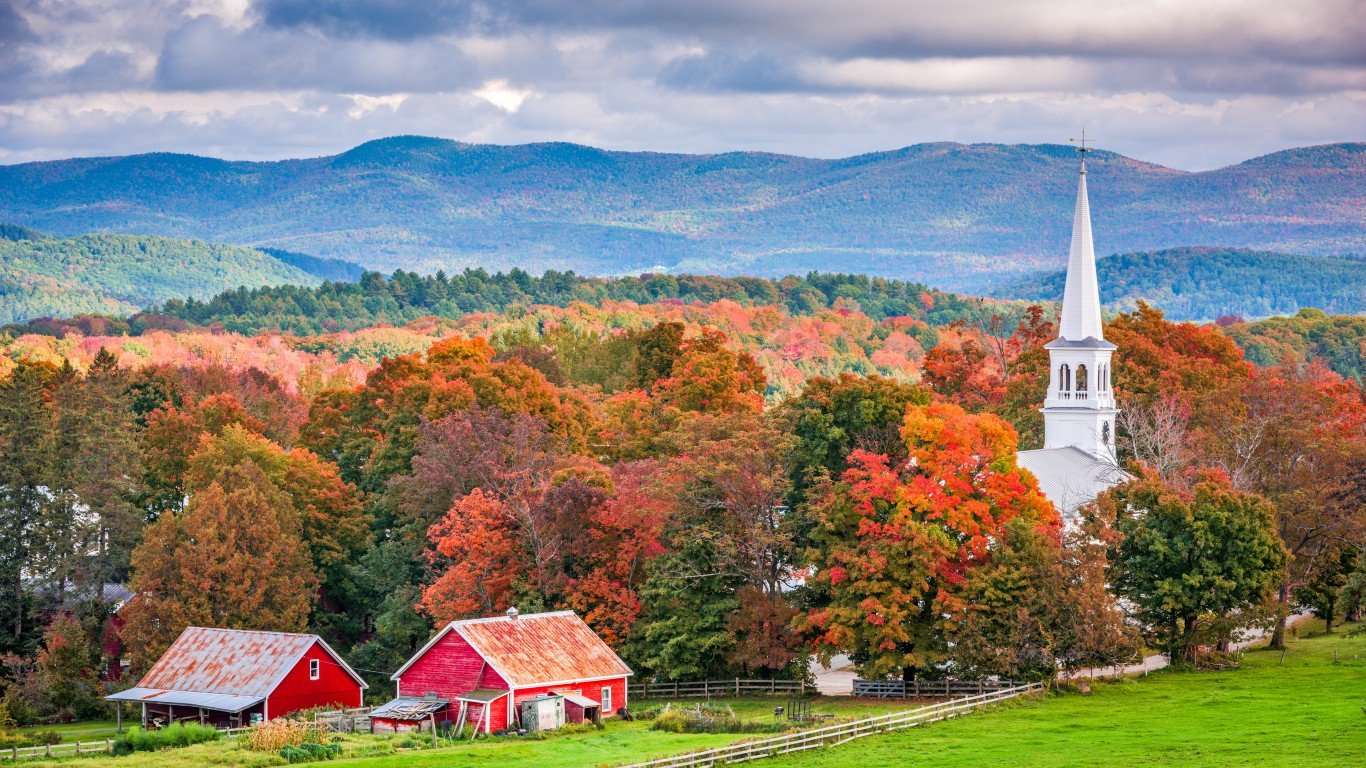
Source: Sean Pavone / Getty Images
19. Vermont
> 5-yr. annualized GDP growth through Q4 2020: -0.1% (9th lowest)
> 5-yr. annualized employment growth through March 2021: -1.9% (3rd lowest)
> March 2021 unemployment rate: 2.9% (4th lowest)
> Poverty rate: 10.2% (15th lowest)
Even though Vermont’s job market was hit hard by the pandemic, the state has a better economy than most states and one of the best economies in the Northeast. Due largely to job losses in 2020 and 2021, the number of people working in Vermont fell by 9.2% from March 2016 to March 2021, nearly the largest such decline of any state. Still, Vermont’s 2.9% unemployment rate is nearly the lowest in the country and less than half the 6.0% national jobless rate.
Vermonters are also more likely to be financially secure than most Americans, as the state’s poverty rate of 10.2% is considerably lower than the 12.3% national rate.
[in-text-ad-2]

Source: Sean Pavone / Getty Images
20. North Carolina
> 5-yr. annualized GDP growth through Q4 2020: +1.7% (13th highest)
> 5-yr. annualized employment growth through March 2021: +0.8% (13th highest)
> March 2021 unemployment rate: 5.2% (24th highest)
> Poverty rate: 13.6% (12th highest)
Unemployment in North Carolina was driven higher by the COVID-19 pandemic. Still, unlike most of the country, the state’s March 2021 jobless rate of 5.2% is in line with what it was five years ago and well below the 6.0% U.S. unemployment rate.
North Carolina has also reported relatively strong economic growth in recent years. Over the last half decade, the state GDP grew at an average rate of 1.7% a year — more than the 1.4% national rate and higher than in all but 12 other states — even after weathering a 1.2% contraction during the pandemic.
Source: Sean Pavone / Getty Images
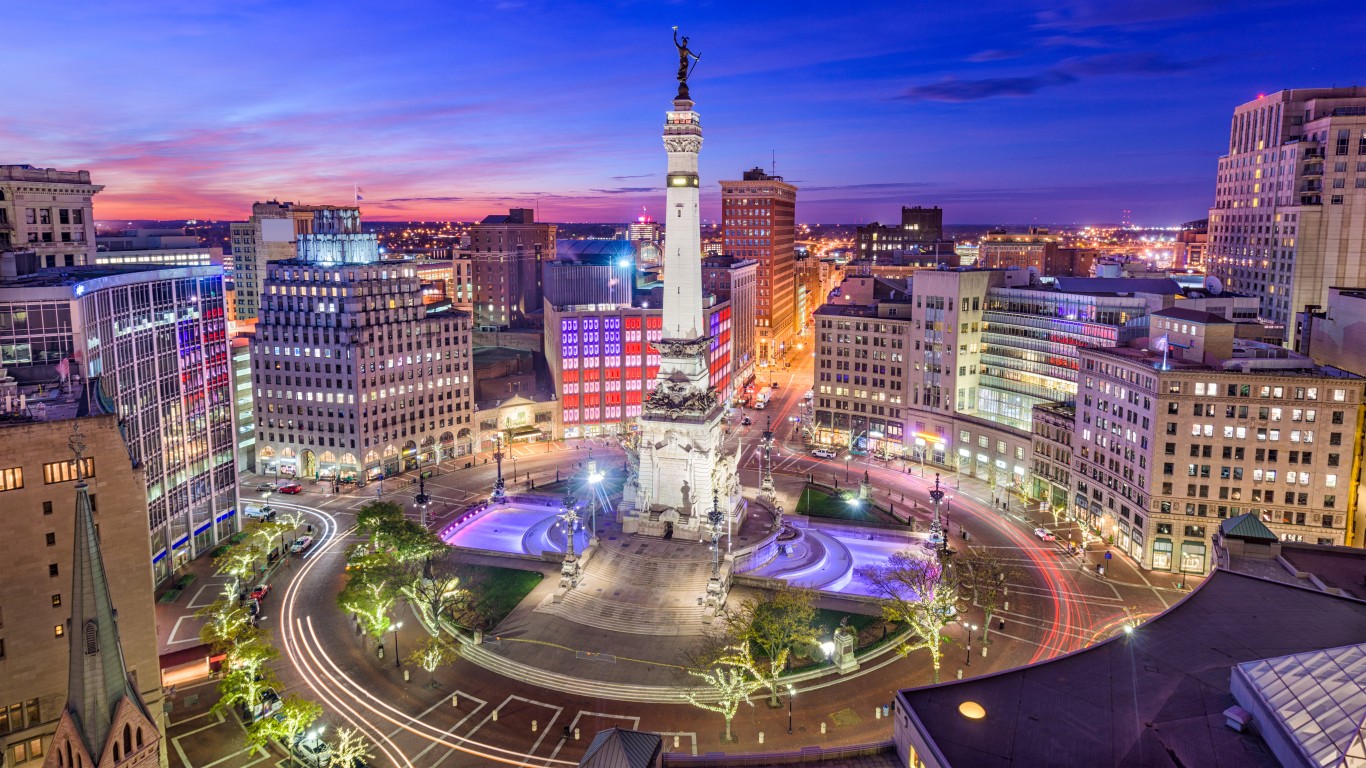
21. Indiana
> 5-yr. annualized GDP growth through Q4 2020: +1.5% (14th highest)
> 5-yr. annualized employment growth through March 2021: +0.1% (23rd highest)
> March 2021 unemployment rate: 3.9% (12th lowest)
> Poverty rate: 11.9% (24th highest)
In a time when much of the country is struggling to put people back to work, Indiana’s job market is a bright spot. Just 3.9% of the labor force in the state are unemployed, well below the 6.0% national jobless rate and only about half a percentage point higher than the unemployment rate in the state this time in 2019, before the pandemic hit.
GDP growth has also been strong in Indiana in recent years. Over the last half decade, the state’s economy grew at an average rate of 1.5% a year — slightly more than the 1.4% national growth and higher than all but 13 other states — even after weathering a 1.1% contraction during the pandemic.
[in-text-ad]

Source: Sean Pavone / Getty Images
22. South Carolina
> 5-yr. annualized GDP growth through Q4 2020: +1.8% (11th highest)
> 5-yr. annualized employment growth through March 2021: +0.9% (11th highest)
> March 2021 unemployment rate: 5.1% (25th highest)
> Poverty rate: 13.8% (10th highest)
In several key measures, South Carolina’s economy is on better footing than much of the rest of the country. For example, the state’s 5.1% unemployment rate is lower than the 6.0% national jobless rate. Additionally, the state’s economy expanded at an average annual rate of 1.8% over the last five years, faster than all but 10 other states.
Still, in other ways, there is significant room for improvement, such as in the share of South Carolina’s population who face serious financial hardship. The state’s poverty rate of 13.8% is well above the 12.3% share of Americans nationwide who live below the poverty line.
Source: SeanPavonePhoto / Getty Images
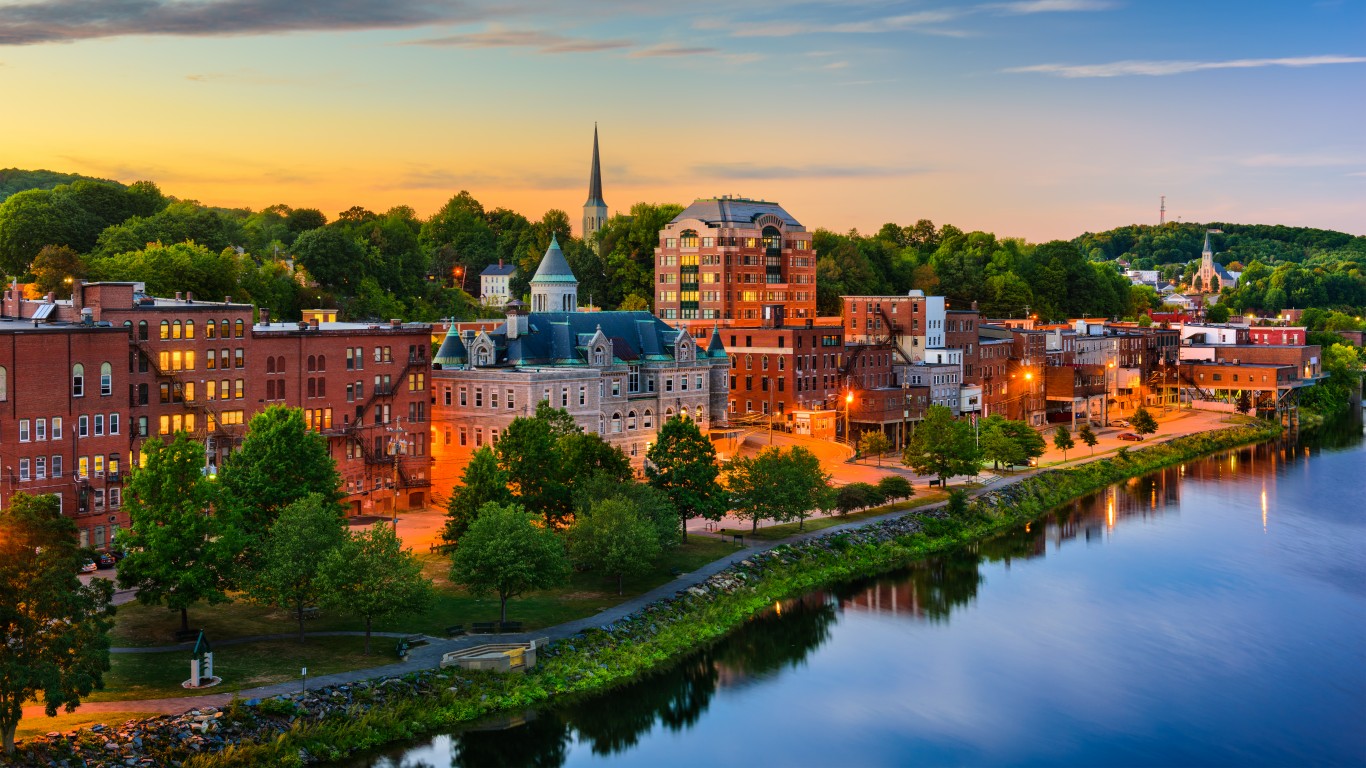
23. Maine
> 5-yr. annualized GDP growth through Q4 2020: +1.0% (23rd highest)
> 5-yr. annualized employment growth through March 2021: -0.7% (12th lowest)
> March 2021 unemployment rate: 4.8% (21st lowest)
> Poverty rate: 10.9% (19th lowest)
The COVID-19 pandemic took a heavy toll on Maine’s job market. Due largely to job cuts in the past year, overall employment has fallen at an average annual rate of 0.7% over the last half decade. Over the same period, employment climbed by 0.1% annually nationwide. Still, because Maine’s job market started from such a strong position, the state’s 4.8% unemployment rate is considerably lower than the 6.0% national rate.
Even in the face of job losses, Maine reported modest GDP growth over the last five years. The state’s relatively strong economic conditions contributed to residents being less likely than the average American to face serious financial hardship. Only 10.9% of Maine residents live below the poverty line compared to 12.3% of all Americans.

Source: Sean Pavone / Getty Images
24. Alabama
> 5-yr. annualized GDP growth through Q4 2020: +1.1% (20th highest)
> 5-yr. annualized employment growth through March 2021: +1.3% (7th highest)
> March 2021 unemployment rate: 3.8% (11th lowest)
> Poverty rate: 15.5% (7th highest)
Alamaba suffered a greater than average public health toll during the COVID-19 pandemic, with a high concentration of infections per capita. Still, its job market has emerged in better shape than most of the country, with unemployment standing at 3.8%, well below the national jobless rate of 6.0%. The state’s low unemployment is partially attributable to rapid job creation. Employment climbed at an average annual rate of 1.3% over the last half decade, compared to the national average annual growth of 0.1%.
Despite strong job growth and low unemployment, many in Alabama are struggling financially. Alabama’s poverty rate of 15.5% is among the highest of any state and well above the 12.3% U.S. poverty rate.
[in-text-ad-2]

Source: Sean Pavone / Getty Images
25. Tennessee
> 5-yr. annualized GDP growth through Q4 2020: +1.0% (25th highest)
> 5-yr. annualized employment growth through March 2021: +1.2% (8th highest)
> March 2021 unemployment rate: 5.0% (23rd lowest)
> Poverty rate: 13.9% (9th highest)
Tennessee reported some of the strongest job growth of any state in recent years. Overall employment in the state climbed at an average annual rate of 1.2% over the last half decade, while nationwide, employment grew at just a 0.1% pace, due largely to the COVID-19 pandemic. Today, 5.0% of the state’s labor force are out of work, below the 6.0% national unemployment rate.
Economic growth in Tennessee over the last five years falls in the middle of all states and is not especially strong or weak. A more rapid economic growth that all state residents benefit from would likely help reduce the share of residents living below the poverty line, which, at 13.9%, is among the 10 highest state poverty rates.

Source: f11photo / Getty Images
26. Missouri
> 5-yr. annualized GDP growth through Q4 2020: +0.7% (21st lowest)
> 5-yr. annualized employment growth through March 2021: +0.0% (23rd lowest)
> March 2021 unemployment rate: 4.2% (15th lowest)
> Poverty rate: 12.9% (18th highest)
Due in part to damage inflicted by the COVID-19 pandemic, economic growth has been relatively slow in Missouri. Average annual GDP growth in the state has been just 0.7% over the last five years, below the comparable 1.4% national average.
In other ways, however, Missouri’s economy compares favorably to much of the rest of the nation. For example, despite significant job losses during the pandemic, the state unemployment rate of 4.2% is lower than the rate in most other states and well below the 6.0% national rate.
[in-text-ad]

Source: Creative-Family / Getty Images
27. New Jersey
> 5-yr. annualized GDP growth through Q4 2020: +0.3% (13th lowest)
> 5-yr. annualized employment growth through March 2021: -0.9% (6th lowest)
> March 2021 unemployment rate: 7.7% (7th highest)
> Poverty rate: 9.2% (5th lowest)
With a higher than average per capita infection rate and a nation-leading death rate, New Jersey has been hit hard by COVID-19. The pandemic has also had devastating consequences for the state’s economy. Due to job losses during the pandemic, there are about 320,600 fewer jobs in the state than there were at this time last year. Currently, New Jersey’s unemployment rate of 7.7% is seventh highest among states and well above the 6.0% national rate.
Despite the economic damage wrought by the pandemic, other aspects of New Jersey’s economy are signs of strength. Home to one of the best-educated workforces in the country, New Jersey is one of only four states where more than 40% of adults have a bachelor’s degree. Additionally, only 9.2% of New Jersey residents live below the poverty line, well below the 12.3% national poverty rate.
 24/7 Wall St.
Source: pabradyphoto / Getty Images
28. Iowa
> 5-yr. annualized GDP growth through Q4 2020: +0.3% (14th lowest)
> 5-yr. annualized employment growth through March 2021: -0.9% (5th lowest)
> March 2021 unemployment rate: 3.7% (8th lowest)
> Poverty rate: 11.2% (20th lowest)
Job growth has been sluggish in Iowa in recent years. Due primarily to massive layoffs during the pandemic, overall employment in the state has fallen by an average of 0.9% annually over the last half decade. There are nearly 100,000 fewer people working in Iowa today than there were last year at this time. Still, unemployment has historically been low in the state, and despite the shock of the pandemic to Iowa’s job market, the state’s unemployment rate of 3.7% is lower than that of most of the rest of the country.
Despite steep job losses, Iowa is one of only a handful of states to report economic growth during the pandemic. From the end of 2019 through the end of 2020, Iowa’s economy expanded by 0.5%. Meanwhile, the U.S. economy contracted by 2.4% over the same period.

Source: Davel5957 / Getty Images
29. Ohio
> 5-yr. annualized GDP growth through Q4 2020: +0.7% (22nd lowest)
> 5-yr. annualized employment growth through March 2021: +0.0% (24th lowest)
> March 2021 unemployment rate: 4.7% (20th lowest)
> Poverty rate: 13.1% (15th highest)
There are about 70,000 fewer people working in Ohio today than there were one year ago. Despite job losses precipitated by the pandemic, the 4.7% unemployment rate in the state is lower than it was a year ago when it stood at 4.9%, and is well below the 6.0% national jobless rate.
GDP growth has been lackluster in Ohio in recent years. Due in part to a 2.4% contraction in 2020, Ohio’s economy expanded at an average annual rate of 0.7% over the last half decade — half the comparable national growth rate of 1.4%.
[in-text-ad-2]

Source: DenisTangneyJr / Getty Images
30. North Dakota
> 5-yr. annualized GDP growth through Q4 2020: -0.4% (7th lowest)
> 5-yr. annualized employment growth through March 2021: -0.6% (15th lowest)
> March 2021 unemployment rate: 4.4% (17th lowest)
> Poverty rate: 10.6% (17th lowest)
Resource extraction is one of the largest industries in North Dakota, and demand for those resources plummeted during the pandemic. Due in part to declining output in mining, quarrying, and oil and gas extraction during the pandemic, which resulted in considerable GDP contraction over the past year, North Dakota’s economy contracted at a rate of 0.4% a year over the last half decade.
The pandemic also triggered mass job losses in the state. Though North Dakota’s unemployment rate of 4.4% is below the 6.0% national rate, it is nearly double what it was this time last year.

Source: Sean Pavone / Getty Images
31. Texas
> 5-yr. annualized GDP growth through Q4 2020: +1.7% (12th highest)
> 5-yr. annualized employment growth through March 2021: +0.6% (15th highest)
> March 2021 unemployment rate: 6.9% (12th highest)
> Poverty rate: 13.6% (11th highest)
A large segment of Texas’ economy includes industries that were hit hardest during the COVID-19 pandemic such as oil and gas extraction. Partially as a result, Texas’ economic output fell by 1.9% from the end of 2019 through the end of 2020. The contraction was not enough to offset gains of previous years, however. The state’s economy expanded at an average pace of 1.7% a year over the last half decade, faster than the comparable national expansion of 1.4%.
Texas also reported stronger than average employment growth over the last five years. However, much of that growth was attributable to population growth, and the state’s 6.9% unemployment rate is well above the 6.0% national average.
[in-text-ad]
Source: SpVVK / Getty Images
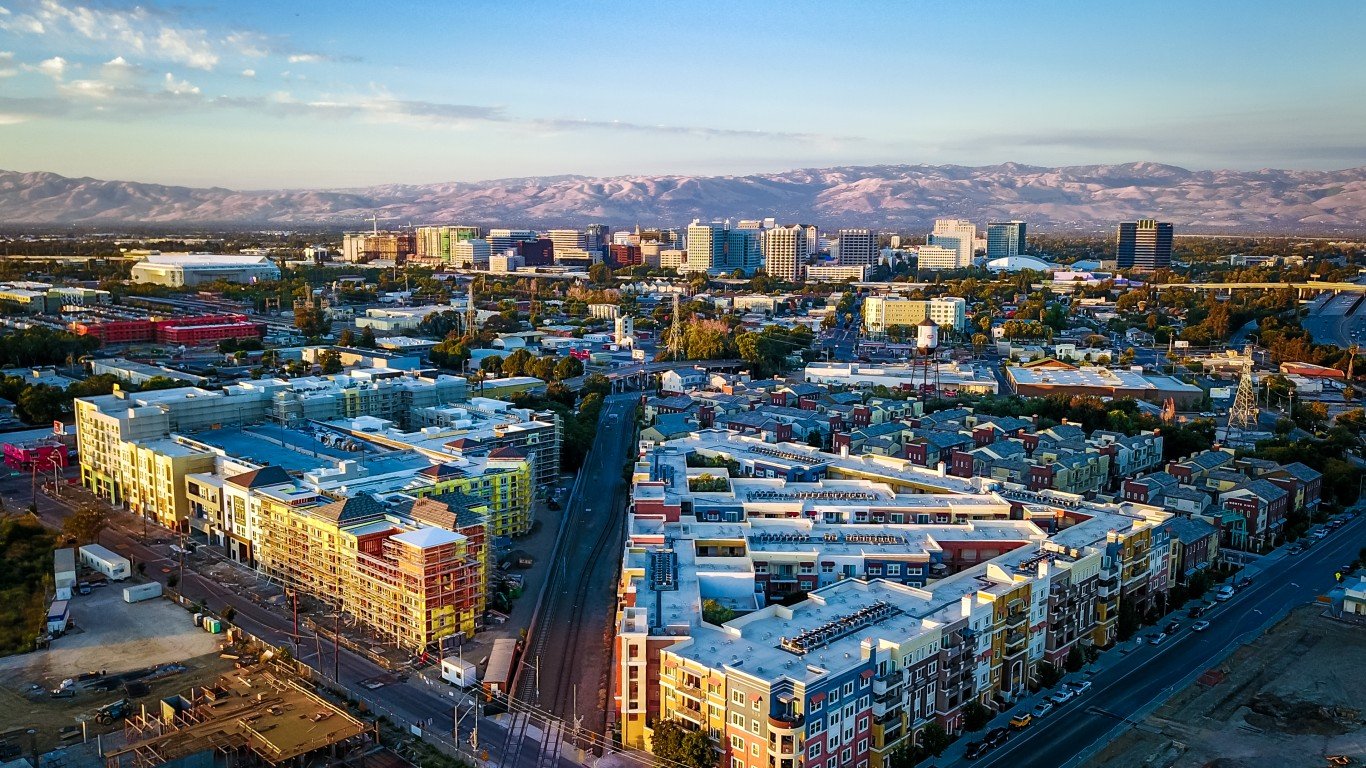
32. California
> 5-yr. annualized GDP growth through Q4 2020: +2.4% (7th highest)
> 5-yr. annualized employment growth through March 2021: -0.6% (13th lowest)
> March 2021 unemployment rate: 8.3% (3rd highest)
> Poverty rate: 11.8% (25th highest)
The unemployment crisis in California is nearly the worst in the country. As of March 2021, 8.3% of the labor force in the state were out of work, well above the 6.0% national jobless rate and higher than in all but two other states. The state’s high unemployment is largely the result of the COVID-19 pandemic as there are nearly 1 million fewer people working in California today than there were a year ago.
Despite the weak job market, economic growth has been relatively strong in California. Over the last half decade, the state’s GDP grew at an average rate of 2.4% a year — well above the 1.4% national rate and faster than all but six other states — even after weathering a 2.8% contraction during the pandemic.

Source: DenisTangneyJr / Getty Images
33. Delaware
> 5-yr. annualized GDP growth through Q4 2020: -0.6% (4th lowest)
> 5-yr. annualized employment growth through March 2021: +0.4% (17th highest)
> March 2021 unemployment rate: 6.5% (16th highest)
> Poverty rate: 11.3% (22nd lowest)
Delaware has reported some of the weakest economic growth of any state in recent years. Due to sharp contractions in industries like arts and entertainment, education services, and wholesale trade, Delaware’s GDP fell at an average annual rate of 0.6% from late 2015 to the end of 2020. Delaware’s jobless rate, at 6.5%, is also slightly higher than the U.S. unemployment rate of 6.0%.
In some other key measures, however, Delaware compares favorably to much of the rest of the country. For example, the state’s poverty rate of 11.3% is a full percentage point below the national poverty rate.
Source: photoquest7 / Getty Images
34. Nevada
> 5-yr. annualized GDP growth through Q4 2020: +1.9% (10th highest)
> 5-yr. annualized employment growth through March 2021: +1.5% (5th highest)
> March 2021 unemployment rate: 8.1% (6th highest)
> Poverty rate: 12.5% (21st highest)
Tourism is an economic pillar in Nevada, and the COVID-19 pandemic ground the state’s most important industry to a halt for much of last year. Partially as a result, Nevada’s economy contracted by 3.4% from the fourth quarter 2019 to the fourth quarter of 2020. While employment growth has been strong in the state in recent years, Nevada is now struggling with one of the worst unemployment crises in the country, as it is one of only six states where more than 8% of the labor force are out of work.
Going into the pandemic, Nevada’s economy was one of the fastest growing of any state. Even accounting for the COVID-19 recession, Nevada’s GDP increased at an average annual rate of 1.9% a year in the last half decade, faster than the comparable 1.4% national growth rate.
[in-text-ad-2]

Source: pawel.gaul / Getty Images
35. Michigan
> 5-yr. annualized GDP growth through Q4 2020: +0.4% (15th lowest)
> 5-yr. annualized employment growth through March 2021: -0.6% (16th lowest)
> March 2021 unemployment rate: 5.1% (25th highest)
> Poverty rate: 13.0% (17th highest)
There are over a quarter million fewer people working in Michigan today than there were at this time last year. Job losses attributable to the pandemic contributed to a 2.7% decline in overall employment in the state from 2016 to 2021, one of the larger employment declines among states.
Economic growth has also been stagnant in Michigan in recent years. Due in part to a 4.2% economic contraction in the last year, Michigan’s five-year average annual GDP growth rate was just 0.4%, less than one-third the comparable 1.4% national growth rate.
Source: collins_family / Flickr
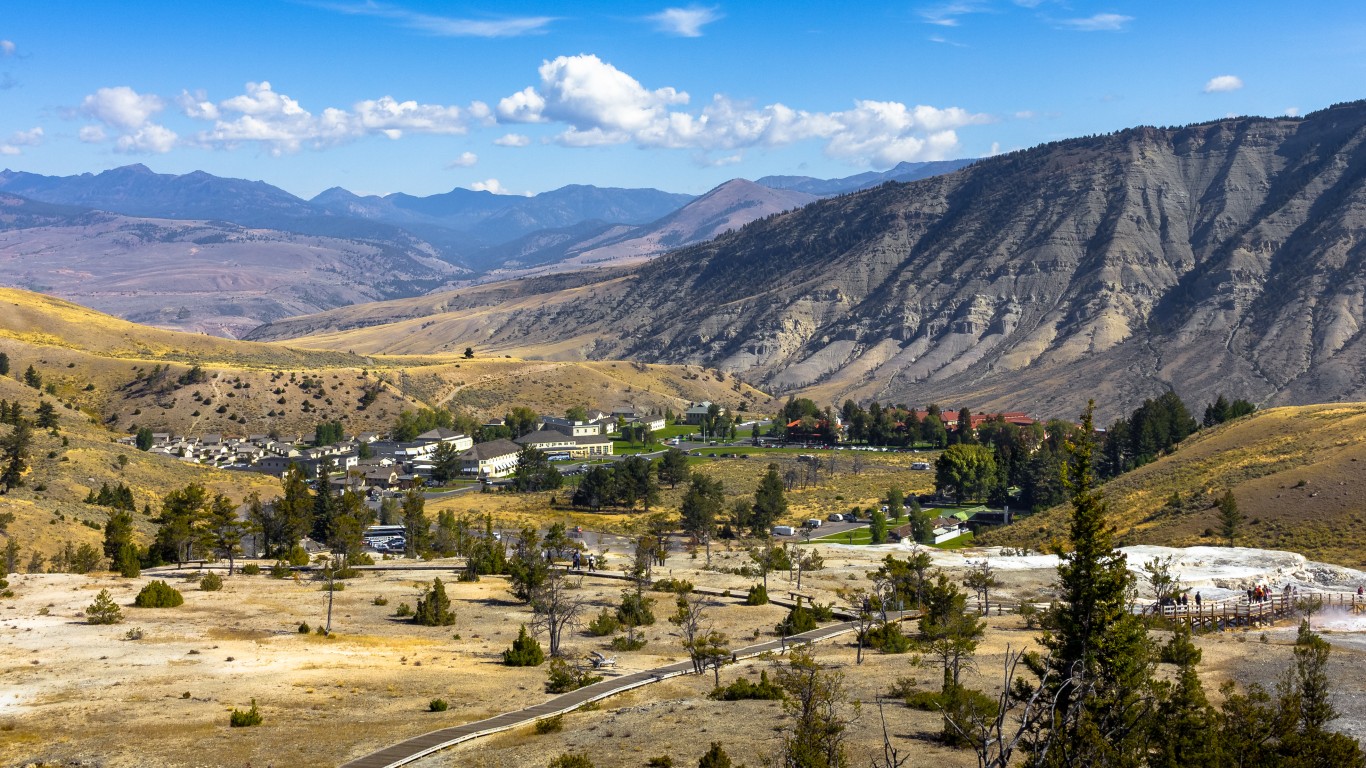
36. Wyoming
> 5-yr. annualized GDP growth through Q4 2020: -1.6% (the lowest)
> 5-yr. annualized employment growth through March 2021: -0.4% (17th lowest)
> March 2021 unemployment rate: 5.3% (23rd highest)
> Poverty rate: 10.1% (14th lowest)
Wyoming’s economy is more dependent than most states’ economies on industries that were exposed to significant slowdown during the COVID-19 pandemic. These include mining and oil and gas extraction as well as transportation and warehousing. As a result, the state’s GDP declined by a near-nation leading 7.0% from the fourth quarter of 2019 to the fourth quarter of 2020. The economic toll of the pandemic weighed down Wyoming’s average annual GDP growth rate of the last five years to -1.6%, the steepest drop of any state in the country.
Employment growth in Wyoming has also been slower than average in the last five years. Still, the state’s unemployment rate of 5.3% is lower than the 6.0% U.S. jobless rate.
[in-text-ad]

Source: SeanPavonePhoto / Getty Images
37. Rhode Island
> 5-yr. annualized GDP growth through Q4 2020: -0.5% (6th lowest)
> 5-yr. annualized employment growth through March 2021: -0.8% (11th lowest)
> March 2021 unemployment rate: 7.1% (10th highest)
> Poverty rate: 10.8% (18th lowest)
Rhode Island is one of several Northeastern states with struggling economies. The coronavirus pandemic not only took a greater than average public health toll on the state, it also sent unemployment soaring. There are over 36,000 fewer people working in Rhode Island than there were a year ago, and the jobless rate stands at 7.1%, well above the 6.0% U.S. rate.
Economic growth in Rhode Island has also been sluggish relative to much of the country. Due in part to falling output in industries like arts and entertainment and accommodation and food services, Rhode Island’s economy has contracted at an average rate of 0.5% over the past half decade.

Source: DenisTangneyJr / Getty Images
38. Oklahoma
> 5-yr. annualized GDP growth through Q4 2020: -0.6% (3rd lowest)
> 5-yr. annualized employment growth through March 2021: +0.4% (18th highest)
> March 2021 unemployment rate: 4.2% (15th lowest)
> Poverty rate: 15.2% (8th highest)
In many key measures, including poverty and economic growth, Oklahoma ranks well below most U.S. states. An estimated 15.2% of the state population live below the poverty line, one of the larger shares in the country and well above the 12.3% national poverty rate.
Oklahoma’s GDP growth has been weaker than that of nearly every other state in recent years. Since the end of 2015, the state’s economy has contracted at an average rate of 0.6% a year, due in large to steep output declines in the state’s educational services, transportation and warehousing, and resource extraction industries. Despite a shrinking economy, Oklahoma is one of the few states to have weathered the COVID-19 pandemic and emerged with more people working today than were at the same time last year.

Source: f11photo / Getty Images
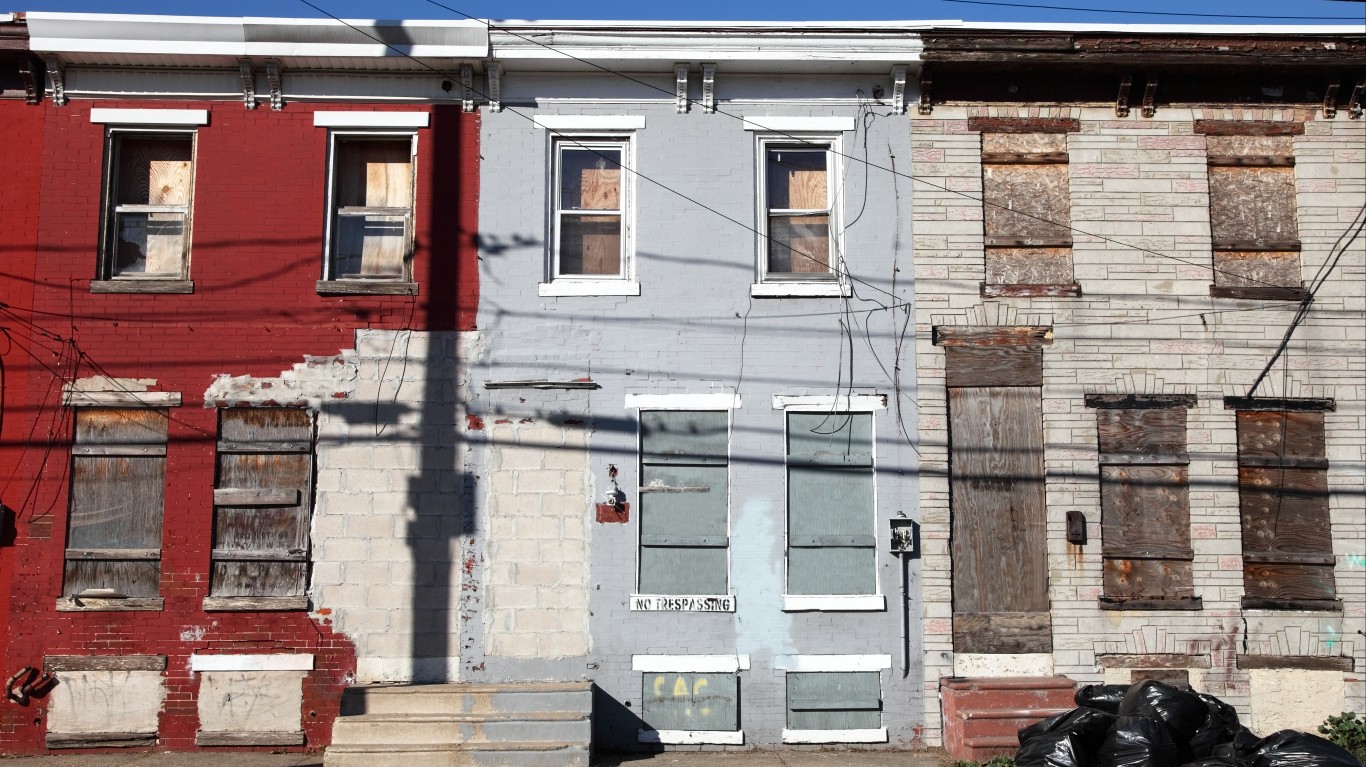
39. Pennsylvania
> 5-yr. annualized GDP growth through Q4 2020: +0.6% (20th lowest)
> 5-yr. annualized employment growth through March 2021: -0.8% (7th lowest)
> March 2021 unemployment rate: 7.3% (8th highest)
> Poverty rate: 12.0% (22nd highest)
Over the course of the last 12 months, Pennsylvania shed some 319,000 jobs. Due almost entirely to those jobs lost during the pandemic, employment in the state fell at an average of 0.8% per year over the last half decade. Currently, Pennsylvania’s unemployment rate of 7.3% is among the highest of any state and well above the 6.0% national rate.
GDP growth in the Keystone State has also been weak. The state’s economy expanded at a rate of just 0.6% per year over the last half decade, slower than most states and well below the comparable 1.4% U.S. growth. As is the case in most states, the effects of the COVID-19 pandemic lead to steep declines in output in Pennsylvania’s entertainment and accommodation and food services industries. The state also reported contraction in its agriculture sector between 2015 and 2020.
[in-text-ad-2]

Source: Sean Pavone / Getty Images
40. Illinois
> 5-yr. annualized GDP growth through Q4 2020: +0.2% (11th lowest)
> 5-yr. annualized employment growth through March 2021: -1.6% (4th lowest)
> March 2021 unemployment rate: 7.1% (10th highest)
> Poverty rate: 11.5% (25th lowest)
People are moving out of Illinois far faster than they are coming in. Over the last 10 years, the state’s population declined by 5.7% due to net migration alone, the second largest decline of any state. In addition to the nearly 417,000 jobs the state lost during the pandemic, overall employment in Illinois has fallen at a near worst-in-the-nation average rate of 1.6% per year in the last half decade. Currently, the state’s 7.1% jobless rate is well above the comparable 6.0% national rate.
Economic growth in Illinois has also trailed much of the nation. The state’s economy expanded at a rate of just 0.2% per year over the last half decade, slower than most states and well below the comparable 1.4% U.S. annual average growth.

Source: FilippoBacci / Getty Images
41. New York
> 5-yr. annualized GDP growth through Q4 2020: +0.8% (25th lowest)
> 5-yr. annualized employment growth through March 2021: -0.8% (9th lowest)
> March 2021 unemployment rate: 8.5% (2nd highest)
> Poverty rate: 13.0% (16th highest)
New York state is up against one of the worst unemployment crises in the country. An estimated 8.5% of the state’s labor force are out of work, the second largest share of any state and well above the 6.0% U.S. unemployment rate. Much of the state’s current unemployment problems are the result of the pandemic as just a year ago, New York’s jobless rate was just 3.9%. Since then, the number of people working in the state has fallen by nearly 400,000.
Even before the pandemic, New York’s economy lagged behind that of most other states in its ability to lift people out of poverty. New York’s 13.0% poverty rate is higher than the 12.3% national rate.
[in-text-ad]
Source: DenisTangneyJr / Getty Images
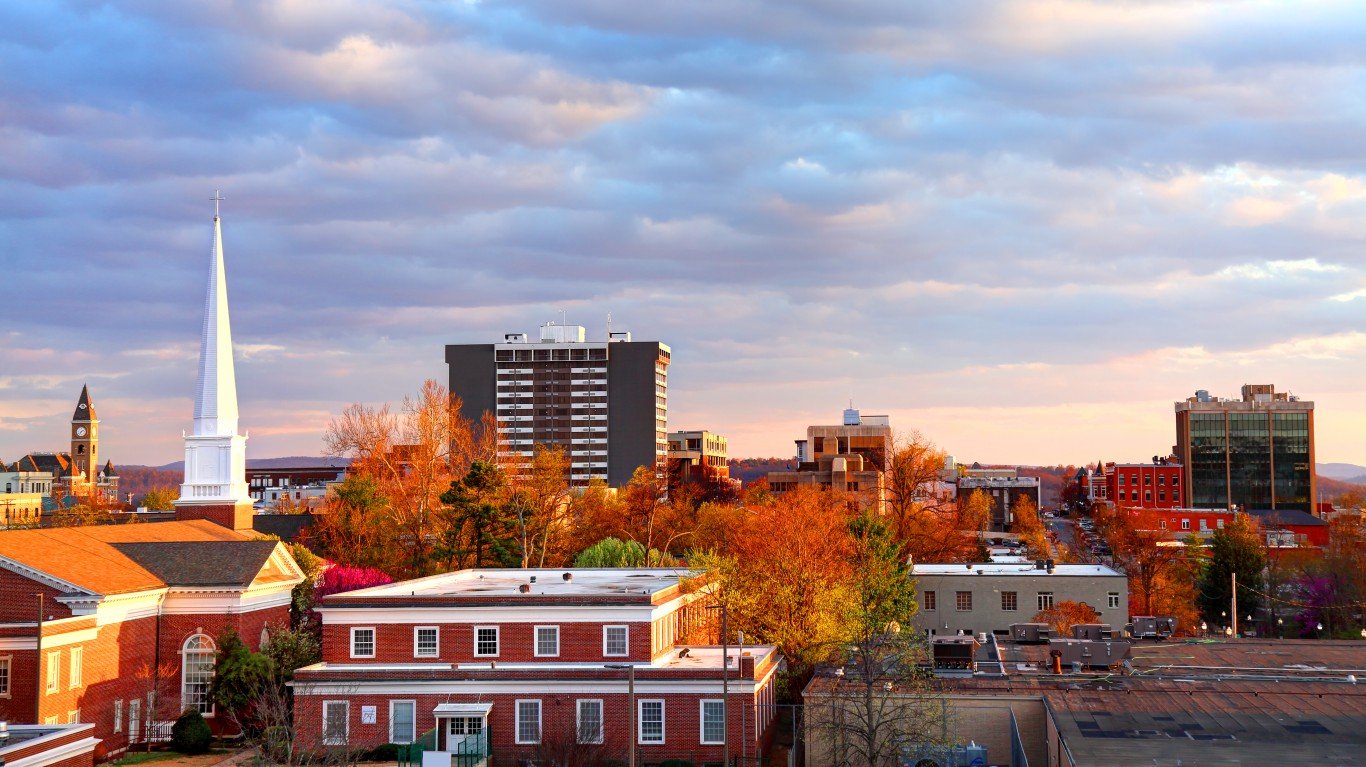
42. Arkansas
> 5-yr. annualized GDP growth through Q4 2020: +0.6% (19th lowest)
> 5-yr. annualized employment growth through March 2021: +0.1% (24th highest)
> March 2021 unemployment rate: 4.4% (17th lowest)
> Poverty rate: 16.2% (5th highest)
Arkansas is one of the poorest states in the country. An estimated 16.2% of state residents live on poverty level income, the fifth largest share among states and well above the 12.3% U.S. poverty rate.
Stronger GDP growth, broadly shared across all income levels, would likely go a long way to reducing financial hardship in the state. Over the last five years, Arkansas’ economy has expanded at an average pace of only 0.6% annually, well below the comparable 1.4% national growth rate. Since 2015, the state’s resource extraction, agriculture, and hospitality industries have been significant drags on economic growth.

Source: volvob12b / Flickr
43. Alaska
> 5-yr. annualized GDP growth through Q4 2020: -0.8% (2nd lowest)
> 5-yr. annualized employment growth through March 2021: -0.8% (10th lowest)
> March 2021 unemployment rate: 6.6% (15th highest)
> Poverty rate: 10.1% (13th lowest)
Alaska is one several states with a dependence on resource extraction that proved to be a liability during the COVID-19 pandemic. Due in part to falling oil prices and reduced demand during the pandemic, economic output in Alaska’s mining, quarrying, and oil and gas extraction industry fell by over 15% between the fourth quarter of 2015 and the fourth quarter of 2020. Partially as a result, the state’s GDP contracted at an average rate of 0.8% a year over the same period.
Alaska also shed nearly 9,000 jobs in the last year, and partially as a result, unemployment in the state stands at 6.6%, above the 6.0% national unemployment rate.

Source: SeanPavonePhoto / Getty Images
44. Connecticut
> 5-yr. annualized GDP growth through Q4 2020: +0.1% (10th lowest)
> 5-yr. annualized employment growth through March 2021: -2.4% (the lowest)
> March 2021 unemployment rate: 8.3% (3rd highest)
> Poverty rate: 10.0% (12th lowest)
Connecticut is shedding jobs faster than every other state. There are over a quarter of a million fewer people working in the state now than there were at the same time last year, and over the last half decade, the number of people working in the state has declined by a nation-leading 11.5%. Falling employment in the state is attributable not only to the COVID-19 pandemic, but also to longer-term population decline. Nearly 73,000 more people left Connecticut than moved to the state between 2010 and 2020.
Population decline, as well as the pandemic, are also contributing factors to the state’s sluggish economic growth. Over the last half decade, Connecticut’s GDP grew at an average annual rate of just 0.1%. Meanwhile, the U.S. economy grew at a 1.4% annual rate over the same period.
[in-text-ad-2]

Source: Davel5957 / Getty Images
45. Kentucky
> 5-yr. annualized GDP growth through Q4 2020: +0.5% (17th lowest)
> 5-yr. annualized employment growth through March 2021: -0.1% (20th lowest)
> March 2021 unemployment rate: 5.0% (23rd lowest)
> Poverty rate: 16.3% (4th highest)
Kentucky’s economy has lagged behind that of most U.S. states in its ability to lift people out of poverty. The poverty rate in Kentucky stands at 16.3%, higher than in all but three other states and 4 percentage points higher than the national rate.
Job growth has been weak in the state in recent years as well. In the last year alone, Kentucky shed over 97,000 jobs. Still, Kentucky’s unemployment rate rate of 5.0% is below the 6.0% national jobless rate.

Source: okimo / iStock via Getty Images
46. Hawaii
> 5-yr. annualized GDP growth through Q4 2020: -0.5% (5th lowest)
> 5-yr. annualized employment growth through March 2021: -2.1% (2nd lowest)
> March 2021 unemployment rate: 9.0% (the highest)
> Poverty rate: 9.3% (6th lowest)
Hawaii has reported fewer COVID-19 cases per capita than every other state. While the public health toll of the pandemic has been minimal, the economic toll has been devastating. Tourism, an industry that all but ground to a halt for much of 2020, is an economic pillar in Hawaii. Due in large part to the tens of thousands of jobs that were lost in the state during the pandemic, total employment in Hawaii declined by 10% between 2016 and 2021. Nationwide, employment rose 0.3% over the same period.
Joblessness in Hawaii is widespread. Unemployment in the state stands at a national-high 9.0% — 50% higher than the 6.0% U.S. unemployment rate.
[in-text-ad]

Source: Sean Pavone / Getty Images
47. West Virginia
> 5-yr. annualized GDP growth through Q4 2020: -0.2% (8th lowest)
> 5-yr. annualized employment growth through March 2021: +0.3% (19th highest)
> March 2021 unemployment rate: 5.9% (21st highest)
> Poverty rate: 16.0% (6th highest)
West Virginia has some of the weakest economic conditions of any state. Over the last five years, the state’s GDP has fallen at an average annual rate of 0.2%. For context, the U.S. economy expanded by an average of 1.4% annually over the same period. Economic contraction is likely due in part to long-term population decline, as there are over 68,000 fewer people living in West Virginia now than there were in 2010.
Because of economic conditions in West Virginia, a relatively large share of its population remains vulnerable to serious financial hardship. The state’s poverty rate of 16.0% is among the highest in the U.S. and well above the 12.3% national poverty rate.

Source: ferrantraite / Getty Images
48. New Mexico
> 5-yr. annualized GDP growth through Q4 2020: +1.1% (22nd highest)
> 5-yr. annualized employment growth through March 2021: -0.1% (22nd lowest)
> March 2021 unemployment rate: 8.3% (3rd highest)
> Poverty rate: 18.2% (3rd highest)
Residents of New Mexico are far less likely to be financially secure than most Americans. An estimated 18.2% of state residents live below the poverty line, the third largest share of any state and well above the 12.3% share of Americans nationwide.
The poverty rate in New Mexico would likely be reduced with a stronger job market. Currently, unemployment in the state stands at 8.3%, one of the highest jobless rates of any state. Due largely to job losses during the pandemic, there are nearly 33,600 fewer jobs in New Mexico now than there were in 2016.

Source: SeanPavonePhoto / Getty Images
49. Mississippi
> 5-yr. annualized GDP growth through Q4 2020: +0.5% (16th lowest)
> 5-yr. annualized employment growth through March 2021: +0.1% (25th highest)
> March 2021 unemployment rate: 6.3% (18th highest)
> Poverty rate: 19.6% (the highest)
Economic conditions in Mississippi have resulted in the poorest population in the United States. An estimated 19.6% of the state’s population — or nearly one in every five residents — live below the poverty line, the highest poverty rate in the country and well above the 12.3% national rate.
Due in part to declines in the arts and entertainment and resource extraction sectors, Mississippi’s economy has grown at an average annual rate of just 0.5% — roughly one-third of the comparable national growth rate. At 6.3%, the unemployment rate in Mississippi is slightly higher than the U.S. rate, and nearly 9.0% of all workers living in Mississippi work in jobs in other states.
[in-text-ad-2]

50. Louisiana
> 5-yr. annualized GDP growth through Q4 2020: +0.3% (12th lowest)
> 5-yr. annualized employment growth through March 2021: -0.8% (8th lowest)
> March 2021 unemployment rate: 7.3% (8th highest)
> Poverty rate: 19.0% (2nd highest)
Louisiana’s economy ranks as the worst in the United States. The state shed nearly 114,000 jobs during the pandemic, and partially as a result, employment is down 4.1% from where it was five years ago. Currently, 7.3% of the labor force in Louisiana are out of work, one of the higher jobless rates among states and well above the 6.0% national unemployment rate.
An estimated 19.0% of the state’s population live below the poverty line, the second largest share of any state and well above the 12.3% national poverty rate. The widespread financial hardship in Louisiana is indicative of deeply seated economic problems.
Take This Retirement Quiz To Get Matched With A Financial Advisor (Sponsored)
Take the quiz below to get matched with a financial advisor today.
Each advisor has been vetted by SmartAsset and is held to a fiduciary standard to act in your best interests.
Here’s how it works:
1. Answer SmartAsset advisor match quiz
2. Review your pre-screened matches at your leisure. Check out the
advisors’ profiles.
3. Speak with advisors at no cost to you. Have an introductory call on the phone or introduction in person and choose whom to work with in the future
Take the retirement quiz right here.
Thank you for reading! Have some feedback for us?
Contact the 24/7 Wall St. editorial team.
Editors' Picks