
Vaccine distribution is well underway across the United States. Still, the novel coronavirus continues to spread and claim American lives. In the past week alone, there were an average of 597 new deaths attributed to the virus every day.
Since the first COVID-19-related death was reported in the United States on Feb. 29, 2020, there have been a total of 580,983 COVID-19 deaths nationwide, equal to about 178 for every 100,000 Americans.
Of course, deaths attributable to the virus are not evenly spread across the country. While there are still counties and county equivalents that have not reported a single COVID-19 death, nearly every state has at least one county where the number of deaths attributable to the virus per capita exceeds the national rate — sometimes by orders of magnitude. There are 14 states home to at least one county where COVID-19 deaths per capita are at least three times higher than they are nationwide. In one county in Virginia, there have been a total of 798 coronavirus deaths for every 100,000 people.
Counties and county equivalents where COVID-19 deaths are highly concentrated are often home to larger populations of individuals at increased risk of severe illness if they are infected. One such group is retirement-age Americans. Americans 65 and older are at least 90 times more likely to die from the virus, if infected, than those in the 18 to 29 age range. The vast majority of the places on this list are home to a larger concentration of 65 and older residents than the state as a whole.
In addition to more vulnerable populations, the places on this list also tend to have a higher than average per capita COVID-19 cases. In 38 states, the county or county equivalent with the most COVID-19 deaths per 100,000 also has a higher number of confirmed cases per 100,000 than the state as a whole.
All COVID-19 data used in this story are current as of May 19, 2021.

Alabama: Hale County
> COVID-19 deaths in Hale: 524 per 100,000 people (total: 78)
> COVID-19 deaths in Alabama: 226 per 100,000 people (total: 11,041)
> COVID-19 cases in Hale: 15,047 per 100,000 people (total: 2,240)
> COVID-19 cases in Alabama: 11,060 per 100,000 people (total: 540,599)
> 65 and older population: 18.8% in Hale, 16.5% in Alabama
Source: Mitchell Forbes / iStock via Getty Images
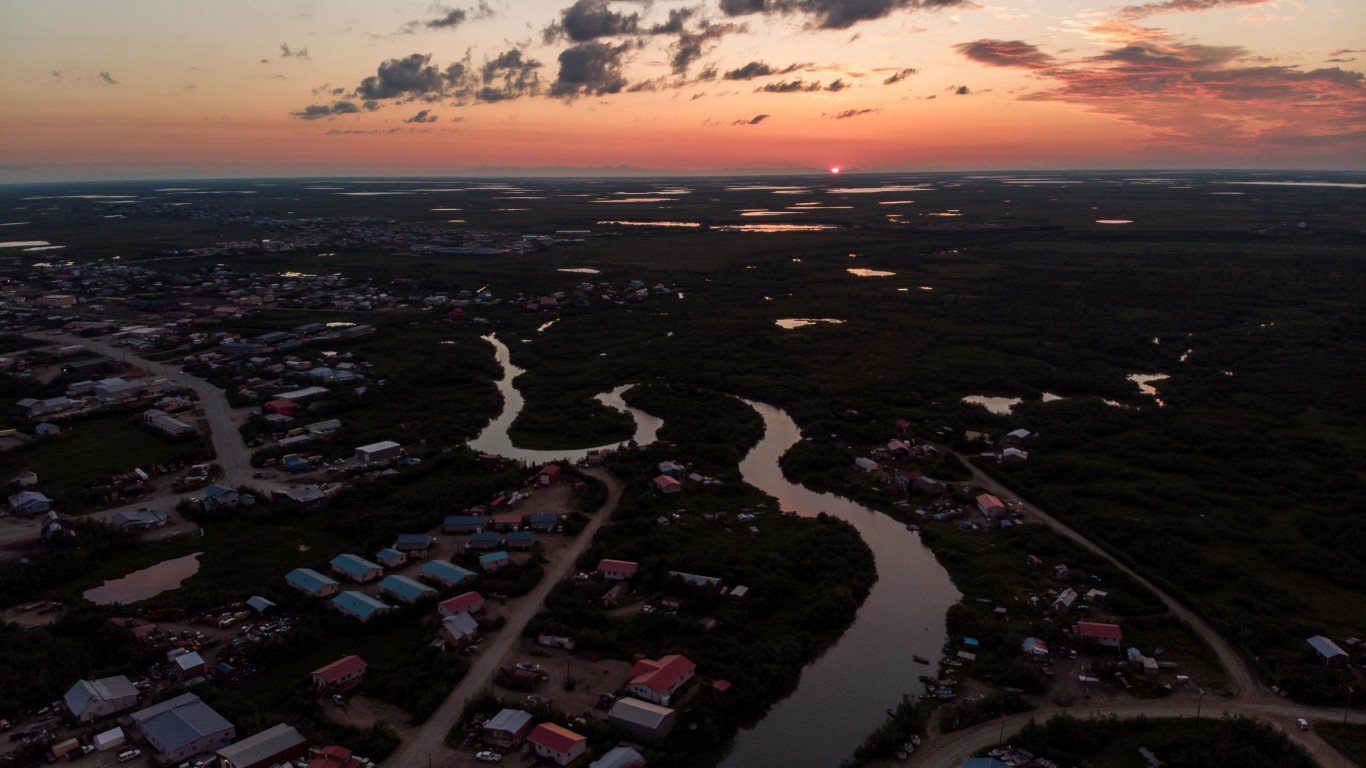
Alaska: Bethel Census Area
> COVID-19 deaths in Bethel: 122 per 100,000 people (total: 22)
> COVID-19 deaths in Alaska: 49 per 100,000 people (total: 358)
> COVID-19 cases in Bethel: 21,569 per 100,000 people (total: 3,891)
> COVID-19 cases in Alaska: 9,060 per 100,000 people (total: 66,814)
> 65 and older population: 7.2% in Bethel, 11.2% in Alaska
These are all the counties in Alaska where COVID-19 is slowing (and where it’s still getting worse).

Source: CampPhoto / Getty Images
Arizona: Apache County
> COVID-19 deaths in Apache: 603 per 100,000 people (total: 431)
> COVID-19 deaths in Arizona: 244 per 100,000 people (total: 17,466)
> COVID-19 cases in Apache: 15,928 per 100,000 people (total: 11,392)
> COVID-19 cases in Arizona: 12,179 per 100,000 people (total: 873,446)
> 65 and older population: 15.0% in Apache, 17.1% in Arizona

Source: BOB WESTON / iStock via Getty Images
Arkansas: Fulton County
> COVID-19 deaths in Fulton: 387 per 100,000 people (total: 47)
> COVID-19 deaths in Arkansas: 192 per 100,000 people (total: 5,796)
> COVID-19 cases in Fulton: 9,342 per 100,000 people (total: 1,134)
> COVID-19 cases in Arkansas: 11,243 per 100,000 people (total: 338,849)
> 65 and older population: 25.5% in Fulton, 16.6% in Arkansas

Source: santalechuga / iStock via Getty Images
California: Imperial County
> COVID-19 deaths in Imperial: 405 per 100,000 people (total: 729)
> COVID-19 deaths in California: 155 per 100,000 people (total: 61,510)
> COVID-19 cases in Imperial: 15,823 per 100,000 people (total: 28,516)
> COVID-19 cases in California: 9,267 per 100,000 people (total: 3,665,904)
> 65 and older population: 12.6% in Imperial, 14.0% in California

Colorado: Bent County
> COVID-19 deaths in Bent: 362 per 100,000 people (total: 21)
> COVID-19 deaths in Colorado: 113 per 100,000 people (total: 6,450)
> COVID-19 cases in Bent: 26,442 per 100,000 people (total: 1,536)
> COVID-19 cases in Colorado: 9,347 per 100,000 people (total: 532,389)
> 65 and older population: 17.9% in Bent, 13.8% in Colorado

Source: DenisTangneyJr / Getty Images
Connecticut: Hartford County
> COVID-19 deaths in Hartford: 270 per 100,000 people (total: 2416)
> COVID-19 deaths in Connecticut: 229 per 100,000 people (total: 8,194)
> COVID-19 cases in Hartford: 9,331 per 100,000 people (total: 83,483)
> COVID-19 cases in Connecticut: 9,675 per 100,000 people (total: 345,639)
> 65 and older population: 16.8% in Hartford, 16.8% in Connecticut

Source: aimintang / Getty Images
Delaware: Sussex County
> COVID-19 deaths in Sussex: 223 per 100,000 people (total: 489)
> COVID-19 deaths in Delaware: 171 per 100,000 people (total: 1,651)
> COVID-19 cases in Sussex: 11,704 per 100,000 people (total: 25,696)
> COVID-19 cases in Delaware: 11,072 per 100,000 people (total: 107,089)
> 65 and older population: 27.0% in Sussex, 18.2% in Delaware

Florida: Union County
> COVID-19 deaths in Union: 486 per 100,000 people (total: 74)
> COVID-19 deaths in Florida: 170 per 100,000 people (total: 36,133)
> COVID-19 cases in Union: 12,048 per 100,000 people (total: 1,836)
> COVID-19 cases in Florida: 10,569 per 100,000 people (total: 2,251,148)
> 65 and older population: 15.0% in Union, 20.1% in Florida
Source: BOB WESTON / iStock via Getty Images
Georgia: Hancock County
> COVID-19 deaths in Hancock: 773 per 100,000 people (total: 66)
> COVID-19 deaths in Georgia: 195 per 100,000 people (total: 20,506)
> COVID-19 cases in Hancock: 10,721 per 100,000 people (total: 915)
> COVID-19 cases in Georgia: 10,609 per 100,000 people (total: 1,116,008)
> 65 and older population: 22.4% in Hancock, 13.5% in Georgia

Source: sorincolac / iStock
Hawaii: Honolulu County
> COVID-19 deaths in Honolulu: 38 per 100,000 people (total: 380)
> COVID-19 deaths in Hawaii: 34 per 100,000 people (total: 489)
> COVID-19 cases in Honolulu: 2,692 per 100,000 people (total: 26,583)
> COVID-19 cases in Hawaii: 2,302 per 100,000 people (total: 32,694)
> 65 and older population: 17.3% in Honolulu, 17.8% in Hawaii
These are all the counties in Hawaii where COVID-19 is slowing (and where it’s still getting worse).

Source: csfotoimages / iStock Editorial via Getty Images
Idaho: Shoshone County
> COVID-19 deaths in Shoshone: 271 per 100,000 people (total: 34)
> COVID-19 deaths in Idaho: 118 per 100,000 people (total: 2,069)
> COVID-19 cases in Shoshone: 8,973 per 100,000 people (total: 1,124)
> COVID-19 cases in Idaho: 10,847 per 100,000 people (total: 190,279)
> 65 and older population: 22.3% in Shoshone, 15.4% in Idaho
These are all the counties in Idaho where COVID-19 is slowing (and where it’s still getting worse).
Source: Public Domain / Wikimedia Commons
Illinois: Stark County
> COVID-19 deaths in Stark: 436 per 100,000 people (total: 24)
> COVID-19 deaths in Illinois: 195 per 100,000 people (total: 24,801)
> COVID-19 cases in Stark: 11,600 per 100,000 people (total: 638)
> COVID-19 cases in Illinois: 10,731 per 100,000 people (total: 1,367,214)
> 65 and older population: 21.9% in Stark, 15.2% in Illinois

Indiana: Pulaski County
> COVID-19 deaths in Pulaski: 355 per 100,000 people (total: 45)
> COVID-19 deaths in Indiana: 202 per 100,000 people (total: 13,486)
> COVID-19 cases in Pulaski: 9,273 per 100,000 people (total: 1,174)
> COVID-19 cases in Indiana: 10,998 per 100,000 people (total: 735,999)
> 65 and older population: 18.9% in Pulaski, 15.4% in Indiana

Source: BOB WESTON / iStock via Getty Images
Iowa: Harrison County
> COVID-19 deaths in Harrison: 516 per 100,000 people (total: 73)
> COVID-19 deaths in Iowa: 190 per 100,000 people (total: 6,006)
> COVID-19 cases in Harrison: 12,706 per 100,000 people (total: 1,797)
> COVID-19 cases in Iowa: 11,707 per 100,000 people (total: 369,489)
> 65 and older population: 19.4% in Harrison, 16.7% in Iowa
These are all the counties in Iowa where COVID-19 is slowing (and where it’s still getting worse).

Source: marekuliasz / iStock via Getty Images
Kansas: Gove County
> COVID-19 deaths in Gove: 725 per 100,000 people (total: 19)
> COVID-19 deaths in Kansas: 173 per 100,000 people (total: 5,040)
> COVID-19 cases in Gove: 14,738 per 100,000 people (total: 386)
> COVID-19 cases in Kansas: 10,719 per 100,000 people (total: 312,073)
> 65 and older population: 26.6% in Gove, 15.4% in Kansas
These are all the counties in Kansas where COVID-19 is slowing (and where it’s still getting worse).

Source: BOB WESTON / iStock via Getty Images
Kentucky: Robertson County
> COVID-19 deaths in Robertson: 653 per 100,000 people (total: 14)
> COVID-19 deaths in Kentucky: 149 per 100,000 people (total: 6,662)
> COVID-19 cases in Robertson: 10,733 per 100,000 people (total: 230)
> COVID-19 cases in Kentucky: 10,134 per 100,000 people (total: 452,821)
> 65 and older population: 21.5% in Robertson, 16.0% in Kentucky

Source: BOB WESTON / iStock via Getty Images
Louisiana: Bienville Parish
> COVID-19 deaths in Bienville: 600 per 100,000 people (total: 82)
> COVID-19 deaths in Louisiana: 225 per 100,000 people (total: 10,489)
> COVID-19 cases in Bienville: 12,248 per 100,000 people (total: 1,674)
> COVID-19 cases in Louisiana: 9,999 per 100,000 people (total: 465,946)
> 65 and older population: 20.3% in Bienville, 15.0% in Louisiana

Source: Holcy / iStock via Getty Images
Maine: Oxford County
> COVID-19 deaths in Oxford: 112 per 100,000 people (total: 64)
> COVID-19 deaths in Maine: 60 per 100,000 people (total: 805)
> COVID-19 cases in Oxford: 6,086 per 100,000 people (total: 3,489)
> COVID-19 cases in Maine: 4,940 per 100,000 people (total: 66,115)
> 65 and older population: 21.2% in Oxford, 20.0% in Maine
These are all the counties in Maine where COVID-19 is slowing (and where it’s still getting worse).
Source: Matthew Van Dyke / iStock via Getty Images
Maryland: Allegany County
> COVID-19 deaths in Allegany: 289 per 100,000 people (total: 208)
> COVID-19 deaths in Maryland: 148 per 100,000 people (total: 8,945)
> COVID-19 cases in Allegany: 9,645 per 100,000 people (total: 6,942)
> COVID-19 cases in Maryland: 7,553 per 100,000 people (total: 456,428)
> 65 and older population: 19.8% in Allegany, 15.0% in Maryland

Massachusetts: Hampden County
> COVID-19 deaths in Hampden: 322 per 100,000 people (total: 1510)
> COVID-19 deaths in Massachusetts: 257 per 100,000 people (total: 17,772)
> COVID-19 cases in Hampden: 11,036 per 100,000 people (total: 51,771)
> COVID-19 cases in Massachusetts: 10,176 per 100,000 people (total: 702,338)
> 65 and older population: 16.5% in Hampden, 16.2% in Massachusetts

Source: SteveDeming / iStock via Getty Images
Michigan: Iron County
> COVID-19 deaths in Iron: 455 per 100,000 people (total: 51)
> COVID-19 deaths in Michigan: 198 per 100,000 people (total: 19,812)
> COVID-19 cases in Iron: 9,285 per 100,000 people (total: 1,041)
> COVID-19 cases in Michigan: 9,793 per 100,000 people (total: 978,915)
> 65 and older population: 30.0% in Iron, 16.7% in Michigan

Minnesota: Kittson County
> COVID-19 deaths in Kittson: 507 per 100,000 people (total: 22)
> COVID-19 deaths in Minnesota: 132 per 100,000 people (total: 7,389)
> COVID-19 cases in Kittson: 11,229 per 100,000 people (total: 487)
> COVID-19 cases in Minnesota: 10,604 per 100,000 people (total: 595,016)
> 65 and older population: 23.9% in Kittson, 15.4% in Minnesota

Source: BOB WESTON / Getty Images
Mississippi: Neshoba County
> COVID-19 deaths in Neshoba: 599 per 100,000 people (total: 176)
> COVID-19 deaths in Mississippi: 243 per 100,000 people (total: 7,257)
> COVID-19 cases in Neshoba: 13,729 per 100,000 people (total: 4,033)
> COVID-19 cases in Mississippi: 10,548 per 100,000 people (total: 315,026)
> 65 and older population: 15.7% in Neshoba, 15.4% in Mississippi

Missouri: Grundy County
> COVID-19 deaths in Grundy: 339 per 100,000 people (total: 34)
> COVID-19 deaths in Missouri: 147 per 100,000 people (total: 8,990)
> COVID-19 cases in Grundy: 9,891 per 100,000 people (total: 993)
> COVID-19 cases in Missouri: 9,693 per 100,000 people (total: 593,856)
> 65 and older population: 21.7% in Grundy, 16.5% in Missouri

Source: RiverNorthPhotography / iStock via Getty Images
Montana: Big Horn County
> COVID-19 deaths in Big Horn: 568 per 100,000 people (total: 76)
> COVID-19 deaths in Montana: 150 per 100,000 people (total: 1,598)
> COVID-19 cases in Big Horn: 19,206 per 100,000 people (total: 2,569)
> COVID-19 cases in Montana: 10,423 per 100,000 people (total: 110,723)
> 65 and older population: 12.1% in Big Horn, 18.2% in Montana
Source: Public Domain / Wikimedia Commons
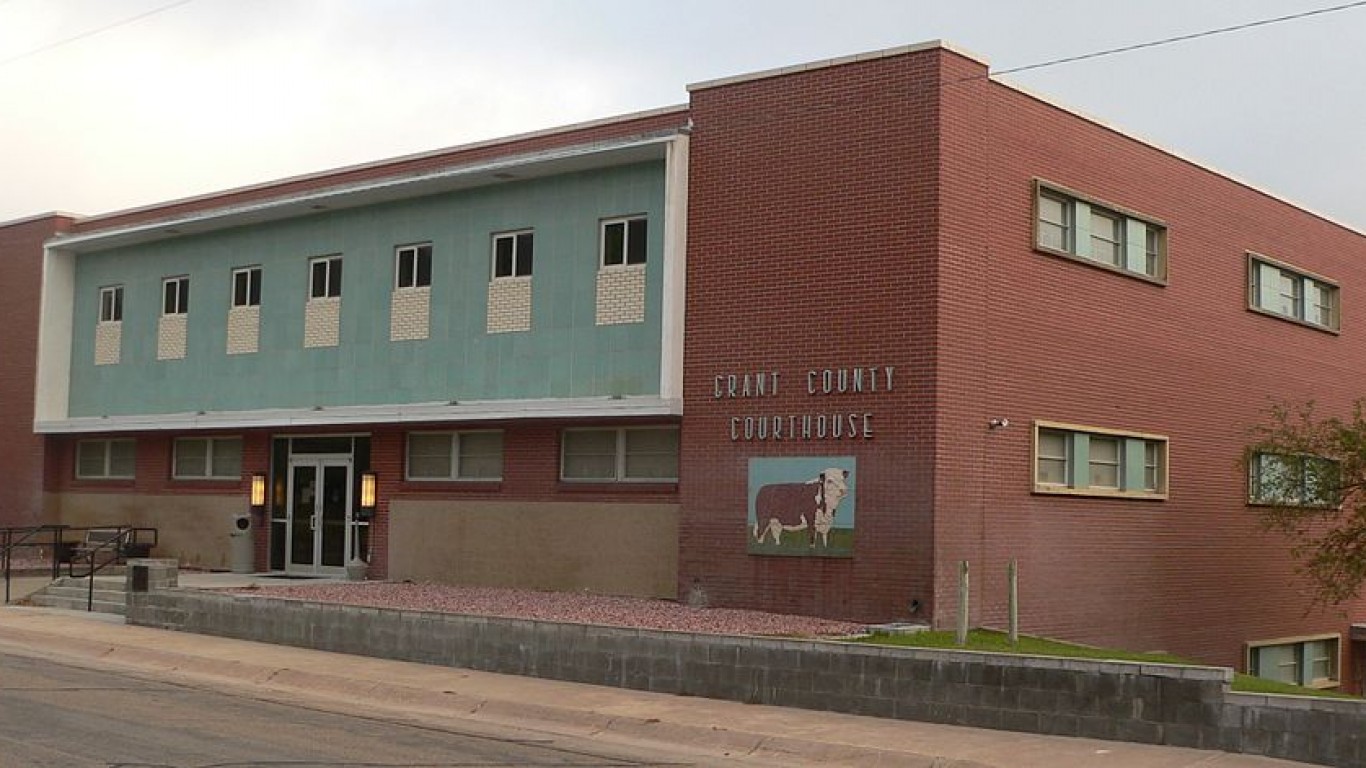
Nebraska: Grant County
> COVID-19 deaths in Grant: 557 per 100,000 people (total: 4)
> COVID-19 deaths in Nebraska: 117 per 100,000 people (total: 2,266)
> COVID-19 cases in Grant: 5,571 per 100,000 people (total: 40)
> COVID-19 cases in Nebraska: 11,533 per 100,000 people (total: 222,512)
> 65 and older population: 21.1% in Grant, 15.4% in Nebraska

Source: BOB WESTON / iStock via Getty Images
Nevada: Pershing County
> COVID-19 deaths in Pershing: 303 per 100,000 people (total: 20)
> COVID-19 deaths in Nevada: 182 per 100,000 people (total: 5,533)
> COVID-19 cases in Pershing: 14,430 per 100,000 people (total: 954)
> COVID-19 cases in Nevada: 10,581 per 100,000 people (total: 321,081)
> 65 and older population: 15.7% in Pershing, 15.4% in Nevada
These are all the counties in Nevada where COVID-19 is slowing (and where it’s still getting worse).

Source: DenisTangneyJr / iStock via Getty Images
New Hampshire: Belknap County
> COVID-19 deaths in Belknap: 165 per 100,000 people (total: 100)
> COVID-19 deaths in New Hampshire: 98 per 100,000 people (total: 1,333)
> COVID-19 cases in Belknap: 6,685 per 100,000 people (total: 4,054)
> COVID-19 cases in New Hampshire: 7,208 per 100,000 people (total: 97,774)
> 65 and older population: 21.4% in Belknap, 17.5% in New Hampshire

New Jersey: Passaic County
> COVID-19 deaths in Passaic: 378 per 100,000 people (total: 1904)
> COVID-19 deaths in New Jersey: 292 per 100,000 people (total: 25,975)
> COVID-19 cases in Passaic: 14,359 per 100,000 people (total: 72,374)
> COVID-19 cases in New Jersey: 11,350 per 100,000 people (total: 1,011,106)
> 65 and older population: 14.3% in Passaic, 15.9% in New Jersey

New Mexico: McKinley County
> COVID-19 deaths in McKinley: 641 per 100,000 people (total: 467)
> COVID-19 deaths in New Mexico: 196 per 100,000 people (total: 4,116)
> COVID-19 cases in McKinley: 16,901 per 100,000 people (total: 12,312)
> COVID-19 cases in New Mexico: 9,601 per 100,000 people (total: 201,186)
> 65 and older population: 11.9% in McKinley, 16.9% in New Mexico

Source: Deberarr / iStock
New York: Bronx County
> COVID-19 deaths in Bronx: 455 per 100,000 people (total: 6537)
> COVID-19 deaths in New York: 270 per 100,000 people (total: 52,708)
> COVID-19 cases in Bronx: 12,623 per 100,000 people (total: 181,500)
> COVID-19 cases in New York: 10,674 per 100,000 people (total: 2,085,932)
> 65 and older population: 12.5% in Bronx, 16.1% in New York

North Carolina: Montgomery County
> COVID-19 deaths in Montgomery: 344 per 100,000 people (total: 94)
> COVID-19 deaths in North Carolina: 124 per 100,000 people (total: 12,891)
> COVID-19 cases in Montgomery: 12,177 per 100,000 people (total: 3,329)
> COVID-19 cases in North Carolina: 9,553 per 100,000 people (total: 991,956)
> 65 and older population: 19.7% in Montgomery, 15.9% in North Carolina

North Dakota: Dickey County
> COVID-19 deaths in Dickey: 664 per 100,000 people (total: 33)
> COVID-19 deaths in North Dakota: 198 per 100,000 people (total: 1,504)
> COVID-19 cases in Dickey: 16,056 per 100,000 people (total: 798)
> COVID-19 cases in North Dakota: 14,372 per 100,000 people (total: 109,235)
> 65 and older population: 20.4% in Dickey, 14.9% in North Dakota

Source: Nyttend / Public Domain / Wikimedia Commons
Ohio: Monroe County
> COVID-19 deaths in Monroe: 298 per 100,000 people (total: 42)
> COVID-19 deaths in Ohio: 167 per 100,000 people (total: 19,528)
> COVID-19 cases in Monroe: 9,404 per 100,000 people (total: 1,325)
> COVID-19 cases in Ohio: 9,339 per 100,000 people (total: 1,091,623)
> 65 and older population: 23.3% in Monroe, 16.7% in Ohio
These are all the counties in Ohio where COVID-19 is slowing (and where it’s still getting worse).

Source: thenationalguard / Flickr
Oklahoma: Greer County
> COVID-19 deaths in Greer: 353 per 100,000 people (total: 21)
> COVID-19 deaths in Oklahoma: 175 per 100,000 people (total: 6,918)
> COVID-19 cases in Greer: 9,844 per 100,000 people (total: 585)
> COVID-19 cases in Oklahoma: 11,447 per 100,000 people (total: 451,349)
> 65 and older population: 17.5% in Greer, 15.3% in Oklahoma

Source: icetsarina / Public Domain / Flickr
Oregon: Malheur County
> COVID-19 deaths in Malheur: 207 per 100,000 people (total: 63)
> COVID-19 deaths in Oregon: 62 per 100,000 people (total: 2,590)
> COVID-19 cases in Malheur: 11,600 per 100,000 people (total: 3,530)
> COVID-19 cases in Oregon: 4,674 per 100,000 people (total: 195,882)
> 65 and older population: 16.4% in Malheur, 17.2% in Oregon
These are all the counties in Oregon where COVID-19 is slowing (and where it’s still getting worse).
Source: Delmas Lehman / iStock via Getty Images
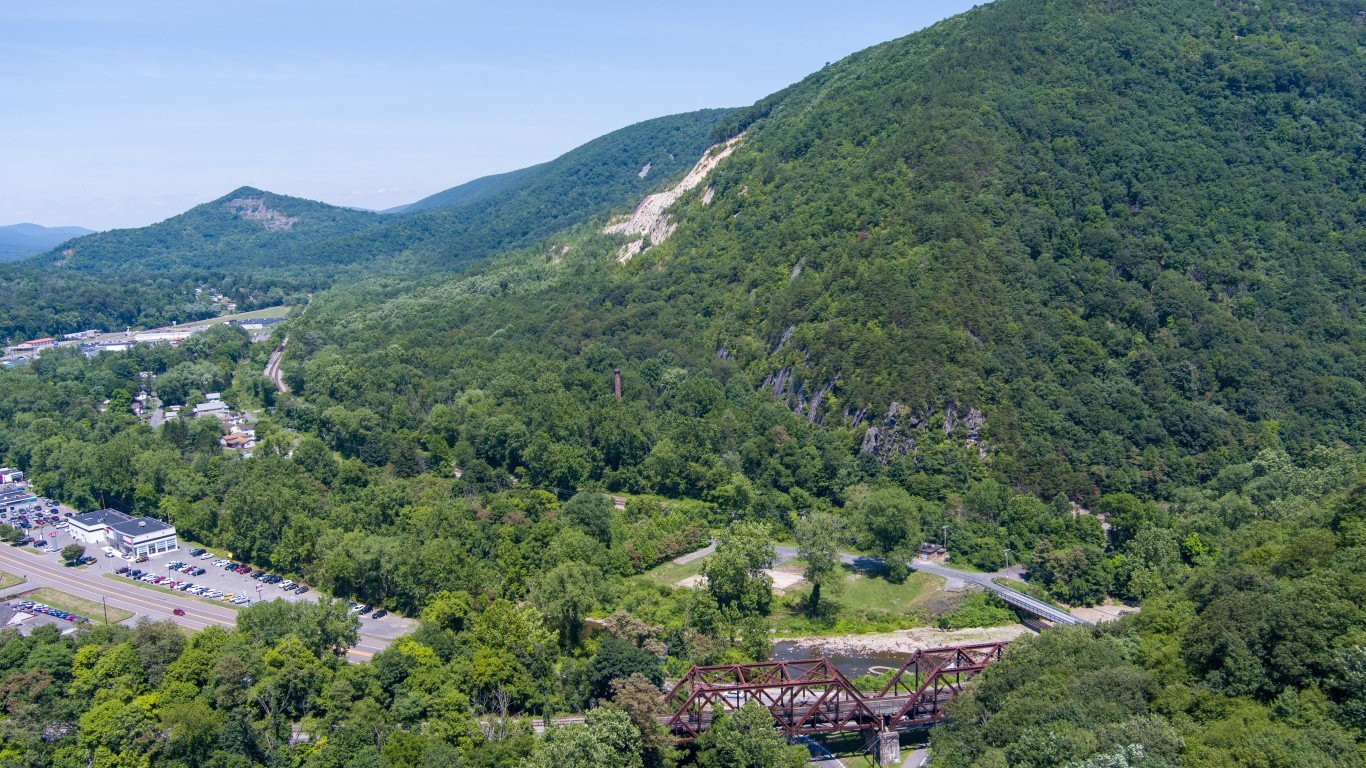
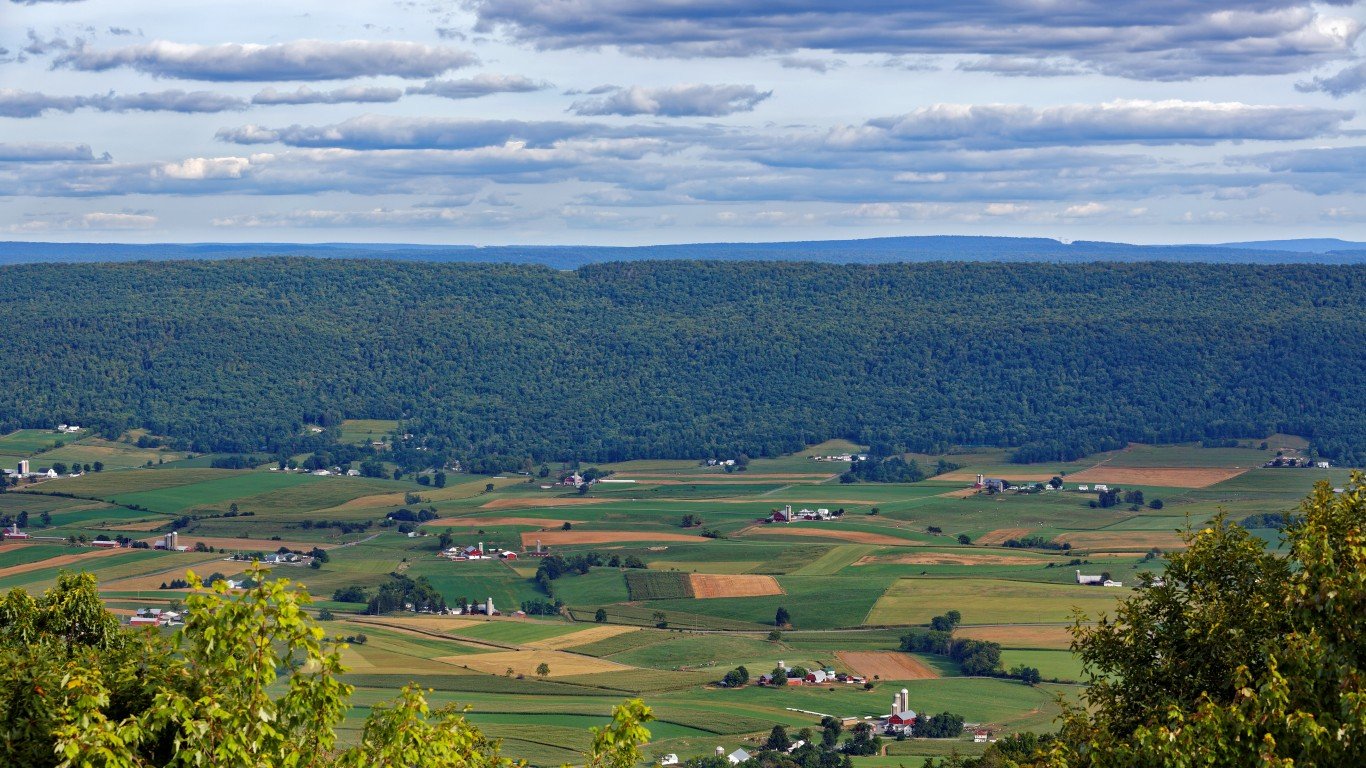
Pennsylvania: Mifflin County
> COVID-19 deaths in Mifflin: 384 per 100,000 people (total: 178)
> COVID-19 deaths in Pennsylvania: 210 per 100,000 people (total: 26,833)
> COVID-19 cases in Mifflin: 11,494 per 100,000 people (total: 5,329)
> COVID-19 cases in Pennsylvania: 9,269 per 100,000 people (total: 1,187,115)
> 65 and older population: 21.1% in Mifflin, 17.8% in Pennsylvania

Source: Sean Pavone / iStock via Getty Images
Rhode Island: Providence County
> COVID-19 deaths in Providence: 311 per 100,000 people (total: 1971)
> COVID-19 deaths in Rhode Island: 255 per 100,000 people (total: 2,701)
> COVID-19 cases in Providence: 15,388 per 100,000 people (total: 97,640)
> COVID-19 cases in Rhode Island: 14,248 per 100,000 people (total: 150,648)
> 65 and older population: 15.0% in Providence, 16.8% in Rhode Island

South Carolina: Fairfield County
> COVID-19 deaths in Fairfield: 361 per 100,000 people (total: 82)
> COVID-19 deaths in South Carolina: 190 per 100,000 people (total: 9,651)
> COVID-19 cases in Fairfield: 10,580 per 100,000 people (total: 2,403)
> COVID-19 cases in South Carolina: 11,554 per 100,000 people (total: 587,398)
> 65 and older population: 20.5% in Fairfield, 17.2% in South Carolina
Source: Ammodramus / Public Domain / Wikimedia Commons
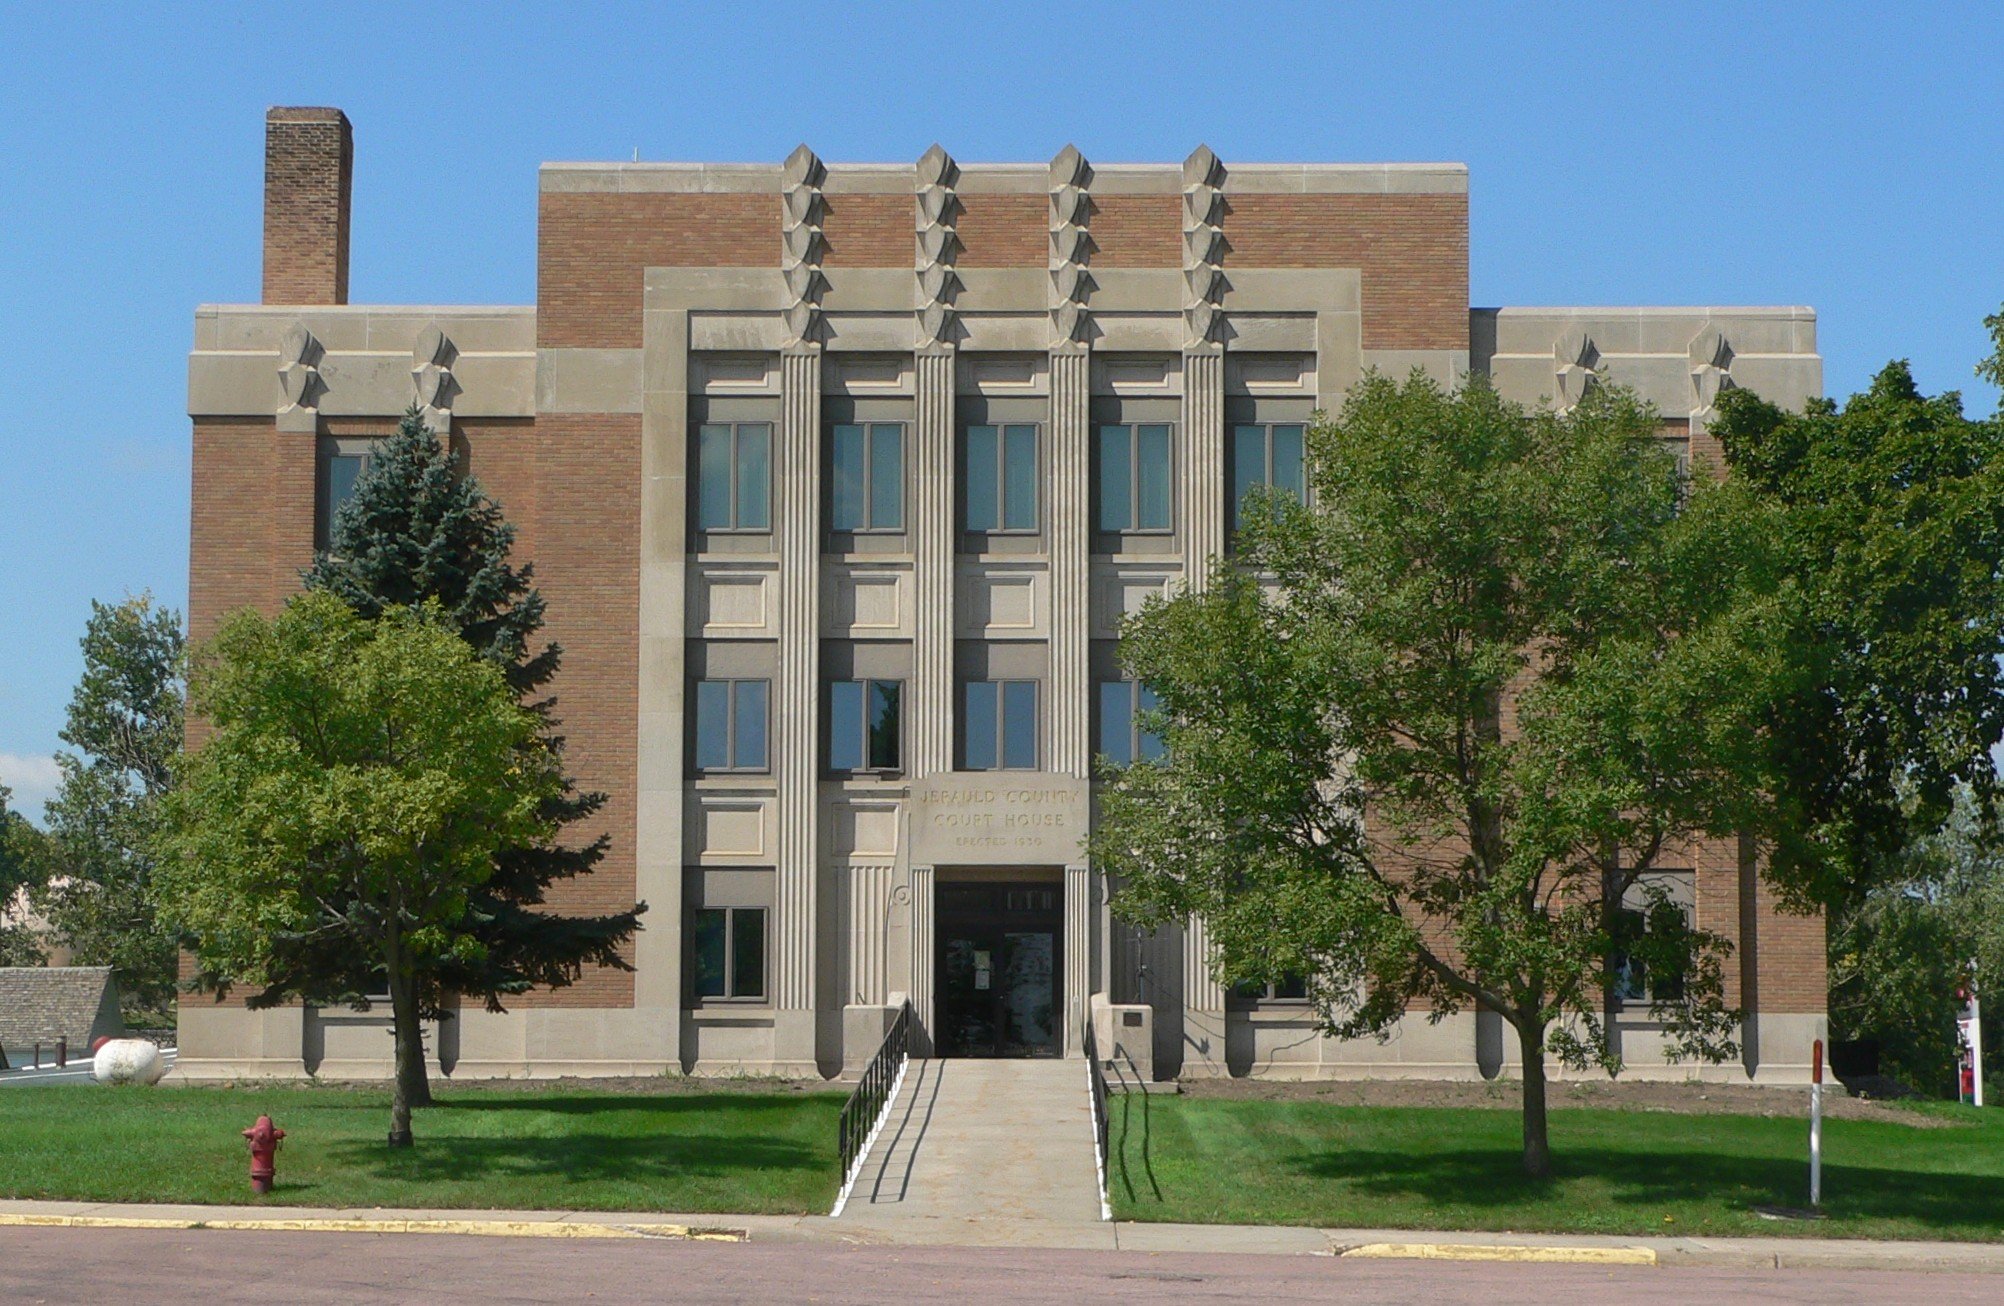
South Dakota: Jerauld County
> COVID-19 deaths in Jerauld: 789 per 100,000 people (total: 16)
> COVID-19 deaths in South Dakota: 226 per 100,000 people (total: 1,993)
> COVID-19 cases in Jerauld: 13,652 per 100,000 people (total: 277)
> COVID-19 cases in South Dakota: 14,020 per 100,000 people (total: 123,686)
> 65 and older population: 29.6% in Jerauld, 16.3% in South Dakota

Source: ehrlif / iStock via Getty Images
Tennessee: Pickett County
> COVID-19 deaths in Pickett: 472 per 100,000 people (total: 24)
> COVID-19 deaths in Tennessee: 182 per 100,000 people (total: 12,327)
> COVID-19 cases in Pickett: 14,917 per 100,000 people (total: 759)
> COVID-19 cases in Tennessee: 12,679 per 100,000 people (total: 858,355)
> 65 and older population: 26.9% in Pickett, 16.0% in Tennessee

Source: Go Nakamura / Getty Images News via Getty Images
Texas: McMullen County
> COVID-19 deaths in McMullen: 755 per 100,000 people (total: 5)
> COVID-19 deaths in Texas: 174 per 100,000 people (total: 49,900)
> COVID-19 cases in McMullen: 12,538 per 100,000 people (total: 83)
> COVID-19 cases in Texas: 10,175 per 100,000 people (total: 2,920,389)
> 65 and older population: 18.3% in McMullen, 12.3% in Texas
These are all the counties in Texas where COVID-19 is slowing (and where it’s still getting worse).

Vermont: Franklin County
> COVID-19 deaths in Franklin: 80 per 100,000 people (total: 39)
> COVID-19 deaths in Vermont: 40 per 100,000 people (total: 252)
> COVID-19 cases in Franklin: 4,102 per 100,000 people (total: 2,011)
> COVID-19 cases in Vermont: 3,818 per 100,000 people (total: 23,912)
> 65 and older population: 15.6% in Franklin, 18.8% in Vermont

Source: Public Domain
Virginia: Galax
> COVID-19 deaths in Galax: 798 per 100,000 people (total: 53)
> COVID-19 deaths in Virginia: 130 per 100,000 people (total: 11,042)
> COVID-19 cases in Galax: 17,550 per 100,000 people (total: 1,165)
> COVID-19 cases in Virginia: 7,876 per 100,000 people (total: 670,834)
> 65 and older population: 22.4% in Galax, 15.0% in Virginia

Source: JeffGoulden / Getty Images
Washington: Garfield County
> COVID-19 deaths in Garfield: 225 per 100,000 people (total: 5)
> COVID-19 deaths in Washington: 75 per 100,000 people (total: 5,640)
> COVID-19 cases in Garfield: 5,531 per 100,000 people (total: 123)
> COVID-19 cases in Washington: 5,618 per 100,000 people (total: 423,382)
> 65 and older population: 24.7% in Garfield, 15.1% in Washington

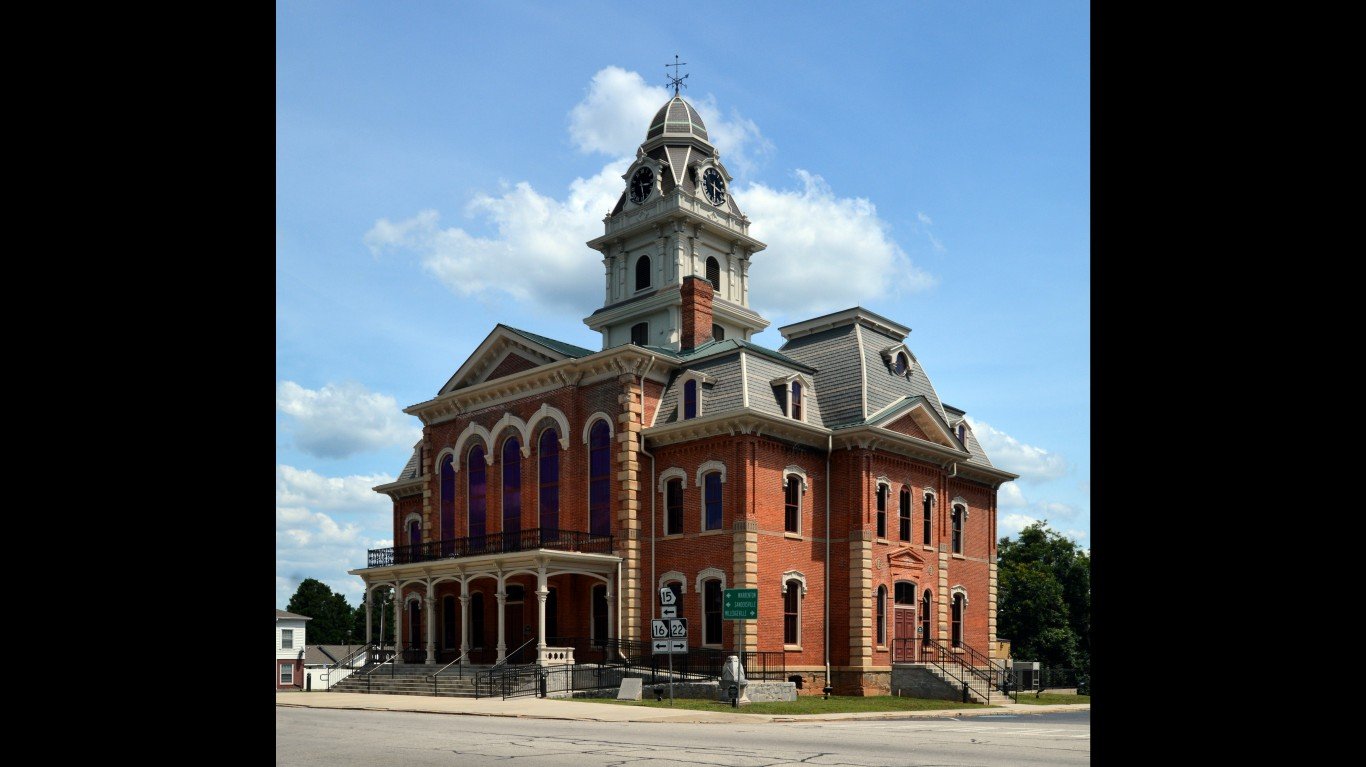
West Virginia: Mineral County
> COVID-19 deaths in Mineral: 326 per 100,000 people (total: 89)
> COVID-19 deaths in West Virginia: 153 per 100,000 people (total: 2,762)
> COVID-19 cases in Mineral: 10,536 per 100,000 people (total: 2,874)
> COVID-19 cases in West Virginia: 8,785 per 100,000 people (total: 158,643)
> 65 and older population: 21.3% in Mineral, 19.4% in West Virginia

Wisconsin: Iron County
> COVID-19 deaths in Iron: 700 per 100,000 people (total: 40)
> COVID-19 deaths in Wisconsin: 133 per 100,000 people (total: 7,712)
> COVID-19 cases in Iron: 12,196 per 100,000 people (total: 697)
> COVID-19 cases in Wisconsin: 11,521 per 100,000 people (total: 669,804)
> 65 and older population: 30.1% in Iron, 16.5% in Wisconsin

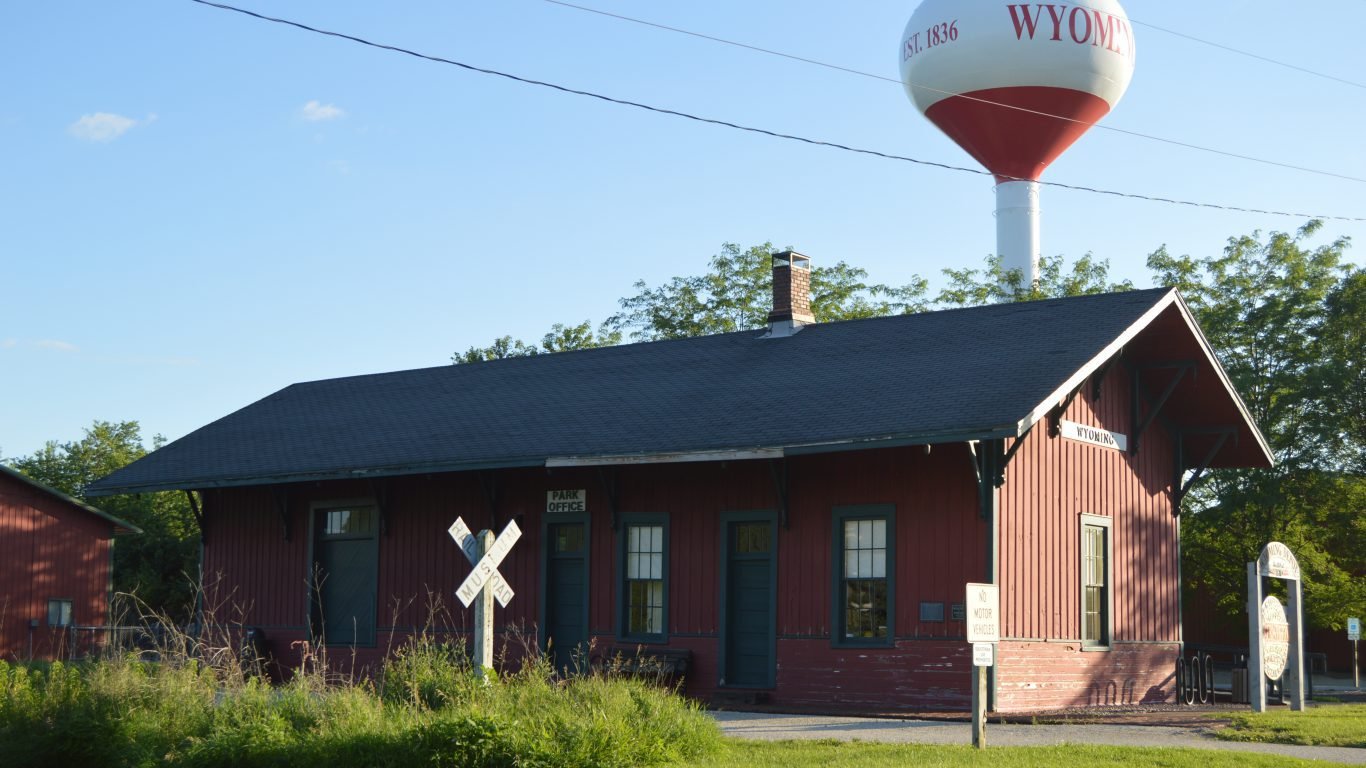
Wyoming: Washakie County
> COVID-19 deaths in Washakie: 320 per 100,000 people (total: 26)
> COVID-19 deaths in Wyoming: 123 per 100,000 people (total: 712)
> COVID-19 cases in Washakie: 11,293 per 100,000 people (total: 918)
> COVID-19 cases in Wyoming: 10,251 per 100,000 people (total: 59,222)
> 65 and older population: 21.1% in Washakie, 15.7% in Wyoming

Source: AlexMcGuffie / Getty Images
Utah: San Juan County
> COVID-19 deaths in San Juan: 242 per 100,000 people (total: 37)
> COVID-19 deaths in Utah: 71 per 100,000 people (total: 2,259)
> COVID-19 cases in San Juan: 12,460 per 100,000 people (total: 1,904)
> COVID-19 cases in Utah: 12,740 per 100,000 people (total: 402,731)
> 65 and older population: 13.7% in San Juan, 10.8% in Utah
These are all the counties in Utah where COVID-19 is slowing (and where it’s still getting worse).
Click here to see all coronavirus data for every state.
Sponsored: Find a Qualified Financial Advisor
Finding a qualified financial advisor doesn’t have to be hard. SmartAsset’s free tool matches you with up to 3 fiduciary financial advisors in your area in 5 minutes. Each advisor has been vetted by SmartAsset and is held to a fiduciary standard to act in your best interests. If you’re ready to be matched with local advisors that can help you achieve your financial goals, get started now.
Thank you for reading! Have some feedback for us?
Contact the 24/7 Wall St. editorial team.
Editors' Picks


