
It’s happened many times. A high-profile killing by law enforcement officials of an unarmed suspect, disproportionately likely to be African-American, leads to public outcry. Then the news cycle moves on, and little seems to have changed.
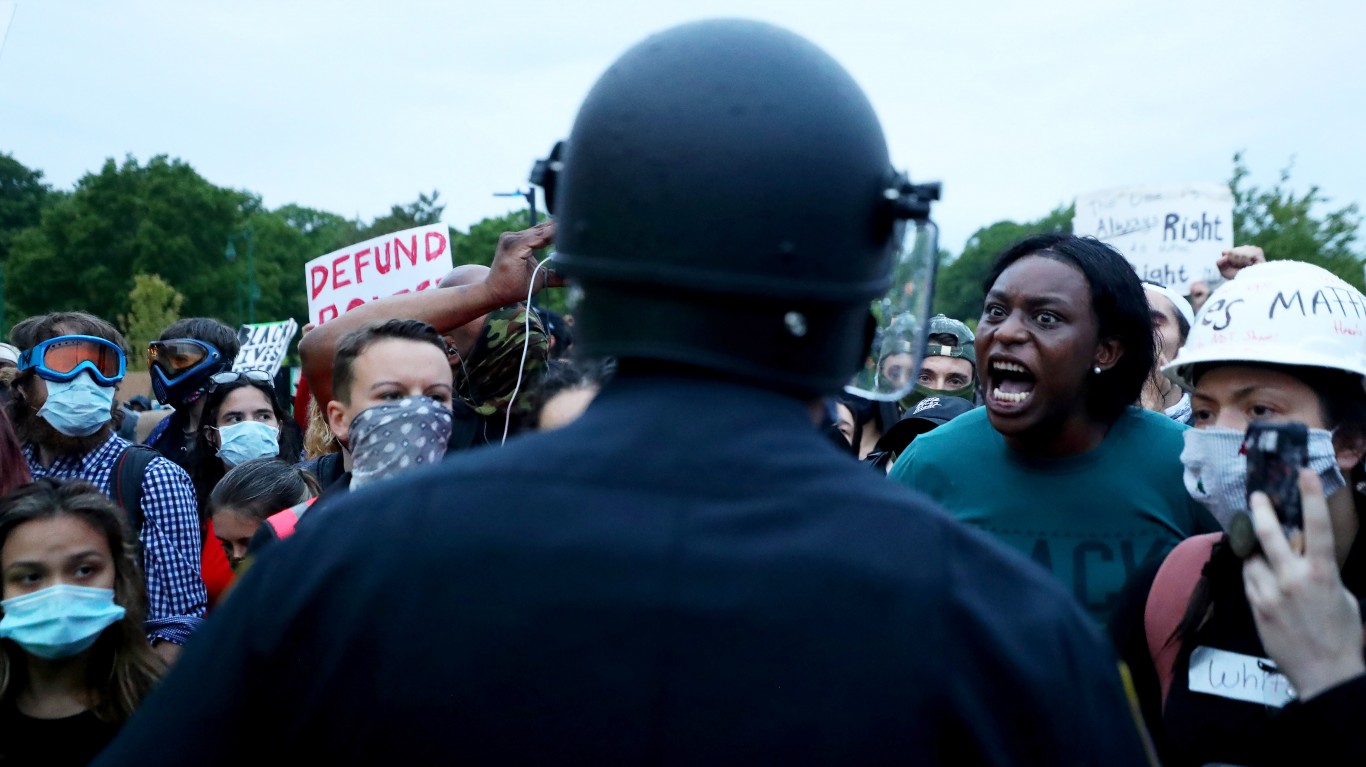
We saw this after Minneapolis police officer Derek Chauvin killed an unarmed Black suspect, George Floyd, on May 25, 2020. The intensity and sheer number of Black Lives Matter and related protests around the country led then-presidential-candidate Joe Biden to declare Floyd’s death “one of those great inflection points in American history.”
Unfortunately, the pace at which police have killed suspects has remained unchecked since then. At least 429 people in the U.S. had been killed by police officers this year as of the end of May — 28% of them African-American, despite the fact that Blacks make up only 13.4% of the total population. (These are the worst cities for Black Americans.)
Within 24 hours of the April 24 guilty verdicts against Chauvin — for second-degree unintentional murder, third-degree murder, and second-degree manslaughter — police officers fatally gunned down six more suspects, including a 16-year-old girl in Cincinnati and two men in separate incidents in San Antonio. (Here are the cities where police shoot the most people.)
Click here to see the states where the police kill the most people per capita.
The number of police killings, both in absolute terms and on a per capita basis, varies widely from one state to the next. Massachusetts, for example, has one of the lowest rates of officer-involved fatalities in the nation, while Oklahoma has one of the highest. Interestingly, considering the bad press it gets in this regard, Minnesota ranks in 39th place for most per capita police killings.
To determine the states with the most killings by police departments, 24/7 Wall St. reviewed data from Mapping Police Violence, a research collaborative that collects data on police killings across the nation from the country’s three largest comprehensive and impartial crowdsourced databases. Data was accessed on May, 26, 2021 and includes all police department killings between the beginning of 2013 and May 23 of this year. Police killings per 100,000 were calculated using 2019 population estimates from the U.S. Census Bureau’s American Community Survey.

Source: _schmal / Flickr
50. Rhode Island
> Police killings per 100,000 people since 2013: 0.66 (total: 7)
> Worst year police killings: 2016
> Worst city for police killings Providence (total: 3)
[in-text-ad]
Source: Maddie Meyer / Getty Images News via Getty Images
49. Massachusetts
> Police killings per 100,000 people since 2013: 0.94 (total: 65)
> Worst year police killings: 2013
> Worst city for police killings Boston (total: 10)

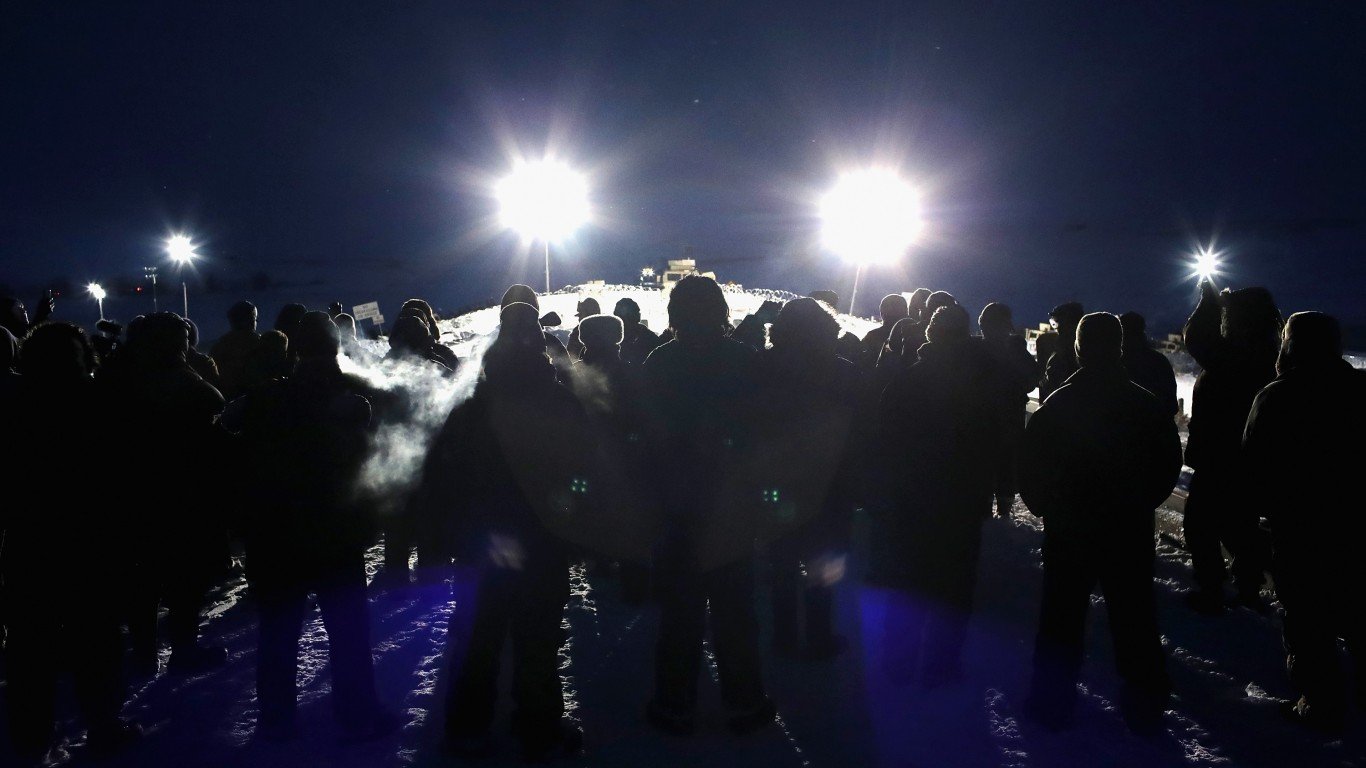
Source: Stephanie Keith / Getty Images News via Getty Images
48. New York
> Police killings per 100,000 people since 2013: 0.96 (total: 186)
> Worst year police killings: 2019
> Worst city for police killings New York (total: 31)
Source: John Moore / Getty Images News via Getty Images
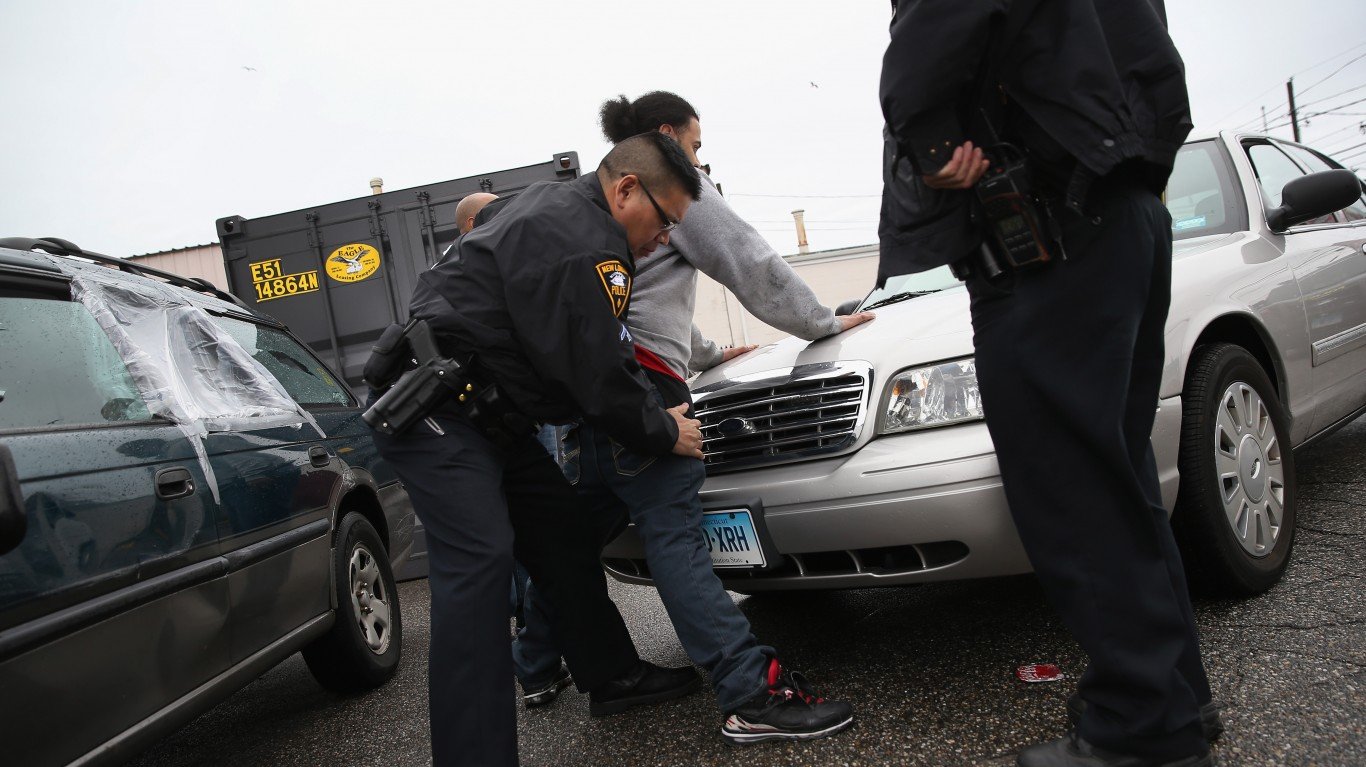
47. Connecticut
> Police killings per 100,000 people since 2013: 1.21 (total: 43)
> Worst year police killings: 2013
> Worst city for police killings Hartford (total: 5)
[in-text-ad-2]
Source: William Thomas Cain / Getty Images News via Getty Images
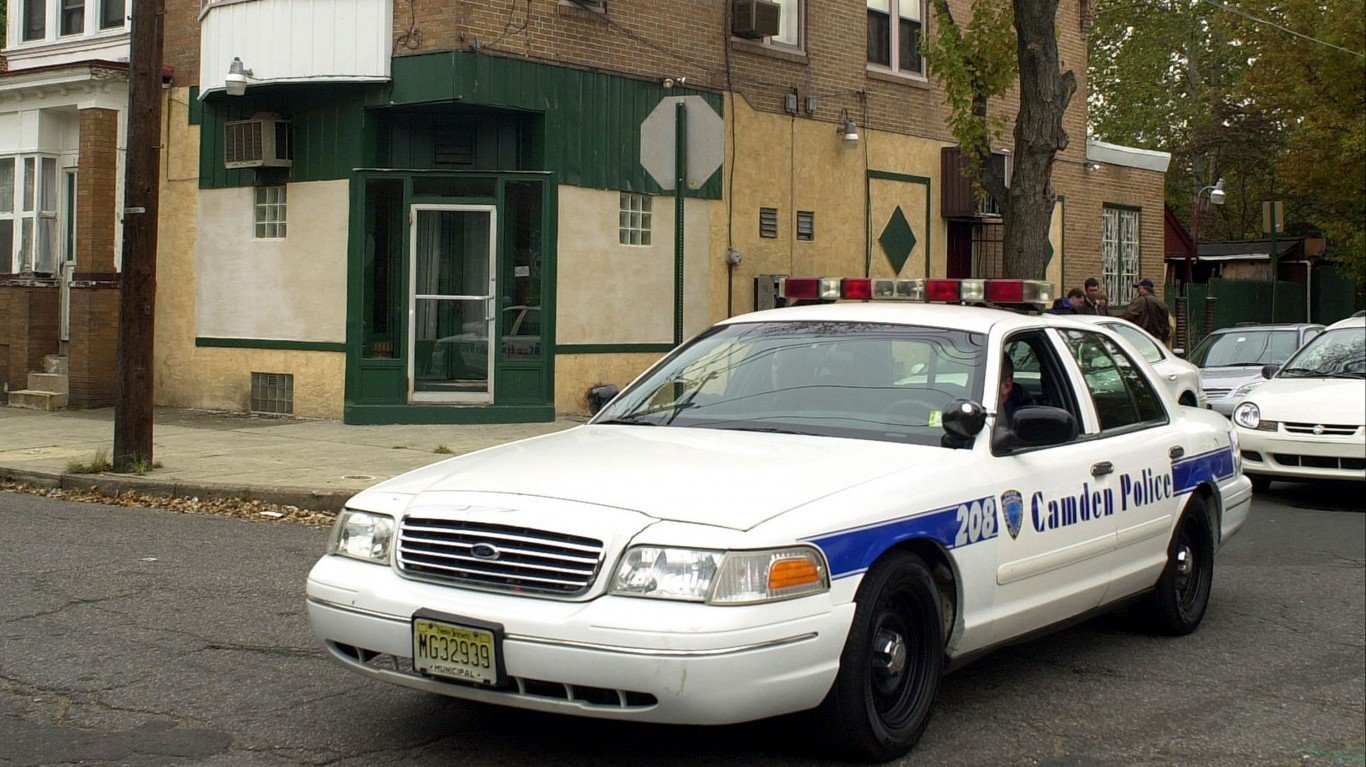
46. New Jersey
> Police killings per 100,000 people since 2013: 1.29 (total: 115)
> Worst year police killings: 2015
> Worst city for police killings Newark (total: 14)

Source: John Moore / Getty Images News via Getty Images
45. Michigan
> Police killings per 100,000 people since 2013: 1.47 (total: 147)
> Worst year police killings: 2018
> Worst city for police killings Detroit (total: 28)
[in-text-ad]
Source: Ross Mantle / Getty Images News via Getty Images
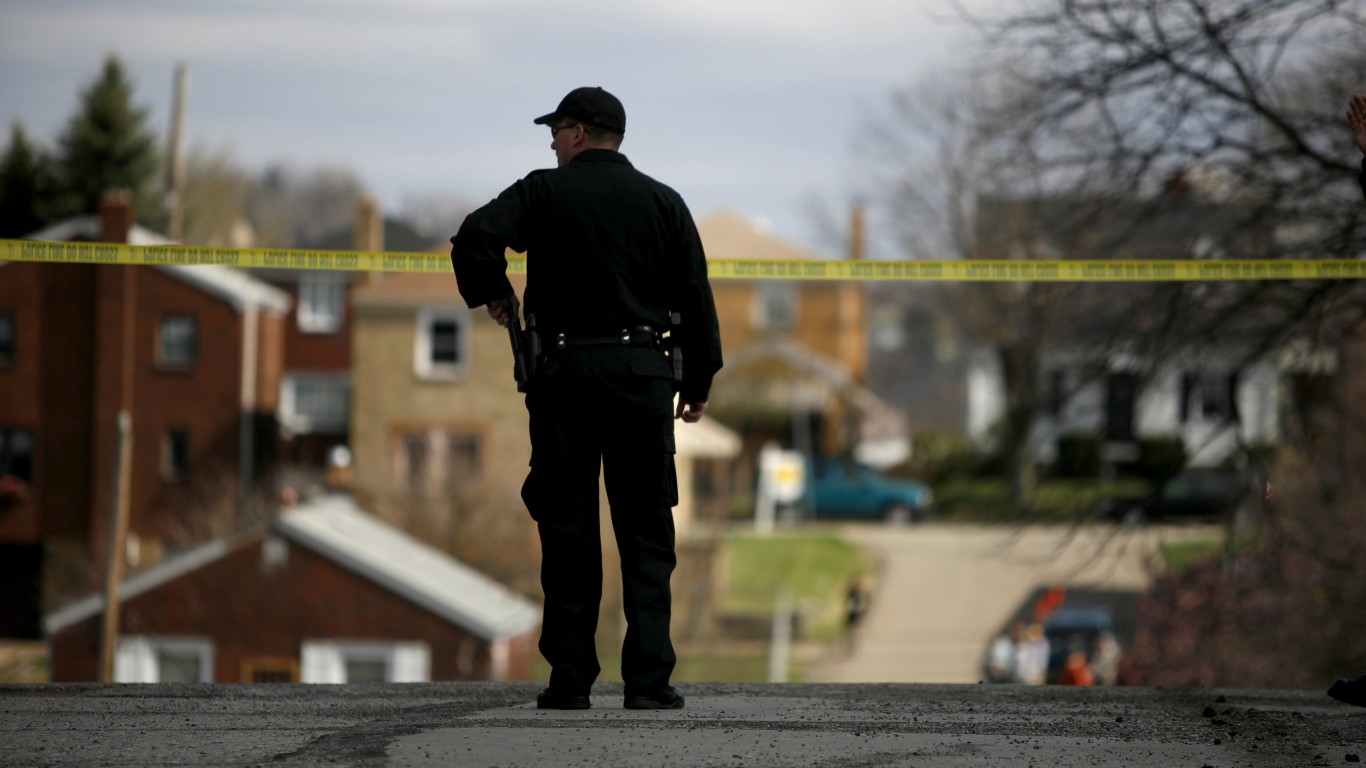
44. Pennsylvania
> Police killings per 100,000 people since 2013: 1.56 (total: 200)
> Worst year police killings: 2013
> Worst city for police killings Philadelphia (total: 42)
 24/7 Wall St.
Source: carlballou / iStock via Getty Images
43. New Hampshire
> Police killings per 100,000 people since 2013: 1.62 (total: 22)
> Worst year police killings: 2015
> Worst city for police killings Manchester (total: 3)
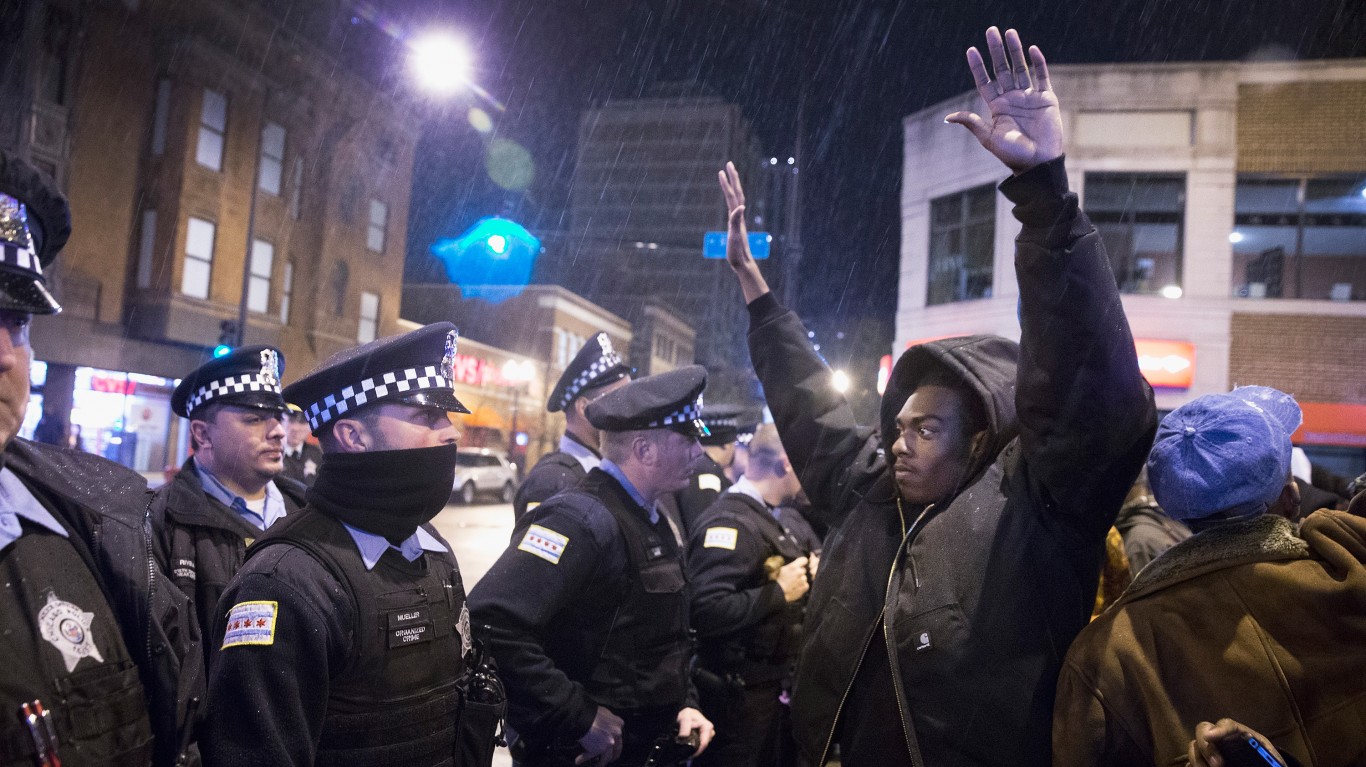
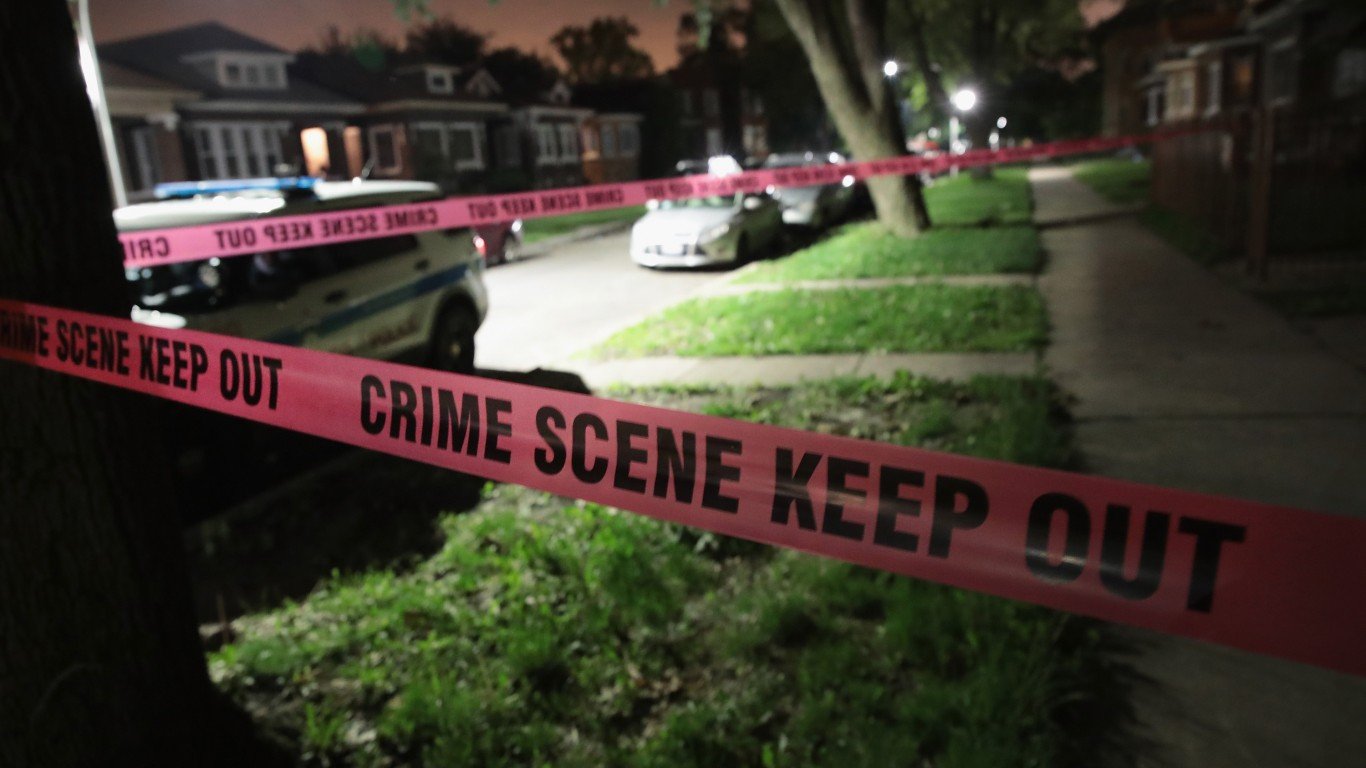
Source: Scott Olson / Getty Images News via Getty Images
42. Illinois
> Police killings per 100,000 people since 2013: 1.65 (total: 209)
> Worst year police killings: 2014
> Worst city for police killings Chicago (total: 88)
[in-text-ad-2]

Source: Steve Pope / Getty Images News via Getty Images
41. Iowa
> Police killings per 100,000 people since 2013: 1.68 (total: 53)
> Worst year police killings: 2018
> Worst city for police killings Des Moines (total: 7)
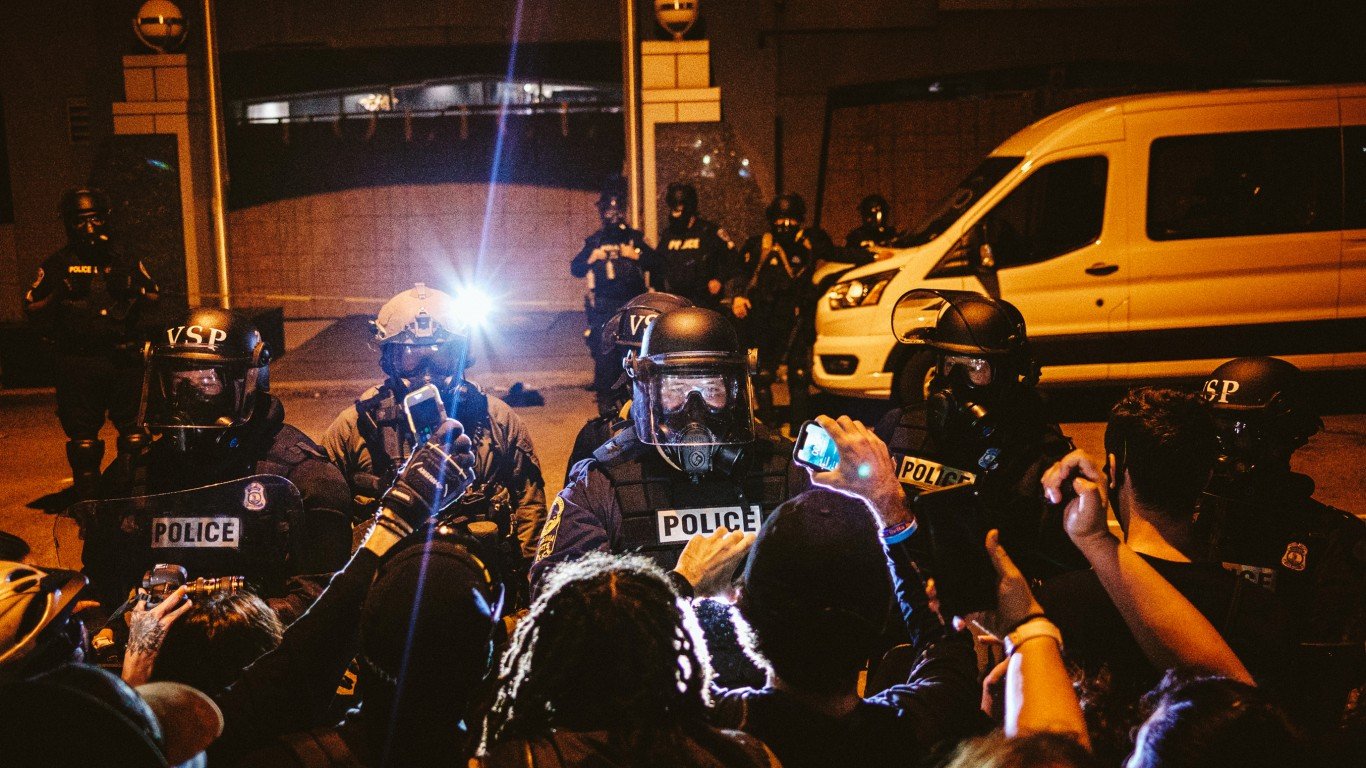
Source: Eze Amos / Getty Images News via Getty Images
40. Virginia
> Police killings per 100,000 people since 2013: 1.75 (total: 149)
> Worst year police killings: 2017
> Worst city for police killings Virginia Beach (total: 11)
[in-text-ad]
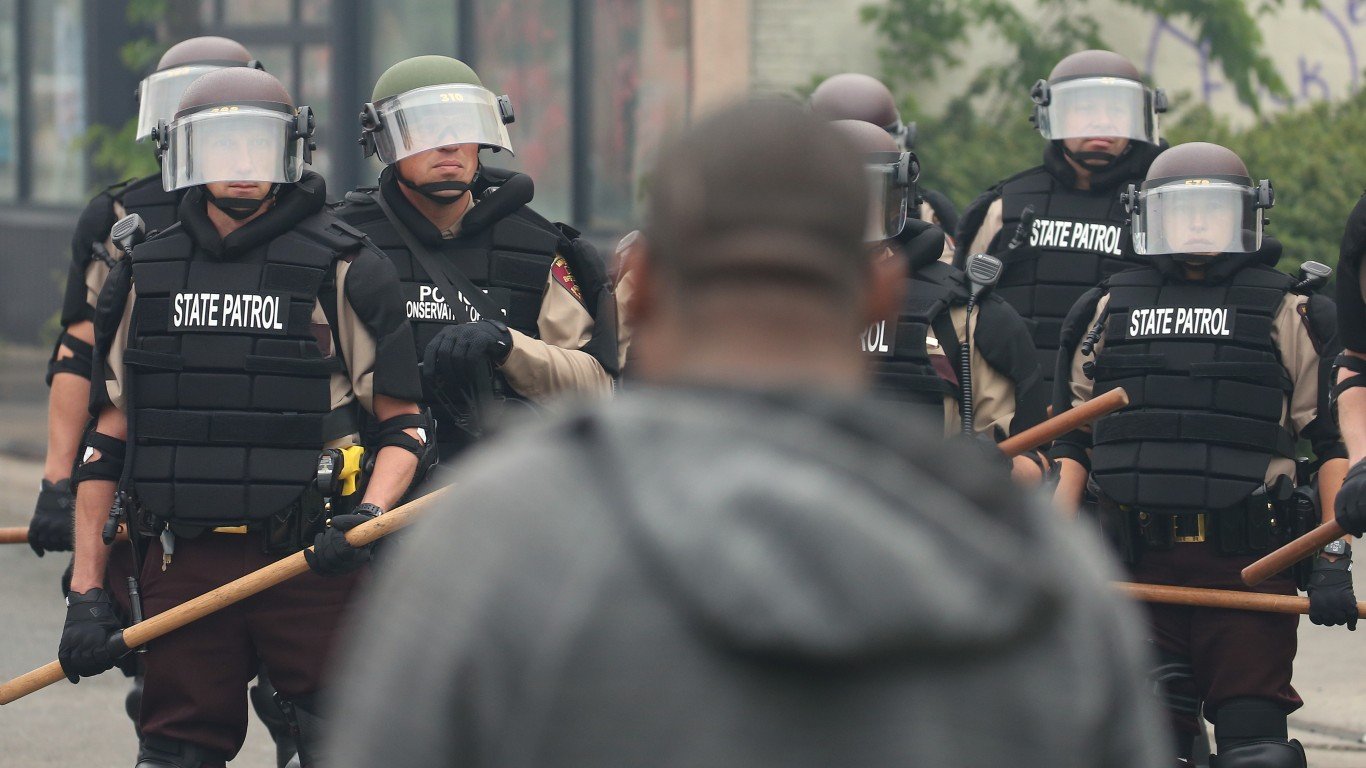
Source: Scott Olson / Getty Images News via Getty Images
39. Minnesota
> Police killings per 100,000 people since 2013: 1.79 (total: 101)
> Worst year police killings: 2015
> Worst city for police killings St. Paul (total: 12)
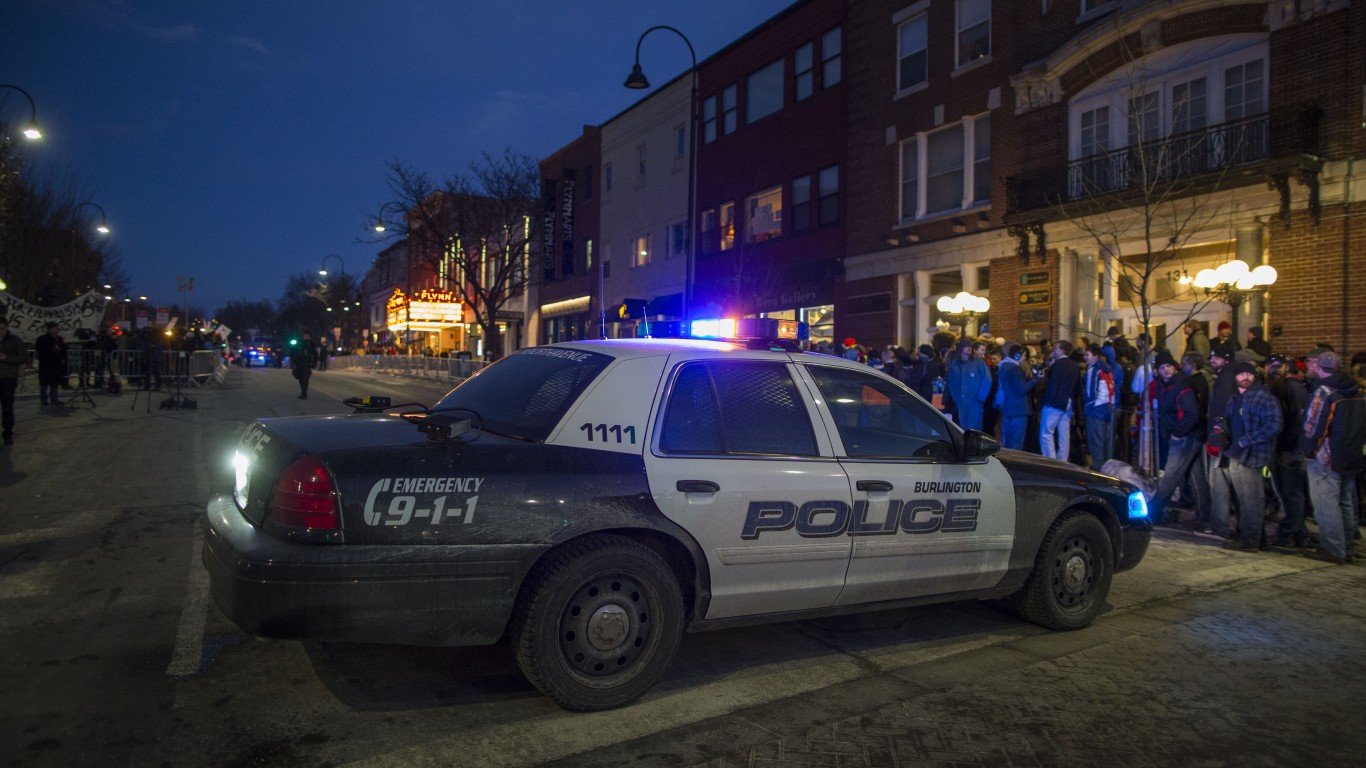
Source: Scott Eisen / Getty Images News via Getty Images
38. Vermont
> Police killings per 100,000 people since 2013: 2.08 (total: 13)
> Worst year police killings: 2019
> Worst city for police killings Burlington (total: 4)
Source: Scott Olson / Getty Images News via Getty Images
37. North Dakota
> Police killings per 100,000 people since 2013: 2.10 (total: 16)
> Worst year police killings: 2018
> Worst city for police killings Fort Totten (total: 2)
[in-text-ad-2]
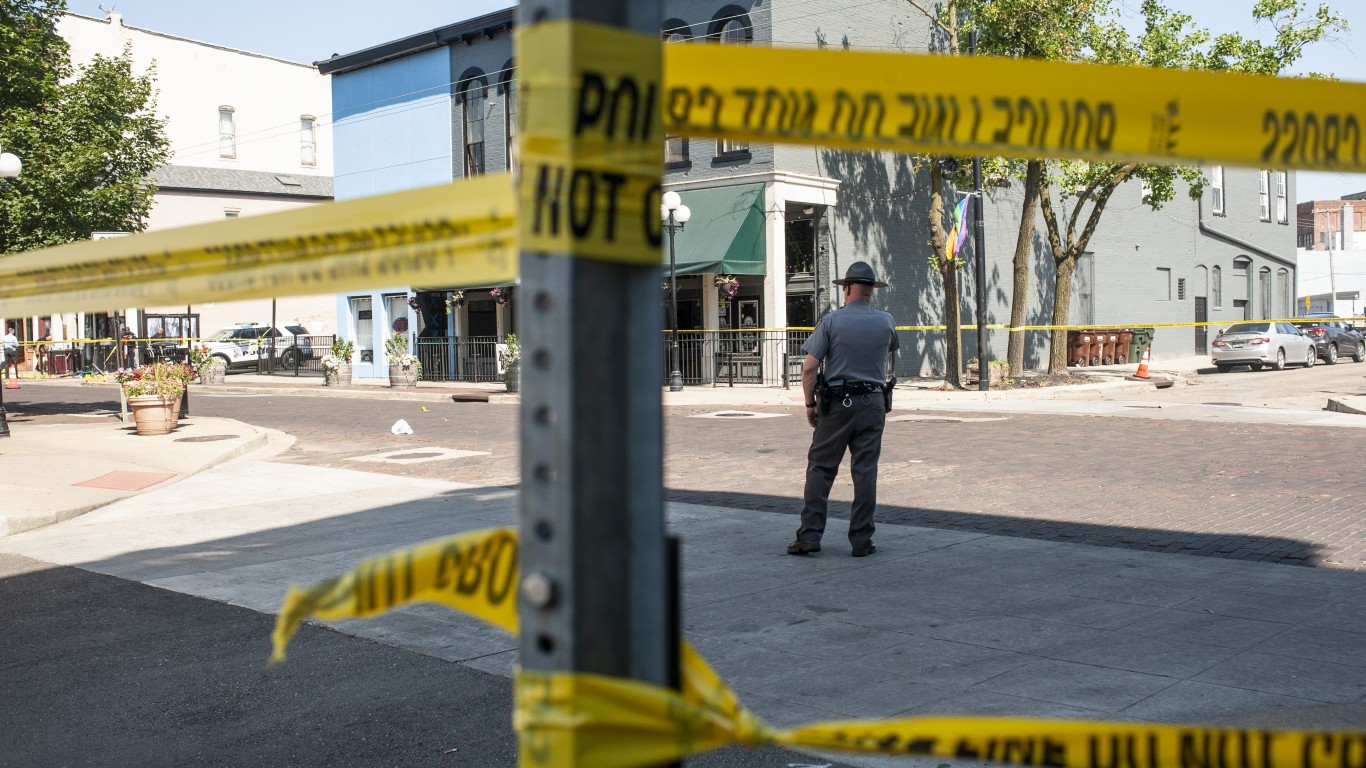
Source: Matthew Hatcher / Getty Images News via Getty Images
36. Ohio
> Police killings per 100,000 people since 2013: 2.15 (total: 251)
> Worst year police killings: 2018
> Worst city for police killings Columbus (total: 46)
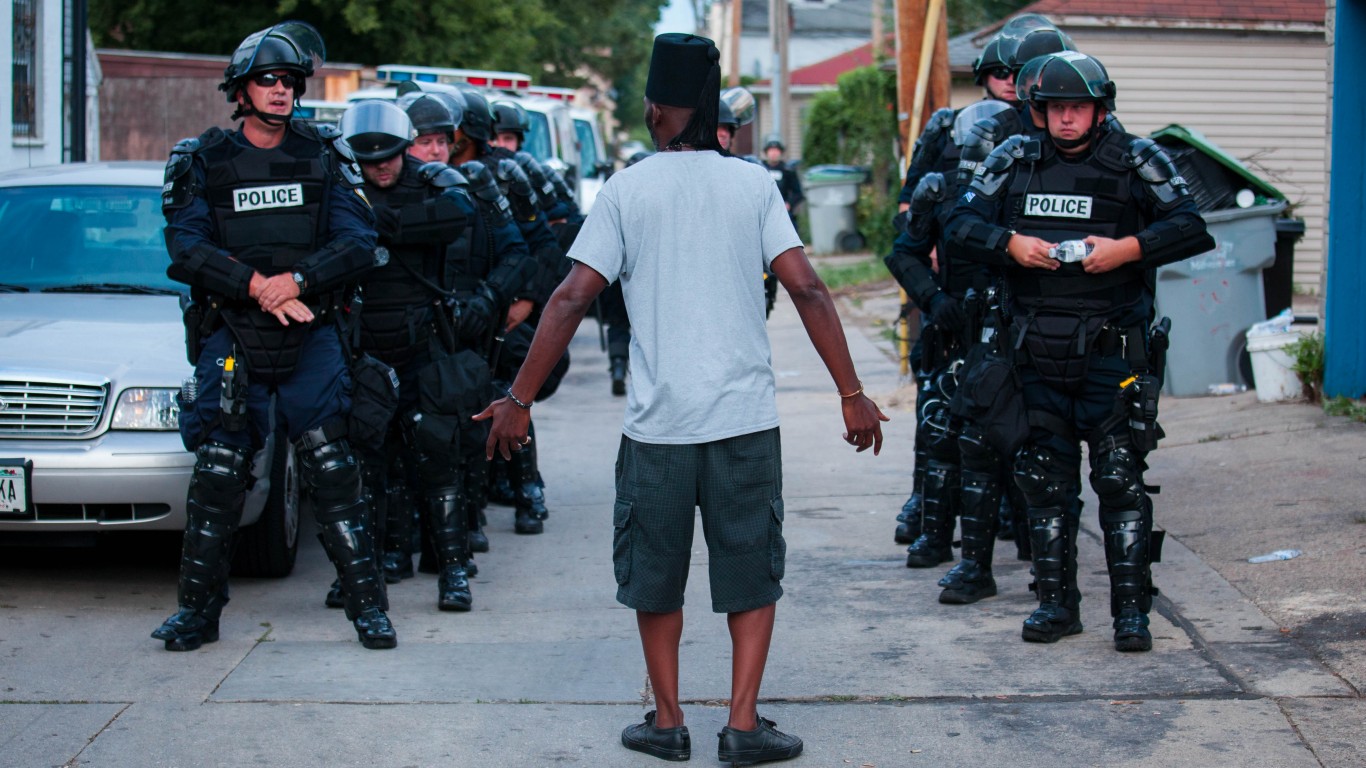
Source: Darren Hauck / Getty Images News via Getty Images
35. Wisconsin
> Police killings per 100,000 people since 2013: 2.27 (total: 132)
> Worst year police killings: 2017
> Worst city for police killings Milwaukee (total: 22)
[in-text-ad]
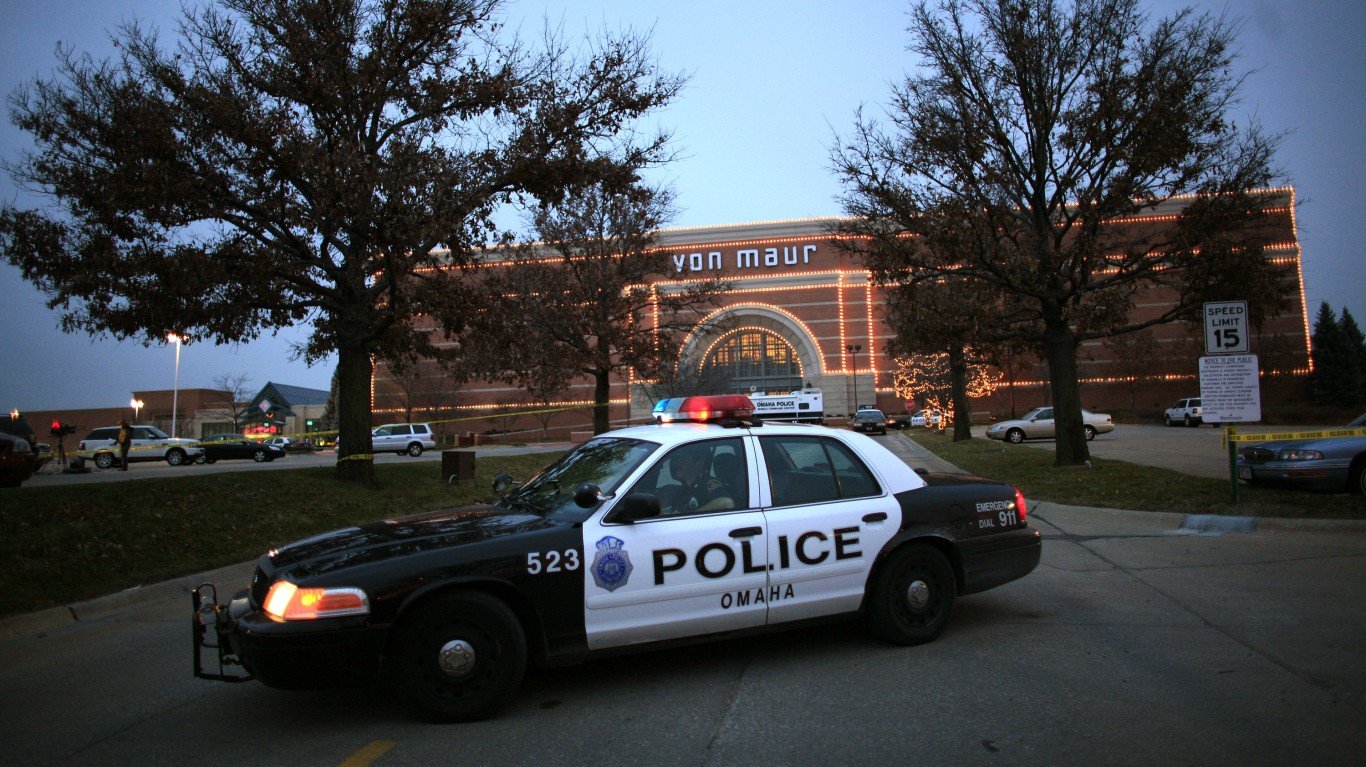
Source: Eric Thayer / Getty Images News via Getty Images
34. Nebraska
> Police killings per 100,000 people since 2013: 2.27 (total: 44)
> Worst year police killings: 2015
> Worst city for police killings Omaha (total: 18)
 24/7 Wall St.
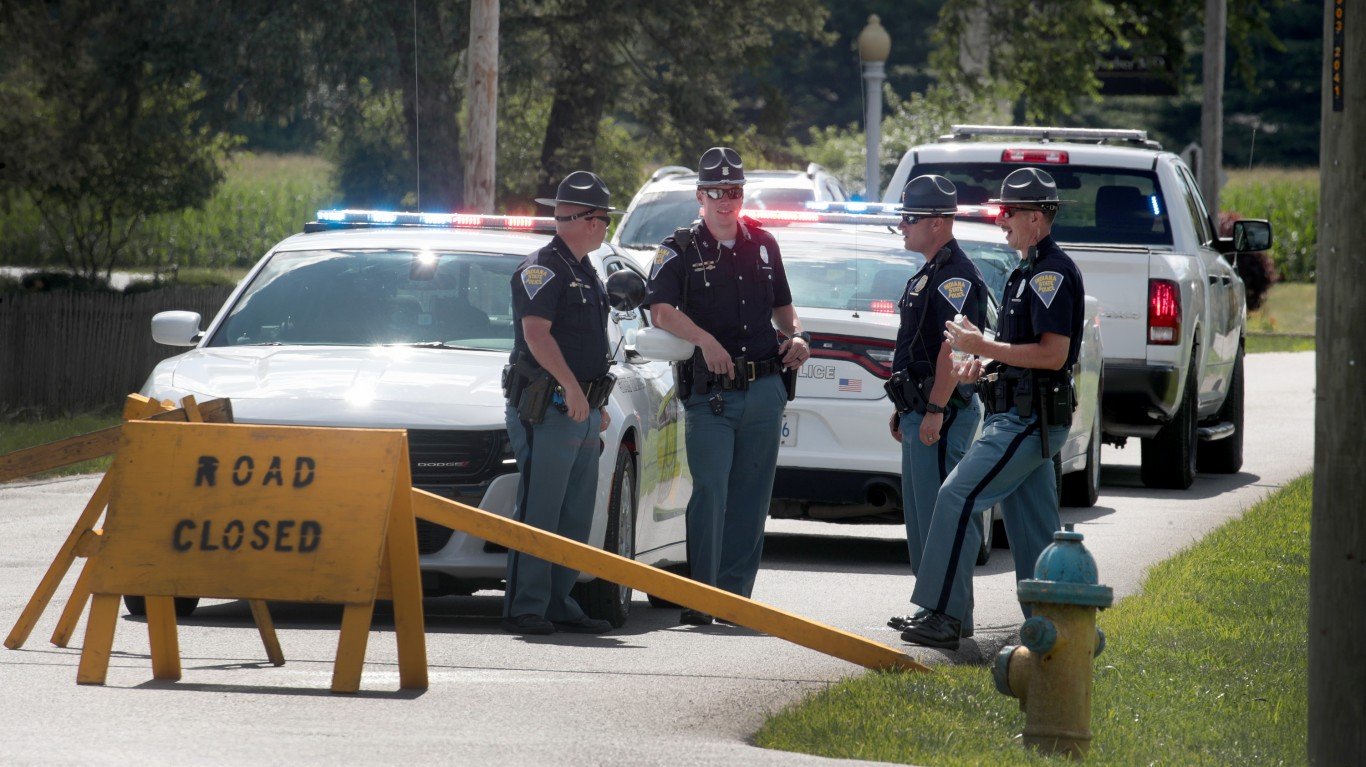
Source: Scott Olson / Getty Images News via Getty Images
33. Indiana
> Police killings per 100,000 people since 2013: 2.36 (total: 159)
> Worst year police killings: 2020
> Worst city for police killings Indianapolis (total: 32)
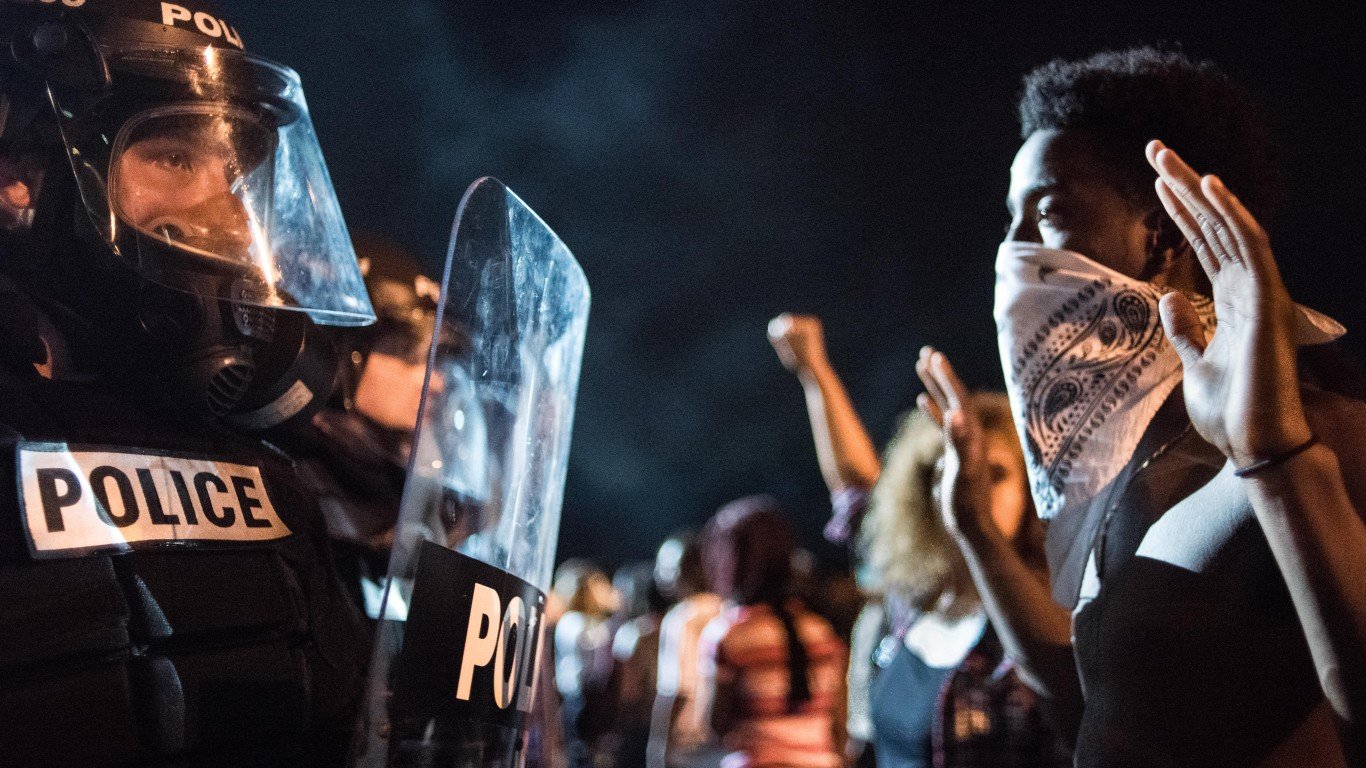
Source: Sean Rayford / Getty Images News via Getty Images
32. North Carolina
> Police killings per 100,000 people since 2013: 2.37 (total: 249)
> Worst year police killings: 2016
> Worst city for police killings Charlotte (total: 25)
[in-text-ad-2]
Source: Jeff Swensen / Getty Images News via Getty Images
31. Delaware
> Police killings per 100,000 people since 2013: 2.46 (total: 24)
> Worst year police killings: 2017
> Worst city for police killings Wilmington (total: 7)
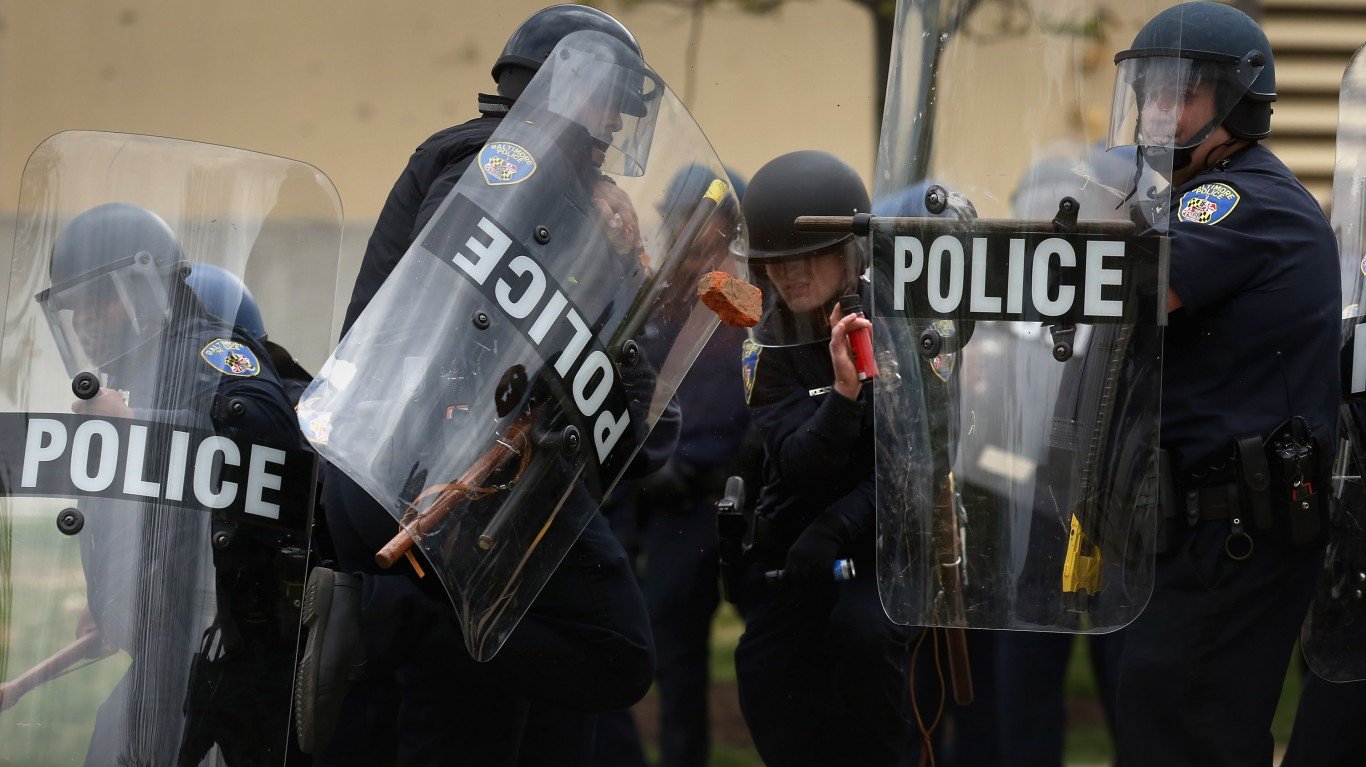
Source: Chip Somodevilla / Getty Images News via Getty Images
30. Maryland
> Police killings per 100,000 people since 2013: 2.55 (total: 154)
> Worst year police killings: 2013
> Worst city for police killings Baltimore (total: 39)
[in-text-ad]

Source: Sean Rayford / Getty Images News via Getty Images
29. South Carolina
> Police killings per 100,000 people since 2013: 2.68 (total: 138)
> Worst year police killings: 2015
> Worst city for police killings Greenville (total: 8)
 24/7 Wall St.
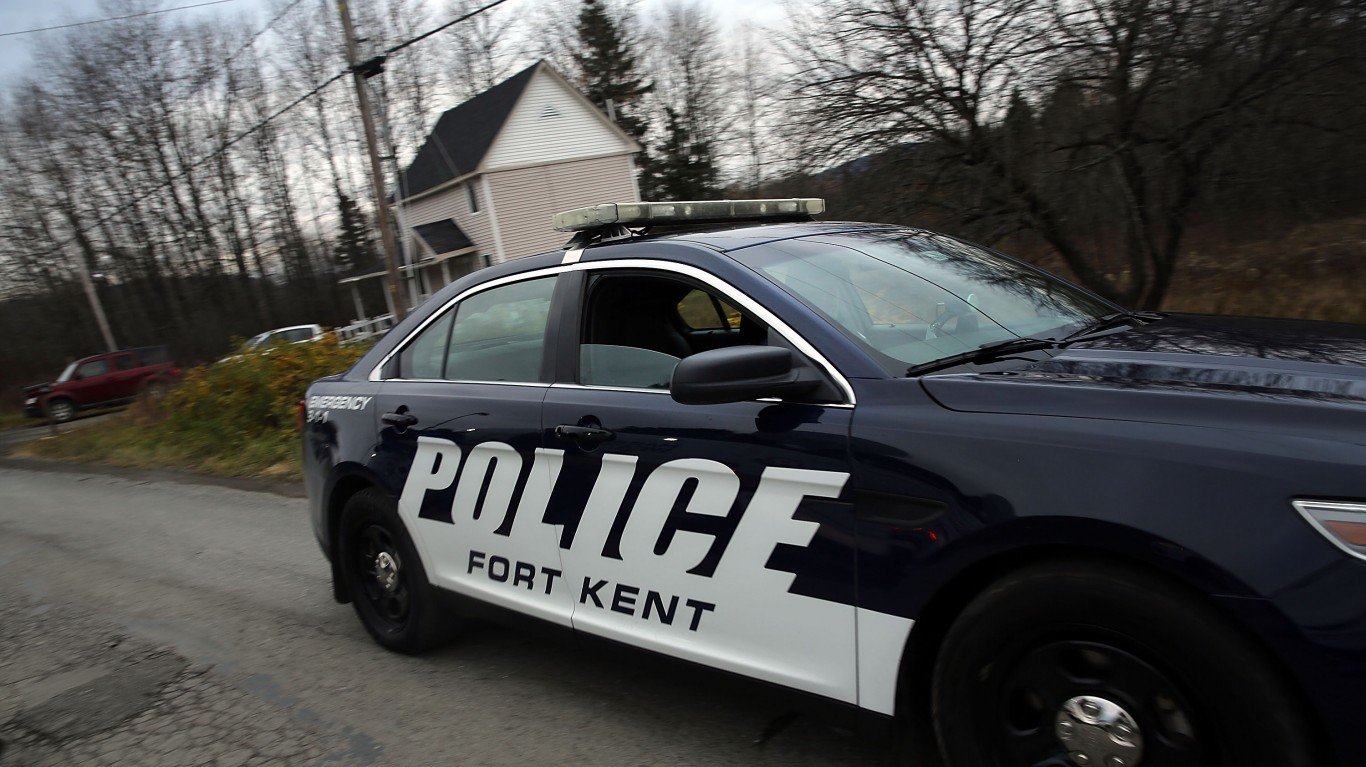
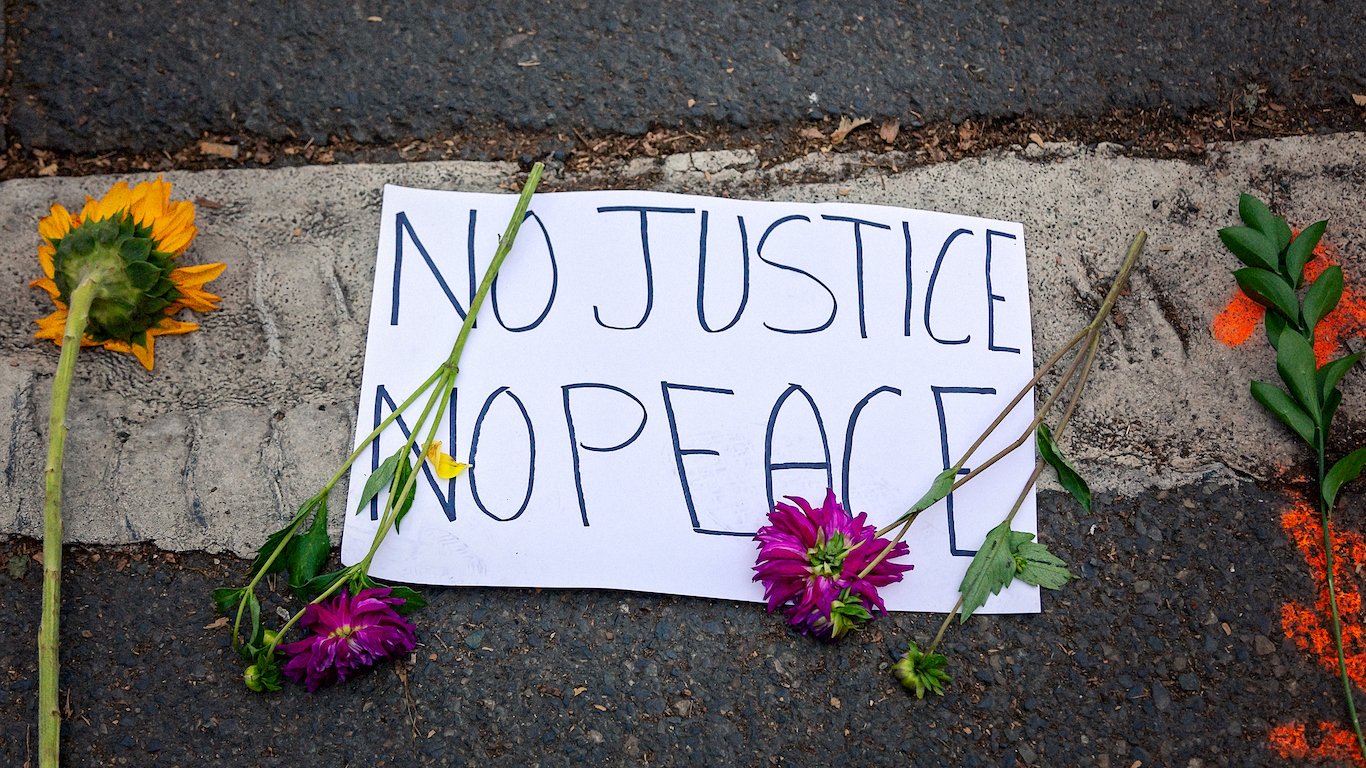
Source: Spencer Platt / Getty Images News via Getty Images
28. Maine
> Police killings per 100,000 people since 2013: 2.75 (total: 37)
> Worst year police killings: 2017
> Worst city for police killings Old Town (total: 3)
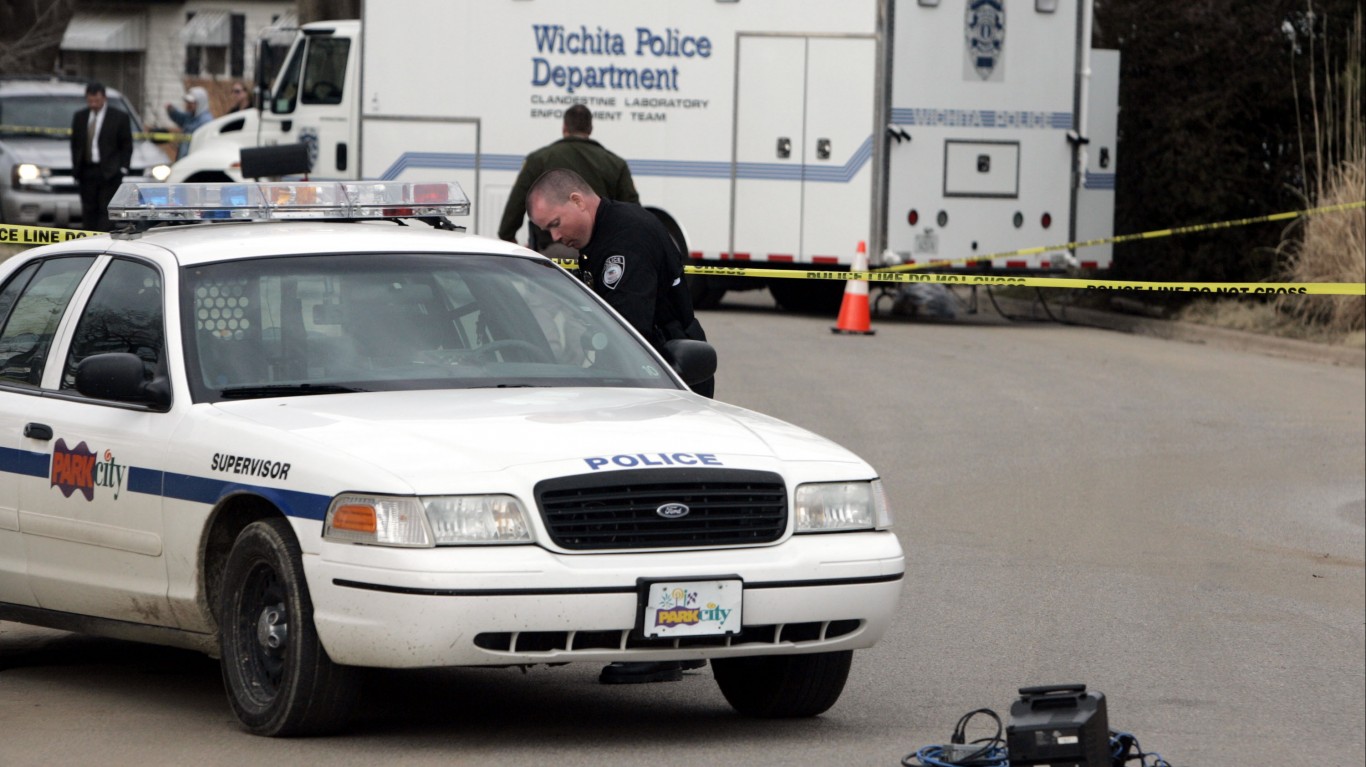
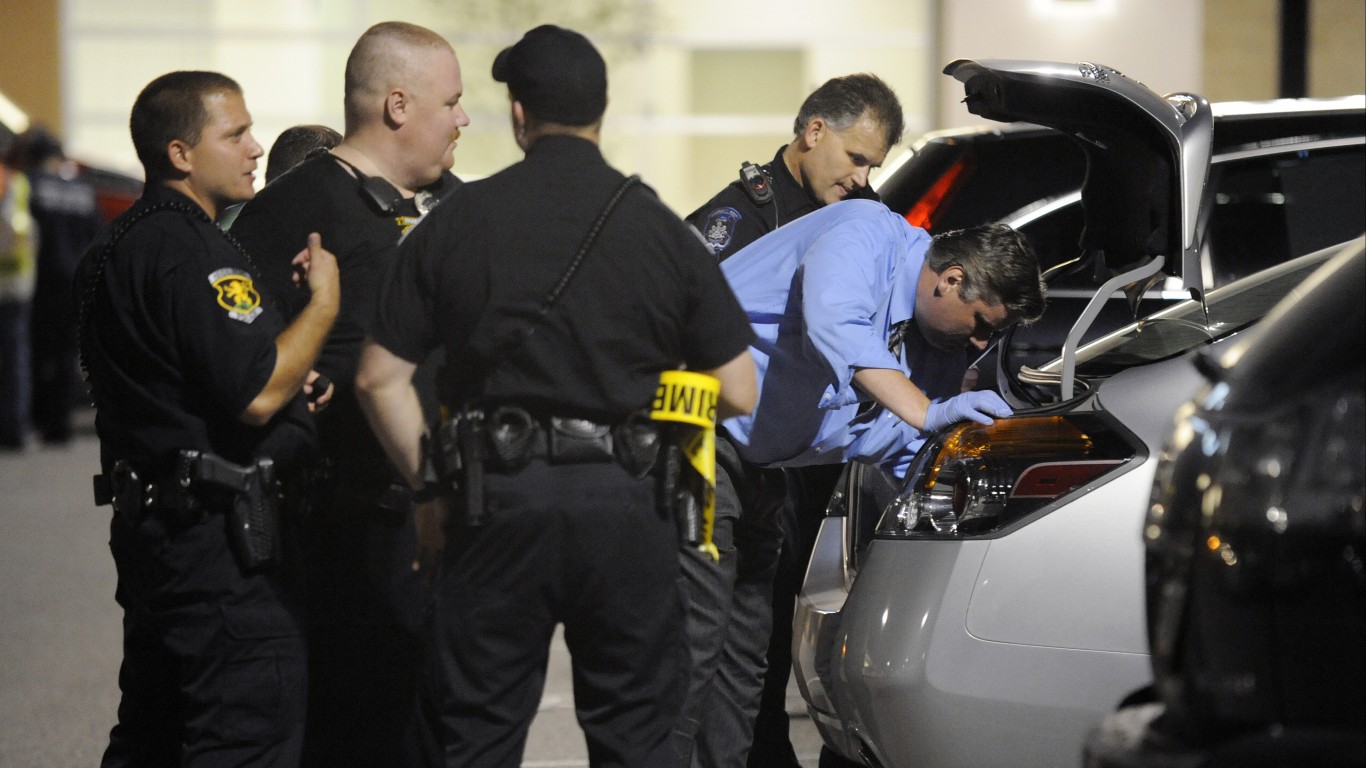
Source: Larry W. Smith / Getty Images News via Getty Images
27. Kansas
> Police killings per 100,000 people since 2013: 2.85 (total: 83)
> Worst year police killings: 2014
> Worst city for police killings Wichita (total: 18)
[in-text-ad-2]
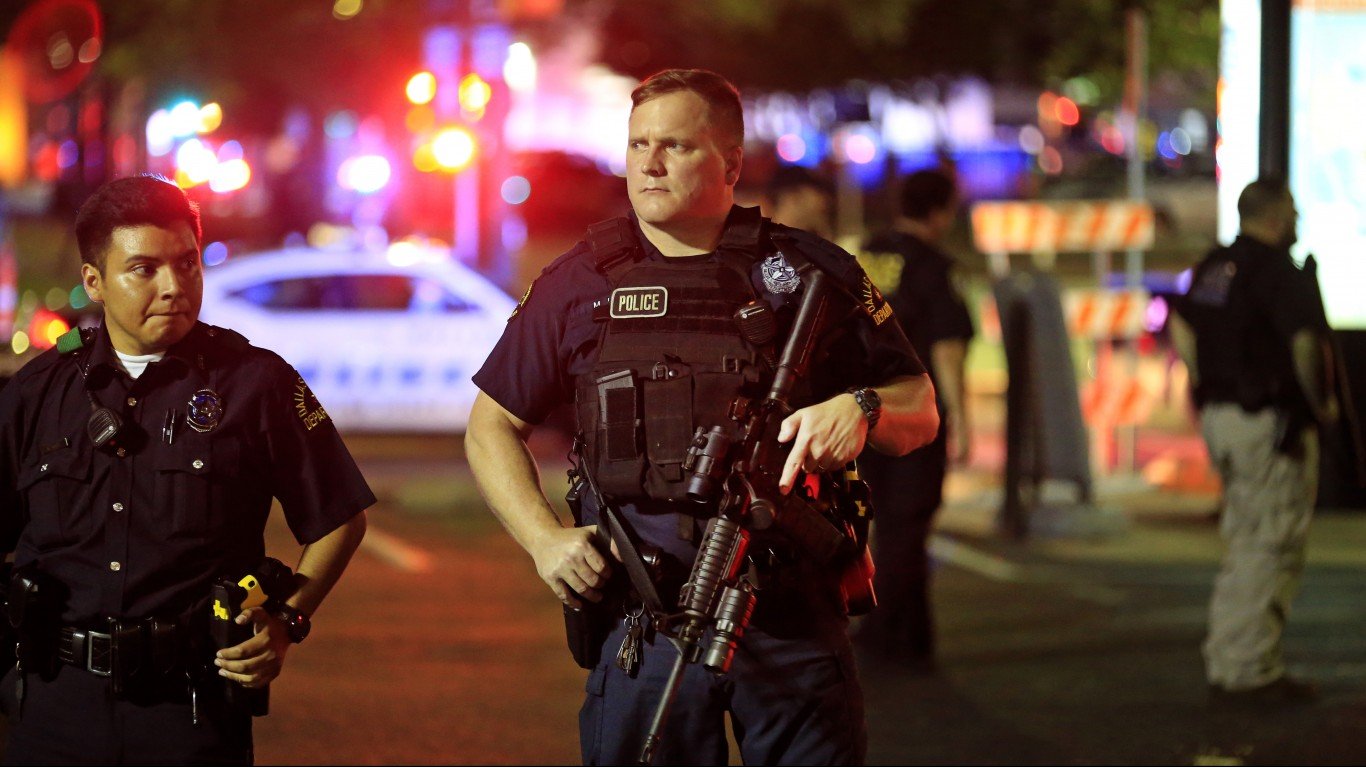
Source: Ron Jenkins / Getty Images News via Getty Images
26. Texas
> Police killings per 100,000 people since 2013: 2.91 (total: 845)
> Worst year police killings: 2015
> Worst city for police killings Houston (total: 116)

25. Hawaii
> Police killings per 100,000 people since 2013: 2.97 (total: 42)
> Worst year police killings: 2018
> Worst city for police killings Honolulu (total: 14)
[in-text-ad]
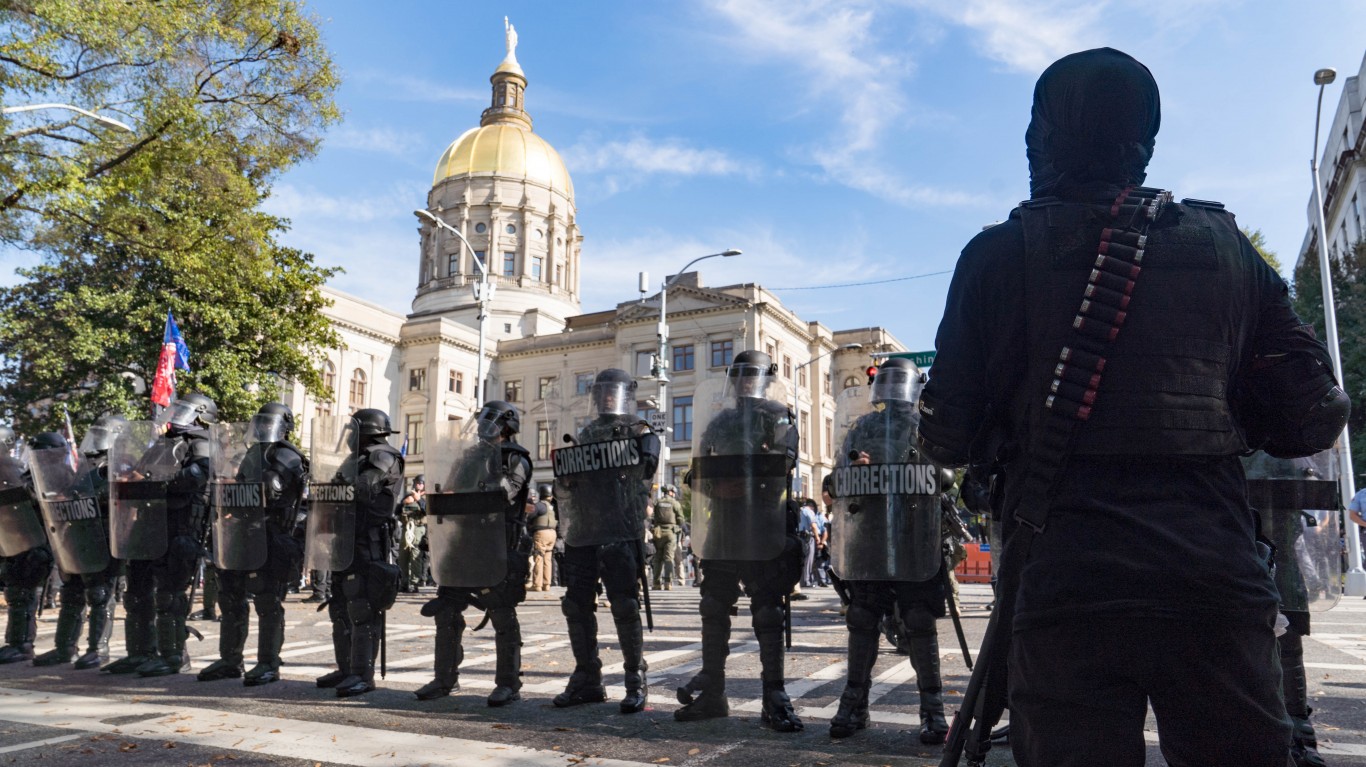
Source: Megan Varner / Getty Images News via Getty Images
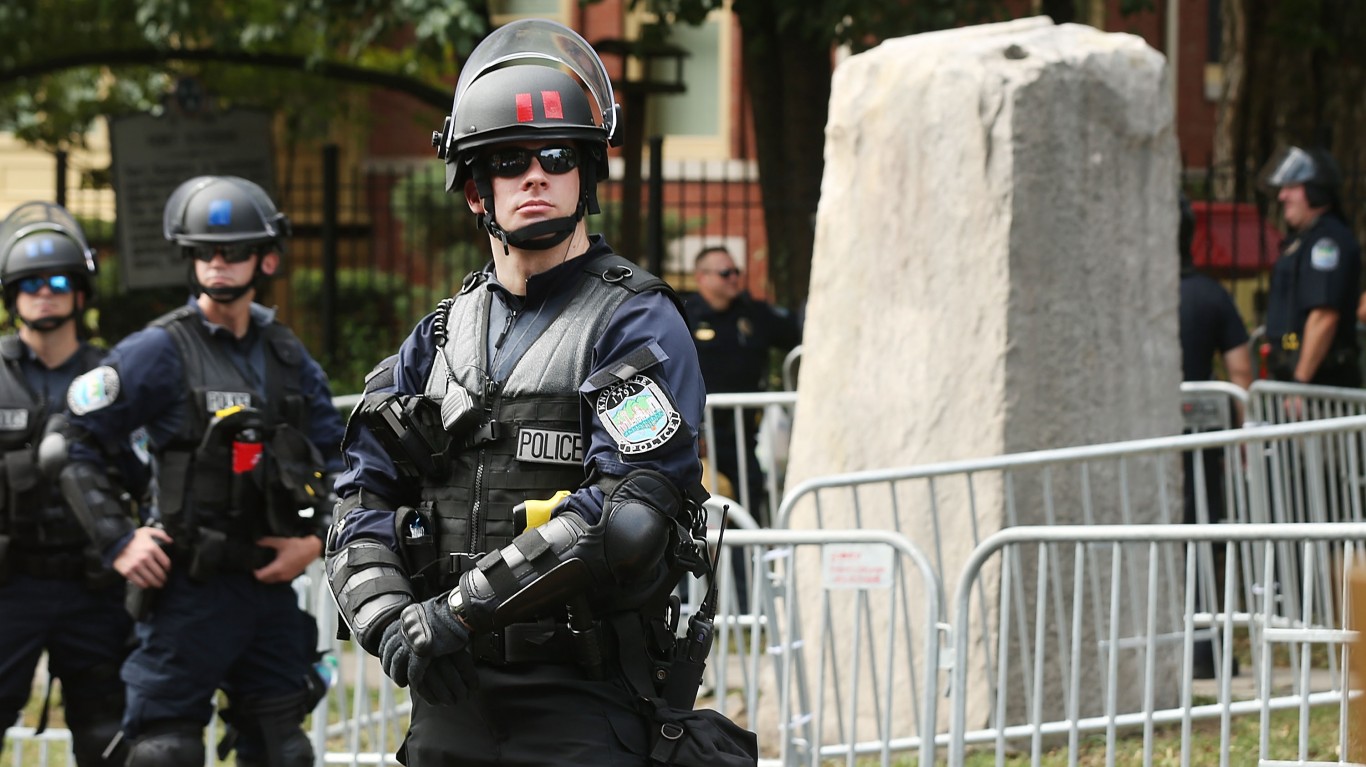
24. Georgia
> Police killings per 100,000 people since 2013: 3.04 (total: 323)
> Worst year police killings: 2018
> Worst city for police killings Atlanta (total: 30)
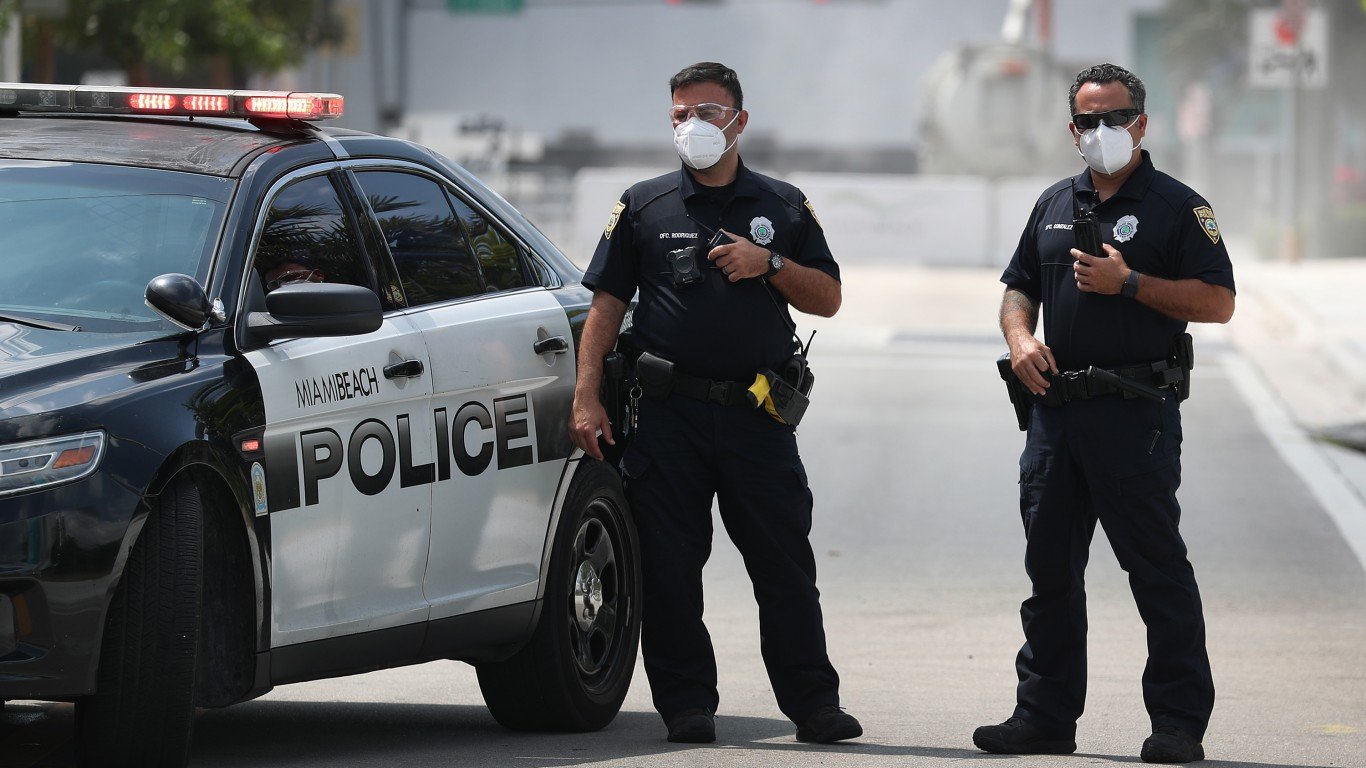
Source: Joe Raedle / Getty Images News via Getty Images
23. Florida
> Police killings per 100,000 people since 2013: 3.07 (total: 660)
> Worst year police killings: 2020
> Worst city for police killings Miami (total: 49)
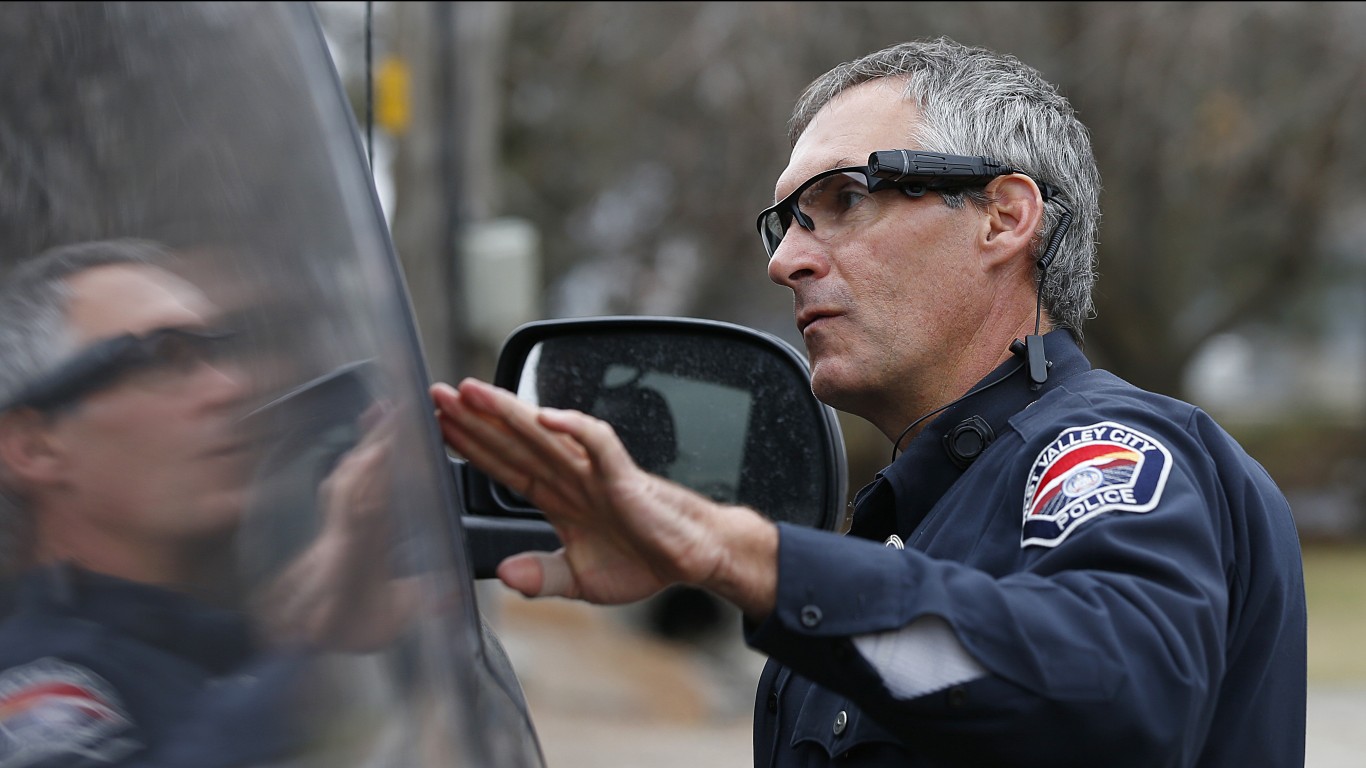
Source: George Frey / Getty Images News via Getty Images
22. Utah
> Police killings per 100,000 people since 2013: 3.15 (total: 101)
> Worst year police killings: 2014
> Worst city for police killings Salt Lake City (total: 22)
[in-text-ad-2]
Source: Spencer Platt / Getty Images News via Getty Images
21. Tennessee
> Police killings per 100,000 people since 2013: 3.19 (total: 218)
> Worst year police killings: 2019
> Worst city for police killings Memphis (total: 30)
Source: Nathan Howard / Getty Images News via Getty Images
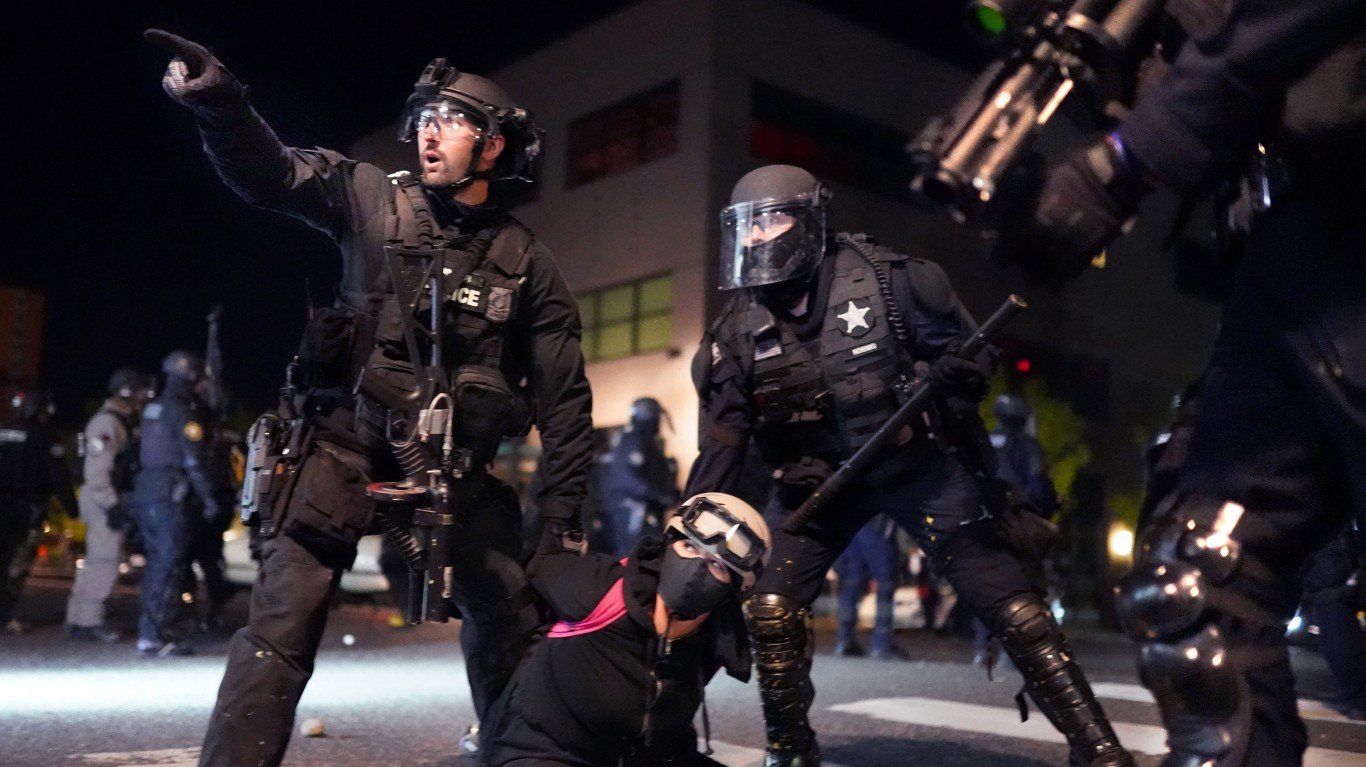
20. Oregon
> Police killings per 100,000 people since 2013: 3.22 (total: 136)
> Worst year police killings: 2018
> Worst city for police killings Portland (total: 21)
[in-text-ad]
Source: string_bass_dave / Flickr
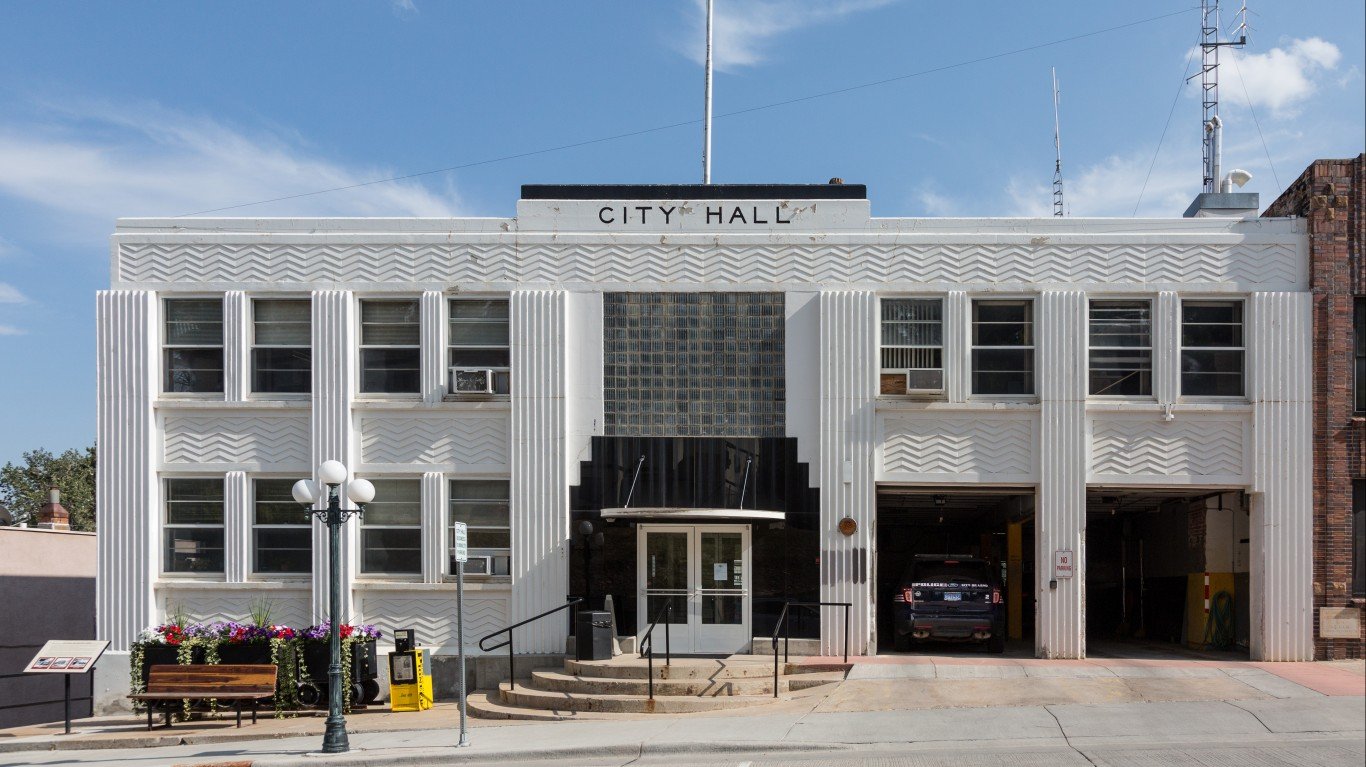
19. South Dakota
> Police killings per 100,000 people since 2013: 3.28 (total: 29)
> Worst year police killings: 2016
> Worst city for police killings Rapid City (total: 9)
Source: Brett Carlsen / Getty Images News via Getty Images
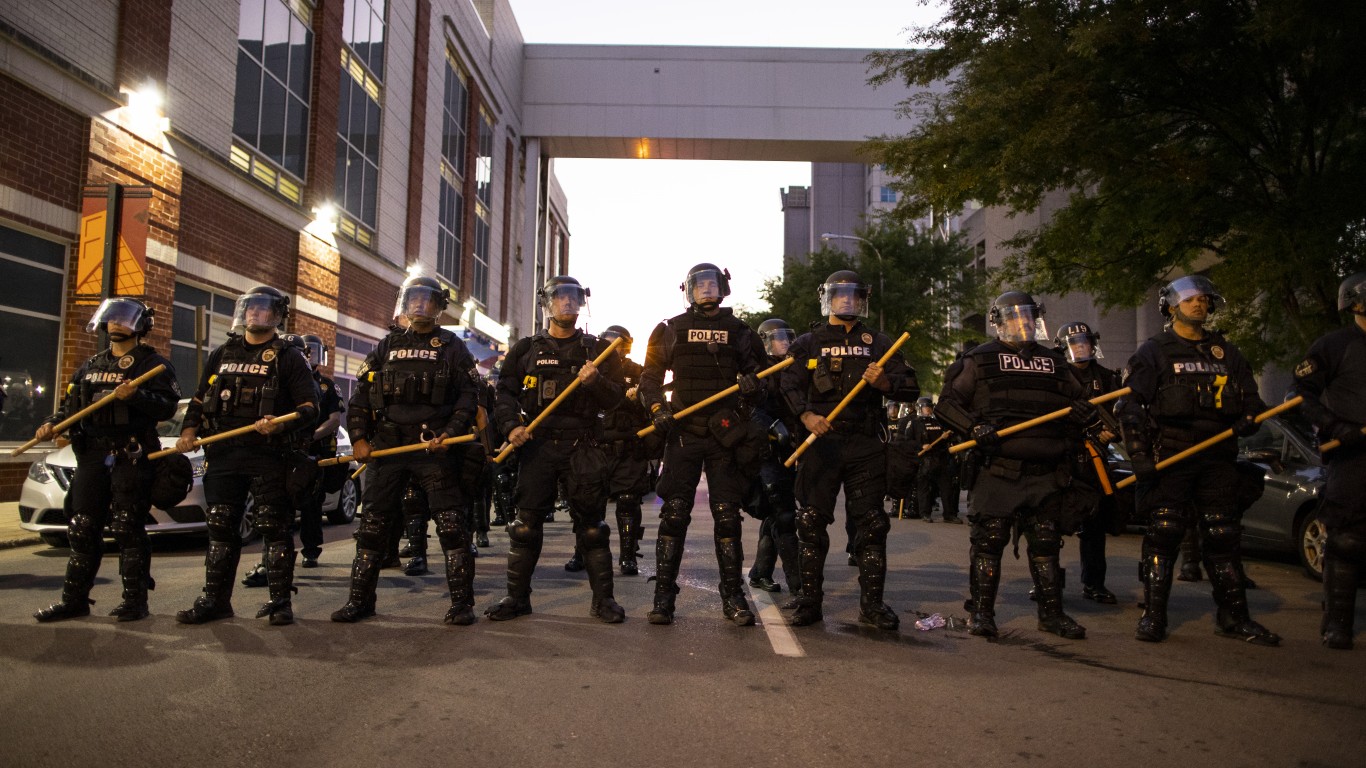
18. Kentucky
> Police killings per 100,000 people since 2013: 3.29 (total: 147)
> Worst year police killings: 2018
> Worst city for police killings Louisville (total: 32)
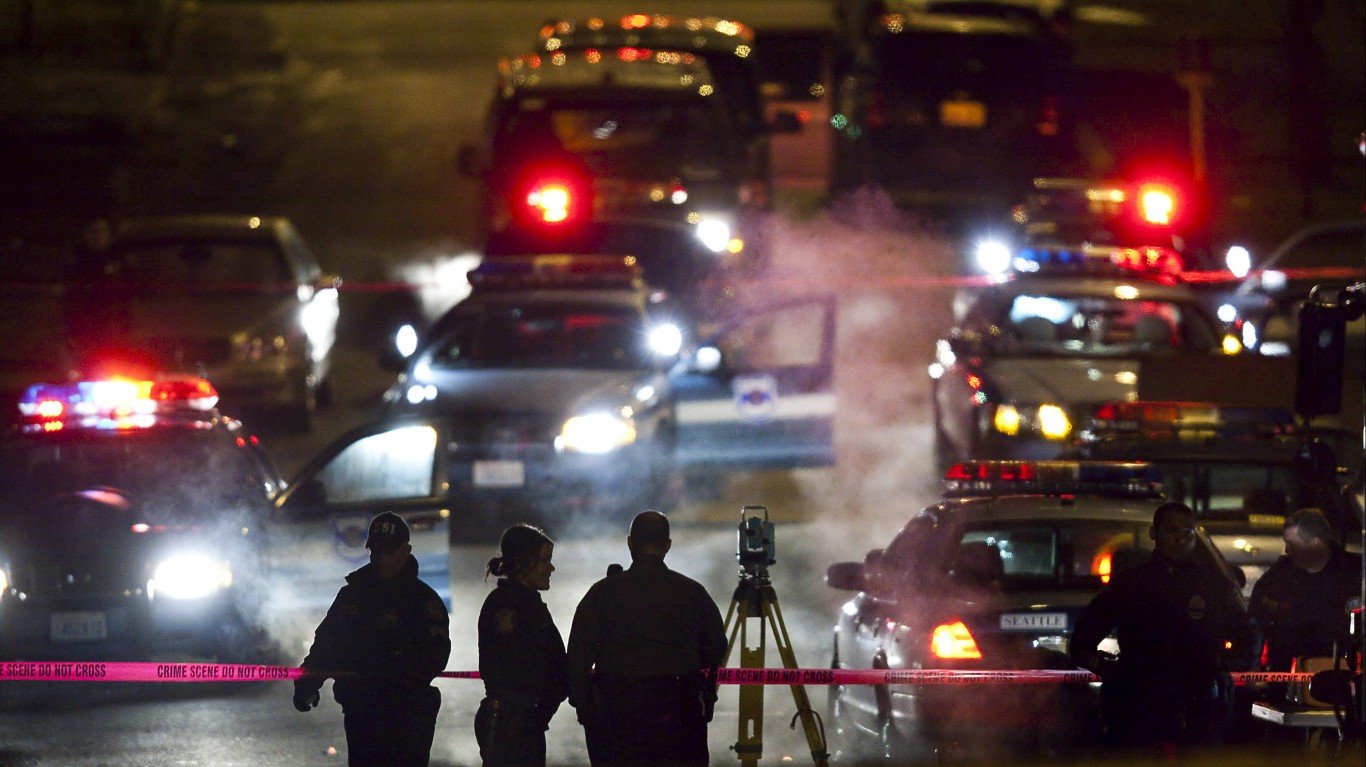
Source: Stephen Brashear / Getty Images
17. Washington
> Police killings per 100,000 people since 2013: 3.40 (total: 259)
> Worst year police killings: 2019
> Worst city for police killings Seattle (total: 29)
[in-text-ad-2]
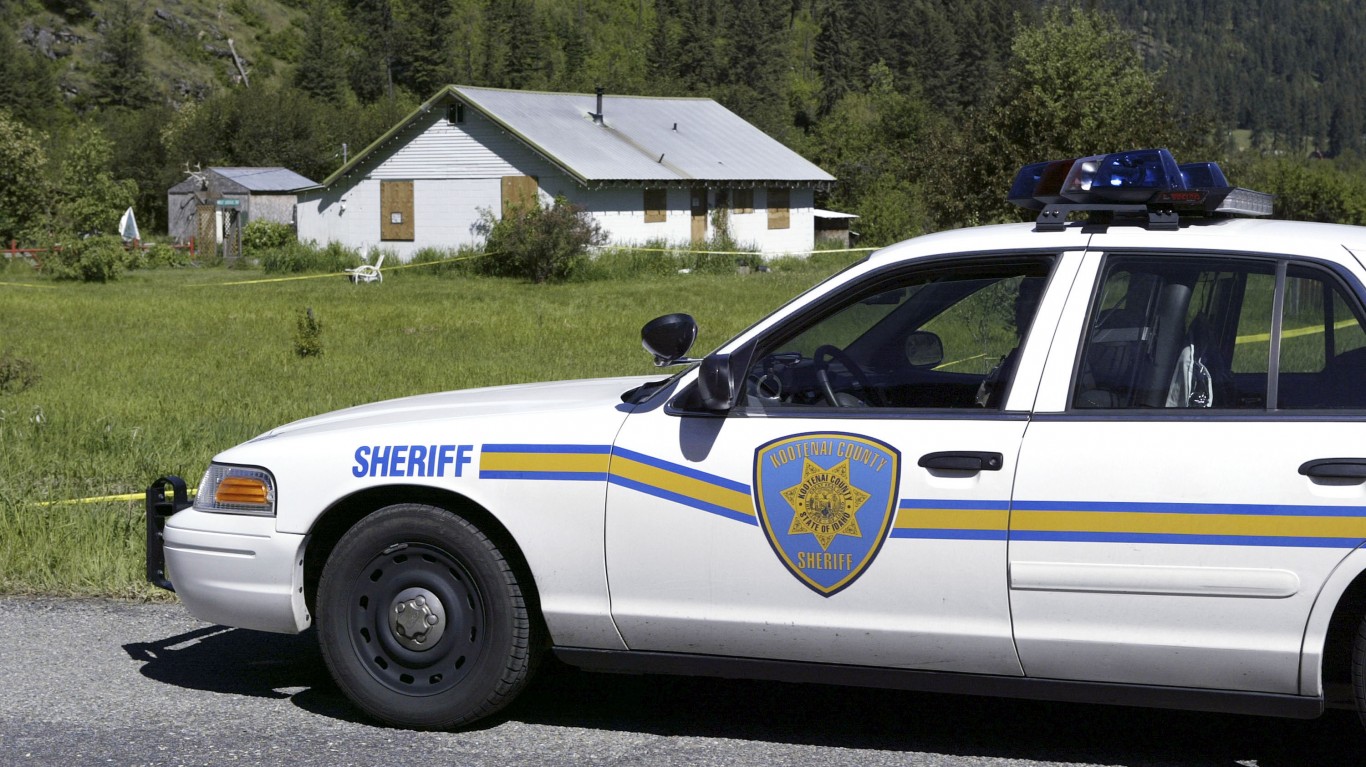
Source: Jeff T. Green / Getty Images News via Getty Images
16. Idaho
> Police killings per 100,000 people since 2013: 3.47 (total: 62)
> Worst year police killings: 2018
> Worst city for police killings Boise (total: 8)
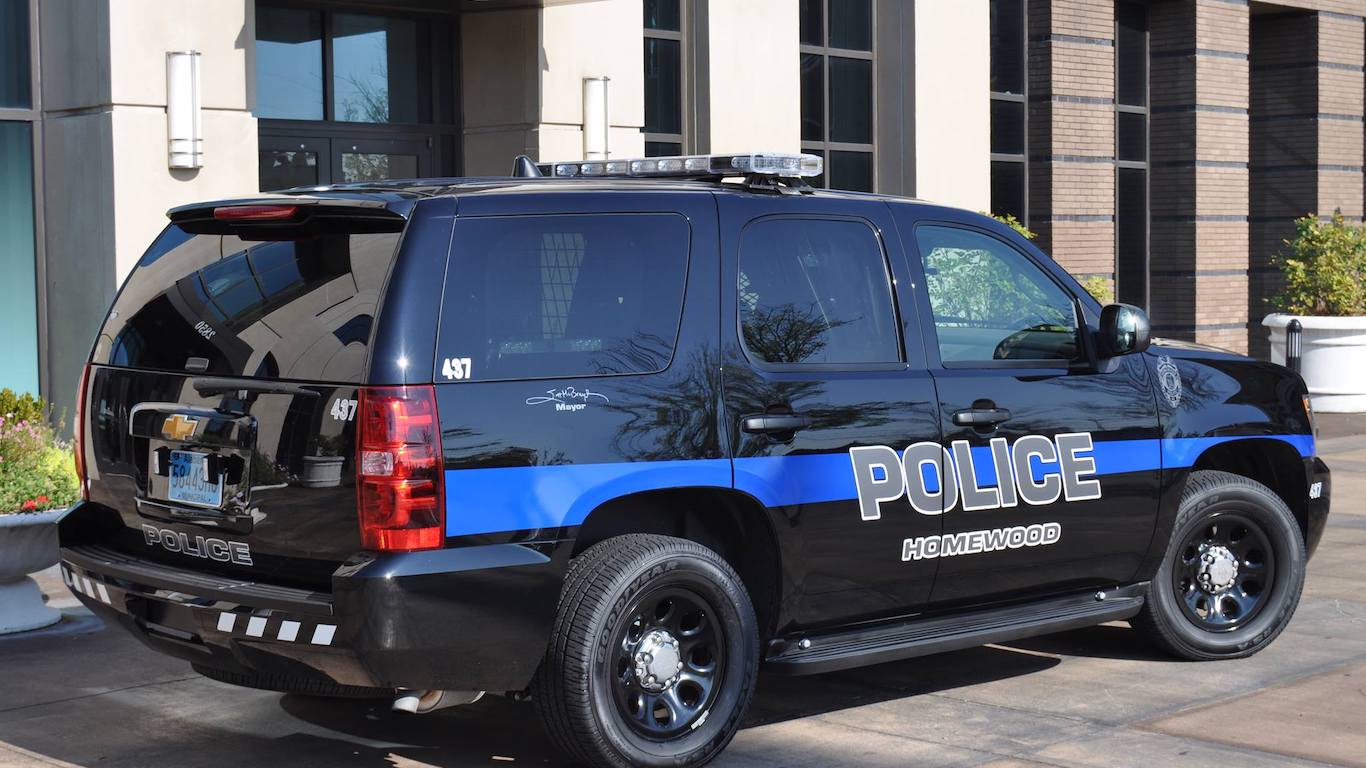
Source: Courtesy of Homewood Police Department via Facebook
15. Alabama
> Police killings per 100,000 people since 2013: 3.53 (total: 173)
> Worst year police killings: 2016
> Worst city for police killings Birmingham (total: 19)
[in-text-ad]

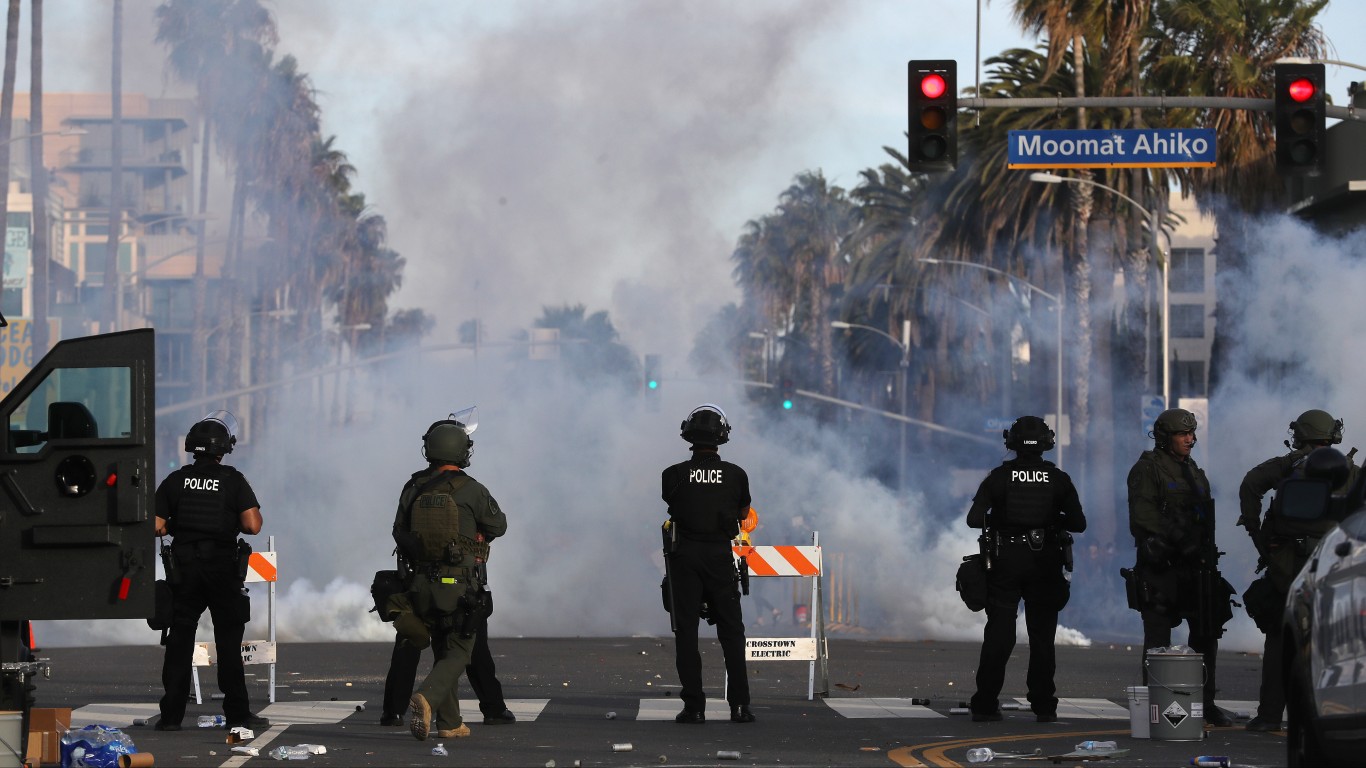
Source: Mario Tama / Getty Images News via Getty Images
14. California
> Police killings per 100,000 people since 2013: 3.57 (total: 1409)
> Worst year police killings: 2015
> Worst city for police killings Los Angeles (total: 127)
 24/7 Wall St.
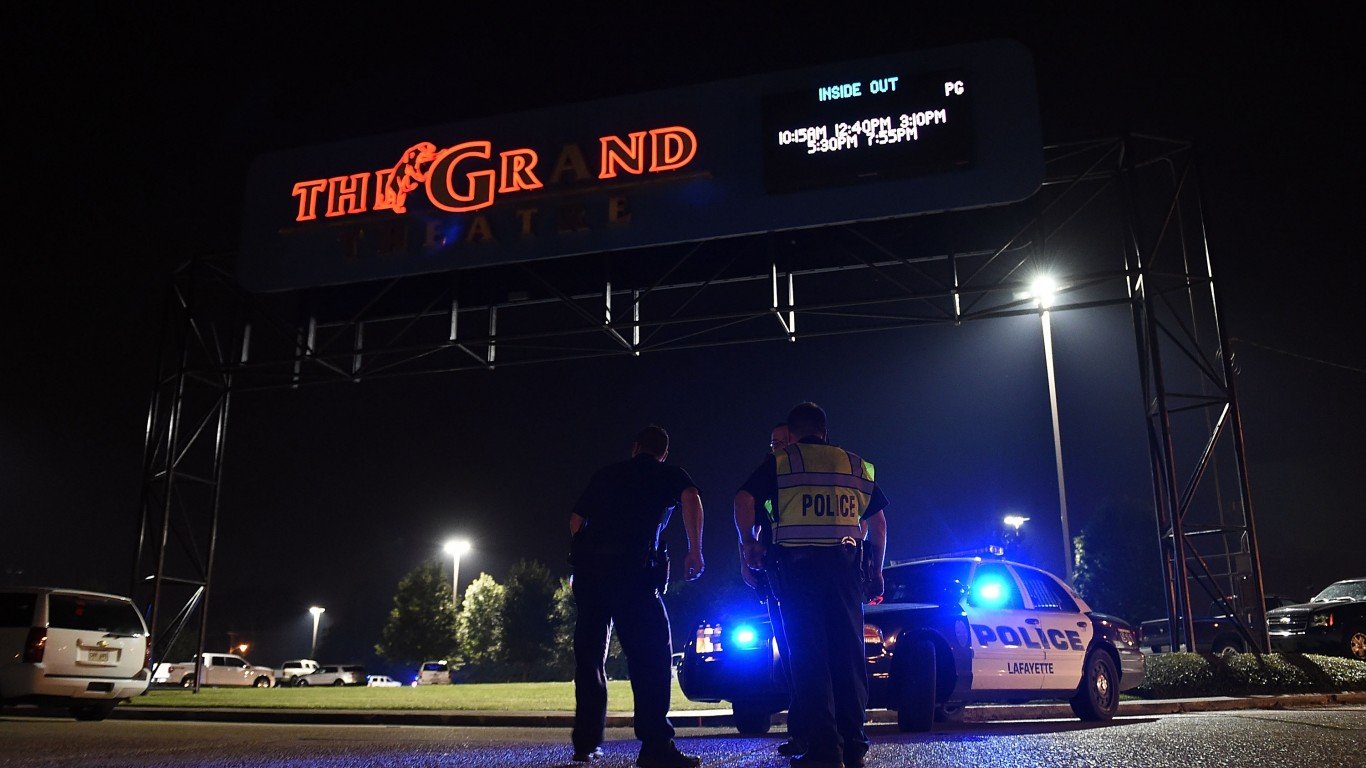
Source: Stacy Revere / Getty Images News via Getty Images
13. Louisiana
> Police killings per 100,000 people since 2013: 3.85 (total: 179)
> Worst year police killings: 2015
> Worst city for police killings Baton Rouge (total: 18)
Source: Scott Olson / Getty Images News via Getty Images
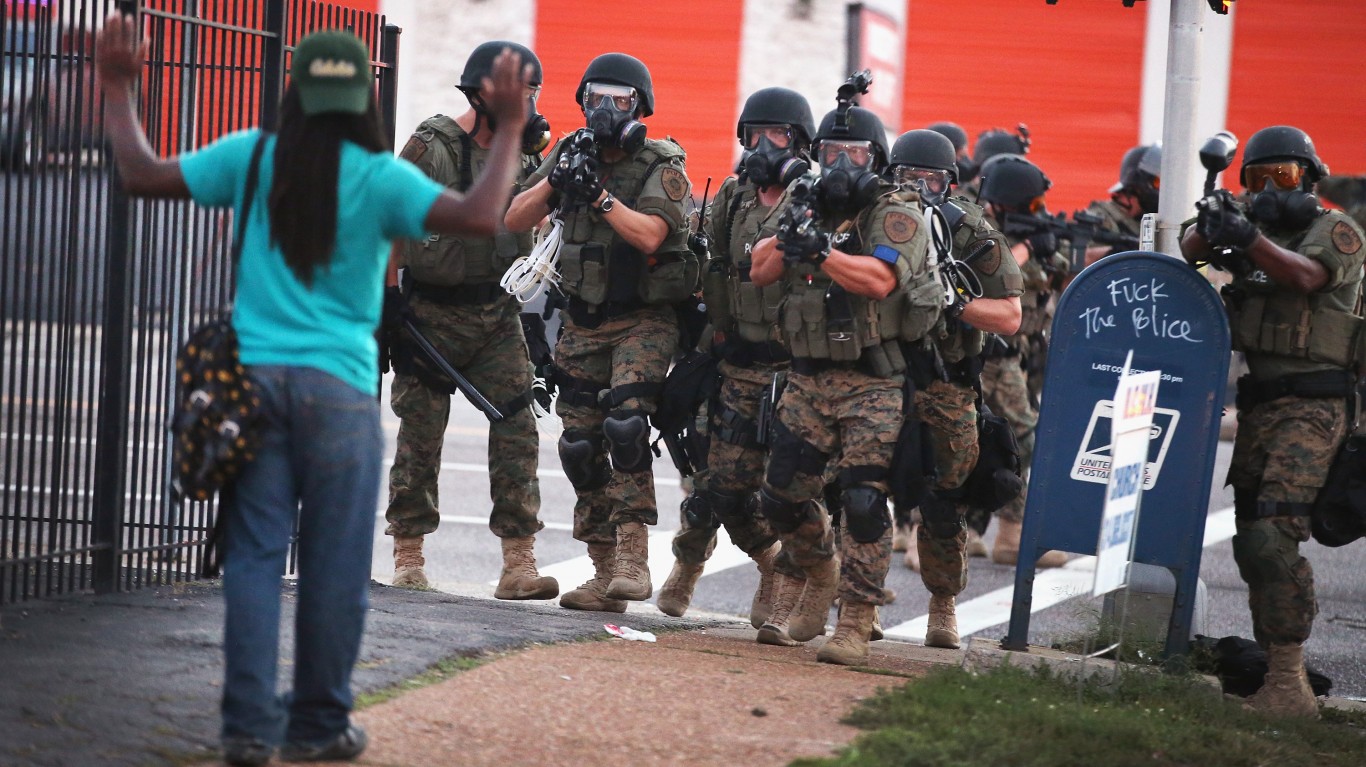
12. Missouri
> Police killings per 100,000 people since 2013: 3.89 (total: 239)
> Worst year police killings: 2017
> Worst city for police killings St. Louis (total: 50)
[in-text-ad-2]
Source: Benjamin Krain / Getty Images News via Getty Images
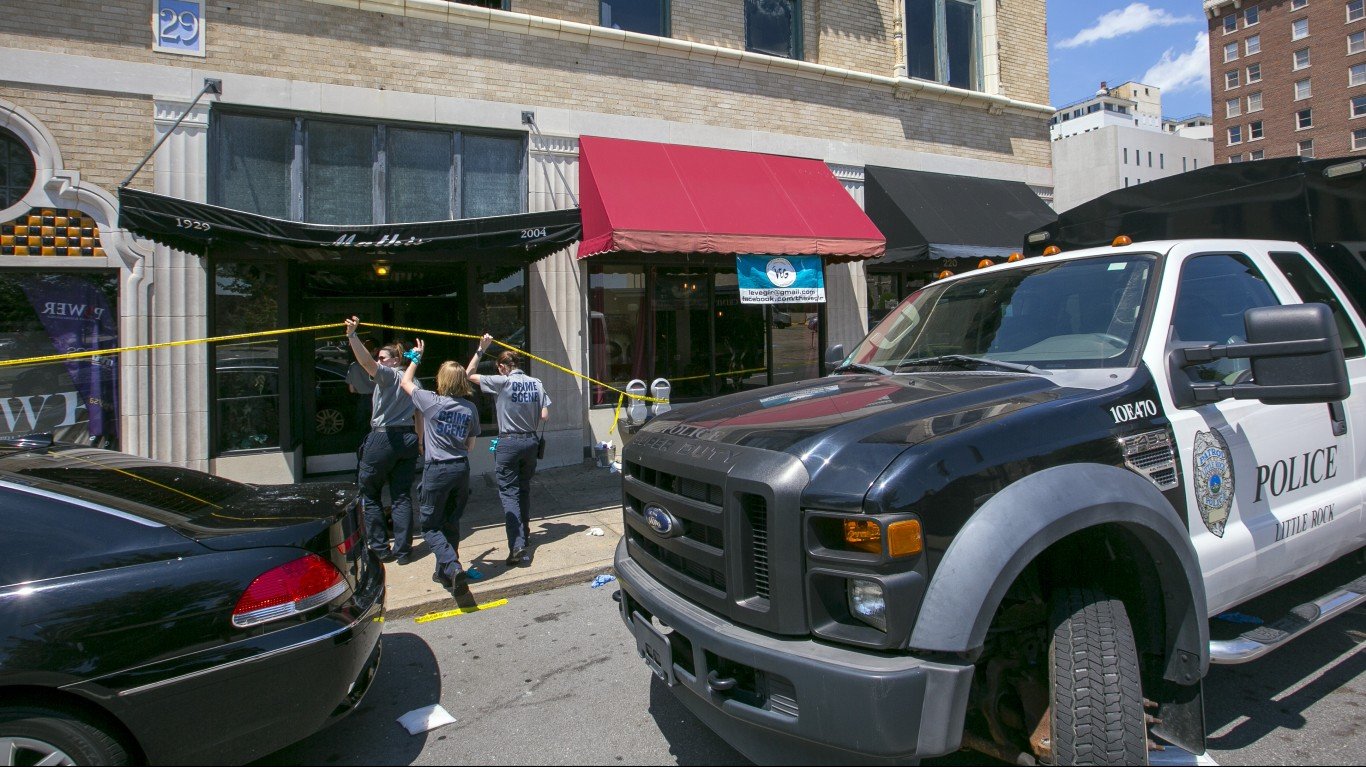
11. Arkansas
> Police killings per 100,000 people since 2013: 4.08 (total: 123)
> Worst year police killings: 2018
> Worst city for police killings Little Rock (total: 16)

10. Wyoming
> Police killings per 100,000 people since 2013: 4.15 (total: 24)
> Worst year police killings: 2015
> Worst city for police killings Casper (total: 8)
[in-text-ad]
Source: csfotoimages / iStock Editorial via Getty Images
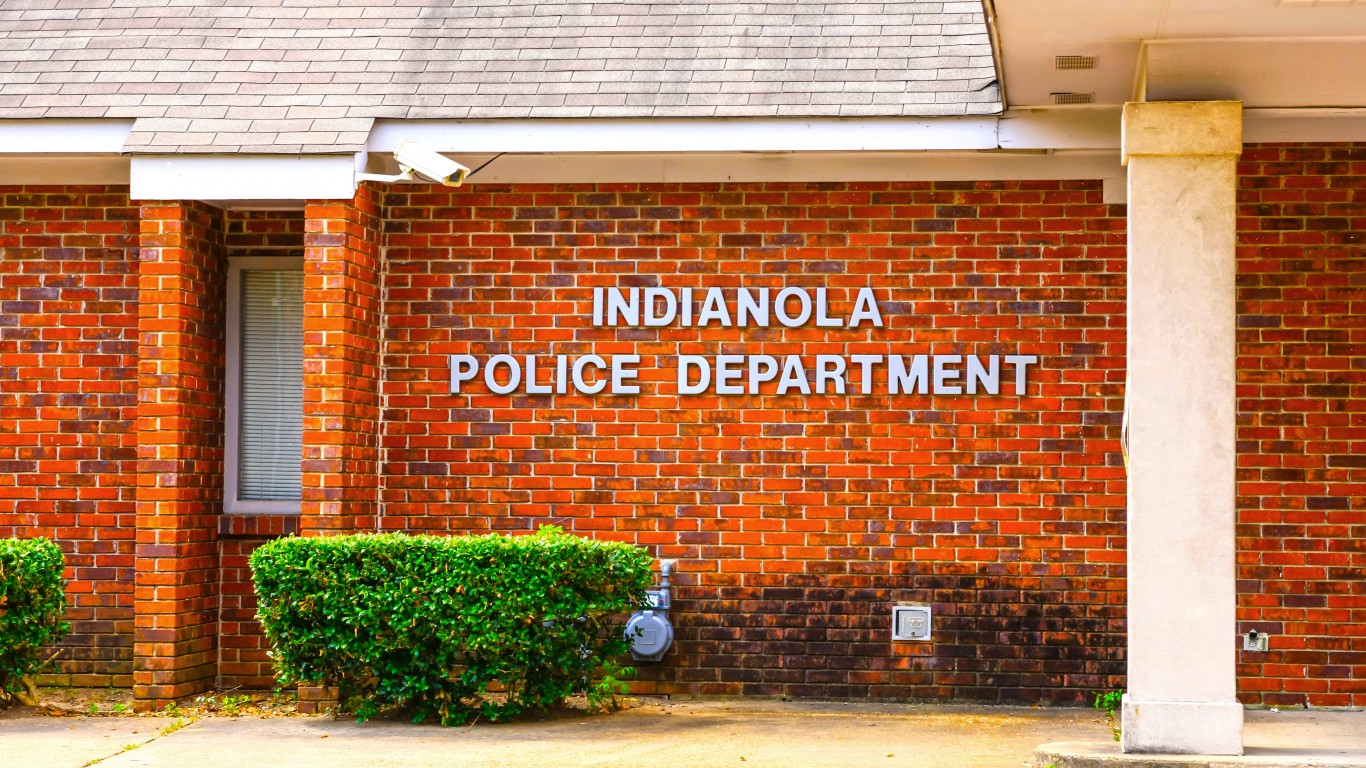
9. Mississippi
> Police killings per 100,000 people since 2013: 4.23 (total: 126)
> Worst year police killings: 2019
> Worst city for police killings Gulfport (total: 10)

8. West Virginia
> Police killings per 100,000 people since 2013: 4.41 (total: 79)
> Worst year police killings: 2019
> Worst city for police killings Charleston (total: 6)
Source: Ethan Miller / Getty Images News via Getty Images
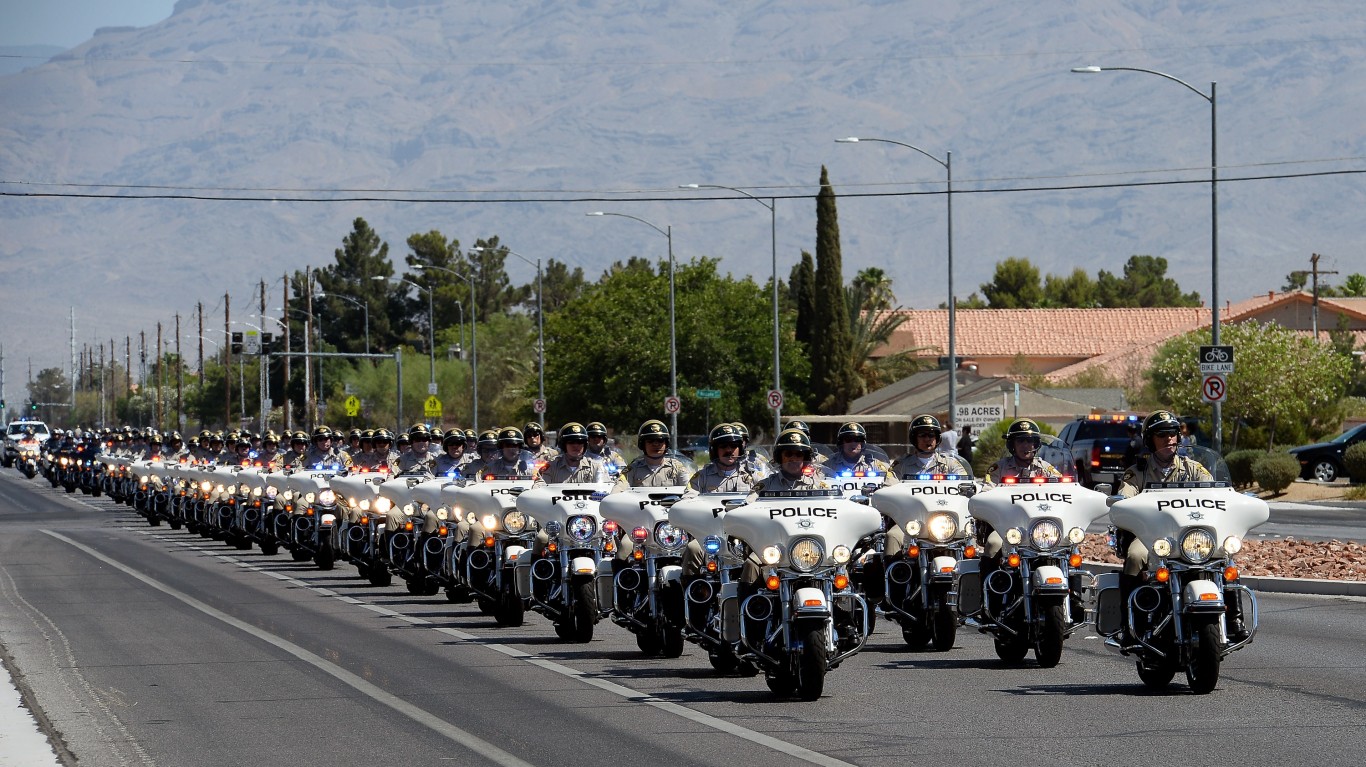
7. Nevada
> Police killings per 100,000 people since 2013: 4.87 (total: 150)
> Worst year police killings: 2020
> Worst city for police killings Las Vegas (total: 66)
[in-text-ad-2]
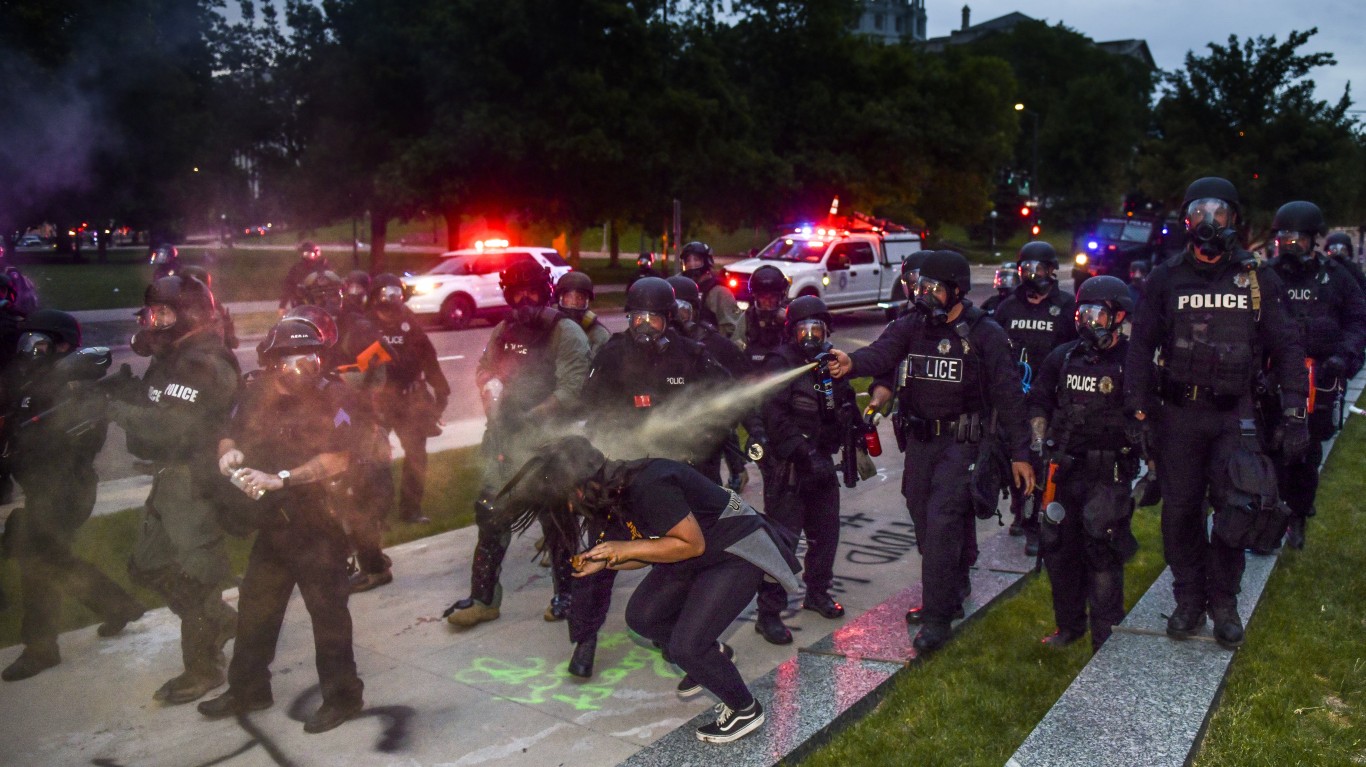
Source: Michael Ciaglo / Getty Images News via Getty Images
6. Colorado
> Police killings per 100,000 people since 2013: 4.98 (total: 287)
> Worst year police killings: 2018
> Worst city for police killings Denver (total: 52)

Source: MattGush / iStock via Getty Images
5. Montana
> Police killings per 100,000 people since 2013: 5.05 (total: 54)
> Worst year police killings: 2020
> Worst city for police killings Billings (total: 15)
[in-text-ad]
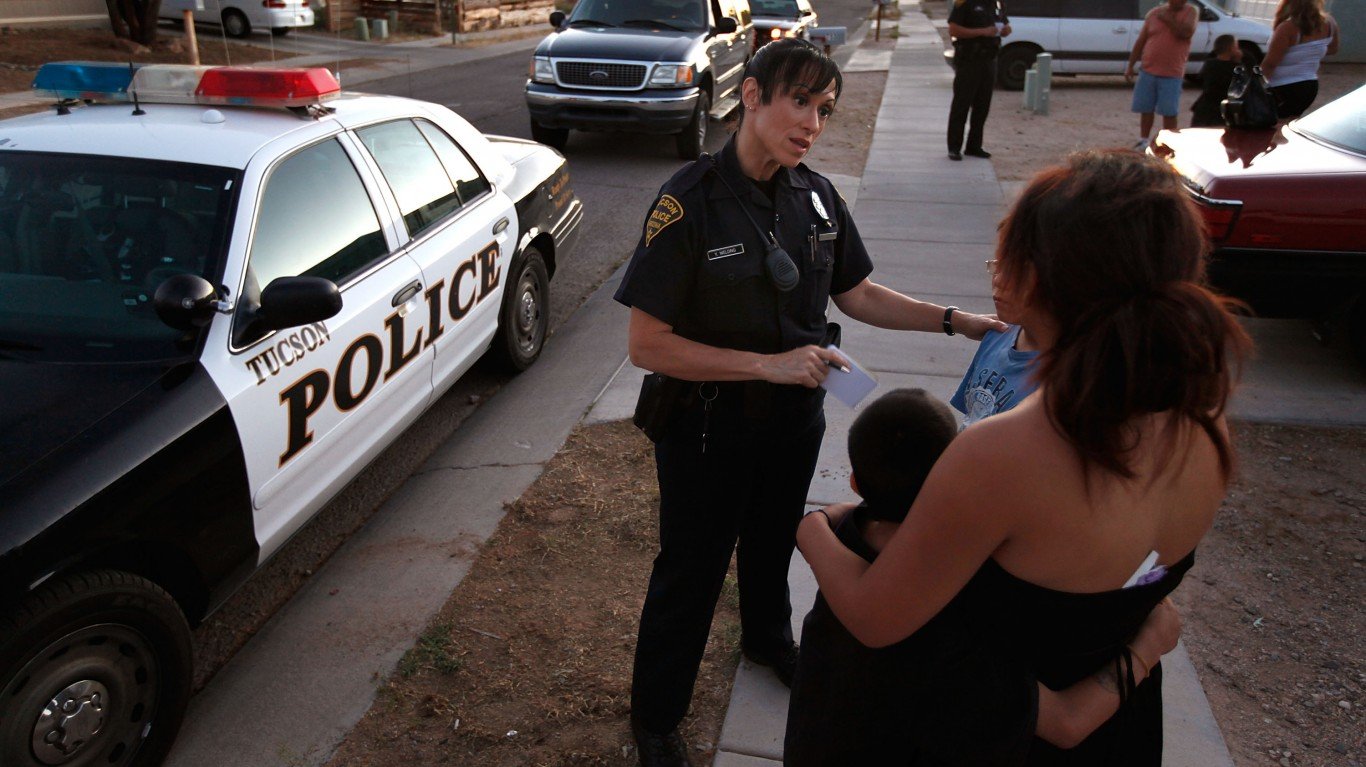
Source: Scott Olson / Getty Images News via Getty Images
4. Arizona
> Police killings per 100,000 people since 2013: 5.63 (total: 410)
> Worst year police killings: 2018
> Worst city for police killings Phoenix (total: 132)

Source: J Pat Carter / Getty Images News via Getty Images
3. Oklahoma
> Police killings per 100,000 people since 2013: 6.42 (total: 254)
> Worst year police killings: 2015
> Worst city for police killings Oklahoma City (total: 56)

Source: 152930510@N02 / Flickr
2. Alaska
> Police killings per 100,000 people since 2013: 7.11 (total: 52)
> Worst year police killings: 2020
> Worst city for police killings Anchorage (total: 13)
[in-text-ad-2]
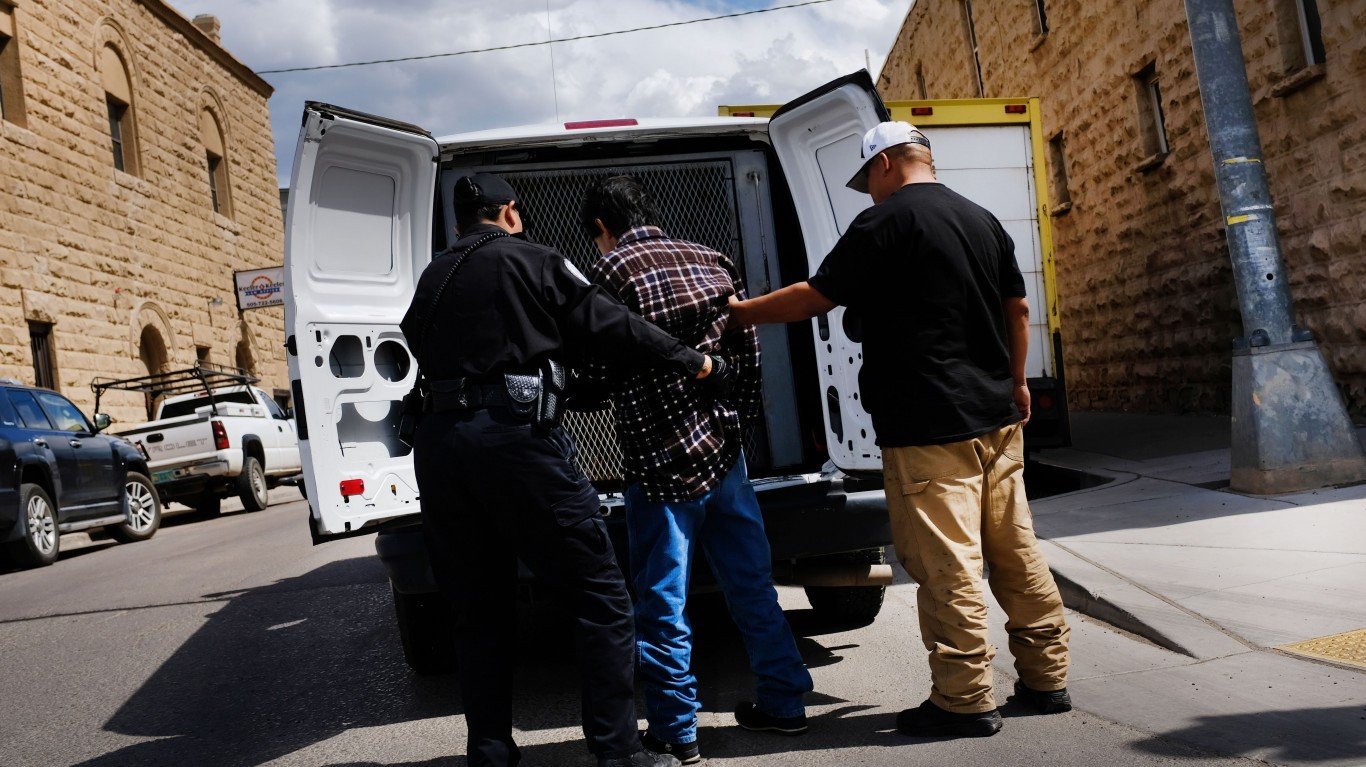
Source: Spencer Platt / Getty Images News via Getty Images
1. New Mexico
> Police killings per 100,000 people since 2013: 8.16 (total: 171)
> Worst year police killings: 2016
> Worst city for police killings Albuquerque (total: 59)
Take This Retirement Quiz To Get Matched With An Advisor Now (Sponsored)
Are you ready for retirement? Planning for retirement can be overwhelming, that’s why it could be a good idea to speak to a fiduciary financial advisor about your goals today.
Start by taking this retirement quiz right here from SmartAsset that will match you with up to 3 financial advisors that serve your area and beyond in 5 minutes. Smart Asset is now matching over 50,000 people a month.
Click here now to get started.
Thank you for reading! Have some feedback for us?
Contact the 24/7 Wall St. editorial team.
Editors' Picks


