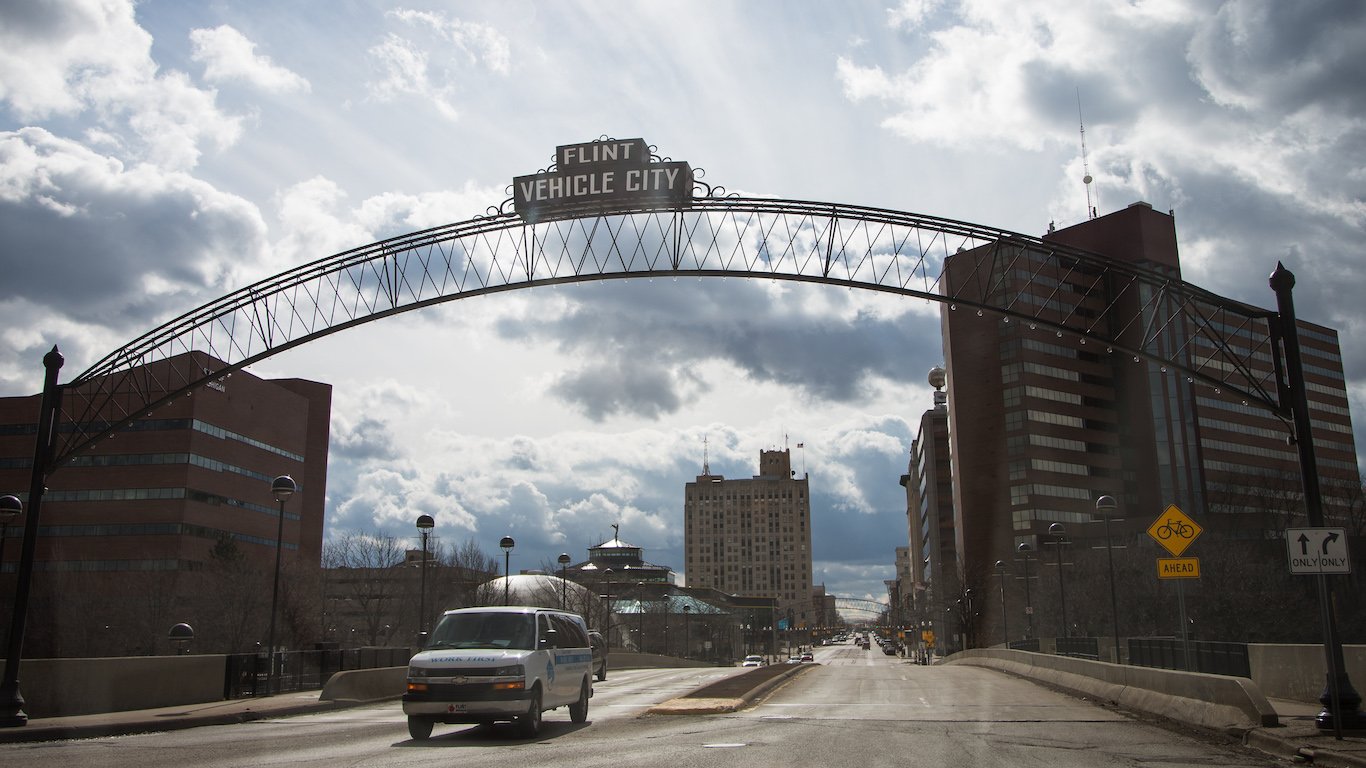
About one in every five American workers whose job could be performed remotely worked from home before the COVID-19 pandemic. That share jumped to nearly three in four following the abrupt closure of offices nationwide, according to a Pew Research Center survey conducted in October 2020. For millions of Americans, the shift to remote work is now permanent, and the new dynamic means they are no longer tied to a specific city for their job and can choose a place to live based on other factors, including quality of life — which varies considerably in the United States.
Affordability, access to public spaces and services, the presence of entertainment and cultural amenities, crime rates, and socioeconomic conditions are just a few of the factors that can influence quality of life in a given city or town.
24/7 Wall St. created a weighted index of 25 measures in four main categories — economy, affordability, quality of life, and community — using data from the U.S. Census Bureau, the FBI, and other sources to identify the best city to live in each state. We considered all boroughs, census designated places, cities, towns, and villages with at least 8,000 residents.
While household income was not itself a factor in the index, many of the cities and towns on this list are relatively wealthy. This is likely not a coincidence, as income is closely tied to several other measures used to create this list, including poverty, crime, employment growth, and unemployment. These are the richest towns in every state.
Population growth can be a sign that a given area is attractive to new residents and families, and not surprisingly, the majority of cities on this list are home to more people today than five years ago. About half of the cities on this list reported greater population growth than the U.S. as a whole between 2014 and 2019, and 10 reported population growth over 10%. Here is a look at America’s fastest growing cities.
Click here to see the best city to live in every state.

Alabama: Hoover
> Population: 85,175
> 5-yr. Population change: +2.8% (state: +1.2%)
> Median home value: $291,000 (state: $142,700)
> Median household income: $89,452 (state: $50,536)
> 5-yr. avg. unemployment: 3.3% (state: 5.9%)
Hoover, a city of about 83,000 located just south of Birmingham, ranks as the best place to live in Alabama. A relatively safe place, Hoover’s annual violent crime rate of 133 incidents per 100,000 people is well below the state rate of 511 incidents per 100,000.
People living in Hoover are also far more likely to be financially secure than the typical Alabama resident. The typical area household earns $89,452 a year, and only 6.2% of the local population live below the poverty line. Meanwhile, across all of Alabama, the median household income is $50,536, and the poverty rate stands at 16.7%.
[in-text-ad]

Source: sorincolac / iStock via Getty Images
Alaska: Juneau
> Population: 32,227
> 5-yr. Population change: +0.1% (state: +1.2%)
> Median home value: $345,900 (state: $270,400)
> Median household income: $88,390 (state: $77,640)
> 5-yr. avg. unemployment: 4.6% (state: 7.2%)
Of the 13 cities and towns in Alaska with sufficient data, Juneau, the state capital, ranks as the best place to live. Supported in part by a concentration of public sector jobs, Juneau’s average five-year unemployment rate of 4.6% is nearly the lowest in the state and well below the 6.8% average rate across Alaska. Additionally, just over 53% of Juneau residents are employed, the largest share of any Alaskan city or town considered.
In addition to a strong job market, Juneau residents benefit from easy access to venues for entertainment and culture. There is a far higher than average per capita concentration of places like restaurants, bars, hotels and movie theaters in the city than there are in much of the country.

Source: Focqus, LLC / Getty Images
Arizona: Paradise Valley
> Population: 14,362
> 5-yr. Population change: +8.4% (state: +7.4%)
> Median home value: $1,516,200 (state: $225,500)
> Median household income: $211,393 (state: $58,945)
> 5-yr. avg. unemployment: 2.1% (state: 5.9%)
Paradise Valley is a town of about 13,000 people just outside of Phoenix. Established just over 50 years ago with the goal of maintaining a quiet community with a small town feel in the face of the rapid expansion of Phoenix and nearby Scottsdale, Paradise Valley ranks as the best place to live in Arizona.
Over the last five years, an average of only 2.1% of the local labor force have been unemployed, by far the lowest unemployment rate of any city or town in the state with sufficient data. Paradise Valley is also one of the safest places in the United States, with an annual violent crime rate of 68 incidents per 100,000 people, a fraction of the state and national rates of 455 per 100,000 and 367 per 100,000, respectively.
Source: Brandonrush / Wikimedia Commons
Arkansas: Lowell
> Population: 9,175
> 5-yr. Population change: +18.3% (state: +1.8%)
> Median home value: $157,600 (state: $127,800)
> Median household income: $68,438 (state: $47,597)
> 5-yr. avg. unemployment: 1.0% (state: 5.1%)
Lowell is a city of just over 9,000 people in northwestern Arkansas, just outside of Fayetteville. A relatively small affordable place with a strong job market, it ranks as the best place to live in Arkansas. The typical home in Lowell is worth $157,600, just 2.3 times more than the local median annual household income of $68,438. Meanwhile, the typical Alabama home is worth 2.7 times what the typical household earns, and the median home value across the U.S. is 3.7 times the median household income. Residents of Lowell are also far less likely than the typical Arkansas resident to be struggling financially, as just 5.6% of the population live below the poverty line, compared to Arkansas’ 17.0% poverty rate.
Lowell’s desirability as a place to live is evidenced in its population growth. Over the last five years, the number of people living in Lowell has climbed by 18.3%. Meanwhile, Arkansas’ population grew by only 1.8% over the same period.
[in-text-ad-2]
Source: pikappa / iStock via Getty Images
California: Burlingame
> Population: 30,576
> 5-yr. Population change: +3.2% (state: +3.2%)
> Median home value: $1,901,900 (state: $505,000)
> Median household income: $128,447 (state: $75,235)
> 5-yr. avg. unemployment: 4.7% (state: 6.1%)
Burlingame, California, is a small city along the west coast of the San Francisco Bay. The city ranks as the best place to live in the state largely because of its residents’ financial prosperity. Most area households earn over $128,000 a year, compared to the state median of $75,235. Unemployment is also relatively low in the area. The strong job market and high incomes are both supported by a high concentration of biotech companies in the area. Local residents also have access to jobs in and around the San Francisco and Silicon Valley areas.
Quality of life in Burlingame is also bolstered by a high per capita concentration of places like restaurants, hotels, and fitness centers. Nearly 100% of those living in Burlingame and the broader San Mateo County, where the city is located, have access to public places for exercise such as parks, compared to less than 85% of all Americans.
Source: KaraGrubis / Getty Images
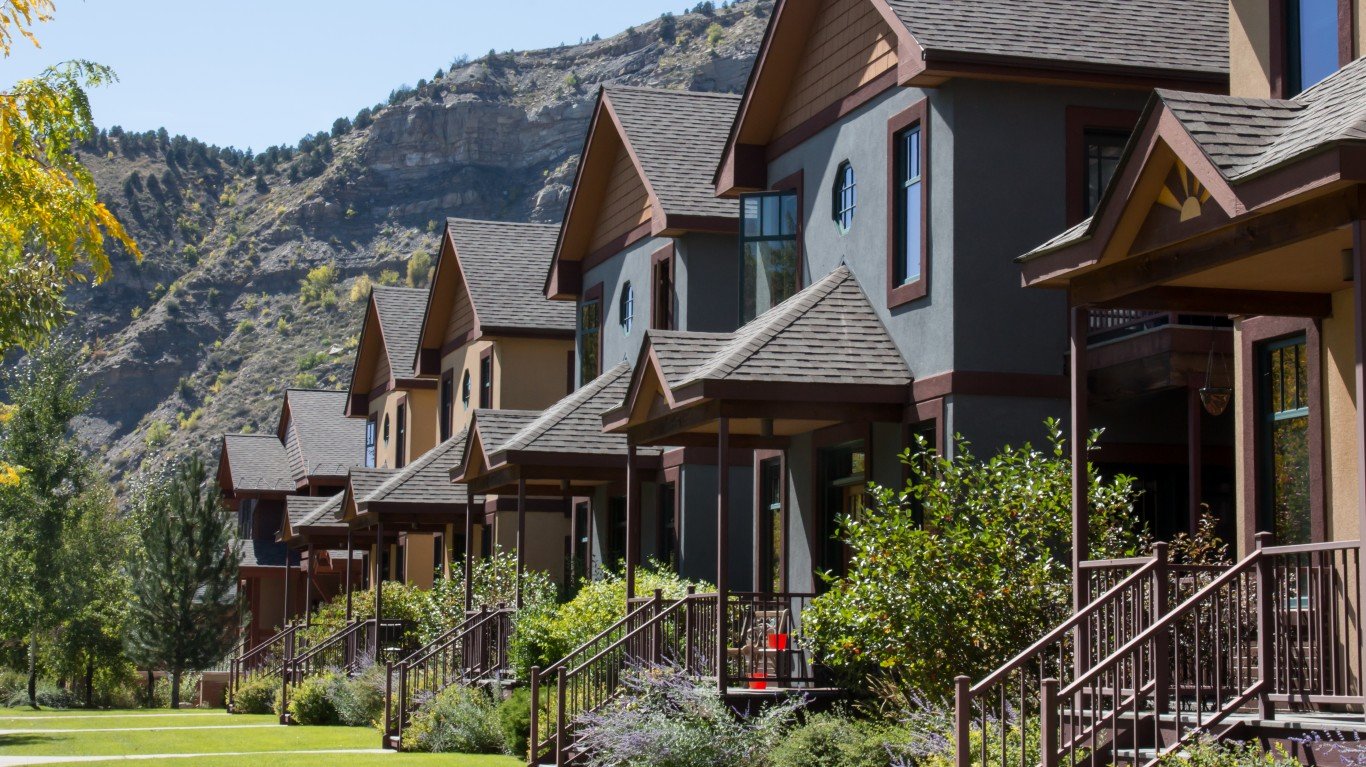
Colorado: Durango
> Population: 18,588
> 5-yr. Population change: +7.6% (state: +7.9%)
> Median home value: $463,700 (state: $343,300)
> Median household income: $66,160 (state: $72,331)
> 5-yr. avg. unemployment: 4.8% (state: 4.3%)
Durango, a small city of less than 20,000 residents near the southwestern corner of Colorado, ranks as the best place to live in the state. Just outside of the San Juan national forest, Durango residents have easy access to any number of outdoor activities, including skiing, mountain biking, hiking, and camping. The city is also host to a higher than average concentration of restaurants, bars, hotels, movie theaters, fitness centers, museums, and golf courses.
The city is also more pedestrian-friendly than most — nearly 20% of commuters in Durango either walk or bike to work. Perhaps not surprisingly, Durango has one of the most physically active populations in the country. Only 13.5% of area adults do not get some form of exercise on a regular basis, well below the 22.7% share of adults nationwide.
[in-text-ad]

Source: Kirkikis / iStock Editorial via Getty Images
Connecticut: Darien
> Population: 21,742
> 5-yr. Population change: +2.6% (state: -0.5%)
> Median home value: $1,471,700 (state: $275,400)
> Median household income: $232,523 (state: $78,444)
> 5-yr. avg. unemployment: 4.9% (state: 6.0%)
Darien is an unincorporated community in Fairfield County, Connecticut, along the Long Island Sound. Situated along a commuter line a short distance from Manhattan, one of the largest job markets in the United States, Darien’s five-year average unemployment rate of 4.9% is considerably lower than the 6.0% state rate. Additionally, over 30% of local residents use public transit to go to and from work, an option many Americans do not have.
Financial prosperity is another reason Darien ranks as the best place to live in Connecticut. The median annual household income in Darien is $232,523, nearly three times the $78,444 state median. Darien is also a safe place to live. There were only 14 violent crimes for every 100,000 people in the area in 2019, a fraction of the comparable 184 per 100,000 state rate and 367 per 100,000 national rate.

Source: aimintang / E+ via Getty Images
Delaware: Smyrna
> Population: 11,484
> 5-yr. Population change: +7.5% (state: +4.4%)
> Median home value: $206,400 (state: $251,100)
> Median household income: $67,277 (state: $68,287)
> 5-yr. avg. unemployment: 5.4% (state: 5.5%)
Smyrna, located on the northern end of the Delmarva Peninsula, ranks as the best place to live in Delaware. Of the dozen cities and towns in Delaware with sufficient data, Smyrna is among the most affordable. The typical home in Smyrna is worth $206,400, just 3.1 times more than the local median annual household income of $67,277. Meanwhile, the typical Delaware home is worth 3.7 times what the typical household earns.
Smyrna is also far safer than Delaware as a whole. There were 272 violent crimes for every 100,000 people in the town, compared to 473 per 100,000 across Delaware. Smyrna’s desirability as a place to live is also evidenced by its faster than average population growth. Over the last five years, the number of people living in the town increased by 7.5%, compared to Delaware’s 4.4% population growth over the same period.

Source: Art Wager / Getty Images
Florida: Key Biscayne
> Population: 12,915
> 5-yr. Population change: +1.1% (state: +8.0%)
> Median home value: $1,211,000 (state: $215,300)
> Median household income: $151,310 (state: $55,660)
> 5-yr. avg. unemployment: 5.3% (state: 5.6%)
Key Biscayne, Florida, is a small village located on a barrier island in the Atlantic just south of Miami. One of the safest places in the United States, Key Biscayne has an annual violent crime rate of 38 incidents per 100,000 people, a fraction of the comparable 378 per 100,000 state rate and 367 per 100,000 national rate.
The area’s high quality of life is supported by the area’s relative wealth. Only 4.9% of the population live on poverty-level wages, and most area households earn over $150,000 a year. Meanwhile, across Florida, the poverty rate is 14.0% and the median household income is $55,660.
[in-text-ad-2]

Georgia: Sandy Springs
> Population: 107,072
> 5-yr. Population change: +8.7% (state: +5.0%)
> Median home value: $471,800 (state: $176,000)
> Median household income: $78,613 (state: $58,700)
> 5-yr. avg. unemployment: 3.0% (state: 5.7%)
Sandy Springs, a city of over 100,000 just north of Atlanta, ranks as the best place to live in Georgia. Due in part to their proximity to Atlanta, Sandy Spring residents have a higher than average per capita concentration of restaurants, hotels, fitness centers, movie theaters and theater companies in their surrounding county. The city is also surrounded by nearly 1,000 acres of parks and natural areas. Partially as a result, 95% of the population have easy access to public places for recreation, compared to about 84% of all Americans and 76% of all Georgia residents.
With Atlanta within commuting distance, Sandy Springs residents also have access to a large job market. Only 3.0% of the local labor force have been unemployed in the last five years, almost half the 5.7% statewide jobless rate. Sandy Springs itself is also home to the operations or headquarters of multiple Fortune 500 and Fortune 1,000 companies, including the United Parcel Service, packaging company West Rock, and Newell Brands, the company behind brands like Rubbermaid and Ball.

Source: Art Wager / Getty Images
Hawaii: Urban Honolulu
> Population: 348,985
> 5-yr. Population change: +1.1% (state: +2.1%)
> Median home value: $683,000 (state: $615,300)
> Median household income: $71,465 (state: $81,275)
> 5-yr. avg. unemployment: 3.7% (state: 4.3%)
Home to nearly 350,000 people, Honolulu is the most populous city in Hawaii. It also ranks as the best place to live in the state. A relatively walkable city with reliable public transportation, over one-quarter of workers commute without needing to rely on a personal vehicle, an option many Americans do not have.
Though Hawaii’s economy has been negatively impacted more than most states by the COVID-19 pandemic, in more normal times, Honolulu boasts a strong job market. The average unemployment rate over the last five years in the city was just 3.7% — below both the comparable 4.3% state rate and 5.3% national jobless rate.
[in-text-ad]
Source: Dmharris26 / Public Domain / Wikimedia Commons
Source: Dmharris26 / Public Domain / Wikimedia Commons
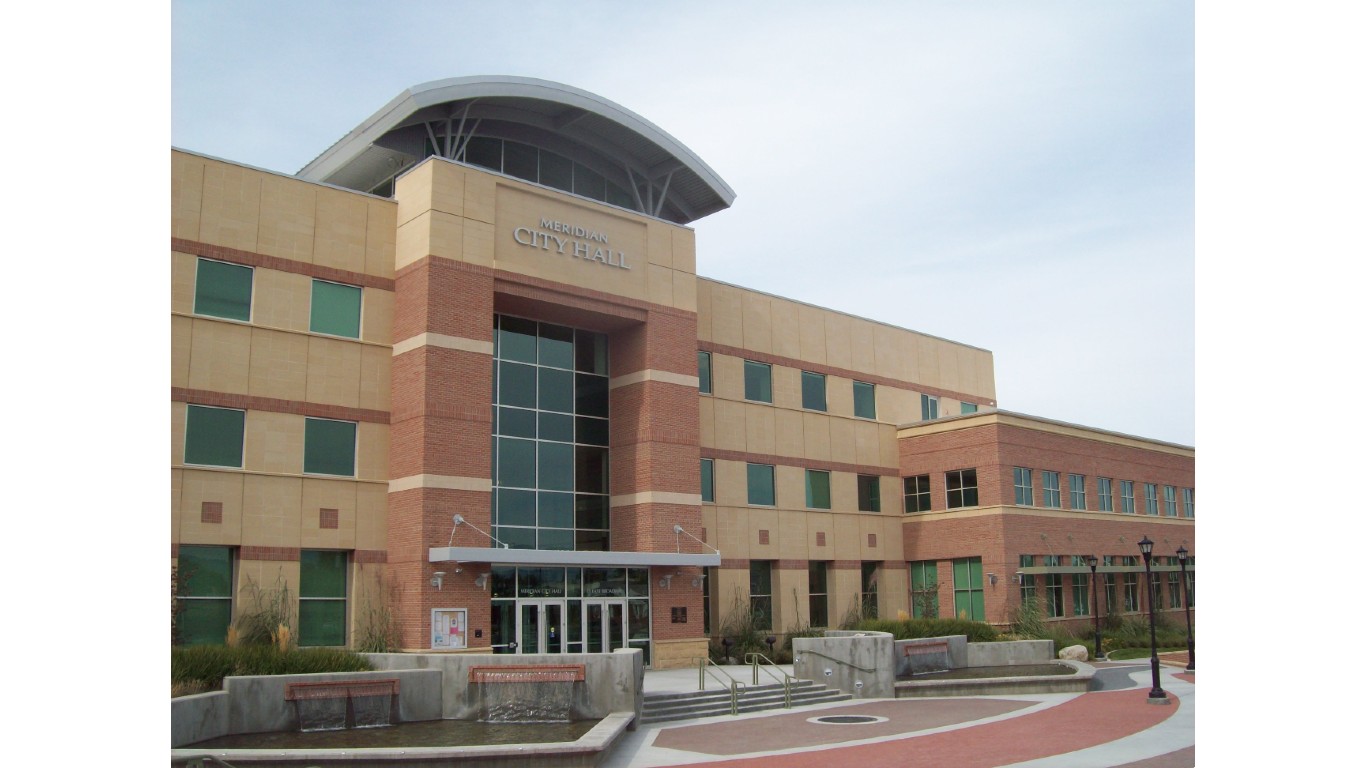
Idaho: Meridian
> Population: 101,905
> 5-yr. Population change: +25.8% (state: +7.4%)
> Median home value: $274,900 (state: $212,300)
> Median household income: $71,389 (state: $55,785)
> 5-yr. avg. unemployment: 3.7% (state: 4.3%)
Meridian, a city of about 102,000 residents just west of Boise, ranks as the best place to live in Idaho. The city has a strategic growth plan designed to allow for sustainable expansion and promote industry without sacrificing quality of life. Recently, FedEx opened a 120,000 square foot distribution facility in the area, bringing several hundred jobs with it. Over the last five years, an average of just 3.7% of the local labor force were unemployed, below both the comparable 4.3% state and 5.3% national jobless rates.
Incomes in Meridian are also far higher than they are in much of the state. The typical area household earns $71,389 a year, well above the median income of $55,785 across Idaho. As is often the case in areas with strong job markets and high incomes, Meridian is also safe. There were only 159 violent crimes for every 100,000 people in the city in 2019, compared to 224 per 100,000 in Idaho and 367 per 100,000 nationwide.

Source: UrAveragePhotographer / Getty Images
Illinois: Winnetka
> Population: 12,428
> 5-yr. Population change: +0.5% (state: -0.8%)
> Median home value: $1,091,700 (state: $194,500)
> Median household income: $250,000+ (state: $65,886)
> 5-yr. avg. unemployment: 2.4% (state: 5.9%)
Winnetka, a small village along the shore of Lake Michigan about 20 miles north of downtown Chicago, ranks as the best place to live in Illinois. Winnetka residents have easy access to the largest city in the Midwest with a commuter line that goes directly downtown. Partially as a result, over a quarter of commuters in the area use public transit to get to work and do not have to rely on a car. As is often the case in municipalities outside major urban areas, unemployment is low in Winnetka. The village’s five-year average jobless rate of 2.4% is less than half the comparable national figure of 5.9%.
The village and surrounding county also boasts a high per capita concentration of restaurants, bars, and theater companies as well as a total of 27 parks that span nearly 250 acres.
Source: alexeys / Getty Images
Indiana: Carmel
> Population: 97,464
> 5-yr. Population change: +16.8% (state: +1.9%)
> Median home value: $333,200 (state: $141,700)
> Median household income: $112,765 (state: $56,303)
> 5-yr. avg. unemployment: 2.5% (state: 4.8%)
Carmel, a city of just under 100,000 residents, located north of Indianapolis, is the best place to live in Indiana. In addition to attractions in nearby Indianapolis, Carmel residents have access to a number of culture and entertainment options in their hometown, including museums, breweries, parks, bike trails, public art, and shopping. The city also has a thriving job market, with a five-year average unemployment rate of just 2.5%, nearly half the 4.8% comparable state jobless rate.
Carmel is also a safe place to live. There were only 32 violent crimes for every 100,000 people in the area in 2019, a fraction of the comparable 371 per 100,000 state rate and 367 per 100,000 national rate.
[in-text-ad-2]

Iowa: North Liberty
> Population: 18,829
> 5-yr. Population change: +29.8% (state: +2.0%)
> Median home value: $220,800 (state: $147,800)
> Median household income: $83,949 (state: $60,523)
> 5-yr. avg. unemployment: 1.1% (state: 3.7%)
North Liberty ranks as the best place to live in Iowa. Located just north of Iowa City, North Liberty residents have access to jobs in a larger nearby city. Partially as a result, the local unemployment rate has averaged just 1.1% over the last five years, well below the five-year state rate of 3.7% and national rate of 5.3%. North Liberty is also an affordable place to own a home. The typical area home is worth $220,800, just 2.6 times more than the median annual household income in the area of $83,949. Meanwhile, across the United States, the typical home is worth 3.5 times more than median household income.
The area’s affordable housing and a strong job market may partially explain the rapid population growth in North Liberty. Over the last five years, the number of people living in the city increased by nearly 30%. Iowa’s population increased by just 2.0% over the same period.

Source: TriggerPhoto / iStock via Getty Images
Kansas: Leawood
> Population: 34,670
> 5-yr. Population change: +5.6% (state: +1.0%)
> Median home value: $463,200 (state: $151,900)
> Median household income: $157,515 (state: $59,597)
> 5-yr. avg. unemployment: 2.7% (state: 4.1%)
Leawood is a city of just under 35,000 residents located south of Kansas City. Due to a number of strong socioeconomic indicators, it ranks as the best place to live in Kansas. The area’s low unemployment rate — averaging just 2.7% in the last five year — contributes to financial stability in Leawood. Most local households earn over $150,000 a year, nearly three times the median household income of $59,597 across Kansas. Additionally, the city’s 1.4% poverty rate is among the lowest in the United States and well below the 12.0% rate across Kansas.
The city has a highly regarded public school system and a well-educated population. Leawood is also safe. The local violent crime rate of 54 incidents per 100,000 people is a fraction of the 411 per 100,000 statewide violent crime rate.
[in-text-ad]
Source: Public Domain / Wikimedia Commons
Kentucky: Fort Mitchell
> Population: 8,257
> 5-yr. Population change: +0.6% (state: +1.5%)
> Median home value: $272,200 (state: $141,000)
> Median household income: $67,745 (state: $50,589)
> 5-yr. avg. unemployment: 0.5% (state: 5.6%)
Fort Mitchell, Kentucky, is a small city located just across the Ohio River from Cincinnati. The city ranks as the best place to live in Kentucky partially because of its strong job market. An average of just 0.5% of the local labor force have been unemployed in the last five years, compared to a 5.6% five-year average jobless rate across Kentucky. Job availability in the area has reduced the likelihood of financial hardship. Only 5.5% of area residents live below the poverty line, compared to 17.3% of the total Kentucky population.
Quality of life in Fort Mitchell is also supported by relatively safe streets. There were only 85 violent crimes for every 100,000 people in the area in 2019, well below the comparable 217 per 100,000 state rate and 367 per 100,000 national rate.
 24/7 Wall St.
Louisiana: Harahan
> Population: 9,304
> 5-yr. Population change: -0.2% (state: +1.4%)
> Median home value: $240,300 (state: $163,100)
> Median household income: $66,741 (state: $49,469)
> 5-yr. avg. unemployment: 3.6% (state: 6.5%)
The New Orleans suburb of Harahan ranks as the best place to live in Louisiana. Residents have easy access to arts, culture, and entertainment in the nearby city without many of the drawbacks — namely, crime. There were 1,145 violent crimes for every 100,000 people in New Orleans in 2019. Meanwhile, the annual violent crime rate in Harahan was just 129 per 100,000 people.
Harahan is also an affordable city. The typical area home is worth $240,300, just 2.5 times more than the median household income in the area of $66,741. Meanwhile, across Louisiana and the United States, the typical home is worth 3.3 times and 3.5 times more than median household income, respectively. Harahan also boasts a strong job market, with a five-year average unemployment rate of just 3.6%, well below the comparable 6.5% rate across the state.
Source: Sean Pavone / Getty Images
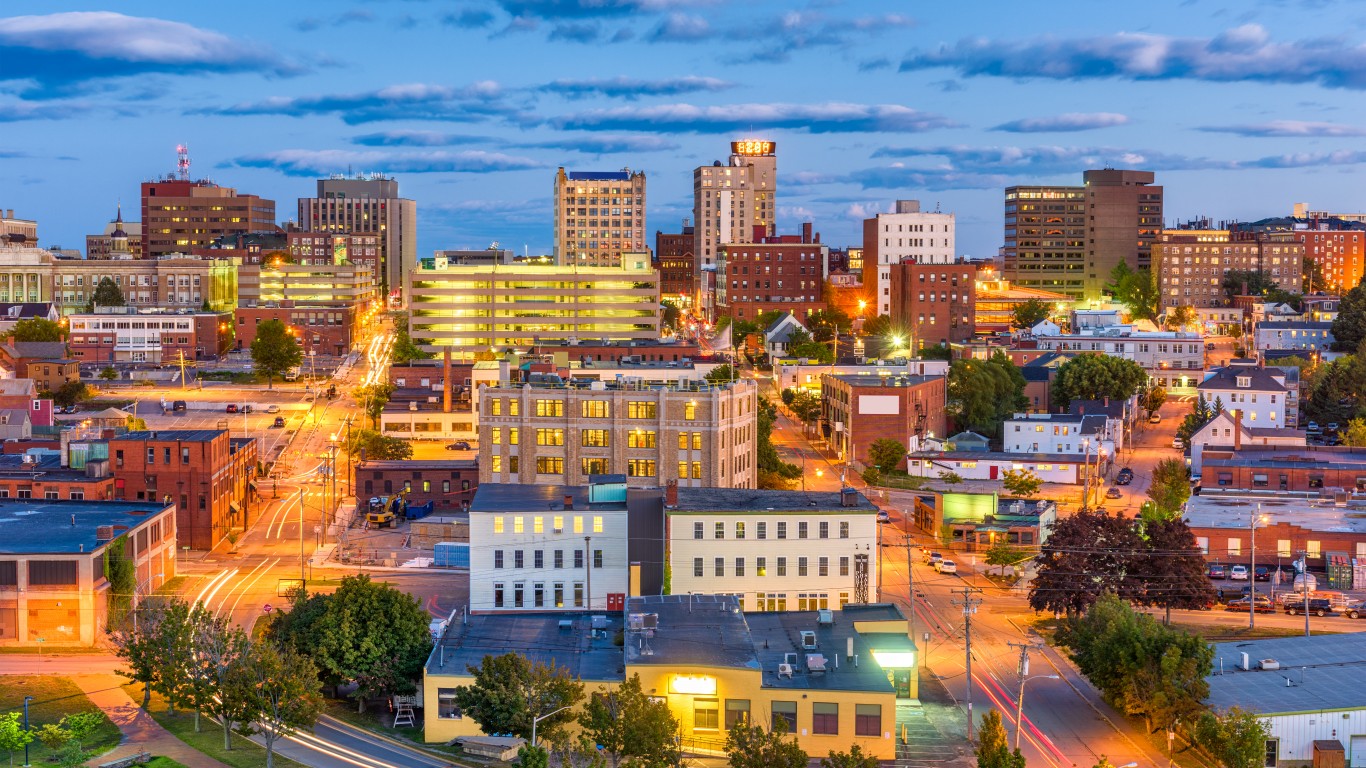
Maine: Portland
> Population: 66,595
> 5-yr. Population change: +0.4% (state: +0.5%)
> Median home value: $289,000 (state: $190,400)
> Median household income: $60,467 (state: $57,918)
> 5-yr. avg. unemployment: 2.8% (state: 4.1%)
Portland, the most populous city in Maine, also ranks as the best place to live in the state. Located in the southwestern part of the state, along the Atlantic Coast, Portland offers residents access to venues for outdoor activities such as parks and beaches, as well as venues for culture and entertainment, including museums, shops, microbreweries, restaurants, and spas.
Portland also boasts a strong job market. An average of only 2.8% of the local labor force were unemployed in the last five years, well below the 4.1% five-year average state jobless rate. Additionally, about 60% of the local population are working, compared to 50% of all Maine residents. Portland is also a pedestrian-friendly city. An estimated 13.1% of commuters walk to work, more than three times the 3.9% of workers in Maine who do.
[in-text-ad-2]

Maryland: Takoma Park
> Population: 17,672
> 5-yr. Population change: +2.1% (state: +2.2%)
> Median home value: $583,800 (state: $314,800)
> Median household income: $84,591 (state: $84,805)
> 5-yr. avg. unemployment: 5.6% (state: 5.1%)
The Washington D.C. suburb of Takoma Park ranks as the best place to live in Maryland. The area, known as “Azalea City” because of its many azalea bushes, is largely residential and boasts several parks with bike trails and play areas. According to a 2018 survey, over 90% of local residents rate quality of life in Takoma Park as either excellent or good.
In close proximity to the nation’s capital, Takoma Park residents have access to the area’s reliable public transportation that over a quarter of local commuters rely on each day.
Source: dougtone / Flickr
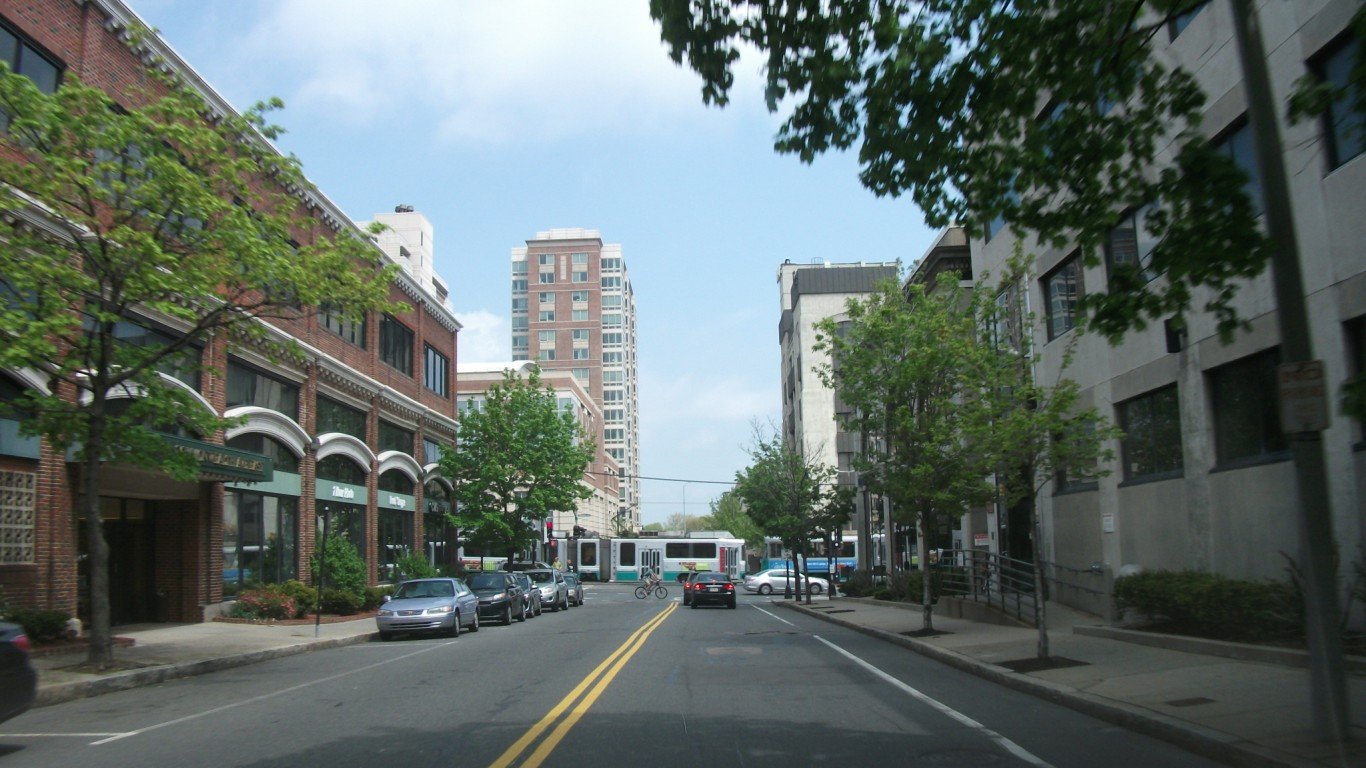
Massachusetts: Brookline
> Population: 59,180
> 5-yr. Population change: +0.3% (state: +2.9%)
> Median home value: $933,200 (state: $381,600)
> Median household income: $117,326 (state: $81,215)
> 5-yr. avg. unemployment: 2.8% (state: 4.8%)
The Boston suburb of Brookline ranks as the best place to live in Massachusetts largely because it is a safe place with a strong job market. There were only 97 violent crimes for every 100,000 people in Brookline in 2019, well below the statewide violent crime rate of 328 per 100,000. Additionally, over the last five years, an average of only 2.8% of the local labor force have been unemployed, well below the comparable 4.8% statewide average.
Brookline is also a pedestrian-friendly area with reliable public transportation. Over half of all commuters in the area either walk, bike, or take public transit to and from work — options many Americans in much of the country do not have.
[in-text-ad]
Source: Brian Sevald / iStock via Getty Images
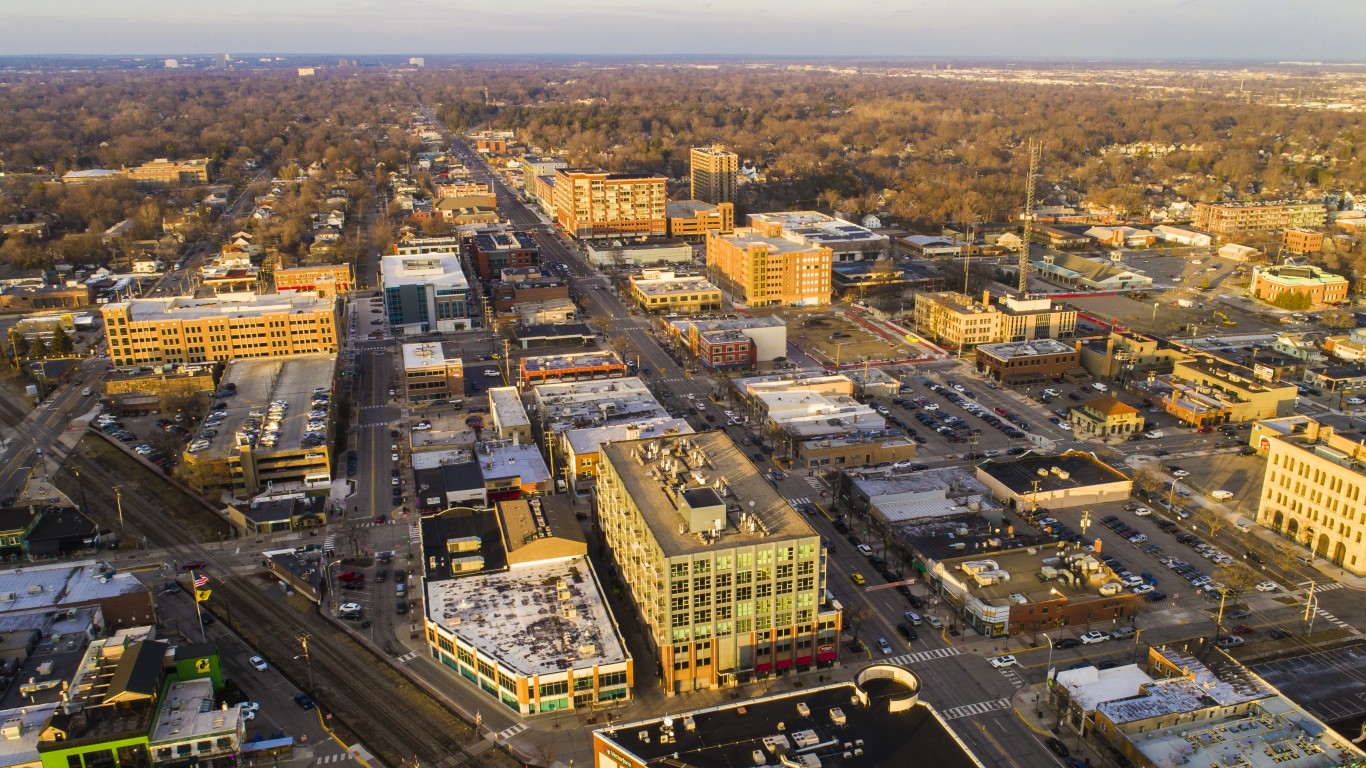
Michigan: Royal Oak
> Population: 59,195
> 5-yr. Population change: +1.4% (state: +0.8%)
> Median home value: $224,600 (state: $154,900)
> Median household income: $81,665 (state: $57,144)
> 5-yr. avg. unemployment: 3.2% (state: 5.9%)
The Detroit suburb of Royal Oak ranks as the best place to live in Michigan. The small city has its own downtown area with shopping, bars, restaurants, and entertainment. Royal Oak also has a farmers market every Saturday in a venue that doubles as an antique market on Sundays and also hosts weddings, food trucks, corporate events, annual festivals and performances.
Royal Oak is also a safe community. There were only 102 violent crimes reported for every 100,000 people in the city in 2019, a fraction of the 1,965 per 100,000 people in nearby Detroit and well below the state violent crime rate of 437 incidents per 100,000.
 24/7 Wall St.
Source: gurineb / iStock via Getty Images
Minnesota: Edina
> Population: 51,746
> 5-yr. Population change: +5.7% (state: +3.3%)
> Median home value: $476,300 (state: $223,900)
> Median household income: $104,244 (state: $71,306)
> 5-yr. avg. unemployment: 3.1% (state: 3.6%)
The Minneapolis suburb of Edina ranks as the best place to live in Minnesota. In addition to easy access to entertainment and culture in the Twin Cities, residents have easy access to parks, bike trails, shopping, restaurants, and public art in their hometown. Home to a relatively financially wealthy population, Edina’s poverty rate is 4.9% and its median annual household income is $104,244. This compares to Minnesota’s poverty rate of 9.7% and median household income of $71,306.
Edina is also a safe place to live, with a violent crime rate of 89 incidents per 100,000 people. Meanwhile, Minneapolis’ violent crime rate is 926 incidents per 100,000 and Minnesota’s is236 per 100,000.

Mississippi: Byram
> Population: 11,578
> 5-yr. Population change: -0.3% (state: +0.0%)
> Median home value: $141,700 (state: $119,000)
> Median household income: $66,641 (state: $45,081)
> 5-yr. avg. unemployment: 2.2% (state: 7.5%)
Byram is a suburb of Jackson, the capital of Mississippi, and ranks as the best place to live in the state. Economic conditions are far better in Byram than they are in much of Mississippi. The local five-year average unemployment rate of 2.2% is considerably lower than the comparable 7.5% statewide average. Additionally, the local poverty rate is just 5.7%, compared to the poverty rate of 20.3% across Mississippi.
Byram is also an affordable place to own a home. The typical area home is worth $141,700, just 2.1 times more than the median annual household income in the area of $66,641. Meanwhile, across the United States, the typical home is worth 3.5 times more than median household income.
[in-text-ad-2]
Source: Courtesy of the City of Ladue, Missouri
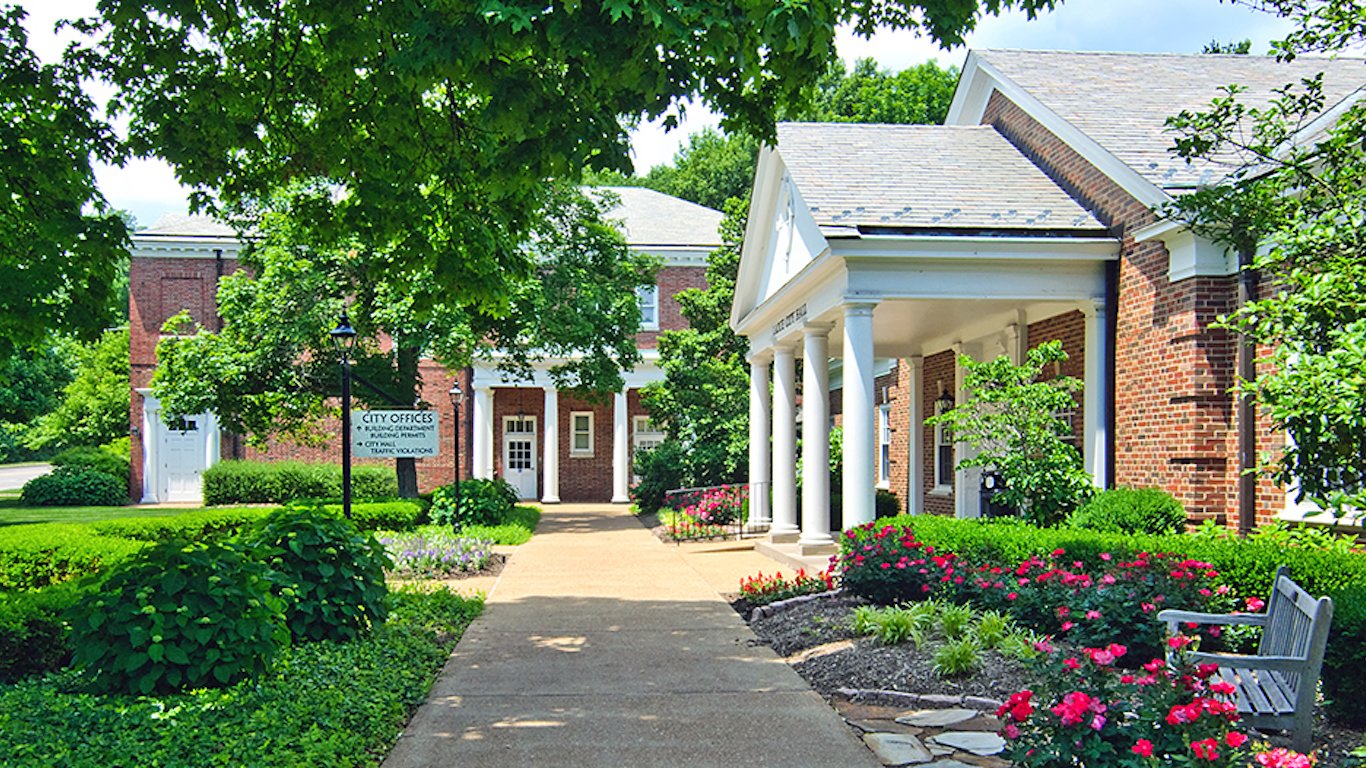
Missouri: Ladue
> Population: 8,601
> 5-yr. Population change: +0.6% (state: +1.3%)
> Median home value: $831,800 (state: $157,200)
> Median household income: $214,875 (state: $55,461)
> 5-yr. avg. unemployment: 1.3% (state: 4.6%)
The St. Louis suburb of Ladue ranks as the best place to live in Missouri. The city’s top ranking is due in part to its strong job market. An average of just 1.3% of the local labor force have been unemployed in the last five years, compared to the statewide five-year average jobless rate of 4.6%. Incomes are also high in the area. The typical Ladue household earns $214,875 a year, nearly four times more than the median of $55,461 statewide .
Ladue is also a relatively safe community, with an annual violent crime rate of 93 incidents per 100,000 people, a fraction of the state and national rates of 495 per 100,000 and 367 per 100,000, respectively.
Source: IslandLeigh / iStock via Getty Images
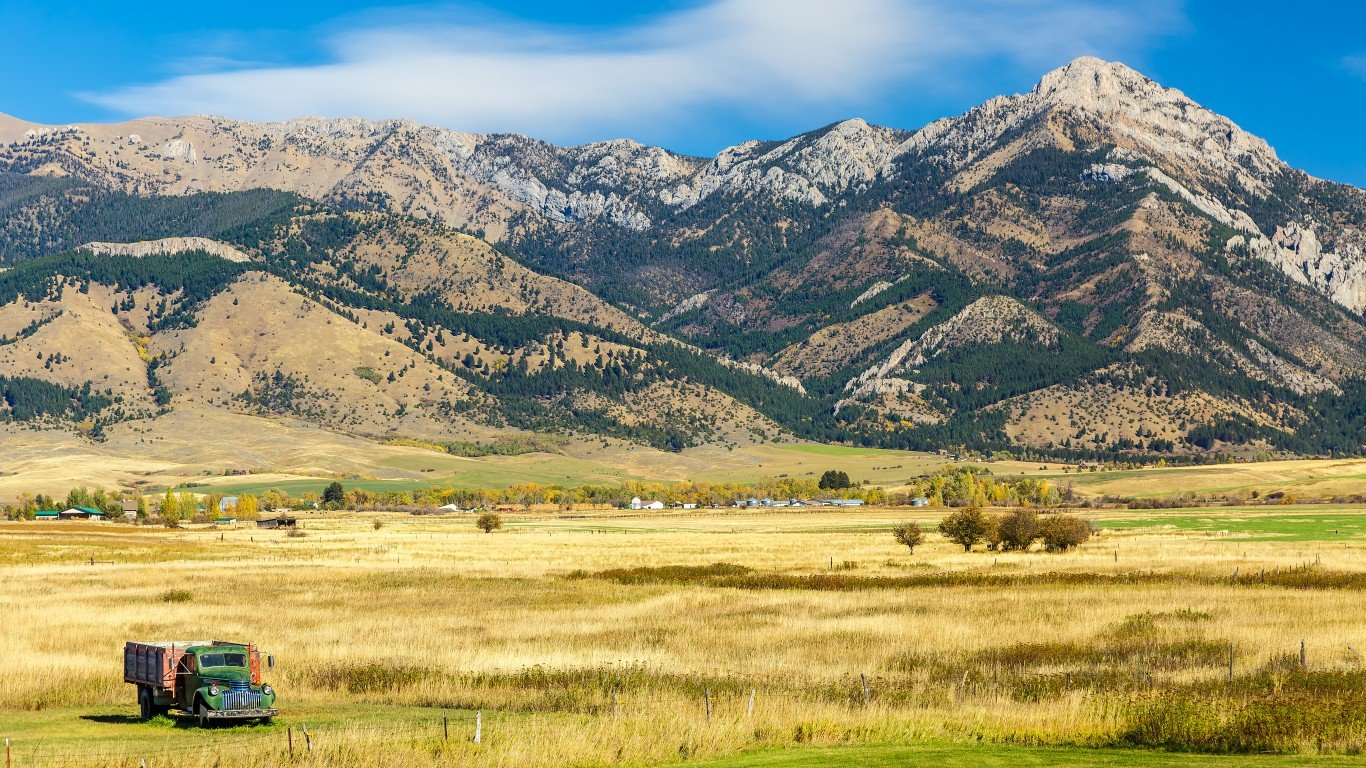
Montana: Belgrade
> Population: 8,685
> 5-yr. Population change: +13.9% (state: +4.4%)
> Median home value: $243,200 (state: $230,600)
> Median household income: $59,146 (state: $54,970)
> 5-yr. avg. unemployment: 2.9% (state: 4.0%)
Belgrade, Montana, is a small city about 10 miles northwest of Bozeman. It offers residents a smaller town alternative to the larger nearby city and ranks as the best place to live in the state. The city offers residents a farmers market, a brewery, a park, multiple restaurants, and several annual festivals. Unemployment in Belgrade is also low. An average of only 2.9% of the labor force have been out of work in the last five years, compared to the statewide 4.0% five-year average.
Like many desirable places to live in the United States, Belgrade is growing rapidly. In the last half decade, the number of people living in the city has climbed by 13.9%, well outpacing the comparable 4.4% statewide population growth.
[in-text-ad]
Source: Atomic Energy505 / Wikimedia Commons
Nebraska: Papillion
> Population: 20,423
> 5-yr. Population change: -3.2% (state: +3.2%)
> Median home value: $189,900 (state: $155,800)
> Median household income: $80,619 (state: $61,439)
> 5-yr. avg. unemployment: 2.5% (state: 3.3%)
Papillion, a city of about 20,000 residents in eastern Nebraska, ranks as the best place to live in the state. Located just outside of Omaha, residents have access to jobs in and around Nebraska’s most populous city. Papillion itself also has employment opportunities. Recently, Amazon announced plans for a 700,000 square foot fulfillment center in the area that will create an estimated 1,000 full time jobs. The city’s five-year average unemployment rate of 2.5% is already below both the state and national averages of 3.3% and 5.3%, respectively.
Papillion is also an affordable place to live. The typical area home is worth $189,900, just 2.4 times more than the median annual household income in the area of $80,619. Meanwhile, across the United States, the typical home is worth 3.5 times more than median household income.
Source: photoquest7 / Getty Images
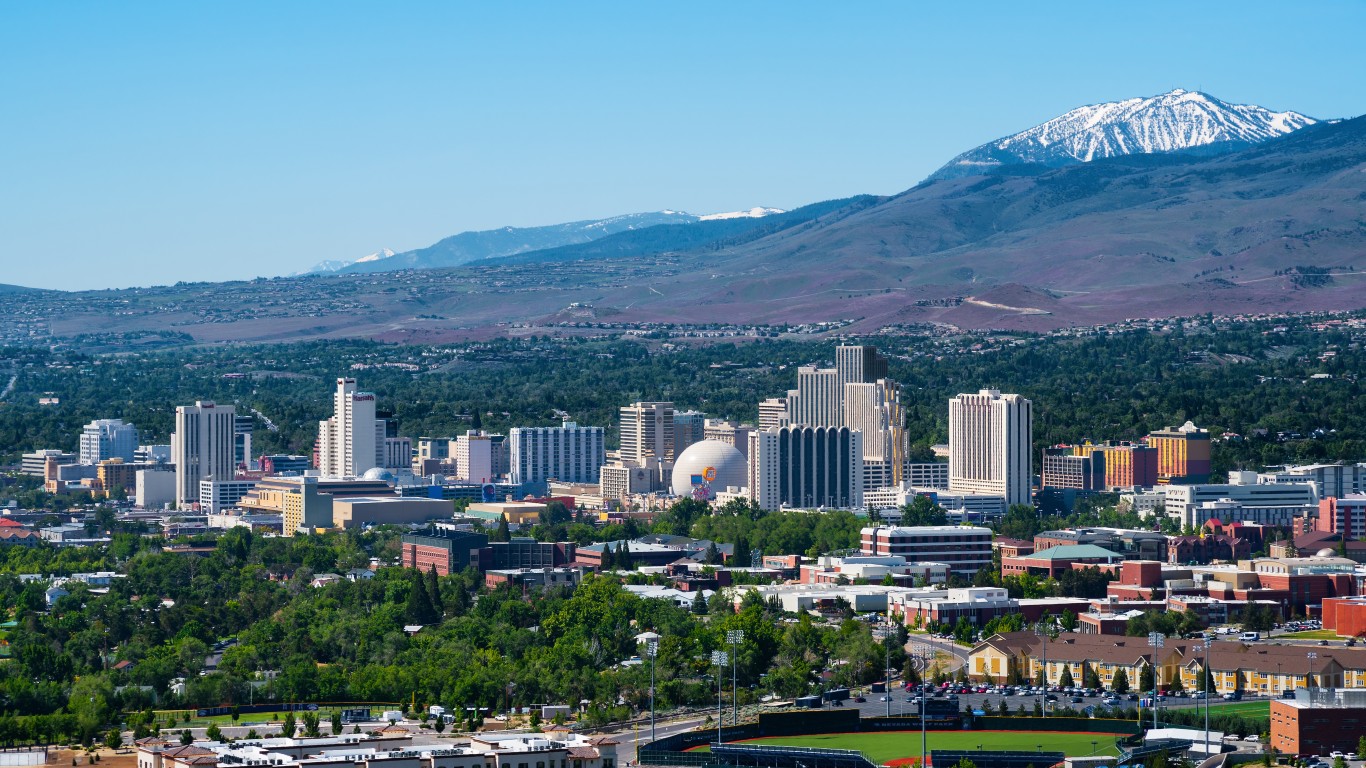
Nevada: Reno
> Population: 246,500
> 5-yr. Population change: +6.7% (state: +7.6%)
> Median home value: $335,000 (state: $267,900)
> Median household income: $58,790 (state: $60,365)
> 5-yr. avg. unemployment: 5.4% (state: 6.2%)
The western Nevada city of Reno ranks as the best place to live in the state. Reno has a higher concentration of cultural and entertainment amenities such as bars, restaurants, gyms, movie theaters, and theater companies compared to the state as a whole.
Reno residents also benefit from a favorable property tax code. Homeowners pay just 0.5% of their total home value in real estate taxes annually. Meanwhile, across Nevada, homeowners pay 1.0% and nationwide they pay 1.1% of their total home value in taxes each year.

Source: Sean Pavone / iStock via Getty Images
New Hampshire: Portsmouth
> Population: 21,775
> 5-yr. Population change: +1.9% (state: +2.0%)
> Median home value: $425,600 (state: $261,700)
> Median household income: $83,923 (state: $76,768)
> 5-yr. avg. unemployment: 2.1% (state: 3.6%)
Portsmouth, a city of about 22,000 located in the southeastern corner of New Hampshire near the Atlantic coast ranks as the best place to live in the state. The city offers residents easy access to a wide range of amenities that contribute to overall quality of life, including museums, beaches, breweries, parks, historic landmarks, golf courses, and shopping.
Economic conditions in Portsmouth are also favorable. The city’s five-year average unemployment rate of 2.1% is well below both the state and national averages of 3.6% and 5.3%, respectively. Additionally, the typical area household earns $83,923 a year, compared to the statewide median income of $76,768.
[in-text-ad-2]

Source: benedek / Getty Images
New Jersey: Hoboken
> Population: 53,193
> 5-yr. Population change: +2.3% (state: +0.0%)
> Median home value: $720,700 (state: $335,600)
> Median household income: $147,620 (state: $82,545)
> 5-yr. avg. unemployment: 3.0% (state: 5.5%)
Hoboken, a city of about 53,000 located directly across the Hudson River from Manhattan, ranks as the best place to live in New Jersey. In addition to views of the New York City skyline and access to entertainment, culture, and jobs in the largest U.S. city, Hoboken residents have a higher than average concentration of bars, restaurants, and gyms per capita.
Hohoken residents also benefit from strong economic conditions. The city’s five-year average unemployment rate of 3.0% is well below both the state and national averages of 5.5% and 5.3%, respectively. Additionally, the typical area household earns $147,620 a year, compared to the statewide median of $82,545.

Source: ivanastar / iStock via Getty Images
New Mexico: Corrales
> Population: 8,588
> 5-yr. Population change: +1.9% (state: +0.6%)
> Median home value: $447,600 (state: $171,400)
> Median household income: $85,580 (state: $49,754)
> 5-yr. avg. unemployment: 2.8% (state: 6.7%)
Corrales, New Mexico, is a small village of less than 10,000 residents located just north of Albuquerque. Steeped in history, the area shows evidence of human settlement dating as far back as 500 A.D. Today, socioeconomic conditions in the area make it the best place to live in New Mexico.
An average of only 2.8% of the local labor force have been unemployed in the last five years, less than half the comparable 6.7% statewide average. The local poverty rate of 4.9% is also nearly one-fifth New Mexico’s poverty rate of 19.1%. Corrales is also relatively safe. There were only 138 violent crimes for every 100,000 people in the area in 2019 compared to New Mexico’s violent crime rate of 832 per 100,000.
[in-text-ad]
Source: dszc / iStock via Getty Images
New York: Rye
> Population: 15,820
> 5-yr. Population change: -0.5% (state: -0.1%)
> Median home value: $1,392,100 (state: $313,700)
> Median household income: $192,688 (state: $68,486)
> 5-yr. avg. unemployment: 4.1% (state: 5.5%)
Rye, New York, a small city in Westchester County bordered by Long Island Sound near the Connecticut border, is the best place to live in the state. Residents benefit from reliable public transportation, including a commuter line into nearby Manhattan. Quality of life is further bolstered by a higher than average concentration of restaurants, gyms, golf courses, theater companies, and libraries in the surrounding area.
Rye is also one of the safest communities in the United States. There were only 6 violent crimes reported for every 100,000 people in the area in 2019, a fraction of the 571 violent crimes per 100,000 people in nearby New York City and well below the state violent crime rate of 359 per 100,000.

Source: Jon Bilous / iStock via Getty Images
North Carolina: Davidson
> Population: 12,735
> 5-yr. Population change: +10.8% (state: +5.3%)
> Median home value: $448,300 (state: $172,500)
> Median household income: $124,853 (state: $54,602)
> 5-yr. avg. unemployment: 2.8% (state: 5.6%)
Davidson, North Carolina, located along the shore of Lake Norman just north of Charlotte, ranks as the best place to live in the state. Davidson is both pedestrian and bicycle friendly with multiple public spaces and a goal of developing a park within a quarter of a mile of every household. The town has multiple annual events and, in addition to entertainment and cultural amenities in nearby Charlotte, boasts a high per capita concentration of restaurants, hotels, gyms, sports teams and clubs, and movie theaters.
Davidson is also a safe community. There were only 61 violent crimes for every 100,000 people in the area in 2019 compared to North Carolina’s violent crime rate of 372 per 100,000.

North Dakota: West Fargo
> Population: 35,397
> 5-yr. Population change: +24.8% (state: +7.3%)
> Median home value: $241,000 (state: $193,900)
> Median household income: $85,120 (state: $64,894)
> 5-yr. avg. unemployment: 1.5% (state: 2.8%)
West Fargo, North Dakota, ranks as the best place to live in the state. The local five-year average unemployment rate of 1.5% is nearly half the 2.8% statewide average. Local residents also have access to a greater than average concentration of bars, restaurants, hotels, gyms, theater companies, and movie theaters. West Fargo is also safe, with a violent crime rate of 144 incidents per 100,000 people, below the rate across North Dakota of 285 per 100,000.
As is often the case in communities with such favorable conditions, West Fargo is growing rapidly. One of the fastest growing cities in North Dakota, the town’s population expanded by 24.8% over the last five years, more than triple North Dakota’s 7.3% five-year population growth.
[in-text-ad-2]

Ohio: Bay Village
> Population: 15,325
> 5-yr. Population change: -1.2% (state: +0.8%)
> Median home value: $247,900 (state: $145,700)
> Median household income: $103,582 (state: $56,602)
> 5-yr. avg. unemployment: 1.3% (state: 5.3%)
The wealthy Cleveland suburb of Bay Village, situated on the shore of Lake Erie, ranks as the best place to live in Ohio. Quality of life in the area is improved/enhanced in part by four parks, several community centers and facilities, including a pool, and trails used for biking, hiking, and jogging. Bay Village and the surrounding county also have a higher than average per capita concentration of bars, restaurants, sports clubs, museums, and movie theaters.
Bay Village is also safe, with a violent crime rate of 26 incidents per 100,000 people, below the 293 per 100,000 rate across Ohio and well below the 1,517 per 100,000 rate in nearby Cleveland.

Source: wweagle / E+ via Getty Images
Oklahoma: Bixby
> Population: 26,541
> 5-yr. Population change: +18.1% (state: +3.0%)
> Median home value: $223,900 (state: $136,800)
> Median household income: $83,119 (state: $52,919)
> 5-yr. avg. unemployment: 2.9% (state: 5.1%)
Bixby, Oklahoma, located just south of Tulsa, ranks as the best place to live in the state. Quality of life in the area is supported by a network of trails, several parks, a playground, and a high per capita concentration of restaurants, bars, recreation centers and gyms, sports teams and clubs, and movie theaters. The local job market is also strong, with a five-year average unemployment rate of just 2.9%, well below the comparable 5.1% average statewide.
As is often the case in communities with such favorable conditions, Bixby is growing rapidly. The local population expanded by 18.1% over the last five years, more than six times Oklahoma’s 3.0% five-year population growth.
[in-text-ad]
Source: Public Domain / Wikimedia Commons
Oregon: Sherwood
> Population: 19,625
> 5-yr. Population change: +5.0% (state: +5.9%)
> Median home value: $405,900 (state: $312,200)
> Median household income: $103,512 (state: $62,818)
> 5-yr. avg. unemployment: 1.8% (state: 5.5%)
Sherwood, Oregon, located about 15 miles southwest of downtown Portland, ranks as the best place to live in the state. More affordable than much of the rest of the state, Sherwood’s median home value of $405,900 is 3.9 times higher than the local median household income of $103,512. Meanwhile, across Oregon, the typical home is worth five times more than what the typical household earns.
Residents of Sherwood are far less likely to be unemployed or struggle financially than the typical Oregon resident. Over the last five years, an average of just 1.8% of the local labor force have been unemployed, compared to an average of 5.5% statewide. Additionally, the poverty rate in Sherwood of 2.9% is a fraction of Oregon’s 13.2% poverty rate.
Source: Jesse Beam / Getty Images
Pennsylvania: Wyomissing
> Population: 10,473
> 5-yr. Population change: +0.1% (state: +0.3%)
> Median home value: $245,600 (state: $180,200)
> Median household income: $81,178 (state: $61,744)
> 5-yr. avg. unemployment: 4.3% (state: 5.3%)
Wyomissing, Pennsylvania, ranks as the best place to live in the Keystone State. The eastern Pennsylvania community has several public parks and facilities that include a pool, tennis courts, playgrounds, pavilions, and sports fields.
Residents of Wyomissing are also more likely than most Pennsylvania residents to be financially secure. The typical area household earns $81,178 a year, and only 6.1% of the local population live below the poverty line. Meanwhile, across Pennsylvania, the typical household earns $61,744 a year, and the poverty rate is 12.4%. The area’s financial stability is attributable in part to a strong job market. An average of only 4.3% of the labor force have been unemployed in the last five years, a full percentage point below the comparable state average.

Source: Joshua McDonough / Getty Images
Rhode Island: Newport
> Population: 24,663
> 5-yr. Population change: +0.3% (state: +0.4%)
> Median home value: $448,800 (state: $261,900)
> Median household income: $67,102 (state: $67,167)
> 5-yr. avg. unemployment: 5.2% (state: 5.4%)
Of the 14 cities and towns in Rhode Island with sufficient data, the coastal city of Newport ranks as the best place to live. Newport is a pedestrian-friendly city, and nearly 15% of local commuters walk to work, compared to just 3.4% of commuters across Rhode Island. Quality of life in Newport is also improved by a high per capita concentration of restaurants, bars, marinas, golf courses, museums, and movie theaters.
The city’s desirability as a place to live is evidenced by high real estate prices. The typical area home is worth $448,800, well above the median home value of $261,900 across Rhode Island.
[in-text-ad-2]
Source: PeterPhoto / Getty Images
South Carolina: Mount Pleasant
> Population: 86,982
> 5-yr. Population change: +20.2% (state: +6.2%)
> Median home value: $461,000 (state: $162,300)
> Median household income: $103,232 (state: $53,199)
> 5-yr. avg. unemployment: 2.1% (state: 5.8%)
The Charleston suburb of Mount Pleasant ranks as the best place to live in South Carolina. Mount Pleasant is a relatively safe community. The local violent crime rate of 114 incidents reported for every 100,000 people is well below the 511 per 100,000 rate across South Carolina and the 373 per 100,000 rate in nearby Charleston.
Residents of Mount Pleasant and the surrounding county benefit from a far higher than average concentration of places like bars, restaurants, hotels, gyms, marinas, nature parks, sports teams and clubs, and theater companies. Like many communities with similarly high quality of life, Mount Pleasant is growing rapidly. Over the last five years, the local population has grown by 20.2%, more than three times faster than South Carolina’s 6.2% growth rate over the same period.
Source: Jacob Boomsma / Getty Images
South Dakota: Brandon
> Population: 9,934
> 5-yr. Population change: +6.2% (state: +4.3%)
> Median home value: $225,200 (state: $167,100)
> Median household income: $87,250 (state: $58,275)
> 5-yr. avg. unemployment: 1.6% (state: 3.4%)
Of the 14 cities and towns in South Dakota with sufficient data, the city of Brandon, located just outside of Sioux Falls, ranks as the best place to live. An average of only 1.6% of the labor force have been unemployed in the last five years, less than half the comparable state average of 3.4%. Also, the area’s median household income stands at $87,250 a year. Meanwhile, the median household income in South Dakota is $58,275, and the state poverty rate stands at 13.1%.
Brandon is also a safe community. The local violent crime rate of 68 incidents reported for every 100,000 people is well below the 399 per 100,000 rate across South Dakota.
[in-text-ad]
Source: Concord715 / Wikimedia Commons
Tennessee: Brentwood
> Population: 42,407
> 5-yr. Population change: +8.6% (state: +4.0%)
> Median home value: $655,400 (state: $167,200)
> Median household income: $168,688 (state: $53,320)
> 5-yr. avg. unemployment: 2.6% (state: 5.3%)
The Nashville suburb of Brentwood ranks as the best place to live in Tennessee. Local residents benefit from 14 parks and other public amenities such as pedestrian and bicycle trails. The city and surrounding county also have a relatively high per capita concentration of restaurants, hotels, gyms, golf courses, and gyms. Brentwood is also a safe place. The local violent crime rate of 88 reported incidents for every 100,000 people is well below the comparable 595 per 100,000 rate across Tennessee.
The area’s high quality of life is also partially due to a strong job market. An average of only 2.6% of the labor force have been unemployed in the last five years, less than half the comparable state average of 5.3%.

Source: Ansem27 / Wikimedia Commons
Texas: Highland Park
> Population: 9,168
> 5-yr. Population change: +4.2% (state: +8.3%)
> Median home value: $1,508,900 (state: $172,500)
> Median household income: $211,136 (state: $61,874)
> 5-yr. avg. unemployment: 1.4% (state: 5.1%)
Highland Park, an affluent town just north of Dallas, ranks as the best place to live in Texas. Favorable economic conditions, such as low unemployment and poverty, contribute to overall quality of life in the area. An average of only 1.4% of the labor force have been unemployed in the last five years, and just 2.3% of the local population live below the poverty line. Meanwhile, Texas’ five-year jobless rate stands at 5.1%, and 14.7% of the state population live below the poverty line.
Highland Park is also a safe place. The local violent crime rate of 97 reported incidents for every 100,000 people is well below the 419 per 100,000 rate across Texas.

Source: Jeremy Taylor / Wikimedia Commons
Utah: South Jordan
> Population: 71,198
> 5-yr. Population change: +26.0% (state: +8.4%)
> Median home value: $405,400 (state: $279,100)
> Median household income: $104,597 (state: $71,621)
> 5-yr. avg. unemployment: 1.6% (state: 3.6%)
South Jordan, a city of over 71,000 located just south of Salt Lake City, ranks as the best place to live in Utah. Quality of life in the area is improved by safe streets, as the local violent crime rate of 94 incidents per 100,000 people is the lowest in Salt Lake County and less than half the 236 per 100,000 rate across the state. South Jordan also has a strong job market. An average of only 1.6% of the labor force have been unemployed in the last five years, less than half the comparable state average of 3.6%.
Like many communities with similarly strong socioeconomic measures, South Jordan is growing rapidly. Over the last five years, the local population has grown by 26.0%, more than three times faster than Utah’s 8.4% growth rate over the same period.
[in-text-ad-2]
Source: vermontalm / iStock via Getty Images
Vermont: South Burlington
> Population: 19,162
> 5-yr. Population change: +4.3% (state: -0.3%)
> Median home value: $307,500 (state: $227,700)
> Median household income: $73,065 (state: $61,973)
> 5-yr. avg. unemployment: 3.7% (state: 3.6%)
Of the six cities and towns in Vermont with sufficient data, the city of South Burlington, located on the shore of Lake Champlain, ranks as the best place to live. Multiple parks, public spaces, and a 24 mile path for cyclists and pedestrians contribute to quality of life in the city. Residents of South Burlington and surrounding Chittenden County also have access to a higher than average per capita concentration of restaurants, bars, hotels, gyms, marinas, golf courses, museums, theater companies, and movie theaters.
South Burlington is also the safest city, with available data, in Vermont. According to the FBI, there were 112 violent crimes for every 100,000 people in the city in 2019, compared to 202 for every 100,000 across Vermont.

Virginia: Vienna
> Population: 16,489
> 5-yr. Population change: +2.0% (state: +3.3%)
> Median home value: $743,500 (state: $273,100)
> Median household income: $161,196 (state: $74,222)
> 5-yr. avg. unemployment: 2.4% (state: 4.6%)
The Washington D.C. suburb of Vienna ranks as the best place to live in Virginia. The town, which spans 4.4 square miles in Fairfax County, has 12 parks and offers access to the Washington & Old Dominion Railroad Regional Trail, which offers joggers, cyclists, and pedestrians a 45 mile path from the nation’s capital to the Virginia countryside.
Underpinned by a low unemployment rate, Vienna has a relatively financially secure population. The typical area household earns $161,196 a year, more than double the $74,222 median across Virginia. Additionally, only 2.8% of the local population live below the poverty line, compared to the 10.6% poverty rate in Virginia.
[in-text-ad]
Source: SEASTOCK / iStock via Getty Images
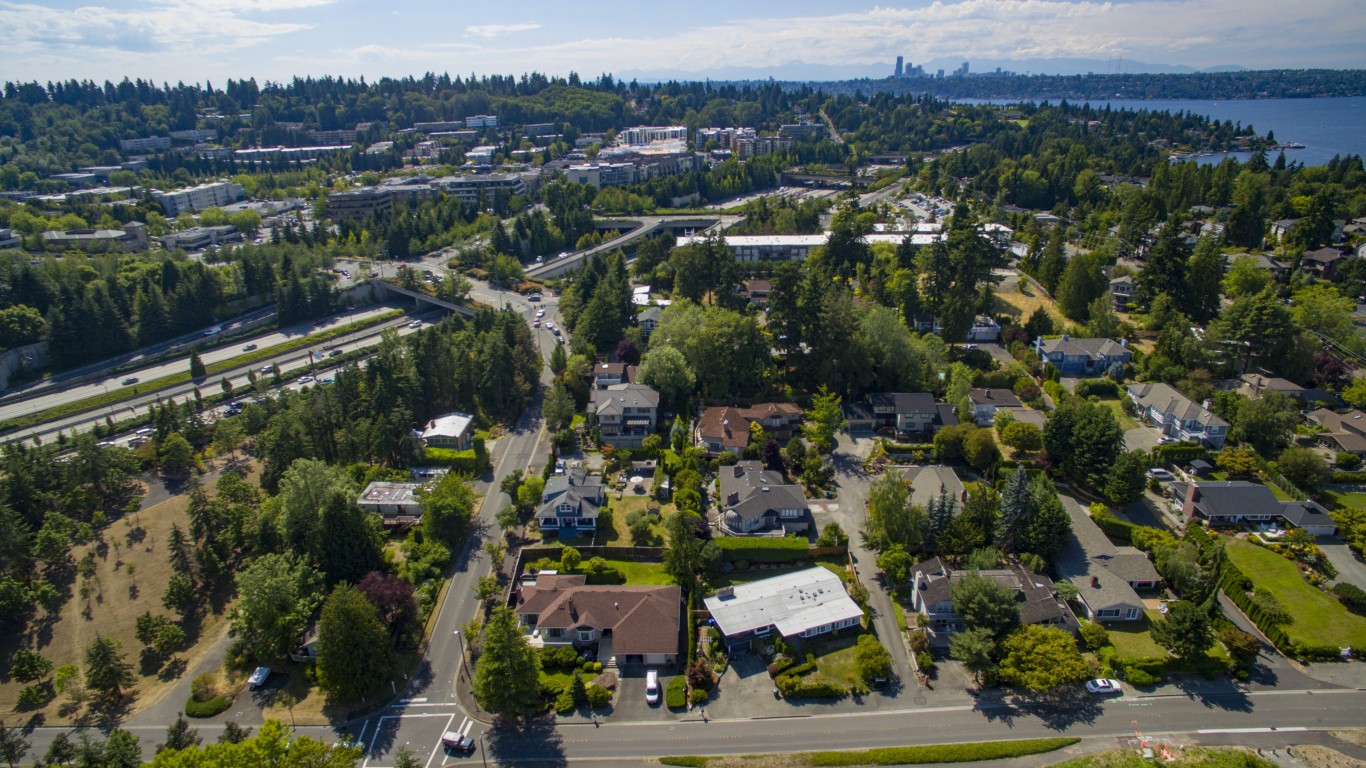
Washington: Mercer Island
> Population: 25,675
> 5-yr. Population change: +8.6% (state: +7.3%)
> Median home value: $1,218,200 (state: $339,000)
> Median household income: $147,566 (state: $73,775)
> 5-yr. avg. unemployment: 4.0% (state: 5.0%)
Mercer Island, which is located in Lake Washington between the city of Seattle and Bellevue, ranks as the best place to live in Washington state. The city has a farmers market on Sunday mornings from June through September, over a dozen parks with picnic areas, multi-use trails, tennis courts, sports fields, playgrounds, and BBQ areas. Residents of Mercer Island and the surrounding county also benefit from a higher than average concentration of places like bars, restaurants, gyms, sports teams and clubs, museums, movie theaters and theater companies.
Mercer Island is also a safe place. The local violent crime rate of 30 reported incidents for every 100,000 people is well below the comparable 294 per 100,000 rate across Washington.

Source: Courtesy of Weirton, West Virginia - City Government via Facebook
West Virginia: Weirton
> Population: 18,670
> 5-yr. Population change: -4.4% (state: -2.0%)
> Median home value: $94,800 (state: $119,600)
> Median household income: $49,496 (state: $46,711)
> 5-yr. avg. unemployment: 6.6% (state: 6.5%)
Weirton is a small city in northern West Virginia’s panhandle, bordered by Pennsylvania and Ohio. It ranks as the best place to live in the state partially due to its affordability. The typical home in the area is worth $94,800, just 1.9 times more than the local median annual household income of $49,496. Meanwhile, the typical West Virginia home is worth 2.6 times what the typical household earns.
Weirton is also the safest city in West Virginia with available data. According to the FBI, there were 60 violent crimes for every 100,000 people in the city in 2019, compared to 317 for every 100,000 across West Virginia.

Source: UWMadison / iStock via Getty Images
Wisconsin: Middleton
> Population: 19,487
> 5-yr. Population change: +7.2% (state: +1.2%)
> Median home value: $336,900 (state: $180,600)
> Median household income: $76,011 (state: $61,747)
> 5-yr. avg. unemployment: 2.5% (state: 3.6%)
The Madison suburb of Middleton ranks as the best place to live in Wisconsin. In addition to access to culture and entertainment in the nearby state capital, Middleton itself has over 70 restaurants, shopping, a brewery, and the National Mustard Museum. The city also has a bike path, cross-country ski trails, and several parks.
With a lower than average unemployment rate, Middleton also has a relatively financially secure population. The typical area household earns $76,011 a year, well above the $61,747 median household income across Wisconsin. Additionally, only 5.2% of the local population live below the poverty line, compared to the 11.3% poverty rate in Wisconsin.
[in-text-ad-2]

Source: Davel5957 / Getty Images
Wyoming: Cheyenne
> Population: 63,607
> 5-yr. Population change: +3.5% (state: +1.0%)
> Median home value: $214,300 (state: $220,500)
> Median household income: $64,598 (state: $64,049)
> 5-yr. avg. unemployment: 5.4% (state: 4.5%)
Of the dozen cities in Wyoming with sufficient data, Cheyenne, the state’s capital city, also ranks as the best place to live in Wyoming. Quality of life in the city is supported by a high concentration of businesses, and entertainment and cultural attractions. Cheyenne has a higher than average per capita concentration of places like hotels, bars, golf courses, and museums.
Cheyenne is also something of a hub for outdoor recreation. Area parks offer venues for a range of activities, including archery and ATV riding. Residents also have easy access to areas for hiking, mountain biking, camping, boating, rock climbing, cross country skiing, fishing, and horseback riding.
Methodology
To identify the worst cities to live in, 24/7 Wall St. created a weighted index of 24 measures in four categories: affordability, economy, quality of life, and community.
1.) The affordability category consists of two measures:
- The ratio of median home value to median household income, at one-fourth weight.
- Median property taxes paid as a percentage of median home value, at one-fourth weight.
2.) The economy category consists of four measures:
- Median home value, at full weight.
- Employment growth from the 2011-2015 period and the 2015-2019 period, at one-half weight.
- The ratio of the number of employed workers to the total population, at one-half weight.
- The unemployment rate, at full weight.
3.) The quality of life category consists of seven measures:
- The poverty rate, at full weight.
- The share of the population in urban census tracts at least 1 mile from a grocery store and in rural census tracts at least 10 miles from a grocery store, a measure of poor food access, at one-half weight.
- The distance from the city center to the nearest hospital, at one-fourth weight.
- The percentage of patients discharged from acute care hospitals who are readmitted to the hospital within 30 days, at one-fourth weight.
- The percentage of heart attack, coronary artery bypass grafting (CABG) surgery, chronic obstructive pulmonary disease (COPD), heart failure, pneumonia, and stroke patients who pass away within 30 days of treatment at a hospital, at full weight.
- The number of hospital admissions for conditions that could be treated in an outpatient setting per 1,000 Medicare enrollees — an indication of poor outpatient care and overuse of hospitals — at one-half weight.
- The number of drug-related fatalities per 100,000 residents, at one-half weight.
4.) The community category consists of 11 measures:
- The percentage of workers 16 and over commuting by public transit, walking, or other non-car means, at full weight.
- The average travel time to work, at one-fourth weight.
- The number of violent crimes — homicide, rape, robbery, and aggravated assault — reported per 100,000 residents, at full weight.
- The number of property crimes — burglary, larceny, motor vehicle theft, and arson — reported per 100,000 residents, at full weight.
- The number of movie theaters per 100,000 residents, at one-twentieth weight.
- The number of libraries and archives per 100,000 residents, at one-twentieth weight.
- The number of theater companies and dinner theaters per 100,000 residents, at one-twentieth weight.
- The number of museums per 100,000 residents, at one-twentieth weight.
- The number of nature parks and similar institutions per 100,000 residents, at one-twentieth weight.
- The number of alcoholic drinking places per 100,000 residents, at one-twentieth weight.
- The number of restaurants and other eating places per 100,000 residents, at one-twentieth weight.
Data on population, employment, unemployment, median home value, median household income, median property taxes paid, commuter characteristics, average travel time to work, and poverty came from the U.S. Census Bureau’s American Community Survey and are five-year estimates for the period 2015 to 2019. To calculate employment growth we used five-year employment estimates for 2015-2019 and 2011-2015.
Data on the share of the population in urban census tracts at least 1 mile from a grocery store and in rural census tracts at least 10 miles from a grocery store, a measure of poor food access, came from the U.S. Department of Agriculture’s 2020 update to the Food Access Research Atlas and is at the county level.
Data on hospital locations came from the Centers for Medicare & Medicaid Services. Data on 30-day readmission rates and 30-day mortality rates also came from the CMS and are for the period July 2016 to June 2019. Data was aggregated to the city level for cities with at least one hospital and to the county level for cities with no hospitals. Data on the number of drug-related deaths per 100,000 residents per year for the period 2017 to 2019 is from the Centers for Disease Control and Prevention and is at the county level. Data on preventable hospitalizations per 1,000 Medicare enrollees came from the 2021 County Health Rankings and Roadmaps program, a collaboration between the Robert Wood Johnson Foundation and University of Wisconsin Population Health Institute, and is at the county level.
Data on the number of violent crimes and property crimes reported in 2019 per 100,000 residents came from the FBI’s Uniform Crime Reporting Program.
County-level data on the number of movie theaters, libraries and archives, theater companies and dinner theaters, museums, nature parks and other similar institutions, alcoholic beverage drinking places, and restaurants and other eating places came from the Census Bureau’s 2019 County Business Patterns series.
To avoid geographic clustering, we only considered the lowest-ranking city in a given county. Our list includes cities, towns, villages, boroughs, and census-designated places. We did not include places with fewer than 8,000 residents in our analysis. We also excluded places with more than 20% enrollment in college and graduate school as well as places where more than 20% of the population are employed in the armed forces, based on five-year data from the 2019 ACS, as such demographics may need other considerations.
Sponsored: Want to Retire Early? Here’s a Great First Step
Want retirement to come a few years earlier than you’d planned? Or are you ready to retire now, but want an extra set of eyes on your finances?
Now you can speak with up to 3 financial experts in your area for FREE. By simply clicking here you can begin to match with financial professionals who can help you build your plan to retire early. And the best part? The first conversation with them is free.
Click here to match with up to 3 financial pros who would be excited to help you make financial decisions.
Thank you for reading! Have some feedback for us?
Contact the 24/7 Wall St. editorial team.
Editors' Picks