The U.S. population grew by just 0.35% between July 2019 and July 2020, the smallest annual growth rate in well over a century. Driven in part by restrictions on immigration and a declining birth rate, slow population growth may have profound and far reaching consequences — including reduced economic growth, stagnanting home values, and fewer workers to support an aging population.
This trend is by no means unique to last year. And while the national population growth has been slow but positive, over the past decade, cities and towns across the country have reported rapid population decline.
Using population data from the U.S. Census Bureau, 24/7 Wall St. identified the fastest shrinking place in every state. Among the cities, towns, villages, and unincorporated communities on this list, populations have contracted anywhere from 2.5% to over 40% since 2010, depending on the state.
While declining immigration and falling birth rates largely explain the national slowdown in population growth, in many of the places on this list these factors are compounded by residents moving out. An estimated 40 million Americans move each year, and one of the most common reasons is for improved economic opportunity. In the vast majority of the places on this list, incomes are lower than they are across the state as a whole. Most of these areas also have higher than average unemployment. This is the richest town in every state.
Several of the places that rank on this list are military bases. These areas are subject to different factors than non-military cities and towns. Still, when servicemen and servicewomen are transferred away from these places, it has an impact on the local economy. Here is a look at America’s military cities.
Click here to see the fastest shrinking place in every state.
Click here to see our detailed methodology.

Source: TennesseePhotographer / iStock via Getty Images
Alabama: Forestdale
> 2010-2019 population change: -17.5% (state: +3.5%)
> Median household income: $59,041 (state: $50,536)
> 5-yr. avg. unemployment: 9.3% (state: 5.9%)
> Total population: 8,924 in 2019, 10,811 in 2010
[in-text-ad]

Source: wanderluster / iStock Unreleased via Getty Images
Alaska: Big Lake
> 2010-2019 population change: -17.6% (state: +6.6%)
> Median household income: $54,324 (state: $77,640)
> 5-yr. avg. unemployment: 12.6% (state: 7.2%)
> Total population: 2,678 in 2019, 3,250 in 2010
Source: Norm Lane / iStock via Getty Images
Arizona: San Carlos
> 2010-2019 population change: -19.4% (state: +12.9%)
> Median household income: $23,750 (state: $58,945)
> 5-yr. avg. unemployment: 30.1% (state: 5.9%)
> Total population: 4,451 in 2019, 5,523 in 2010
Source: Brandonrush / Wikimedia Commons
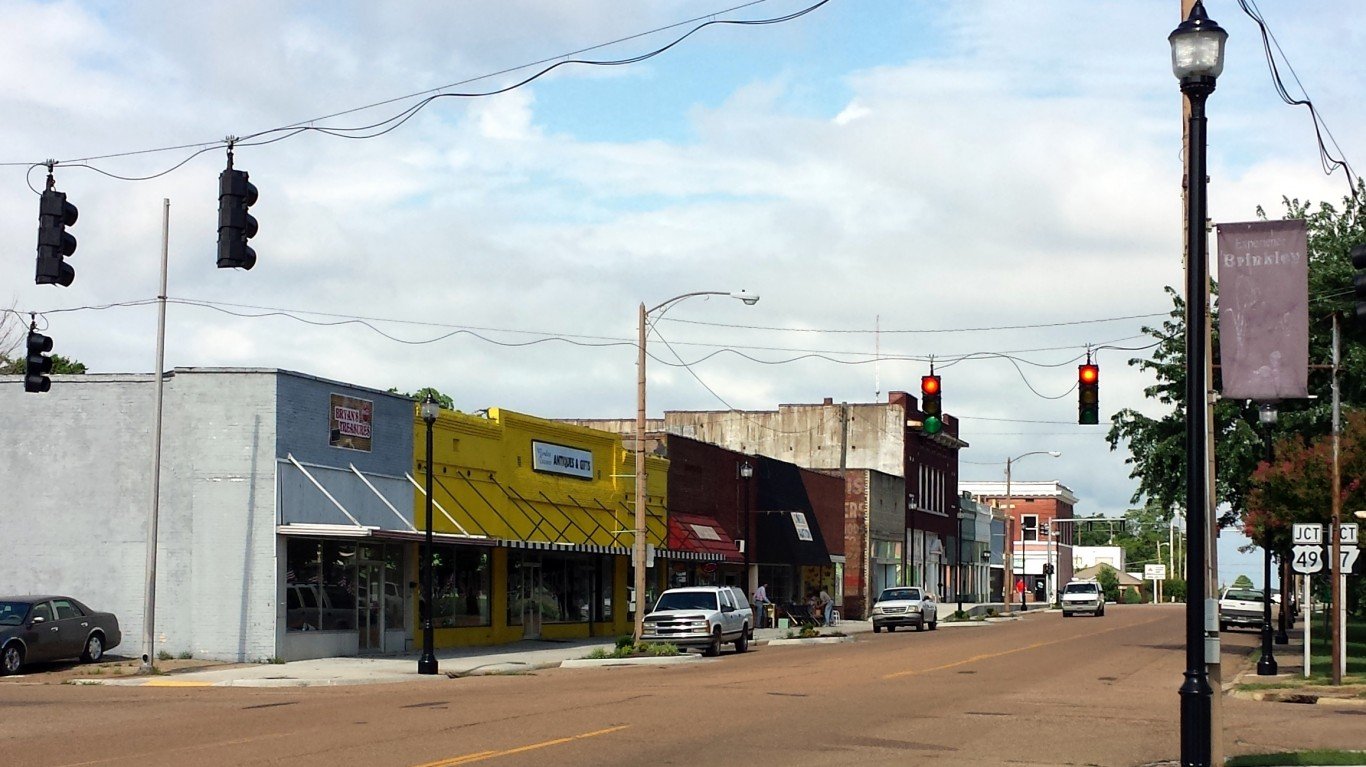
Arkansas: Brinkley
> 2010-2019 population change: -17.5% (state: +4.4%)
> Median household income: $36,528 (state: $47,597)
> 5-yr. avg. unemployment: 9.6% (state: 5.1%)
> Total population: 2,742 in 2019, 3,324 in 2010
[in-text-ad-2]

California: Willowbrook
> 2010-2019 population change: -35.1% (state: +7.2%)
> Median household income: $43,781 (state: $75,235)
> 5-yr. avg. unemployment: 10.8% (state: 6.1%)
> Total population: 22,811 in 2019, 35,174 in 2010

Source: greeleygov / Flickr
Colorado: Lincoln Park
> 2010-2019 population change: -21.9% (state: +14.8%)
> Median household income: $50,042 (state: $72,331)
> 5-yr. avg. unemployment: 4.5% (state: 4.3%)
> Total population: 3,283 in 2019, 4,204 in 2010
[in-text-ad]

Connecticut: Putnam
> 2010-2019 population change: -11.9% (state: +0.8%)
> Median household income: $56,492 (state: $78,444)
> 5-yr. avg. unemployment: 3.3% (state: 6.0%)
> Total population: 6,615 in 2019, 7,505 in 2010
 24/7 Wall St.
Source: Courtesy of Camerafiend under the Creative Commons Attribution-Share Alike 4.0 International license (https://creativecommons.org/licenses/by-sa/4.0/deed.en) / Wikimedia Commons
Delaware: Glasgow
> 2010-2019 population change: -8.2% (state: +8.6%)
> Median household income: $93,209 (state: $68,287)
> 5-yr. avg. unemployment: 5.8% (state: 5.5%)
> Total population: 14,359 in 2019, 15,648 in 2010

Source: Ruth Peterkin / iStock via Getty Images
Florida: Siesta Key
> 2010-2019 population change: -15.2% (state: +12.9%)
> Median household income: $102,143 (state: $55,660)
> 5-yr. avg. unemployment: 2.7% (state: 5.6%)
> Total population: 5,573 in 2019, 6,573 in 2010
[in-text-ad-2]

Georgia: Druid Hills
> 2010-2019 population change: -42.7% (state: +9.9%)
> Median household income: $129,740 (state: $58,700)
> 5-yr. avg. unemployment: 1.4% (state: 5.7%)
> Total population: 8,365 in 2019, 14,603 in 2010

Source: scotnelson / Flickr
Hawaii: Waimanalo Beach
> 2010-2019 population change: -11.9% (state: +6.6%)
> Median household income: $85,515 (state: $81,275)
> 5-yr. avg. unemployment: 5.8% (state: 4.3%)
> Total population: 4,076 in 2019, 4,629 in 2010
[in-text-ad]

Idaho: Mountain Home Air Force Base
> 2010-2019 population change: -16.7% (state: +12.5%)
> Median household income: $44,007 (state: $55,785)
> 5-yr. avg. unemployment: 10.6% (state: 4.3%)
> Total population: 3,009 in 2019, 3,613 in 2010

Source: hickoryhardscrabble / Flickr
Illinois: Cairo
> 2010-2019 population change: -28.5% (state: +0.2%)
> Median household income: $26,439 (state: $65,886)
> 5-yr. avg. unemployment: 7.0% (state: 5.9%)
> Total population: 2,120 in 2019, 2,963 in 2010

Source: Courtesy of James Brosher under the Creative Commons Attribution-Share Alike 4.0 International license (https://creativecommons.org/licenses/by-sa/4.0/deed.en) / Wikimedia Commons
Indiana: Dunkirk
> 2010-2019 population change: -17.0% (state: +3.9%)
> Median household income: $39,196 (state: $56,303)
> 5-yr. avg. unemployment: 5.4% (state: 4.8%)
> Total population: 2,022 in 2019, 2,437 in 2010
[in-text-ad-2]

Iowa: Sac City
> 2010-2019 population change: -12.8% (state: +4.1%)
> Median household income: $49,744 (state: $60,523)
> 5-yr. avg. unemployment: 3.7% (state: 3.7%)
> Total population: 2,001 in 2019, 2,294 in 2010

Kansas: Oswego
> 2010-2019 population change: -21.4% (state: +3.6%)
> Median household income: $43,232 (state: $59,597)
> 5-yr. avg. unemployment: 0.7% (state: 4.1%)
> Total population: 1,676 in 2019, 2,133 in 2010
[in-text-ad]

Kentucky: Fort Knox
> 2010-2019 population change: -27.1% (state: +3.8%)
> Median household income: $59,323 (state: $50,589)
> 5-yr. avg. unemployment: 5.3% (state: 5.6%)
> Total population: 8,695 in 2019, 11,933 in 2010

Louisiana: Norco
> 2010-2019 population change: -15.6% (state: +5.3%)
> Median household income: $68,271 (state: $49,469)
> 5-yr. avg. unemployment: 2.8% (state: 6.5%)
> Total population: 2,850 in 2019, 3,375 in 2010

Source: Public Domain / Wikimedia Commons
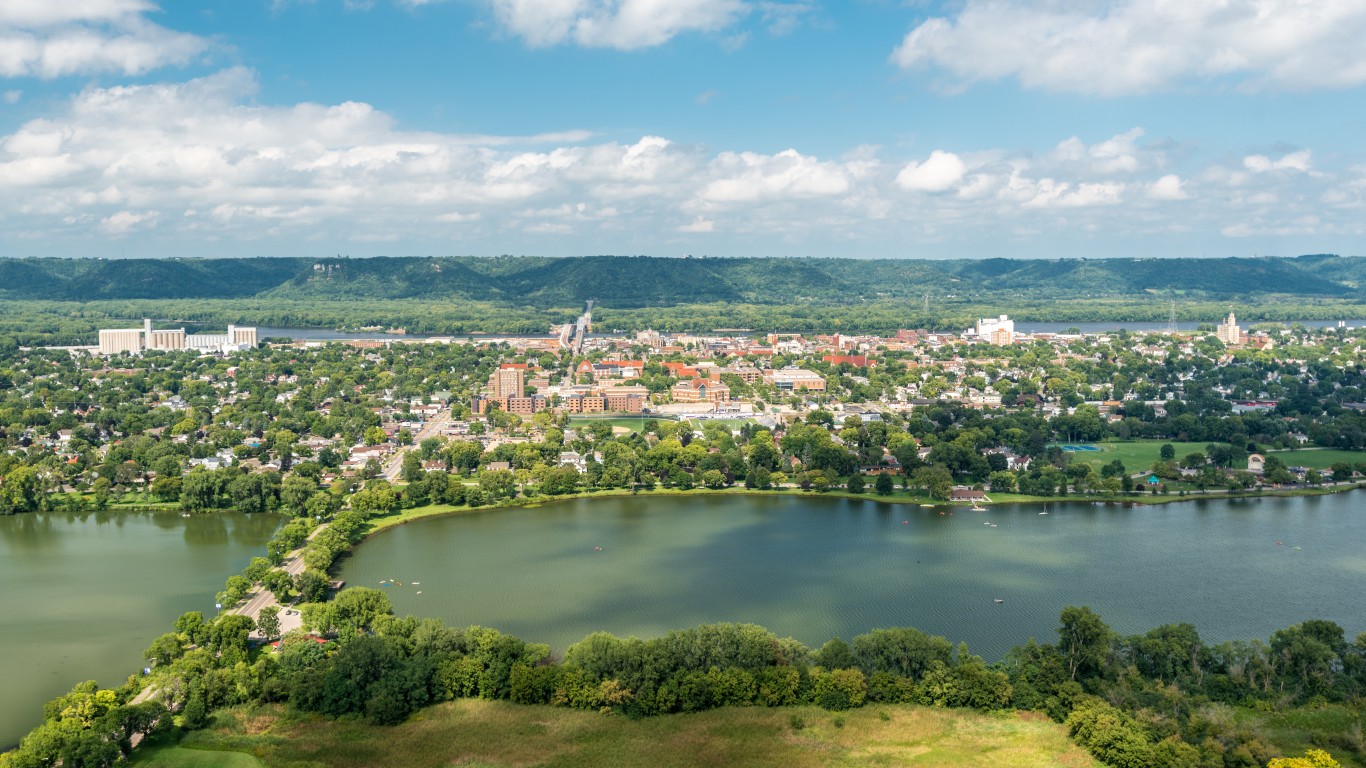
Maine: Winslow
> 2010-2019 population change: -37.0% (state: +0.6%)
> Median household income: $46,980 (state: $57,918)
> 5-yr. avg. unemployment: 3.2% (state: 4.1%)
> Total population: 4,928 in 2019, 7,823 in 2010
[in-text-ad-2]

Source: Joesboy / iStock via Getty Images
Maryland: Sykesville
> 2010-2019 population change: -11.6% (state: +5.7%)
> Median household income: $109,393 (state: $84,805)
> 5-yr. avg. unemployment: 2.9% (state: 5.1%)
> Total population: 3,939 in 2019, 4,454 in 2010

Massachusetts: Oxford
> 2010-2019 population change: -12.2% (state: +5.8%)
> Median household income: $61,227 (state: $81,215)
> 5-yr. avg. unemployment: 4.9% (state: 4.8%)
> Total population: 5,595 in 2019, 6,373 in 2010
[in-text-ad]
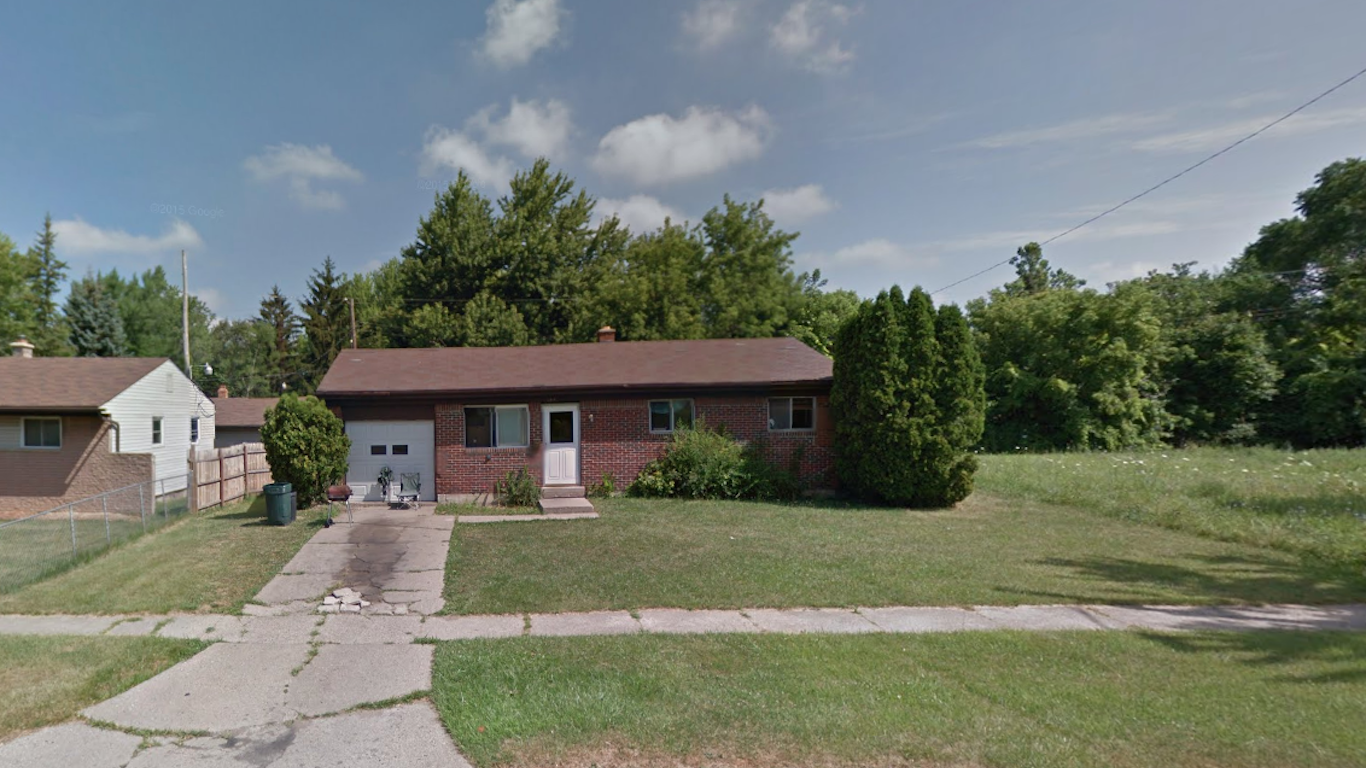
Source: Courtesy of Google Maps 2019
Michigan: Beecher
> 2010-2019 population change: -23.7% (state: +0.1%)
> Median household income: $28,272 (state: $57,144)
> 5-yr. avg. unemployment: 23.7% (state: 5.9%)
> Total population: 9,041 in 2019, 11,842 in 2010
Source: Jake DeGroot / Wikimedia Commons
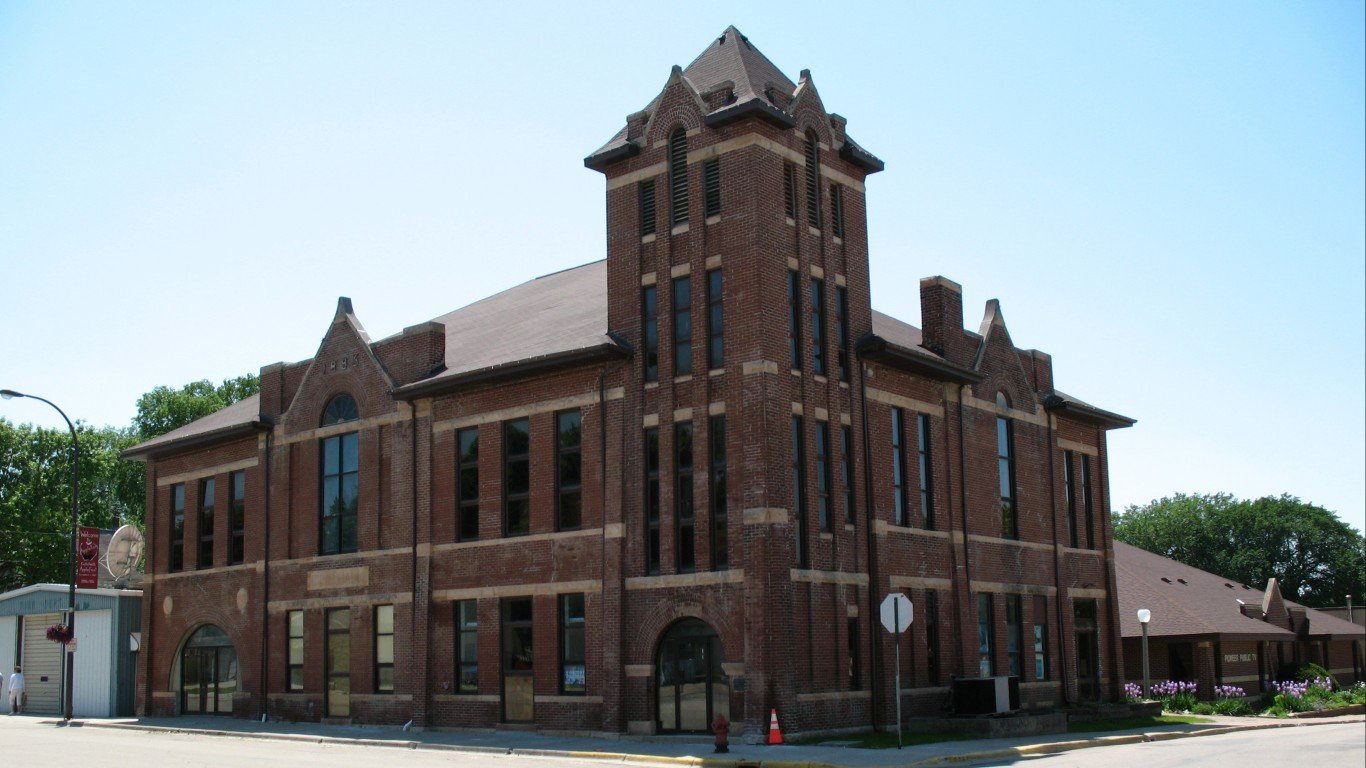
Minnesota: Appleton
> 2010-2019 population change: -35.2% (state: +6.1%)
> Median household income: $34,856 (state: $71,306)
> 5-yr. avg. unemployment: 6.1% (state: 3.6%)
> Total population: 1,412 in 2019, 2,178 in 2010
Source: rruntsch / Getty Images
Mississippi: Winona
> 2010-2019 population change: -17.2% (state: +1.4%)
> Median household income: $40,758 (state: $45,081)
> 5-yr. avg. unemployment: 4.5% (state: 7.5%)
> Total population: 4,227 in 2019, 5,105 in 2010
[in-text-ad-2]
Source: Courtesy of Google Maps 2012
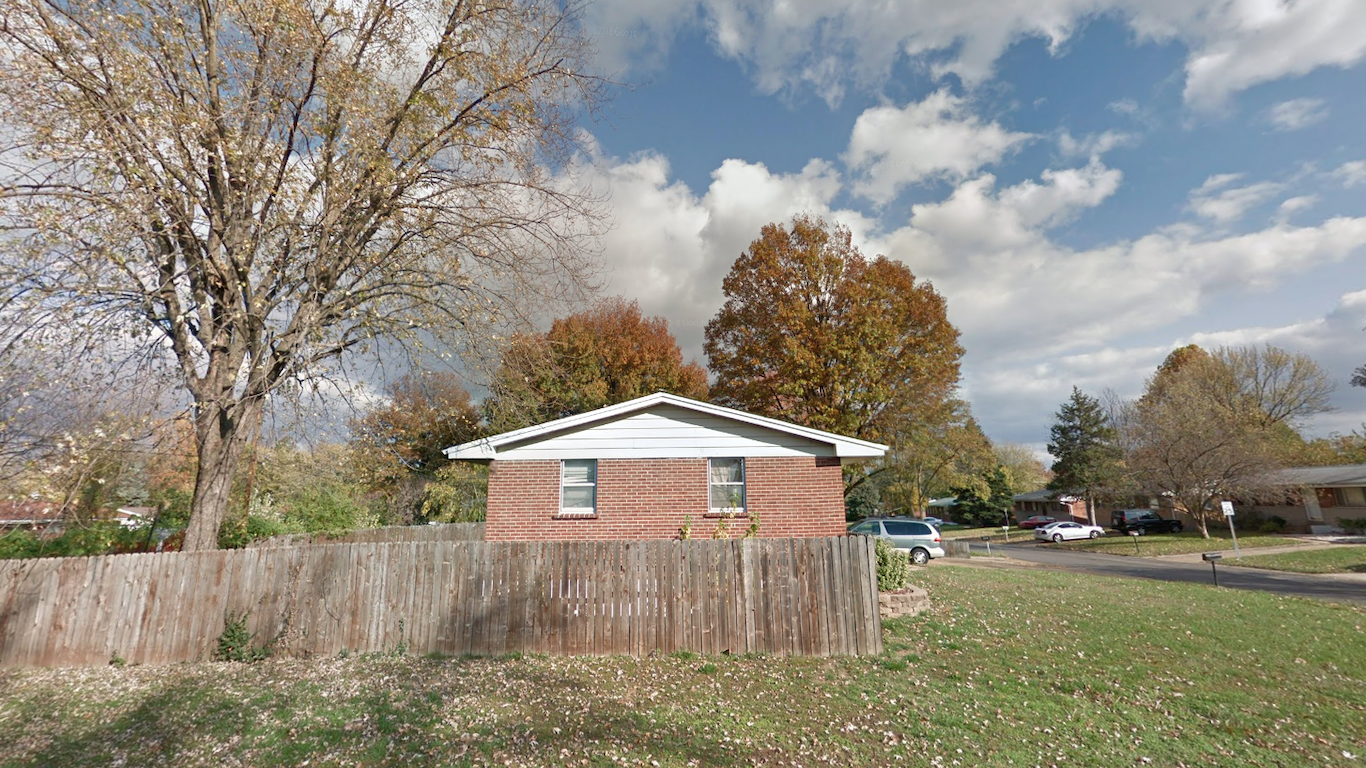
Missouri: Spanish Lake
> 2010-2019 population change: -19.8% (state: +3.1%)
> Median household income: $37,153 (state: $55,461)
> 5-yr. avg. unemployment: 8.2% (state: 4.6%)
> Total population: 17,485 in 2019, 21,803 in 2010

Source: usairforce / Flickr
Montana: Malmstrom Air Force Base
> 2010-2019 population change: -13.3% (state: +7.9%)
> Median household income: $51,410 (state: $54,970)
> 5-yr. avg. unemployment: 2.6% (state: 4.0%)
> Total population: 4,179 in 2019, 4,820 in 2010
[in-text-ad]
Source: Public Domain / Wikimedia Commons
Nebraska: Franklin
> 2010-2019 population change: -13.5% (state: +6.4%)
> Median household income: $46,667 (state: $61,439)
> 5-yr. avg. unemployment: 0.0% (state: 3.3%)
> Total population: 1,031 in 2019, 1,192 in 2010
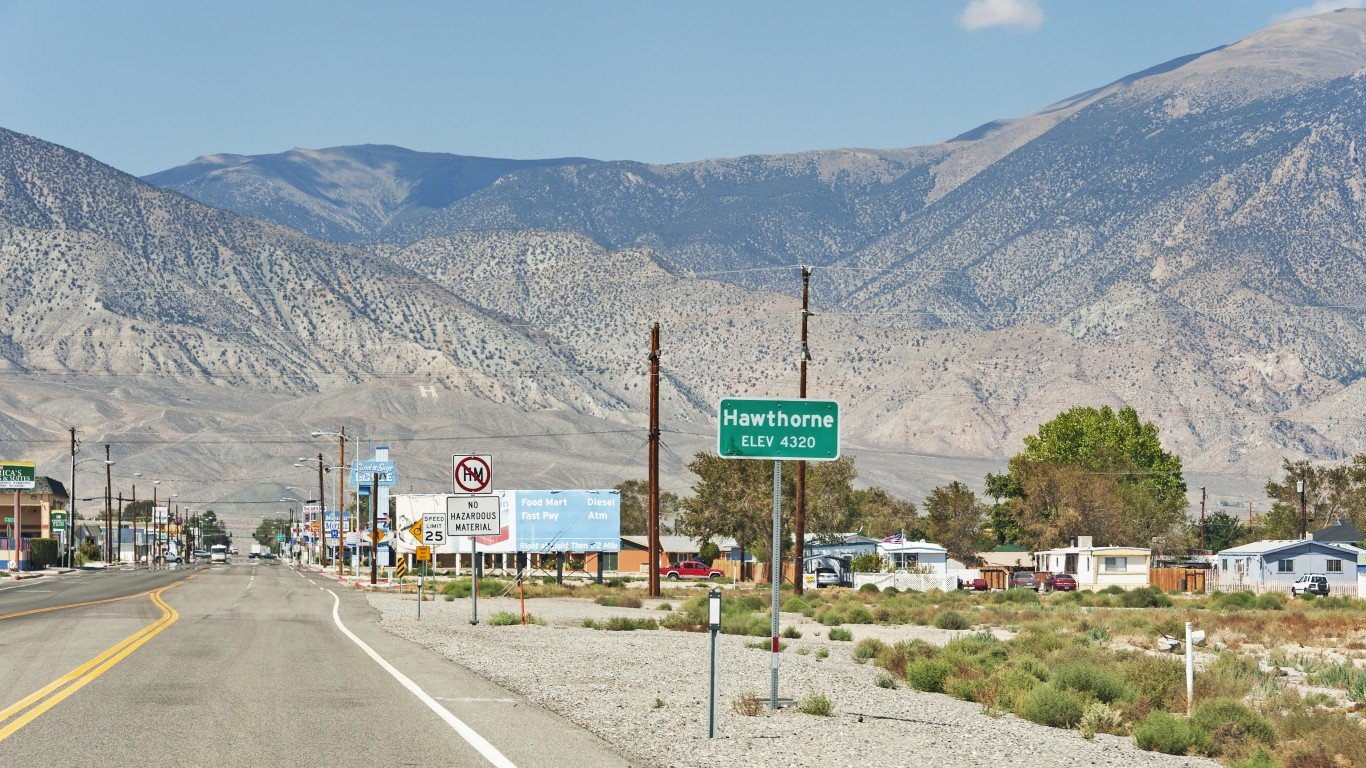
Source: jmoor17 / Getty Images
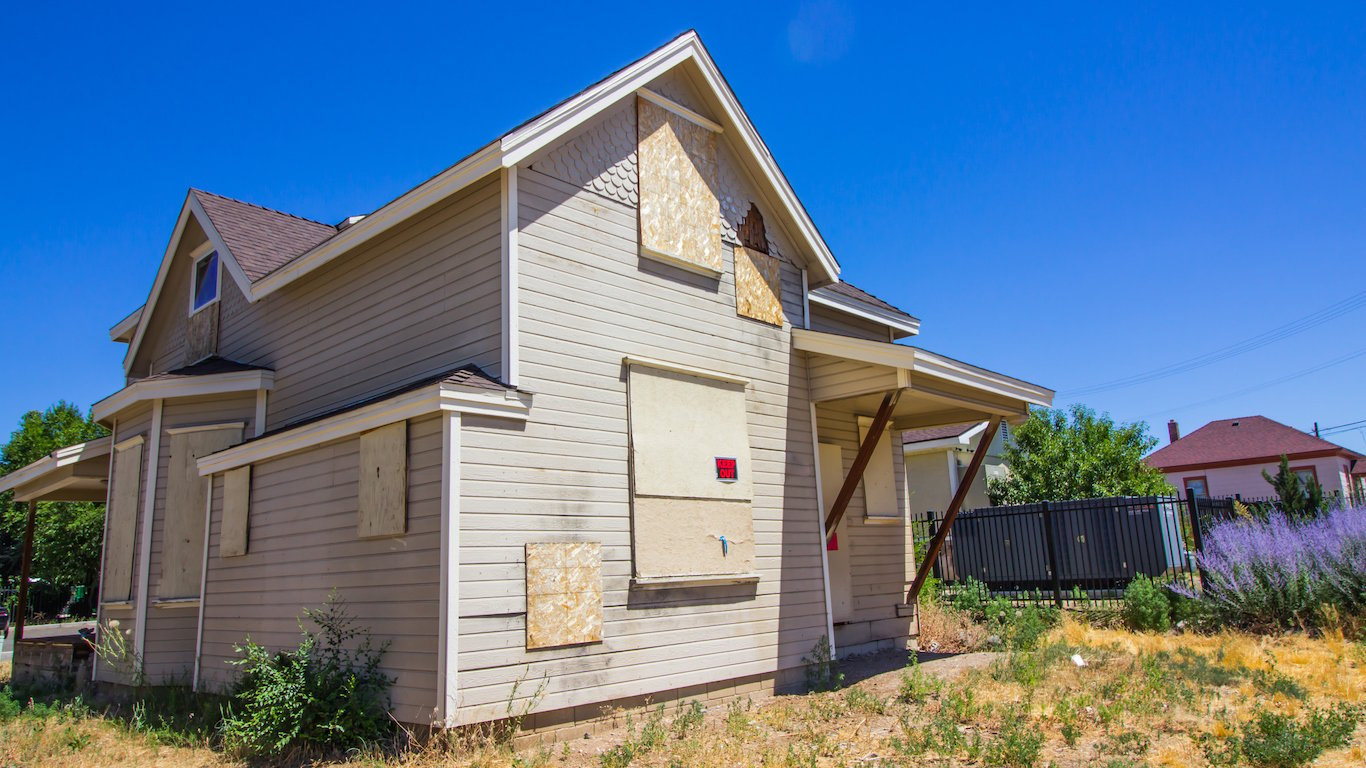
Nevada: Hawthorne
> 2010-2019 population change: -26.2% (state: +12.9%)
> Median household income: $36,993 (state: $60,365)
> 5-yr. avg. unemployment: 8.2% (state: 6.2%)
> Total population: 2,686 in 2019, 3,640 in 2010

Source: John Phelan / Wikimedia Commons
New Hampshire: Derry
> 2010-2019 population change: -4.7% (state: +2.6%)
> Median household income: $67,073 (state: $76,768)
> 5-yr. avg. unemployment: 6.5% (state: 3.6%)
> Total population: 21,817 in 2019, 22,884 in 2010
[in-text-ad-2]

Source: Aneese / iStock Editorial via Getty Images
New Jersey: Avalon
> 2010-2019 population change: -26.5% (state: +1.8%)
> Median household income: $95,556 (state: $82,545)
> 5-yr. avg. unemployment: 2.4% (state: 5.5%)
> Total population: 1,406 in 2019, 1,914 in 2010

Source: chapin31 / iStock via Getty Images
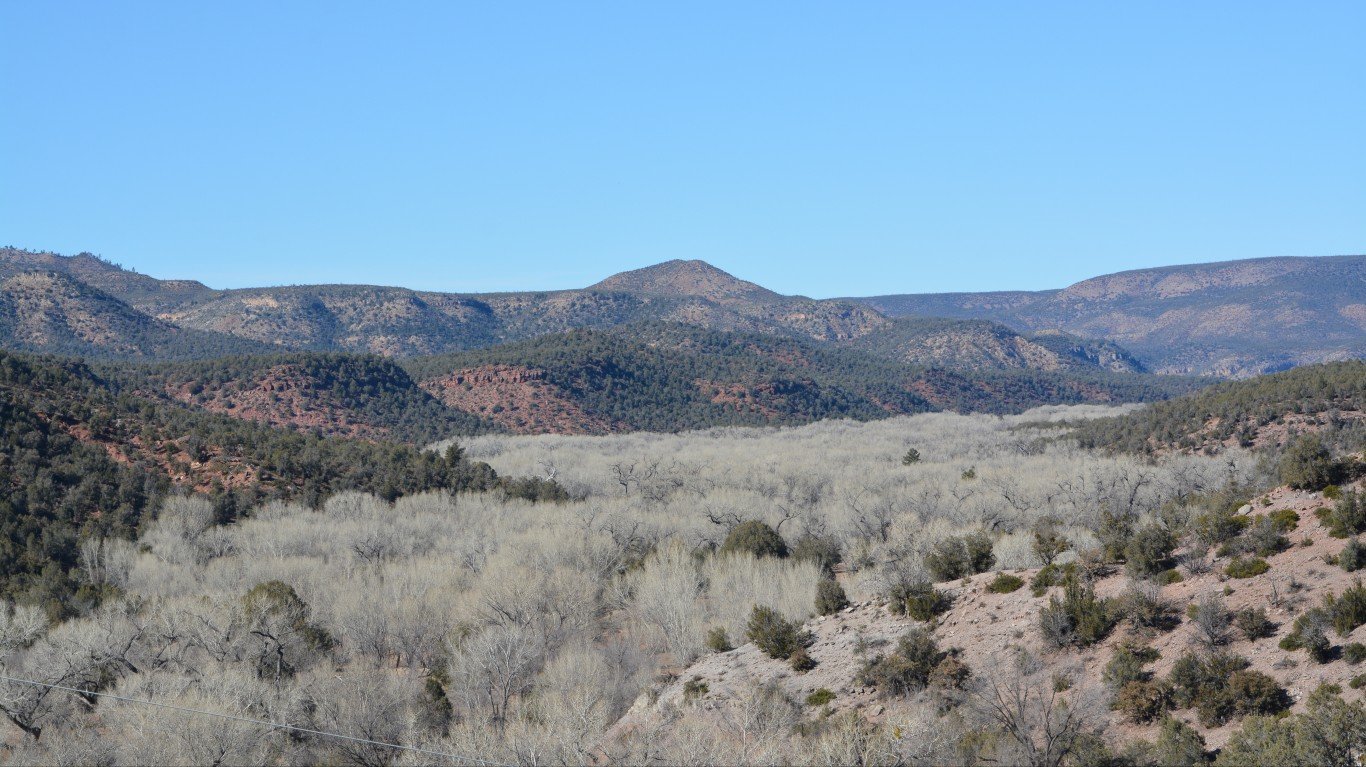
New Mexico: Zuni Pueblo
> 2010-2019 population change: -26.5% (state: +3.9%)
> Median household income: $39,881 (state: $49,754)
> 5-yr. avg. unemployment: 19.8% (state: 6.7%)
> Total population: 7,001 in 2019, 9,527 in 2010
[in-text-ad]

Source: iShootPhotosLLC / Getty Images
New York: South Nyack
> 2010-2019 population change: -39.0% (state: +1.8%)
> Median household income: $105,114 (state: $68,486)
> 5-yr. avg. unemployment: 2.9% (state: 5.5%)
> Total population: 3,387 in 2019, 5,548 in 2010

Source: bauhaus1000 / Getty Images
North Carolina: James City
> 2010-2019 population change: -14.1% (state: +10.7%)
> Median household income: $53,514 (state: $54,602)
> 5-yr. avg. unemployment: 9.1% (state: 5.6%)
> Total population: 5,354 in 2019, 6,236 in 2010

North Dakota: Bottineau
> 2010-2019 population change: -14.4% (state: +14.7%)
> Median household income: $55,185 (state: $64,894)
> 5-yr. avg. unemployment: 7.5% (state: 2.8%)
> Total population: 2,094 in 2019, 2,445 in 2010
[in-text-ad-2]
Source: Vbofficial / Wikimedia Commons
Ohio: Wheelersburg
> 2010-2019 population change: -14.3% (state: +1.2%)
> Median household income: $58,730 (state: $56,602)
> 5-yr. avg. unemployment: 5.6% (state: 5.3%)
> Total population: 6,082 in 2019, 7,099 in 2010

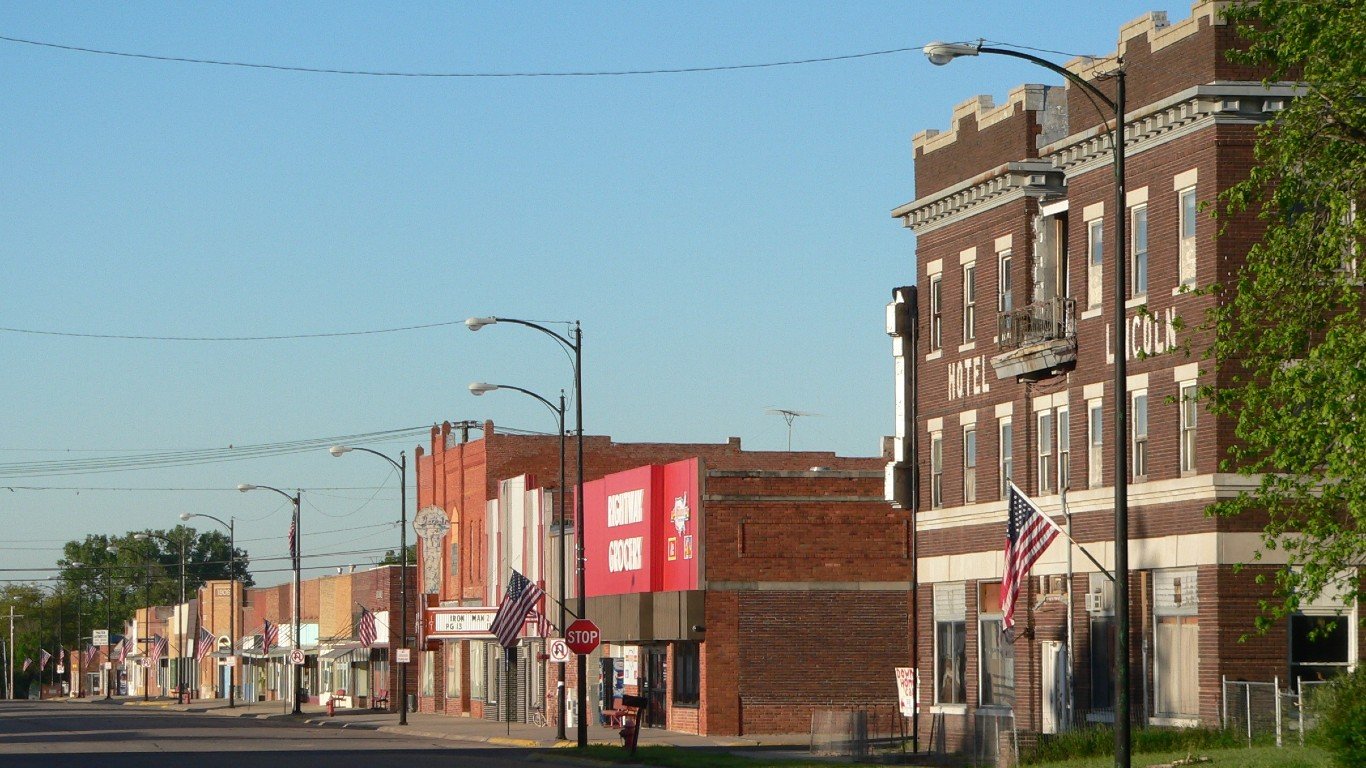
Oklahoma: Watonga
> 2010-2019 population change: -43.9% (state: +7.0%)
> Median household income: $42,771 (state: $52,919)
> 5-yr. avg. unemployment: 3.2% (state: 5.1%)
> Total population: 2,881 in 2019, 5,139 in 2010
[in-text-ad]

Source: Courtesy of Visitor7 under the Creative Commons Attribution-Share Alike 3.0 Unported license (https://creativecommons.org/licenses/by-sa/3.0/deed.en) / Wikimedia Commons
Oregon: Roseburg North
> 2010-2019 population change: -26.9% (state: +9.8%)
> Median household income: $50,830 (state: $62,818)
> 5-yr. avg. unemployment: 10.5% (state: 5.5%)
> Total population: 5,059 in 2019, 6,919 in 2010
 24/7 Wall St.
Source: Public Domain / Wikimedia Commons
Pennsylvania: Bellwood
> 2010-2019 population change: -21.0% (state: +1.4%)
> Median household income: $51,964 (state: $61,744)
> 5-yr. avg. unemployment: 3.3% (state: 5.3%)
> Total population: 1,618 in 2019, 2,047 in 2010

Source: Dietmar Rabich / Wikimedia Commons
Rhode Island: Warwick
> 2010-2019 population change: -3.2% (state: +0.1%)
> Median household income: $73,757 (state: $67,167)
> 5-yr. avg. unemployment: 3.7% (state: 5.4%)
> Total population: 80,993 in 2019, 83,676 in 2010
[in-text-ad-2]

Source: Upstateherd / Wikimedia Commons
South Carolina: Allendale
> 2010-2019 population change: -17.0% (state: +11.3%)
> Median household income: $19,463 (state: $53,199)
> 5-yr. avg. unemployment: 27.9% (state: 5.8%)
> Total population: 3,009 in 2019, 3,626 in 2010

Source: Harry Weddington, U.S. Army Corps of Engineers / Wikimedia Commons
South Dakota: Fort Thompson
> 2010-2019 population change: -13.5% (state: +8.9%)
> Median household income: $23,594 (state: $58,275)
> 5-yr. avg. unemployment: 27.8% (state: 3.4%)
> Total population: 1,235 in 2019, 1,428 in 2010
[in-text-ad]

Source: Colin1769 / Wikimedia Commons
Tennessee: Belle Meade
> 2010-2019 population change: -21.1% (state: +7.6%)
> Median household income: $00 (state: $53,320)
> 5-yr. avg. unemployment: 1.2% (state: 5.3%)
> Total population: 2,280 in 2019, 2,891 in 2010

Source: ElFlacodelNorte / iStock via Getty Images
Texas: San Elizario
> 2010-2019 population change: -36.1% (state: +16.2%)
> Median household income: $36,213 (state: $61,874)
> 5-yr. avg. unemployment: 5.6% (state: 5.1%)
> Total population: 9,126 in 2019, 14,277 in 2010

Utah: Price
> 2010-2019 population change: -2.5% (state: +16.5%)
> Median household income: $45,730 (state: $71,621)
> 5-yr. avg. unemployment: 7.7% (state: 3.6%)
> Total population: 8,265 in 2019, 8,473 in 2010
[in-text-ad-2]

Source: DenisTangneyJr / Getty Images
Vermont: St. Johnsbury
> 2010-2019 population change: -12.7% (state: +0.0%)
> Median household income: $37,889 (state: $61,973)
> 5-yr. avg. unemployment: 4.5% (state: 3.6%)
> Total population: 5,865 in 2019, 6,722 in 2010

Source: Scott Wurzel / iStock via Getty Images
Virginia: Mason Neck
> 2010-2019 population change: -11.5% (state: +7.8%)
> Median household income: $142,125 (state: $74,222)
> 5-yr. avg. unemployment: 3.4% (state: 4.6%)
> Total population: 1,986 in 2019, 2,245 in 2010
[in-text-ad]

Source: Public Domain / Wikimedia Commons
Washington: Fairchild Air Force Base
> 2010-2019 population change: -19.8% (state: +12.8%)
> Median household income: $67,656 (state: $73,775)
> 5-yr. avg. unemployment: 6.0% (state: 5.0%)
> Total population: 3,336 in 2019, 4,159 in 2010

Source: City of Nitro / Facebook
West Virginia: Nitro
> 2010-2019 population change: -15.3% (state: -1.3%)
> Median household income: $41,076 (state: $46,711)
> 5-yr. avg. unemployment: 5.6% (state: 6.5%)
> Total population: 5,997 in 2019, 7,083 in 2010

Source: Courtesy of the Village of Nashotah via www.nashotah-wi.gov
Wisconsin: Nashotah
> 2010-2019 population change: -21.5% (state: +2.7%)
> Median household income: $100,625 (state: $61,747)
> 5-yr. avg. unemployment: 3.3% (state: 3.6%)
> Total population: 1,219 in 2019, 1,553 in 2010
[in-text-ad-2]

Source: Public Domain / Wikimedia Commons
Wyoming: Warren Air Force Base
> 2010-2019 population change: -15.0% (state: +6.5%)
> Median household income: $75,142 (state: $64,049)
> 5-yr. avg. unemployment: 11.5% (state: 4.5%)
> Total population: 2,456 in 2019, 2,888 in 2010
Methodology
To identify the fastest-shrinking place in every state, 24/7 Wall St. reviewed population change from 2010 to 2019 in over 9,000 cities, towns, villages, and census designated places with populations of at least 1,000. We only considered places where the margin of error for the population was less than 10%. All data are five-year estimates from the U.S. Census Bureau’s American Community Survey. We also reviewed data on median household income and annual unemployment for 2019 from the ACS.
Take This Retirement Quiz To Get Matched With An Advisor Now (Sponsored)
Are you ready for retirement? Planning for retirement can be overwhelming, that’s why it could be a good idea to speak to a fiduciary financial advisor about your goals today.
Start by taking this retirement quiz right here from SmartAsset that will match you with up to 3 financial advisors that serve your area and beyond in 5 minutes. Smart Asset is now matching over 50,000 people a month.
Click here now to get started.
Thank you for reading! Have some feedback for us?
Contact the 24/7 Wall St. editorial team.
Editors' Picks