
The vast majority of cities and urban centers reported throughout 2020 negative net migration — more people moved out than moved in. But even ahead of the COVID-19 pandemic, dozens of American cities were shrinking as thousands of residents moved away.
People move for a variety of reasons — retirement, new job opportunities, starting a family, or they simply want a change of scenery. Some areas of the country have few qualities to entice new residents to move in or to keep current residents from leaving.
To determine the cities Americans are flocking to, 24/7 Wall St. reviewed data from the U.S. Census Bureau’s Population Estimates Program. Cities were ranked based on the percentage decrease in population due to net migration alone from April 1, 2010, to July 1, 2020.
The 33 cities that Americans are abandoning the fastest are spread out across 18 states from coast to coast. There are 11 Midwestern states on this list, more than any other region. There were also 10 Southern states, and six each in the West and Northeast with significant negative net migration.
Six of the cities Americans are abandoning are located in Illinois, by far the most of any state. New York and California tie for the second most with three cities apiece on the list. A handful of cities on this list had enough natural population growth — more births than deaths — to offset their negative net migration over the past 10 years. But most of these cities had fewer residents in 2020 than in 2010 — in many many thousands fewer people.
Challenging economic circumstances are one of the main drivers of outward migration. Of the 33 cities American are abandoning, the majority have relatively high unemployment rates and high poverty rates. In these metro areas, workers are struggling to find jobs, and those who do may be underemployed and searching for a better option. These are the American cities losing the most jobs.
Click here to see the cities Americans are abandoning.
Click here to see our methodology.

Source: hkim39 / Getty Images
33. Beckley, WV
> Population change due to migration, 2010-2020: -5.2% (-6,463)
> Overall population change, 2010-2020: -7.9% (-9,928)
> Poverty rate: 17.9% (47th highest out of 384 metro areas)
> 2020 population estimate: 114,982 (336th highest out of 384 metro areas)
[in-text-ad]

Source: traveler1116 / Getty Images
32. Binghamton, NY
> Population change due to migration, 2010-2020: -5.3% (-13,402)
> Overall population change, 2010-2020: -5.7% (-14,398)
> Poverty rate: 16.6% (69th highest out of 384 metro areas)
> 2020 population estimate: 237,324 (196th highest out of 384 metro areas)

Source: BOB WESTON / iStock via Getty Images
31. St. Joseph, MO-KS
> Population change due to migration, 2010-2020: -5.3% (-6,783)
> Overall population change, 2010-2020: -3.7% (-4,767)
> Poverty rate: 14.3% (131st highest out of 384 metro areas)
> 2020 population estimate: 122,556 (326th highest out of 384 metro areas)

Source: JillLang / Getty Images
30. New Bern, NC
> Population change due to migration, 2010-2020: -5.4% (-6,789)
> Overall population change, 2010-2020: -2.8% (-3,606)
> Poverty rate: 14.1% (135th highest out of 384 metro areas)
> 2020 population estimate: 123,198 (324th highest out of 384 metro areas)
[in-text-ad-2]

Source: SeanPavonePhoto / iStock via Getty Images
29. Shreveport-Bossier City, LA
> Population change due to migration, 2010-2020: -5.4% (-21,580)
> Overall population change, 2010-2020: -1.6% (-6,210)
> Poverty rate: 22.2% (12th highest out of 384 metro areas)
> 2020 population estimate: 392,404 (140th highest out of 384 metro areas)

Source: Chilkoot / Getty Images
28. Anchorage, AK
> Population change due to migration, 2010-2020: -5.4% (-20,661)
> Overall population change, 2010-2020: +4.2% (16,075)
> Poverty rate: 10.0% (313th highest out of 384 metro areas)
> 2020 population estimate: 397,308 (135th highest out of 384 metro areas)
[in-text-ad]

Source: Mlenny / E+ via Getty Images
27. Chicago-Naperville-Elgin, IL-IN-WI
> Population change due to migration, 2010-2020: -5.5% (-518,000)
> Overall population change, 2010-2020: -0.6% (-54,902)
> Poverty rate: 10.6% (291st highest out of 384 metro areas)
> 2020 population estimate: 9,406,638 (3rd highest out of 384 metro areas)

Source: Solidago / Getty Images
26. Salinas, CA
> Population change due to migration, 2010-2020: -5.5% (-22,797)
> Overall population change, 2010-2020: +3.8% (15,848)
> Poverty rate: 12.7% (198th highest out of 384 metro areas)
> 2020 population estimate: 430,906 (125th highest out of 384 metro areas)

Source: jetcityimage / iStock Editorial via Getty Images
25. Lima, OH
> Population change due to migration, 2010-2020: -5.5% (-5,865)
> Overall population change, 2010-2020: -4.1% (-4,315)
> Poverty rate: 12.0% (228th highest out of 384 metro areas)
> 2020 population estimate: 101,980 (354th highest out of 384 metro areas)
[in-text-ad-2]

Source: AUDREY SCRIPP / iStock via Getty Images
24. Atlantic City-Hammonton, NJ
> Population change due to migration, 2010-2020: -5.5% (-15,198)
> Overall population change, 2010-2020: -4.2% (-11,587)
> Poverty rate: 11.1% (272nd highest out of 384 metro areas)
> 2020 population estimate: 262,945 (188th highest out of 384 metro areas)

Source: DenisTangneyJr / Getty Images
23. Flint, MI
> Population change due to migration, 2010-2020: -5.8% (-24,602)
> Overall population change, 2010-2020: -4.9% (-20,996)
> Poverty rate: 16.5% (72nd highest out of 384 metro areas)
> 2020 population estimate: 404,794 (134th highest out of 384 metro areas)
[in-text-ad]

Source: wellesenterprises / Getty Images
22. Monroe, LA
> Population change due to migration, 2010-2020: -5.8% (-11,847)
> Overall population change, 2010-2020: -2.8% (-5,656)
> Poverty rate: 26.0% (2nd highest out of 384 metro areas)
> 2020 population estimate: 198,836 (226th highest out of 384 metro areas)
 24/7 Wall St.
Source: DenisTangneyJr / Getty Images
21. Saginaw, MI
> Population change due to migration, 2010-2020: -5.8% (-11,627)
> Overall population change, 2010-2020: -5.1% (-10,301)
> Poverty rate: 19.0% (33rd highest out of 384 metro areas)
> 2020 population estimate: 189,868 (229th highest out of 384 metro areas)

Source: gnagel / iStock Editorial via Getty Images
20. Kankakee, IL
> Population change due to migration, 2010-2020: -5.9% (-6,722)
> Overall population change, 2010-2020: -4.3% (-4,856)
> Poverty rate: 12.2% (219th highest out of 384 metro areas)
> 2020 population estimate: 108,594 (344th highest out of 384 metro areas)
[in-text-ad-2]

Source: DenisTangneyJr / Getty Images
19. Charleston, WV
> Population change due to migration, 2010-2020: -6.2% (-17,192)
> Overall population change, 2010-2020: -8.6% (-23,855)
> Poverty rate: 17.1% (64th highest out of 384 metro areas)
> 2020 population estimate: 254,145 (189th highest out of 384 metro areas)

Source: benkrut / Getty Images
18. Peoria, IL
> Population change due to migration, 2010-2020: -6.5% (-27,030)
> Overall population change, 2010-2020: -4.7% (-19,472)
> Poverty rate: 11.3% (261st highest out of 384 metro areas)
> 2020 population estimate: 396,781 (136th highest out of 384 metro areas)
[in-text-ad]

Source: DenisTangneyJr / Getty Images
17. Brownsville-Harlingen, TX
> Population change due to migration, 2010-2020: -6.6% (-26,726)
> Overall population change, 2010-2020: +4.4% (17,966)
> Poverty rate: 25.6% (4th highest out of 384 metro areas)
> 2020 population estimate: 424,180 (128th highest out of 384 metro areas)
 24/7 Wall St.
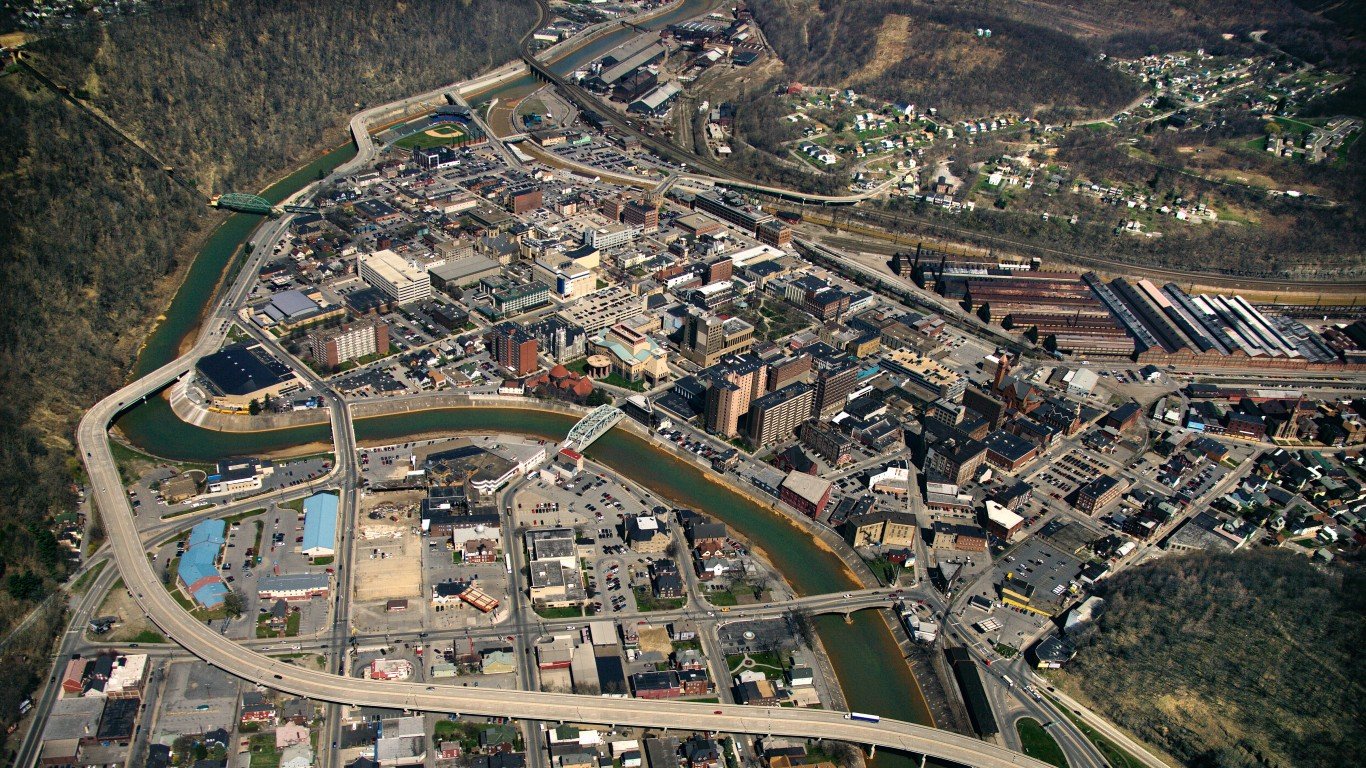
Source: Jupiterimages / Getty Images
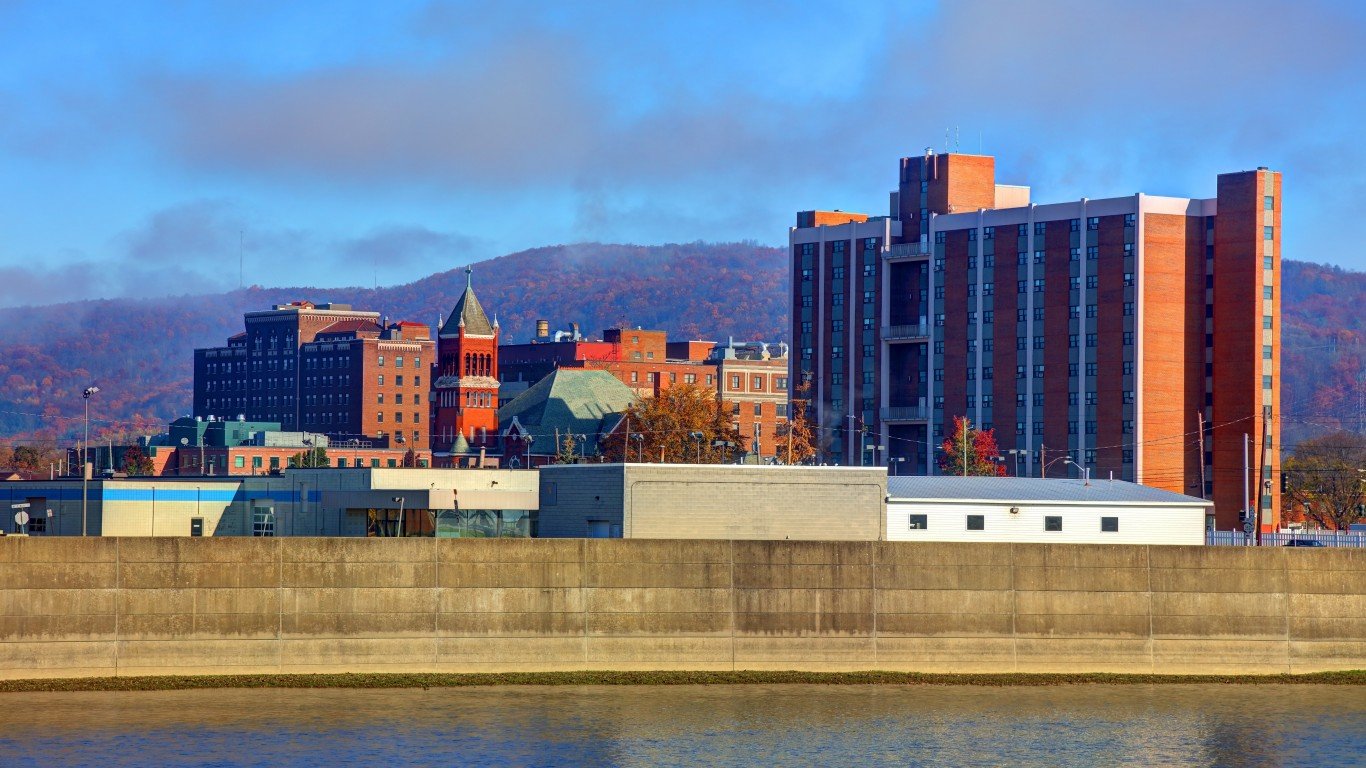
16. Johnstown, PA
> Population change due to migration, 2010-2020: -6.6% (-9,554)
> Overall population change, 2010-2020: -10.5% (-15,021)
> Poverty rate: 15.3% (111th highest out of 384 metro areas)
> 2020 population estimate: 128,672 (314th highest out of 384 metro areas)
Source: DenisTangneyJr / Getty Images
15. Elmira, NY
> Population change due to migration, 2010-2020: -6.9% (-6,117)
> Overall population change, 2010-2020: -7.0% (-6,224)
> Poverty rate: 13.9% (146th highest out of 384 metro areas)
> 2020 population estimate: 82,622 (376th highest out of 384 metro areas)
[in-text-ad-2]

Source: benkrut / Getty Images
14. Rockford, IL
> Population change due to migration, 2010-2020: -7.0% (-24,544)
> Overall population change, 2010-2020: -4.4% (-15,359)
> Poverty rate: 16.1% (83rd highest out of 384 metro areas)
> 2020 population estimate: 334,072 (153rd highest out of 384 metro areas)

Source: Jon Kraft / iStock via Getty Images
13. Decatur, IL
> Population change due to migration, 2010-2020: -8.0% (-8,838)
> Overall population change, 2010-2020: -7.0% (-7,762)
> Poverty rate: 17.4% (59th highest out of 384 metro areas)
> 2020 population estimate: 103,015 (348th highest out of 384 metro areas)
[in-text-ad]

Source: peeterv / Getty Images
12. El Centro, CA
> Population change due to migration, 2010-2020: -8.0% (-14,046)
> Overall population change, 2010-2020: +3.3% (5,745)
> Poverty rate: 25.1% (5th highest out of 384 metro areas)
> 2020 population estimate: 180,267 (238th highest out of 384 metro areas)

Source: Daniel Schwen / Wikimedia Commons
11. Danville, IL
> Population change due to migration, 2010-2020: -8.8% (-7,166)
> Overall population change, 2010-2020: -8.3% (-6,770)
> Poverty rate: 16.5% (72nd highest out of 384 metro areas)
> 2020 population estimate: 74,855 (380th highest out of 384 metro areas)

Source: DenisTangneyJr / Getty Images
10. Lawton, OK
> Population change due to migration, 2010-2020: -9.1% (-11,868)
> Overall population change, 2010-2020: -2.7% (-3,504)
> Poverty rate: 17.8% (53rd highest out of 384 metro areas)
> 2020 population estimate: 126,775 (316th highest out of 384 metro areas)
[in-text-ad-2]
Source: Smallbones / Wikimedia Commons
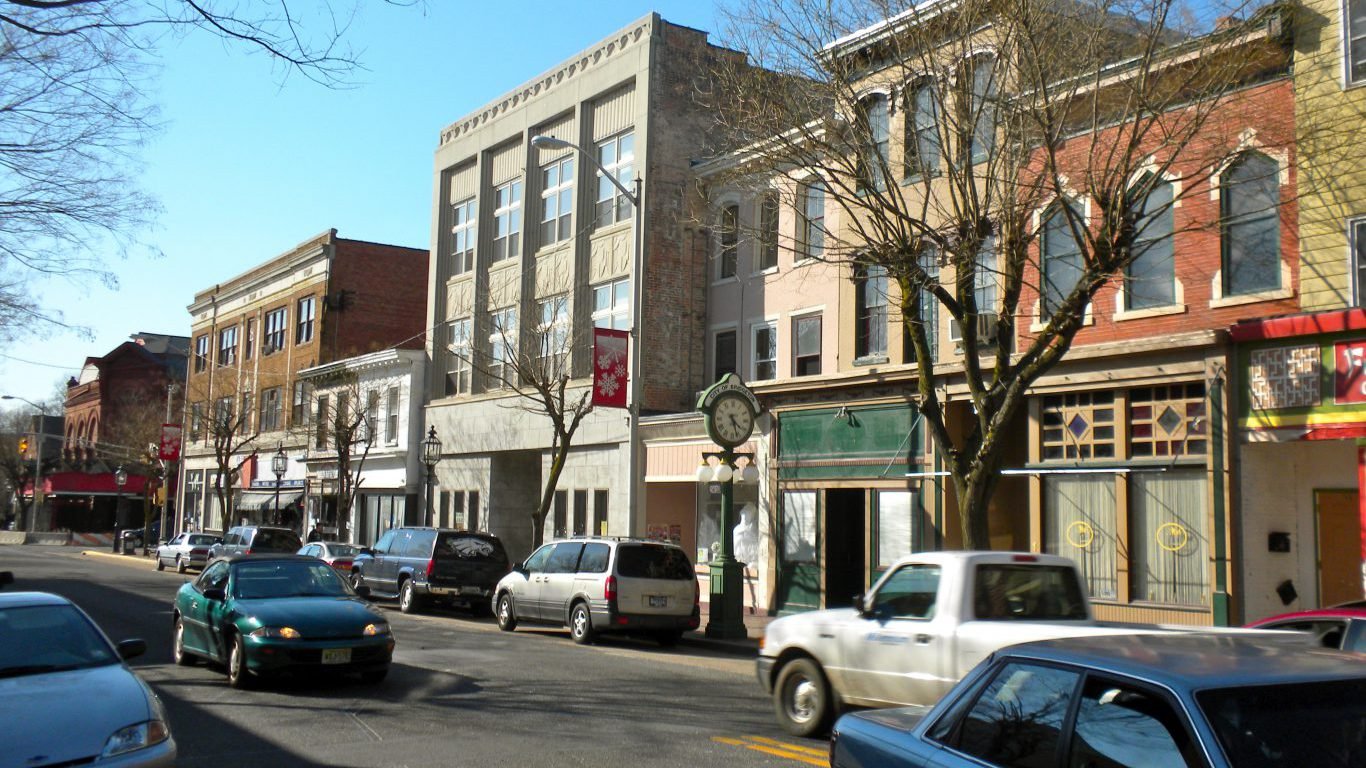
9. Vineland-Bridgeton, NJ
> Population change due to migration, 2010-2020: -9.2% (-14,342)
> Overall population change, 2010-2020: -6.1% (-9,602)
> Poverty rate: 13.2% (175th highest out of 384 metro areas)
> 2020 population estimate: 147,008 (286th highest out of 384 metro areas)

Source: sshepard / Getty Images
8. Albany, GA
> Population change due to migration, 2010-2020: -9.3% (-14,306)
> Overall population change, 2010-2020: -5.7% (-8,827)
> Poverty rate: 22.6% (10th highest out of 384 metro areas)
> 2020 population estimate: 145,206 (288th highest out of 384 metro areas)
[in-text-ad]

Source: Michael Rivera / Wikimedia Commons
7. Hinesville, GA
> Population change due to migration, 2010-2020: -10.2% (-7,971)
> Overall population change, 2010-2020: +6.7% (5,246)
> Poverty rate: 12.0% (228th highest out of 384 metro areas)
> 2020 population estimate: 83,175 (373rd highest out of 384 metro areas)
Source: springfieldhomer / Flickr
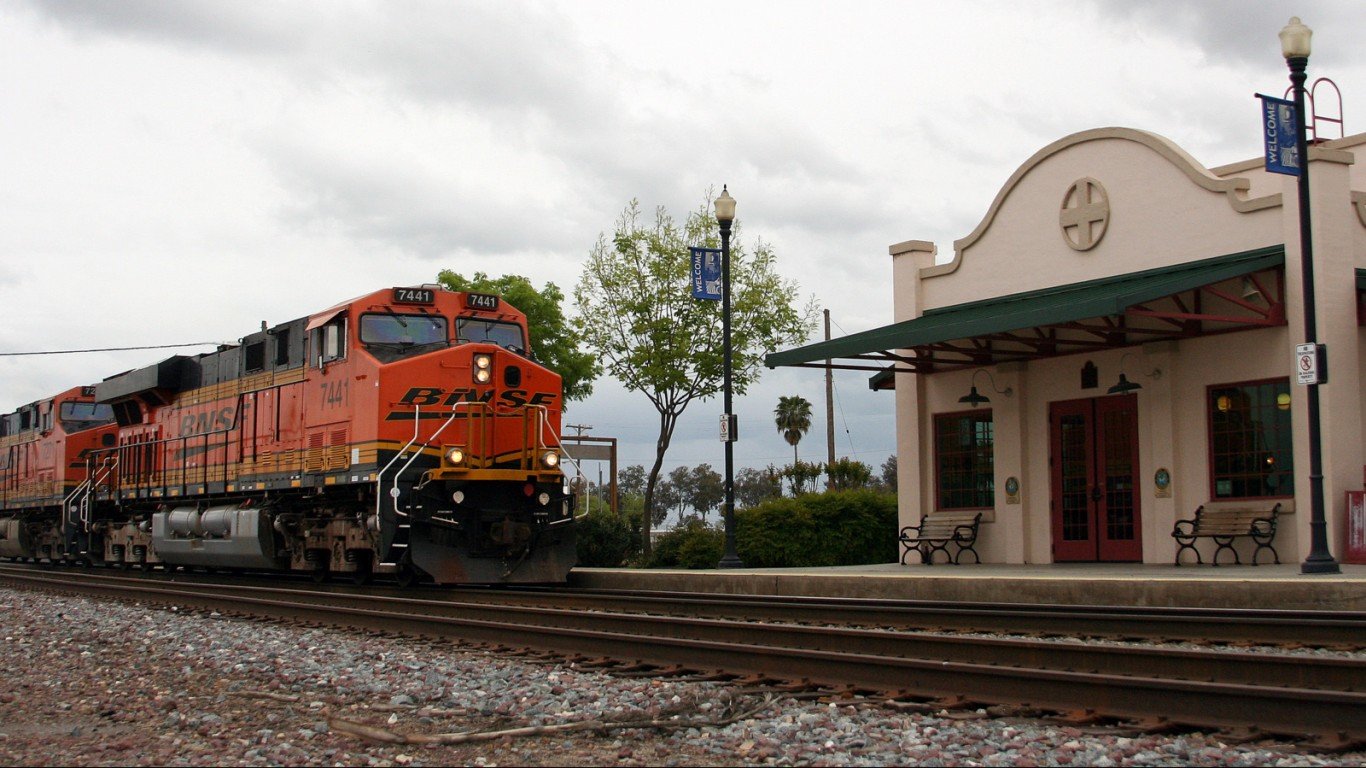
6. Hanford-Corcoran, CA
> Population change due to migration, 2010-2020: -10.5% (-15,992)
> Overall population change, 2010-2020: -0.2% (-298)
> Poverty rate: 15.2% (114th highest out of 384 metro areas)
> 2020 population estimate: 152,692 (275th highest out of 384 metro areas)

Source: AllenS / Wikimedia Commons
5. Farmington, NM
> Population change due to migration, 2010-2020: -10.8% (-13,988)
> Overall population change, 2010-2020: -5.2% (-6,733)
> Poverty rate: 21.2% (14th highest out of 384 metro areas)
> 2020 population estimate: 123,312 (323rd highest out of 384 metro areas)
[in-text-ad-2]

Source: DenisTangneyJr / Getty Images
4. Manhattan, KS
> Population change due to migration, 2010-2020: -11.1% (-14,079)
> Overall population change, 2010-2020: +2.4% (3,048)
> Poverty rate: 18.6% (38th highest out of 384 metro areas)
> 2020 population estimate: 130,142 (312th highest out of 384 metro areas)

Source: Paul Sableman / Wikimedia Commons
3. Pine Bluff, AR
> Population change due to migration, 2010-2020: -14.2% (-14,280)
> Overall population change, 2010-2020: -13.9% (-13,984)
> Poverty rate: 23.6% (6th highest out of 384 metro areas)
> 2020 population estimate: 86,278 (370th highest out of 384 metro areas)
[in-text-ad]

Source: lippyjr / Getty Images
2. Fairbanks, AK
> Population change due to migration, 2010-2020: -14.3% (-13,939)
> Overall population change, 2010-2020: -2.0% (-1,934)
> Poverty rate: 5.9% (381st highest out of 384 metro areas)
> 2020 population estimate: 95,651 (365th highest out of 384 metro areas)

Source: Public Domain / Wikimedia Commons
1. Watertown-Fort Drum, NY
> Population change due to migration, 2010-2020: -17.0% (-19,763)
> Overall population change, 2010-2020: -7.0% (-8,139)
> Poverty rate: 15.5% (103rd highest out of 384 metro areas)
> 2020 population estimate: 108,095 (346th highest out of 384 metro areas)
Methodology:
To determine the cities Americans are flocking to, 24/7 Wall St. reviewed data from the U.S. Census Bureau’s Population Estimates Program. Cities were ranked based on the percentage decrease in population due to net migration from April 1, 2010, to July 1, 2020. Supplemental data on median household income came from the Census Bureau’s 2019 American Community Survey. Seasonally adjusted data on unemployment in May 2021 came from the Bureau of Labor Statistics.
Sponsored: Want to Retire Early? Here’s a Great First Step
Want retirement to come a few years earlier than you’d planned? Or are you ready to retire now, but want an extra set of eyes on your finances?
Now you can speak with up to 3 financial experts in your area for FREE. By simply clicking here you can begin to match with financial professionals who can help you build your plan to retire early. And the best part? The first conversation with them is free.
Click here to match with up to 3 financial pros who would be excited to help you make financial decisions.
Thank you for reading! Have some feedback for us?
Contact the 24/7 Wall St. editorial team.
Editors' Picks