
The U.S. reported over 65,000 new cases of coronavirus on July 15, bringing the total count to more than 33.4 million confirmed cases of COVID-19. There have been more than 601,000 COVID-19-related deaths — the highest death toll of any country.
New cases continue to rise at a steady rate. In the past week, there were an average of 4.2 daily new coronavirus cases per 100,000 Americans — essentially unchanged from the week prior, when there were an average of 3.5 daily new coronavirus cases per 100,000 people.
While new data shows that the risk of contracting COVID-19 is high in almost every part of the country, cities continue to be the sites of major outbreaks and superspreader events. Experts agree that the virus is more likely to spread in group settings where large numbers of people routinely have close contact with one another, such as colleges, nursing homes, bars, and restaurants. Metropolitan areas with a high degree of connectivity between different neighborhoods and a large population may be particularly at-risk.
The metro areas with the lowest incidence of COVID-19 cases are distributed relatively unevenly across the United States. Of the 50 metro areas with the lowest case counts per capita, 29 are in the West, 10 are in the South, 10 are in the Northeast, and one is in the Midwest.
The five metro areas with the smallest number of coronavirus cases per capita are: Urban Honolulu, HI; Kahului-Wailuku-Lahaina, HI; Bremerton-Silverdale-Port Orchard, WA; Corvallis, OR; and Eugene-Springfield, OR. The incidence of COVID-19 in these metro areas range from 2,853.6 cases per 100,000 to 3,783.4 cases per 100,000. For comparison, there are currently 10,359.8 cases per 100,000 Americans nationwide.
The 50 cities with the lowest incidence of COVID-19 have more than 4,000 fewer coronavirus cases per capita than the U.S. as a whole, but cases are still growing at a steady pace. There were an average of 3.0 daily new coronavirus cases per 100,000 people in the week ending July 15, roughly unchanged from the week prior, when there were an average of 3.0 daily new coronavirus cases per 100,000 people. In 46 of the 50 cities with the lowest COVID-19 incidence, new cases are rising at a slowing rate.
To determine the cities with the fewest COVID-19 cases, 24/7 Wall St. compiled and reviewed data from state and local health departments. We ranked metro areas based on the number of confirmed COVID-19 cases per 100,000 residents as of July 15.To estimate the incidence of COVID-19 at the metropolitan level, we aggregated data from the county level using boundary definitions from the U.S. Census Bureau. Population data used to adjust case and death totals came from the U.S. Census Bureau’s 2019 American Community Survey and are five-year estimates. Unemployment data is from the Bureau of Labor Statistics and is seasonally adjusted.

Source: Chris Leschinsky / Getty Images
50. Santa Maria-Santa Barbara, CA
> Confirmed COVID-19 cases as of July 15: 34,692
> Confirmed COVID-19 cases as of July 15 per 100,000 residents: 7,799.0
> Cumulative COVID-19 deaths as of July 15: 460
> Cumulative COVID-19 deaths as of July 15 per 100,000 residents: 103.4
> Population: 444,829

Source: SeanPavonePhoto / Getty Images
49. Durham-Chapel Hill, NC
> Confirmed COVID-19 cases as of July 15: 48,769
> Confirmed COVID-19 cases as of July 15 per 100,000 residents: 7,781.9
> Cumulative COVID-19 deaths as of July 15: 575
> Cumulative COVID-19 deaths as of July 15 per 100,000 residents: 91.8
> Population: 626,695
Source: zrfphoto / Getty Images
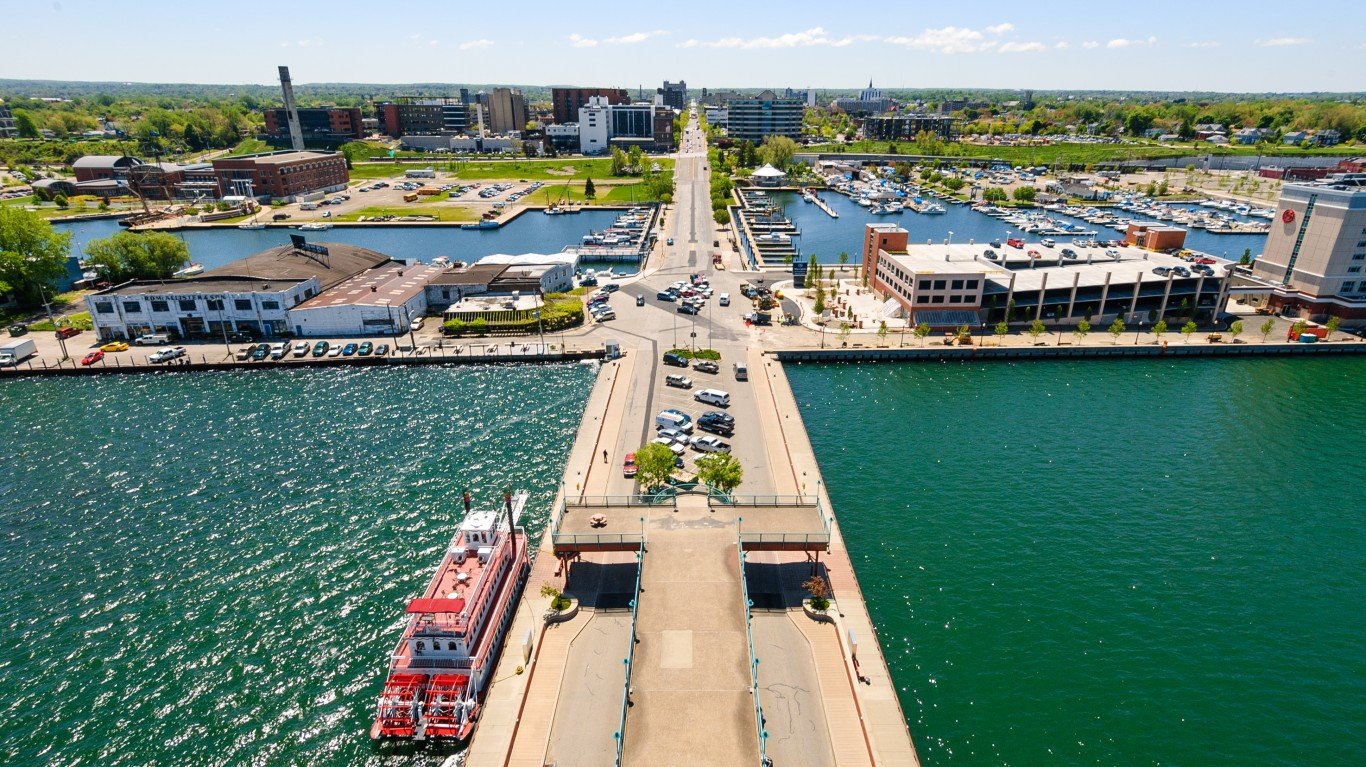
48. Erie, PA
> Confirmed COVID-19 cases as of July 15: 21,236
> Confirmed COVID-19 cases as of July 15 per 100,000 residents: 7,755.0
> Cumulative COVID-19 deaths as of July 15: 417
> Cumulative COVID-19 deaths as of July 15 per 100,000 residents: 152.3
> Population: 273,835
Source: Michael Warren / Getty Images
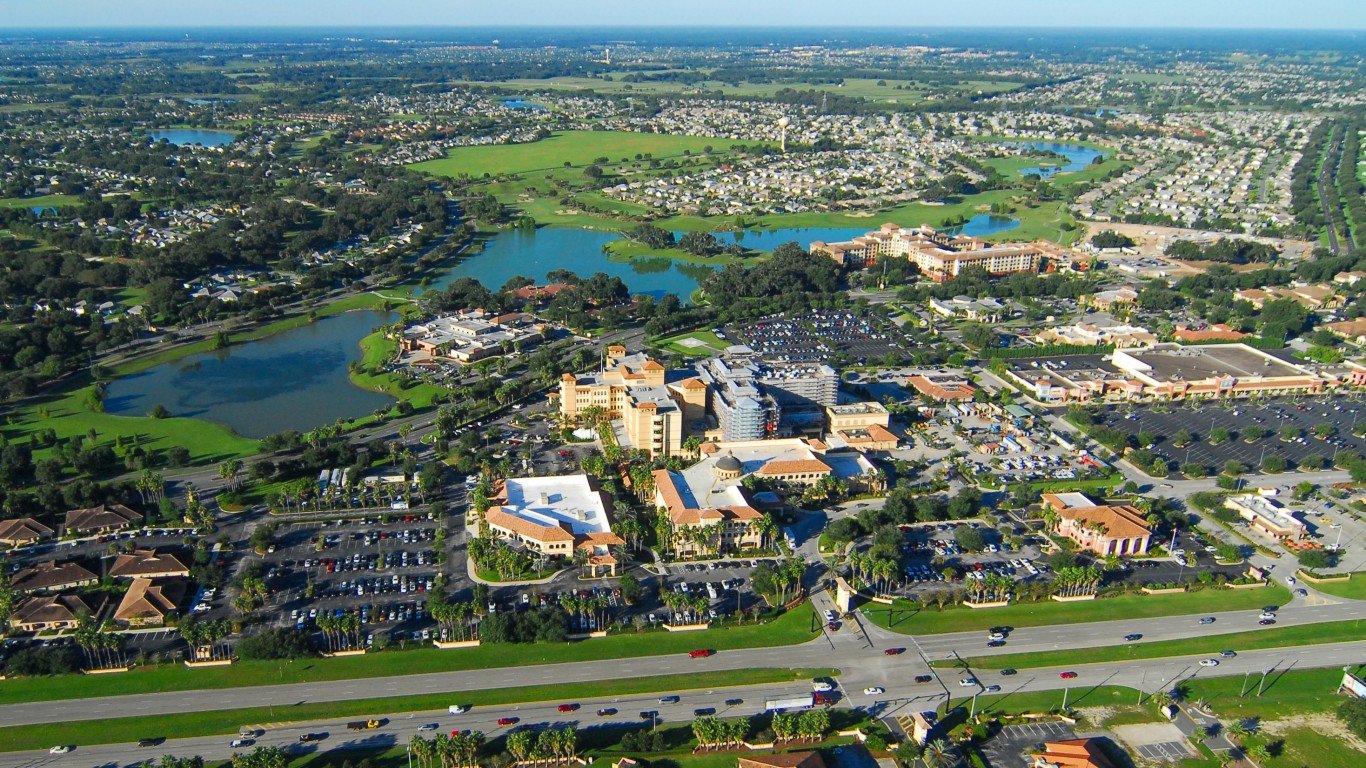
47. The Villages, FL
> Confirmed COVID-19 cases as of July 15: 9,676
> Confirmed COVID-19 cases as of July 15 per 100,000 residents: 7,738.1
> Cumulative COVID-19 deaths as of July 15: 284
> Cumulative COVID-19 deaths as of July 15 per 100,000 residents: 227.1
> Population: 125,044

Source: DEREK556 / Getty Images
46. Vallejo, CA
> Confirmed COVID-19 cases as of July 15: 34,149
> Confirmed COVID-19 cases as of July 15 per 100,000 residents: 7,729.0
> Cumulative COVID-19 deaths as of July 15: 268
> Cumulative COVID-19 deaths as of July 15 per 100,000 residents: 60.7
> Population: 441,829

Source: russokm1105 / Getty Images
45. San Luis Obispo-Paso Robles, CA
> Confirmed COVID-19 cases as of July 15: 21,518
> Confirmed COVID-19 cases as of July 15 per 100,000 residents: 7,626.0
> Cumulative COVID-19 deaths as of July 15: 261
> Cumulative COVID-19 deaths as of July 15 per 100,000 residents: 92.5
> Population: 282,165

Source: Sean Pavone / Getty Images
44. Asheville, NC
> Confirmed COVID-19 cases as of July 15: 34,563
> Confirmed COVID-19 cases as of July 15 per 100,000 residents: 7,607.1
> Cumulative COVID-19 deaths as of July 15: 633
> Cumulative COVID-19 deaths as of July 15 per 100,000 residents: 139.3
> Population: 454,351
Source: nlentz1 / iStock
43. Palm Bay-Melbourne-Titusville, FL
> Confirmed COVID-19 cases as of July 15: 44,447
> Confirmed COVID-19 cases as of July 15 per 100,000 residents: 7,591.2
> Cumulative COVID-19 deaths as of July 15: N/A
> Cumulative COVID-19 deaths as of July 15 per 100,000 residents: N/A
> Population: 585,507

Source: Sean Pavone / iStock via Getty Images
42. Washington-Arlington-Alexandria, DC-VA-MD-WV
> Confirmed COVID-19 cases as of July 15: 469,732
> Confirmed COVID-19 cases as of July 15 per 100,000 residents: 7,580.5
> Cumulative COVID-19 deaths as of July 15: 7,930
> Cumulative COVID-19 deaths as of July 15 per 100,000 residents: 128.0
> Population: 6,196,585
Click here to see all current COVID-19 data for Washington D.C.

Source: Sean Pavone / iStock via Getty Images
41. Baltimore-Columbia-Towson, MD
> Confirmed COVID-19 cases as of July 15: 211,754
> Confirmed COVID-19 cases as of July 15 per 100,000 residents: 7,571.5
> Cumulative COVID-19 deaths as of July 15: 4,467
> Cumulative COVID-19 deaths as of July 15 per 100,000 residents: 159.7
> Population: 2,796,733

Source: Photoladybug / Getty Images
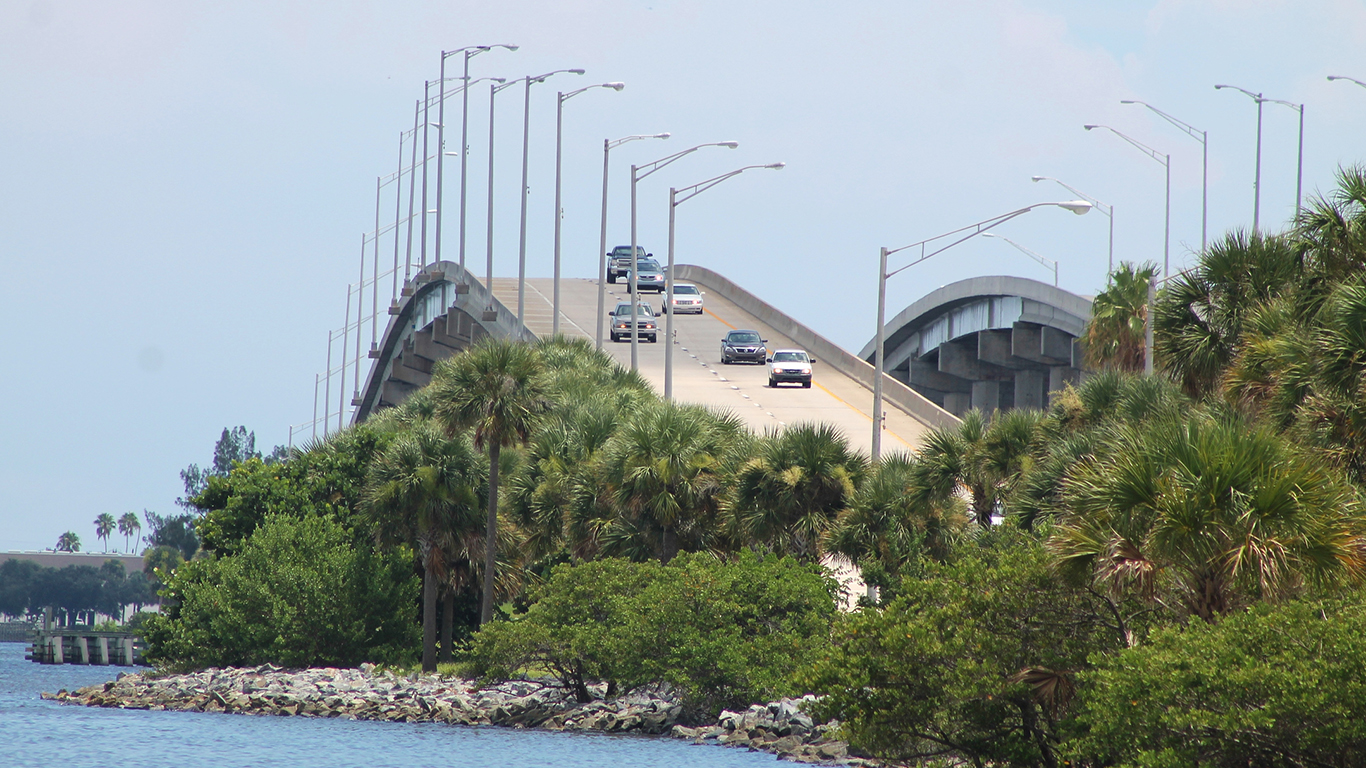
40. Punta Gorda, FL
> Confirmed COVID-19 cases as of July 15: 13,697
> Confirmed COVID-19 cases as of July 15 per 100,000 residents: 7,564.6
> Cumulative COVID-19 deaths as of July 15: 437
> Cumulative COVID-19 deaths as of July 15 per 100,000 residents: 241.3
> Population: 181,067

Source: SeanPavonePhoto / Getty Images
39. Albany-Schenectady-Troy, NY
> Confirmed COVID-19 cases as of July 15: 66,339
> Confirmed COVID-19 cases as of July 15 per 100,000 residents: 7,532.2
> Cumulative COVID-19 deaths as of July 15: 892
> Cumulative COVID-19 deaths as of July 15 per 100,000 residents: 101.3
> Population: 880,736

Source: beklaus / Getty Images
38. Boulder, CO
> Confirmed COVID-19 cases as of July 15: 24,087
> Confirmed COVID-19 cases as of July 15 per 100,000 residents: 7,468.6
> Cumulative COVID-19 deaths as of July 15: 236
> Cumulative COVID-19 deaths as of July 15 per 100,000 residents: 73.2
> Population: 322,510
Source: Davel5957 / Getty Images
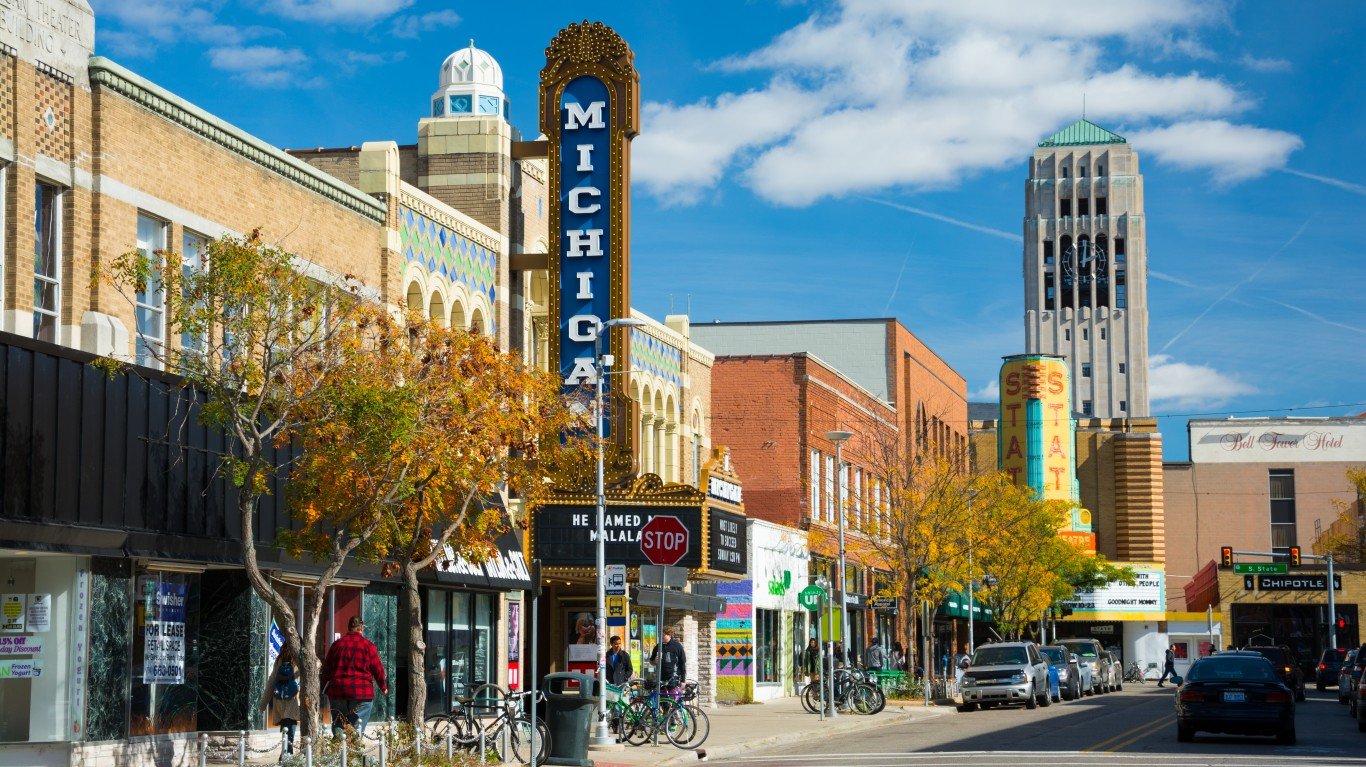
37. Ann Arbor, MI
> Confirmed COVID-19 cases as of July 15: 26,528
> Confirmed COVID-19 cases as of July 15 per 100,000 residents: 7,228.3
> Cumulative COVID-19 deaths as of July 15: 303
> Cumulative COVID-19 deaths as of July 15 per 100,000 residents: 82.6
> Population: 367,000

Source: latypova / Getty Images
36. Napa, CA
> Confirmed COVID-19 cases as of July 15: 10,081
> Confirmed COVID-19 cases as of July 15 per 100,000 residents: 7,220.2
> Cumulative COVID-19 deaths as of July 15: 81
> Cumulative COVID-19 deaths as of July 15 per 100,000 residents: 58.0
> Population: 139,623

Source: DenisTangneyJr / Getty Images
35. Santa Fe, NM
> Confirmed COVID-19 cases as of July 15: 10,656
> Confirmed COVID-19 cases as of July 15 per 100,000 residents: 7,137.6
> Cumulative COVID-19 deaths as of July 15: 151
> Cumulative COVID-19 deaths as of July 15 per 100,000 residents: 101.1
> Population: 149,293

Source: jgreesonarts / Getty Images
34. Redding, CA
> Confirmed COVID-19 cases as of July 15: 12,615
> Confirmed COVID-19 cases as of July 15 per 100,000 residents: 7,039.1
> Cumulative COVID-19 deaths as of July 15: 238
> Cumulative COVID-19 deaths as of July 15 per 100,000 residents: 132.8
> Population: 179,212

Source: DustyPixel / iStock via Getty Images
33. Sacramento-Roseville-Folsom, CA
> Confirmed COVID-19 cases as of July 15: 158,086
> Confirmed COVID-19 cases as of July 15 per 100,000 residents: 6,825.9
> Cumulative COVID-19 deaths as of July 15: 2,381
> Cumulative COVID-19 deaths as of July 15 per 100,000 residents: 102.8
> Population: 2,315,980

Source: svetlana57 / Getty Images
32. Salem, OR
> Confirmed COVID-19 cases as of July 15: 27,810
> Confirmed COVID-19 cases as of July 15 per 100,000 residents: 6,579.5
> Cumulative COVID-19 deaths as of July 15: 383
> Cumulative COVID-19 deaths as of July 15 per 100,000 residents: 90.6
> Population: 422,678
These are all the counties in Oregon where COVID-19 is slowing (and where it’s still getting worse).

Source: OlegAlbinsky / iStock via Getty Images
31. Barnstable Town, MA
> Confirmed COVID-19 cases as of July 15: 13,967
> Confirmed COVID-19 cases as of July 15 per 100,000 residents: 6,542.0
> Cumulative COVID-19 deaths as of July 15: 471
> Cumulative COVID-19 deaths as of July 15 per 100,000 residents: 220.6
> Population: 213,496
Source: littleny / Getty Images
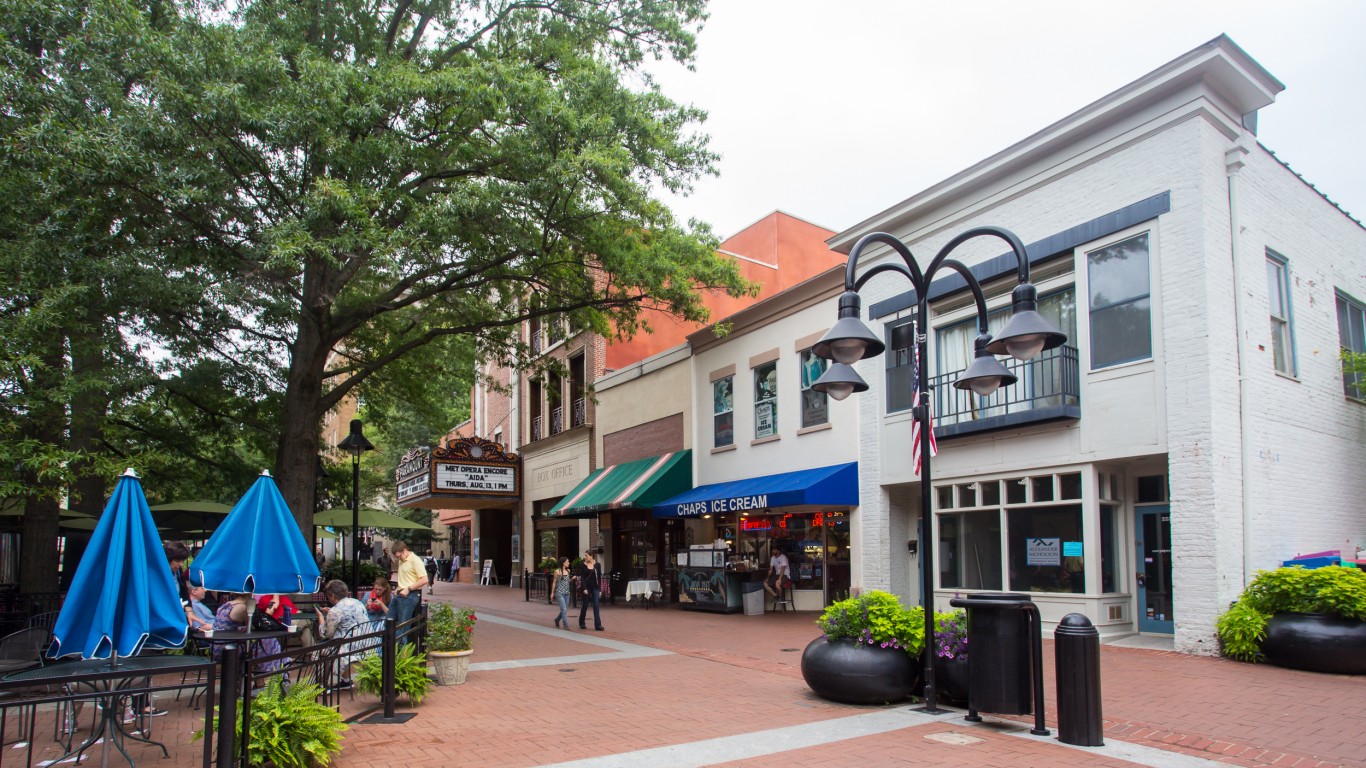
30. Charlottesville, VA
> Confirmed COVID-19 cases as of July 15: 14,007
> Confirmed COVID-19 cases as of July 15 per 100,000 residents: 6,501.4
> Cumulative COVID-19 deaths as of July 15: 193
> Cumulative COVID-19 deaths as of July 15 per 100,000 residents: 89.6
> Population: 215,445

29. Hinesville, GA
> Confirmed COVID-19 cases as of July 15: 5,083
> Confirmed COVID-19 cases as of July 15 per 100,000 residents: 6,350.5
> Cumulative COVID-19 deaths as of July 15: 81
> Cumulative COVID-19 deaths as of July 15 per 100,000 residents: 101.2
> Population: 80,041

Source: Bill_Dally / iStock via Getty Images
28. San Jose-Sunnyvale-Santa Clara, CA
> Confirmed COVID-19 cases as of July 15: 125,834
> Confirmed COVID-19 cases as of July 15 per 100,000 residents: 6,330.2
> Cumulative COVID-19 deaths as of July 15: 2,158
> Cumulative COVID-19 deaths as of July 15 per 100,000 residents: 108.6
> Population: 1,987,846

Source: svetlana57 / Getty Images
27. Longview, WA
> Confirmed COVID-19 cases as of July 15: 6,738
> Confirmed COVID-19 cases as of July 15 per 100,000 residents: 6,310.3
> Cumulative COVID-19 deaths as of July 15: 94
> Cumulative COVID-19 deaths as of July 15 per 100,000 residents: 88.0
> Population: 106,778

Source: Kenishirotie / Getty Images
26. Santa Rosa-Petaluma, CA
> Confirmed COVID-19 cases as of July 15: 31,270
> Confirmed COVID-19 cases as of July 15 per 100,000 residents: 6,256.9
> Cumulative COVID-19 deaths as of July 15: 319
> Cumulative COVID-19 deaths as of July 15 per 100,000 residents: 63.8
> Population: 499,772
Source: Public Domain / Wikimedia Commons
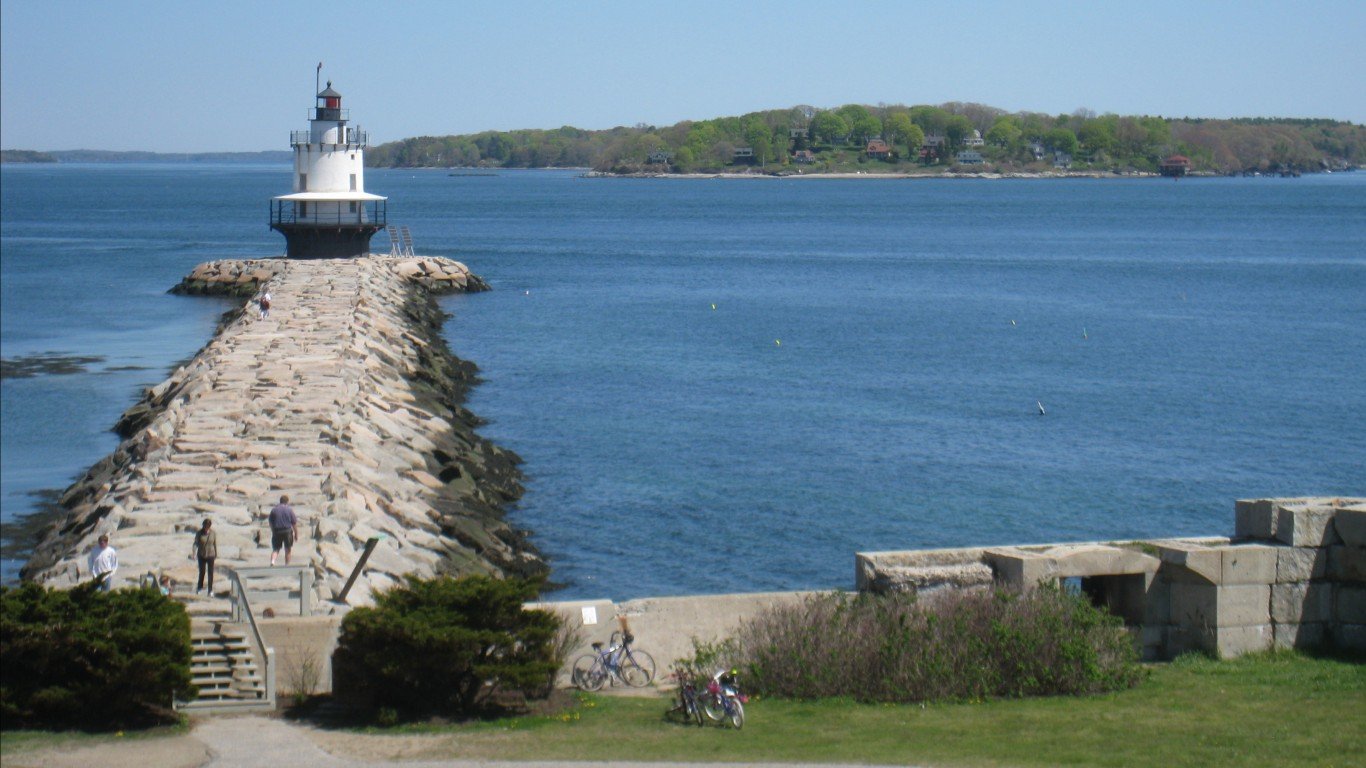
25. Portland-South Portland, ME
> Confirmed COVID-19 cases as of July 15: 32,314
> Confirmed COVID-19 cases as of July 15 per 100,000 residents: 6,073.2
> Cumulative COVID-19 deaths as of July 15: 346
> Cumulative COVID-19 deaths as of July 15 per 100,000 residents: 65.0
> Population: 532,075
These are all the counties in Maine where COVID-19 is slowing (and where it’s still getting worse).

Source: RoschetzkyIstockPhoto / iStock via Getty Images
24. Santa Cruz-Watsonville, CA
> Confirmed COVID-19 cases as of July 15: 16,306
> Confirmed COVID-19 cases as of July 15 per 100,000 residents: 5,951.9
> Cumulative COVID-19 deaths as of July 15: 208
> Cumulative COVID-19 deaths as of July 15 per 100,000 residents: 75.9
> Population: 273,962

Source: aguilar3137 / Getty Images
23. Chico, CA
> Confirmed COVID-19 cases as of July 15: 12,744
> Confirmed COVID-19 cases as of July 15 per 100,000 residents: 5,643.5
> Cumulative COVID-19 deaths as of July 15: 201
> Cumulative COVID-19 deaths as of July 15 per 100,000 residents: 89.0
> Population: 225,817

22. Watertown-Fort Drum, NY
> Confirmed COVID-19 cases as of July 15: 6,192
> Confirmed COVID-19 cases as of July 15 per 100,000 residents: 5,487.3
> Cumulative COVID-19 deaths as of July 15: 68
> Cumulative COVID-19 deaths as of July 15 per 100,000 residents: 60.3
> Population: 112,842

Source: bluejayphoto / iStock via Getty Images
21. San Francisco-Oakland-Berkeley, CA
> Confirmed COVID-19 cases as of July 15: 256,752
> Confirmed COVID-19 cases as of July 15 per 100,000 residents: 5,461.3
> Cumulative COVID-19 deaths as of July 15: 3,461
> Cumulative COVID-19 deaths as of July 15 per 100,000 residents: 73.6
> Population: 4,701,332

Source: JamesBrey / Getty Images
20. Bend, OR
> Confirmed COVID-19 cases as of July 15: 10,157
> Confirmed COVID-19 cases as of July 15 per 100,000 residents: 5,453.4
> Cumulative COVID-19 deaths as of July 15: 82
> Cumulative COVID-19 deaths as of July 15 per 100,000 residents: 44.0
> Population: 186,251
These are all the counties in Oregon where COVID-19 is slowing (and where it’s still getting worse).

Source: aiisha5 / iStock via Getty Images
19. Seattle-Tacoma-Bellevue, WA
> Confirmed COVID-19 cases as of July 15: 210,781
> Confirmed COVID-19 cases as of July 15 per 100,000 residents: 5,444.7
> Cumulative COVID-19 deaths as of July 15: 2,928
> Cumulative COVID-19 deaths as of July 15 per 100,000 residents: 75.6
> Population: 3,871,323

Source: Ashley Freiheit / Getty Images
18. Glens Falls, NY
> Confirmed COVID-19 cases as of July 15: 6,850
> Confirmed COVID-19 cases as of July 15 per 100,000 residents: 5,441.2
> Cumulative COVID-19 deaths as of July 15: 113
> Cumulative COVID-19 deaths as of July 15 per 100,000 residents: 89.8
> Population: 125,892
_along_the_border_of_Solomons,_Calvert_County,_Maryland_and_California,_St._Mary%27s_County,_Maryland_just_before_sunset.jpg "View northwest up the Patuxent River... by Famartin")
17. California-Lexington Park, MD
> Confirmed COVID-19 cases as of July 15: 6,071
> Confirmed COVID-19 cases as of July 15 per 100,000 residents: 5,406.5
> Cumulative COVID-19 deaths as of July 15: 132
> Cumulative COVID-19 deaths as of July 15 per 100,000 residents: 117.6
> Population: 112,290

Source: Grant Wylie / Getty Images
16. Medford, OR
> Confirmed COVID-19 cases as of July 15: 11,707
> Confirmed COVID-19 cases as of July 15 per 100,000 residents: 5,405.5
> Cumulative COVID-19 deaths as of July 15: 148
> Cumulative COVID-19 deaths as of July 15 per 100,000 residents: 68.3
> Population: 216,574
These are all the counties in Oregon where COVID-19 is slowing (and where it’s still getting worse).

Source: DenisTangneyJr / Getty Images
15. Pittsfield, MA
> Confirmed COVID-19 cases as of July 15: 6,573
> Confirmed COVID-19 cases as of July 15 per 100,000 residents: 5,199.1
> Cumulative COVID-19 deaths as of July 15: 288
> Cumulative COVID-19 deaths as of July 15 per 100,000 residents: 227.8
> Population: 126,425

Source: Sean Pavone / iStock via Getty Images
14. Portland-Vancouver-Hillsboro, OR-WA
> Confirmed COVID-19 cases as of July 15: 120,245
> Confirmed COVID-19 cases as of July 15 per 100,000 residents: 4,916.5
> Cumulative COVID-19 deaths as of July 15: 1,506
> Cumulative COVID-19 deaths as of July 15 per 100,000 residents: 61.6
> Population: 2,445,761
These are all the counties in Oregon where COVID-19 is slowing (and where it’s still getting worse).

13. Mount Vernon-Anacortes, WA
> Confirmed COVID-19 cases as of July 15: 6,067
> Confirmed COVID-19 cases as of July 15 per 100,000 residents: 4,830.0
> Cumulative COVID-19 deaths as of July 15: 77
> Cumulative COVID-19 deaths as of July 15 per 100,000 residents: 61.3
> Population: 125,612
Source: GarysFRP / Getty Images
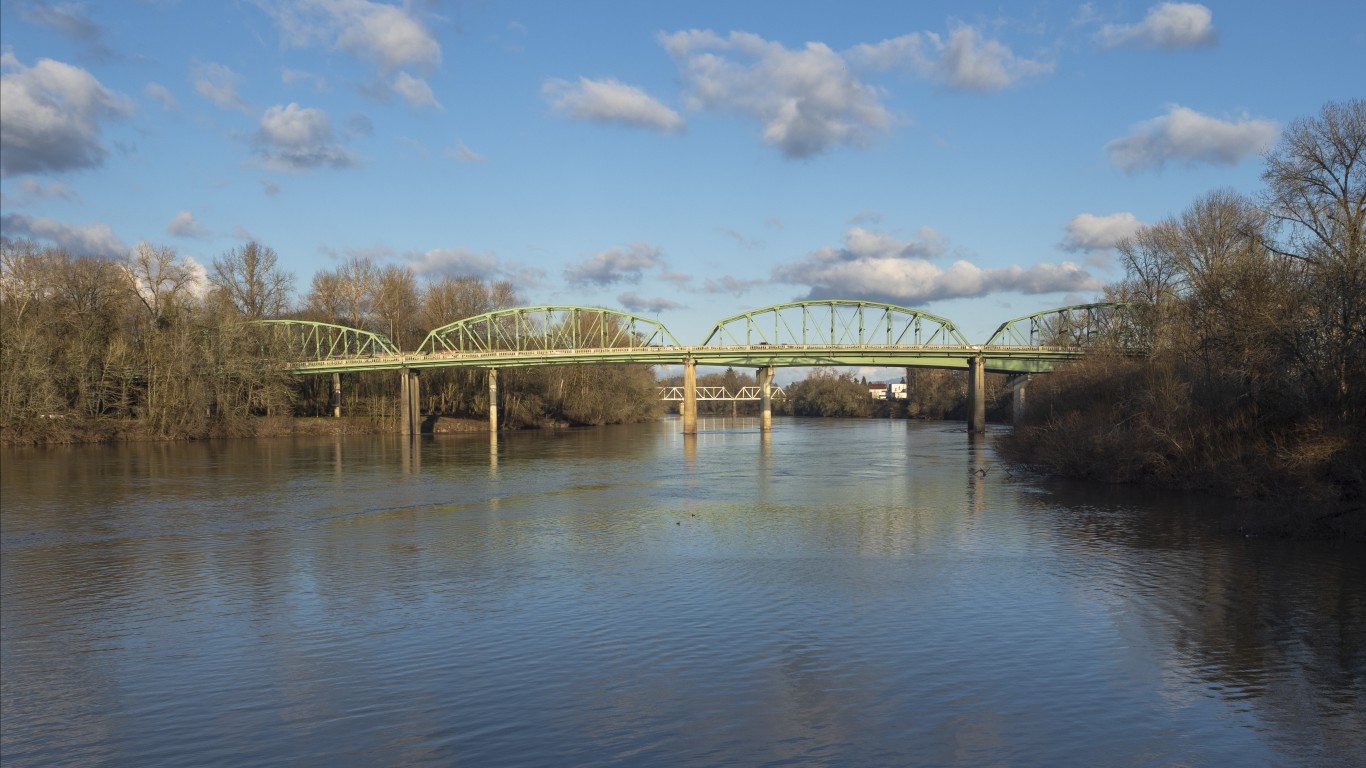
12. Albany-Lebanon, OR
> Confirmed COVID-19 cases as of July 15: 5,814
> Confirmed COVID-19 cases as of July 15 per 100,000 residents: 4,649.4
> Cumulative COVID-19 deaths as of July 15: 81
> Cumulative COVID-19 deaths as of July 15 per 100,000 residents: 64.8
> Population: 125,048
These are all the counties in Oregon where COVID-19 is slowing (and where it’s still getting worse).

Source: SEASTOCK / Getty Images
11. Bellingham, WA
> Confirmed COVID-19 cases as of July 15: 9,968
> Confirmed COVID-19 cases as of July 15 per 100,000 residents: 4,514.1
> Cumulative COVID-19 deaths as of July 15: 104
> Cumulative COVID-19 deaths as of July 15 per 100,000 residents: 47.1
> Population: 220,821

Source: Sean Pavone / iStock via Getty Images
10. Burlington-South Burlington, VT
> Confirmed COVID-19 cases as of July 15: 9,805
> Confirmed COVID-19 cases as of July 15 per 100,000 residents: 4,481.6
> Cumulative COVID-19 deaths as of July 15: 147
> Cumulative COVID-19 deaths as of July 15 per 100,000 residents: 67.2
> Population: 218,784

9. Grants Pass, OR
> Confirmed COVID-19 cases as of July 15: 3,696
> Confirmed COVID-19 cases as of July 15 per 100,000 residents: 4,285.2
> Cumulative COVID-19 deaths as of July 15: 73
> Cumulative COVID-19 deaths as of July 15 per 100,000 residents: 84.6
> Population: 86,251
These are all the counties in Oregon where COVID-19 is slowing (and where it’s still getting worse).

Source: benedek / Getty Images
8. Ithaca, NY
> Confirmed COVID-19 cases as of July 15: 4,365
> Confirmed COVID-19 cases as of July 15 per 100,000 residents: 4,252.6
> Cumulative COVID-19 deaths as of July 15: 52
> Cumulative COVID-19 deaths as of July 15 per 100,000 residents: 50.7
> Population: 102,642

Source: DenisTangneyJr / Getty Images
7. Bangor, ME
> Confirmed COVID-19 cases as of July 15: 6,367
> Confirmed COVID-19 cases as of July 15 per 100,000 residents: 4,195.1
> Cumulative COVID-19 deaths as of July 15: 99
> Cumulative COVID-19 deaths as of July 15 per 100,000 residents: 65.2
> Population: 151,774
These are all the counties in Maine where COVID-19 is slowing (and where it’s still getting worse).

Source: Sean Pavone / Getty Images
6. Olympia-Lacey-Tumwater, WA
> Confirmed COVID-19 cases as of July 15: 11,172
> Confirmed COVID-19 cases as of July 15 per 100,000 residents: 3,994.1
> Cumulative COVID-19 deaths as of July 15: 114
> Cumulative COVID-19 deaths as of July 15 per 100,000 residents: 40.8
> Population: 279,711

Source: Sean Pavone / Getty Images
5. Eugene-Springfield, OR
> Confirmed COVID-19 cases as of July 15: 14,125
> Confirmed COVID-19 cases as of July 15 per 100,000 residents: 3,783.4
> Cumulative COVID-19 deaths as of July 15: 169
> Cumulative COVID-19 deaths as of July 15 per 100,000 residents: 45.3
> Population: 373,340
These are all the counties in Oregon where COVID-19 is slowing (and where it’s still getting worse).

Source: rssfhs / Getty Images
4. Corvallis, OR
> Confirmed COVID-19 cases as of July 15: 3,296
> Confirmed COVID-19 cases as of July 15 per 100,000 residents: 3,617.7
> Cumulative COVID-19 deaths as of July 15: 22
> Cumulative COVID-19 deaths as of July 15 per 100,000 residents: 24.1
> Population: 91,107
These are all the counties in Oregon where COVID-19 is slowing (and where it’s still getting worse).

Source: jmoor17 / Getty Images
3. Bremerton-Silverdale-Port Orchard, WA
> Confirmed COVID-19 cases as of July 15: 8,896
> Confirmed COVID-19 cases as of July 15 per 100,000 residents: 3,345.8
> Cumulative COVID-19 deaths as of July 15: 118
> Cumulative COVID-19 deaths as of July 15 per 100,000 residents: 44.4
> Population: 265,882

Source: 7Michael / iStock via Getty Images
2. Kahului-Wailuku-Lahaina, HI
> Confirmed COVID-19 cases as of July 15: 4,913
> Confirmed COVID-19 cases as of July 15 per 100,000 residents: 2,960.0
> Cumulative COVID-19 deaths as of July 15: 57
> Cumulative COVID-19 deaths as of July 15 per 100,000 residents: 34.3
> Population: 165,979
These are all the counties in Hawaii where COVID-19 is slowing (and where it’s still getting worse).

Source: sorincolac / Getty Images
1. Urban Honolulu, HI
> Confirmed COVID-19 cases as of July 15: 28,103
> Confirmed COVID-19 cases as of July 15 per 100,000 residents: 2,853.6
> Cumulative COVID-19 deaths as of July 15: 401
> Cumulative COVID-19 deaths as of July 15 per 100,000 residents: 40.7
> Population: 984,821
These are all the counties in Hawaii where COVID-19 is slowing (and where it’s still getting worse).
Click here to see all coronavirus data for every state.
Essential Tips for Investing: Sponsored
A financial advisor can help you understand the advantages and disadvantages of investment properties. Finding a qualified financial advisor doesn’t have to be hard. SmartAsset’s free tool matches you with up to three financial advisors who serve your area, and you can interview your advisor matches at no cost to decide which one is right for you. If you’re ready to find an advisor who can help you achieve your financial goals, get started now.
Investing in real estate can diversify your portfolio. But expanding your horizons may add additional costs. If you’re an investor looking to minimize expenses, consider checking out online brokerages. They often offer low investment fees, helping you maximize your profit.
Thank you for reading! Have some feedback for us?
Contact the 24/7 Wall St. editorial team.
Editors' Picks


