
The U.S. has reported more than 33.4 million confirmed COVID-19 cases as of July 15, 2021. More than 600,000 Americans have died of COVID-19 — the highest death toll of any country.
The virus has spread throughout the country in a way that has been difficult to predict, surging in one region, then showing signs of improvement, and then reappearing in other regions. Though local outbreaks may ebb and flow, the current surge in cases has been felt nearly nationwide, leading to new travel restrictions and business closures around the country.
Nationwide, there were an average of 4.2 daily new coronavirus cases per 100,000 Americans in the week ending Jul 15, 2021. Cumulatively, the U.S. has reported 10,224.7 cases per 100,000 Americans, and 183.8 deaths per 100,000 Americans.
The extent of the spread of the novel coronavirus continues to vary considerably from state to state, and even from county to county. Even as the number of daily new cases is flattening or even declining in some parts of the country, new cases are surging at a growing rate in others.
The nation’s worst COVID-19 hot spot is in Louisiana. In Franklin Parish, there were an average of 190.9 daily new coronavirus cases per 100,000 Americans in the week ending Jul 15, 2021 — more than 45.0 times greater than the national case growth rate and the most of any county in the country.
Other national hot spots include Jasper County, Iowa; Dimmit County, Texas; and Cimarron County, Oklahoma. Case growth in these counties range from 109.3 daily new cases per 100,000 residents to 78.3 daily new cases per 100,000.
To determine the county in each state with the highest rate of daily cases of the virus, 24/7 Wall St. compiled and reviewed data from state and local health departments. We ranked counties according to the average new number of cases per 100,000 residents per day during the week ending Jul 15, 2021. Population data used to adjust case and death totals came from the U.S. Census Bureau’s 2018 American Community Survey and are five-year estimates.

Source: BOB WESTON / iStock via Getty Images
Alabama: Covington County
> Avg. new daily cases in Covington County in week ending Jul 15, 2021: 13.4 per 100,000
> Cumulative confirmed COVID-19 cases in Covington County as of Jul 15, 2021: 4,338 (11,614.1 per 100,000)
> Cumulative confirmed COVID-19 deaths in Covington County as of Jul 15, 2021: 125 (334.7 per 100,000)
> Population: 37,351
> Largest place in Covington County: Andalusia

Source: filo / E+ via Getty Images
Alaska: Sitka City and Borough
> Avg. new daily cases in Sitka City and Borough in week ending Jul 15, 2021: 15.2 per 100,000
> Cumulative confirmed COVID-19 cases in Sitka City and Borough as of Jul 15, 2021: 390 (4,463.3 per 100,000)
> Cumulative confirmed COVID-19 deaths in Sitka City and Borough as of Jul 15, 2021: 2 (22.9 per 100,000)
> Population: 8,738
> Largest place in Sitka City and Borough: Sitka
These are all the counties in Alaska where COVID-19 is slowing (and where it’s still getting worse).

Arizona: Mohave County
> Avg. new daily cases in Mohave County in week ending Jul 15, 2021: 14.2 per 100,000
> Cumulative confirmed COVID-19 cases in Mohave County as of Jul 15, 2021: 24,013 (11,653.2 per 100,000)
> Cumulative confirmed COVID-19 deaths in Mohave County as of Jul 15, 2021: 759 (368.3 per 100,000)
> Population: 206,064
> Largest place in Mohave County: Lake Havasu City

Arkansas: Dallas County
> Avg. new daily cases in Dallas County in week ending Jul 15, 2021: 73.6 per 100,000
> Cumulative confirmed COVID-19 cases in Dallas County as of Jul 15, 2021: 828 (11,141.0 per 100,000)
> Cumulative confirmed COVID-19 deaths in Dallas County as of Jul 15, 2021: 16 (215.3 per 100,000)
> Population: 7,432
> Largest place in Dallas County: Fordyce

Source: alacatr / iStock via Getty Images
California: Lake County
> Avg. new daily cases in Lake County in week ending Jul 15, 2021: 12.6 per 100,000
> Cumulative confirmed COVID-19 cases in Lake County as of Jul 15, 2021: 3,659 (5,704.0 per 100,000)
> Cumulative confirmed COVID-19 deaths in Lake County as of Jul 15, 2021: 63 (98.2 per 100,000)
> Population: 64,148
> Largest place in Lake County: Clearlake

Colorado: Moffat County
> Avg. new daily cases in Moffat County in week ending Jul 15, 2021: 41.9 per 100,000
> Cumulative confirmed COVID-19 cases in Moffat County as of Jul 15, 2021: 1,062 (8,131.7 per 100,000)
> Cumulative confirmed COVID-19 deaths in Moffat County as of Jul 15, 2021: 26 (199.1 per 100,000)
> Population: 13,060
> Largest place in Moffat County: Craig

Source: pabradyphoto / iStock via Getty Images
Connecticut: New Haven County
> Avg. new daily cases in New Haven County in week ending Jul 15, 2021: 1.9 per 100,000
> Cumulative confirmed COVID-19 cases in New Haven County as of Jul 15, 2021: 92,519 (10,766.3 per 100,000)
> Cumulative confirmed COVID-19 deaths in New Haven County as of Jul 15, 2021: 2,132 (248.1 per 100,000)
> Population: 859,339
> Largest place in New Haven County: New Haven

Source: David Osberg / Getty Images
Delaware: Kent County
> Avg. new daily cases in Kent County in week ending Jul 15, 2021: 2.3 per 100,000
> Cumulative confirmed COVID-19 cases in Kent County as of Jul 15, 2021: 18,272 (10,451.8 per 100,000)
> Cumulative confirmed COVID-19 deaths in Kent County as of Jul 15, 2021: 349 (199.6 per 100,000)
> Population: 174,822
> Largest place in Kent County: Dover

Source: Public Domain / Wikimedia Commons
Florida: Baker County
> Avg. new daily cases in Baker County in week ending Jul 15, 2021: 20.6 per 100,000
> Cumulative confirmed COVID-19 cases in Baker County as of Jul 15, 2021: 3,682 (13,251.8 per 100,000)
> Cumulative confirmed COVID-19 deaths in Baker County as of Jul 15, 2021: 62 (223.1 per 100,000)
> Population: 27,785
> Largest place in Baker County: Macclenny

Source: Jacqueline Nix / iStock Editorial via Getty Images
Georgia: Stewart County
> Avg. new daily cases in Stewart County in week ending Jul 15, 2021: 40.2 per 100,000
> Cumulative confirmed COVID-19 cases in Stewart County as of Jul 15, 2021: 1,069 (17,692.8 per 100,000)
> Cumulative confirmed COVID-19 deaths in Stewart County as of Jul 15, 2021: 25 (413.8 per 100,000)
> Population: 6,042
> Largest place in Stewart County: Richland

Source: ademyan / Getty Images
Hawaii: Kauai County
> Avg. new daily cases in Kauai County in week ending Jul 15, 2021: 4.8 per 100,000
> Cumulative confirmed COVID-19 cases in Kauai County as of Jul 15, 2021: 394 (552.0 per 100,000)
> Cumulative confirmed COVID-19 deaths in Kauai County as of Jul 15, 2021: 2 (2.8 per 100,000)
> Population: 71,377
> Largest place in Kauai County: Kapaa
These are all the counties in Hawaii where COVID-19 is slowing (and where it’s still getting worse).

Idaho: Gem County
> Avg. new daily cases in Gem County in week ending Jul 15, 2021: 10.9 per 100,000
> Cumulative confirmed COVID-19 cases in Gem County as of Jul 15, 2021: 1,857 (10,890.2 per 100,000)
> Cumulative confirmed COVID-19 deaths in Gem County as of Jul 15, 2021: 40 (234.6 per 100,000)
> Population: 17,052
> Largest place in Gem County: Emmett
These are all the counties in Idaho where COVID-19 is slowing (and where it’s still getting worse).

Source: Scott Olson / Getty Images News via Getty Images
Illinois: Wabash County
> Avg. new daily cases in Wabash County in week ending Jul 15, 2021: 22.7 per 100,000
> Cumulative confirmed COVID-19 cases in Wabash County as of Jul 15, 2021: 1,392 (12,028.0 per 100,000)
> Cumulative confirmed COVID-19 deaths in Wabash County as of Jul 15, 2021: 12 (103.7 per 100,000)
> Population: 11,573
> Largest place in Wabash County: Mount Carmel
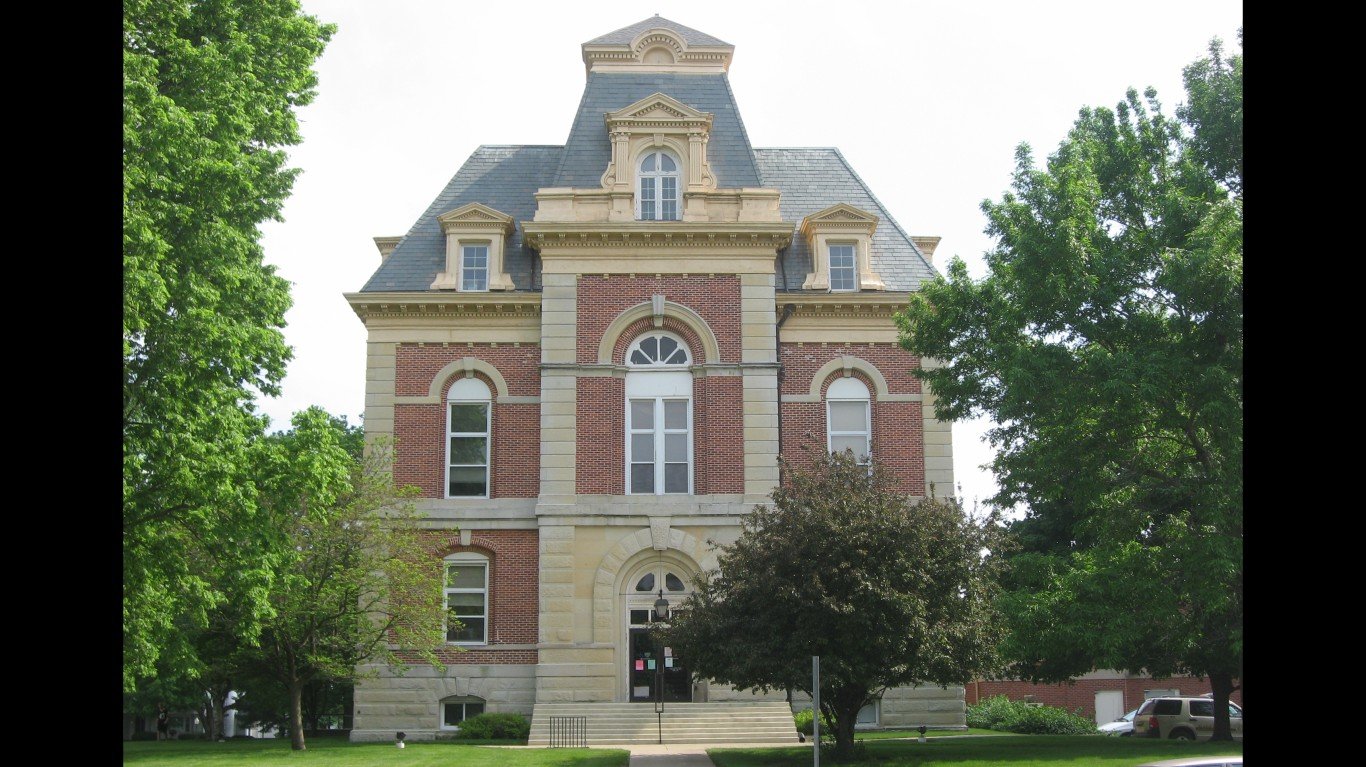
Source: Public Domain / Wikimedia Commons
Indiana: Benton County
> Avg. new daily cases in Benton County in week ending Jul 15, 2021: 41.0 per 100,000
> Cumulative confirmed COVID-19 cases in Benton County as of Jul 15, 2021: 1,073 (12,380.3 per 100,000)
> Cumulative confirmed COVID-19 deaths in Benton County as of Jul 15, 2021: 14 (161.5 per 100,000)
> Population: 8,667
> Largest place in Benton County: Fowler

Iowa: Jasper County
> Avg. new daily cases in Jasper County in week ending Jul 15, 2021: 109.3 per 100,000
> Cumulative confirmed COVID-19 cases in Jasper County as of Jul 15, 2021: 4,501 (12,200.8 per 100,000)
> Cumulative confirmed COVID-19 deaths in Jasper County as of Jul 15, 2021: 73 (197.9 per 100,000)
> Population: 36,891
> Largest place in Jasper County: Newton
These are all the counties in Iowa where COVID-19 is slowing (and where it’s still getting worse).

Source: Different_Brian / iStock via Getty Images
Kansas: Gray County
> Avg. new daily cases in Gray County in week ending Jul 15, 2021: 59.5 per 100,000
> Cumulative confirmed COVID-19 cases in Gray County as of Jul 15, 2021: 614 (10,170.6 per 100,000)
> Cumulative confirmed COVID-19 deaths in Gray County as of Jul 15, 2021: N/A (N/A per 100,000)
> Population: 6,037
> Largest place in Gray County: Cimarron
These are all the counties in Kansas where COVID-19 is slowing (and where it’s still getting worse).

Source: BOB WESTON / Getty Images
Kentucky: Livingston County
> Avg. new daily cases in Livingston County in week ending Jul 15, 2021: 15.0 per 100,000
> Cumulative confirmed COVID-19 cases in Livingston County as of Jul 15, 2021: 898 (9,694.5 per 100,000)
> Cumulative confirmed COVID-19 deaths in Livingston County as of Jul 15, 2021: 25 (269.9 per 100,000)
> Population: 9,263
> Largest place in Livingston County: Ledbetter
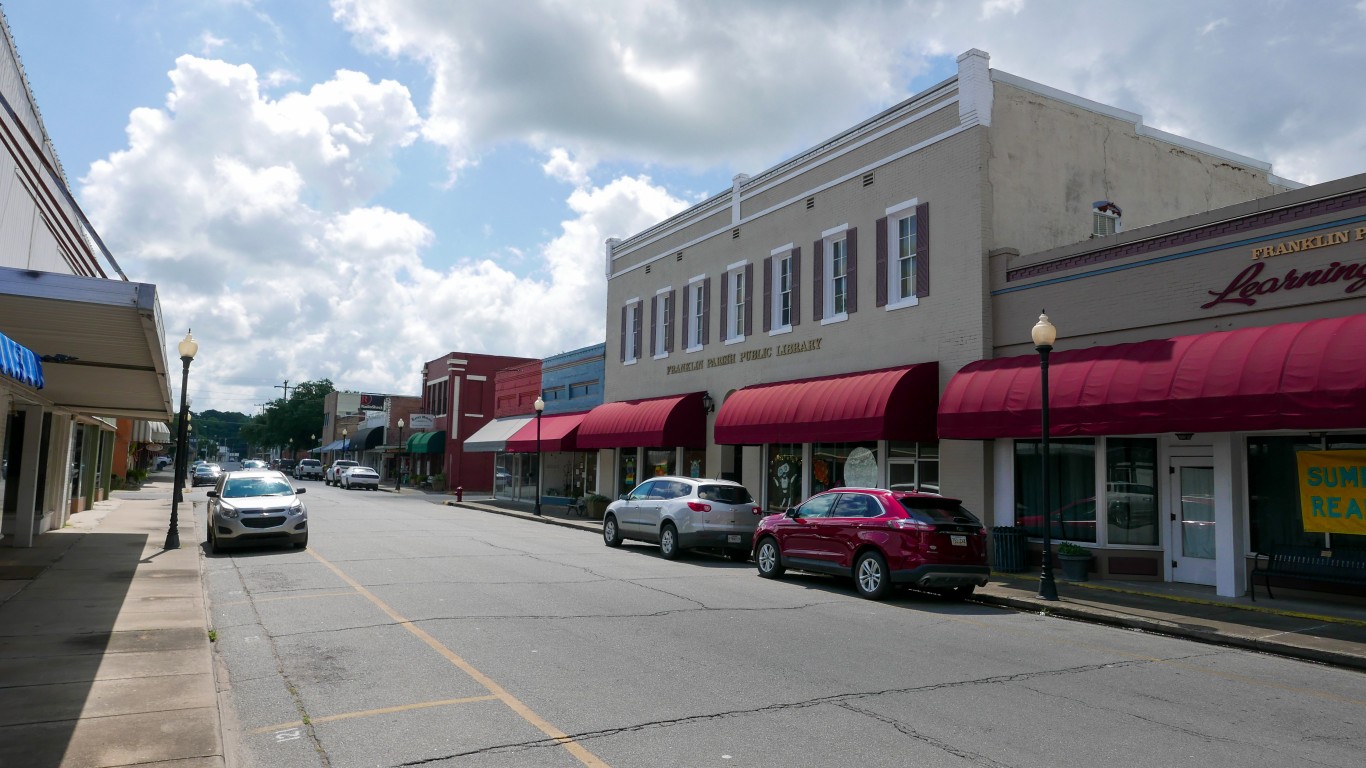
Source: Robin Zeigler / iStock Editorial via Getty Images
Louisiana: Franklin Parish
> Avg. new daily cases in Franklin Parish in week ending Jul 15, 2021: 190.9 per 100,000
> Cumulative confirmed COVID-19 cases in Franklin Parish as of Jul 15, 2021: 2,844 (13,994.7 per 100,000)
> Cumulative confirmed COVID-19 deaths in Franklin Parish as of Jul 15, 2021: 107 (526.5 per 100,000)
> Population: 20,322
> Largest place in Franklin Parish: Winnsboro

Source: DenisTangneyJr / iStock via Getty Images
Maine: Androscoggin County
> Avg. new daily cases in Androscoggin County in week ending Jul 15, 2021: 2.8 per 100,000
> Cumulative confirmed COVID-19 cases in Androscoggin County as of Jul 15, 2021: 8,436 (7,851.5 per 100,000)
> Cumulative confirmed COVID-19 deaths in Androscoggin County as of Jul 15, 2021: 86 (80.0 per 100,000)
> Population: 107,444
> Largest place in Androscoggin County: Lewiston
These are all the counties in Maine where COVID-19 is slowing (and where it’s still getting worse).

Source: Delmas Lehman / iStock Editorial via Getty Images
Maryland: Cecil County
> Avg. new daily cases in Cecil County in week ending Jul 15, 2021: 2.4 per 100,000
> Cumulative confirmed COVID-19 cases in Cecil County as of Jul 15, 2021: 6,364 (6,207.8 per 100,000)
> Cumulative confirmed COVID-19 deaths in Cecil County as of Jul 15, 2021: 152 (148.3 per 100,000)
> Population: 102,517
> Largest place in Cecil County: Elkton
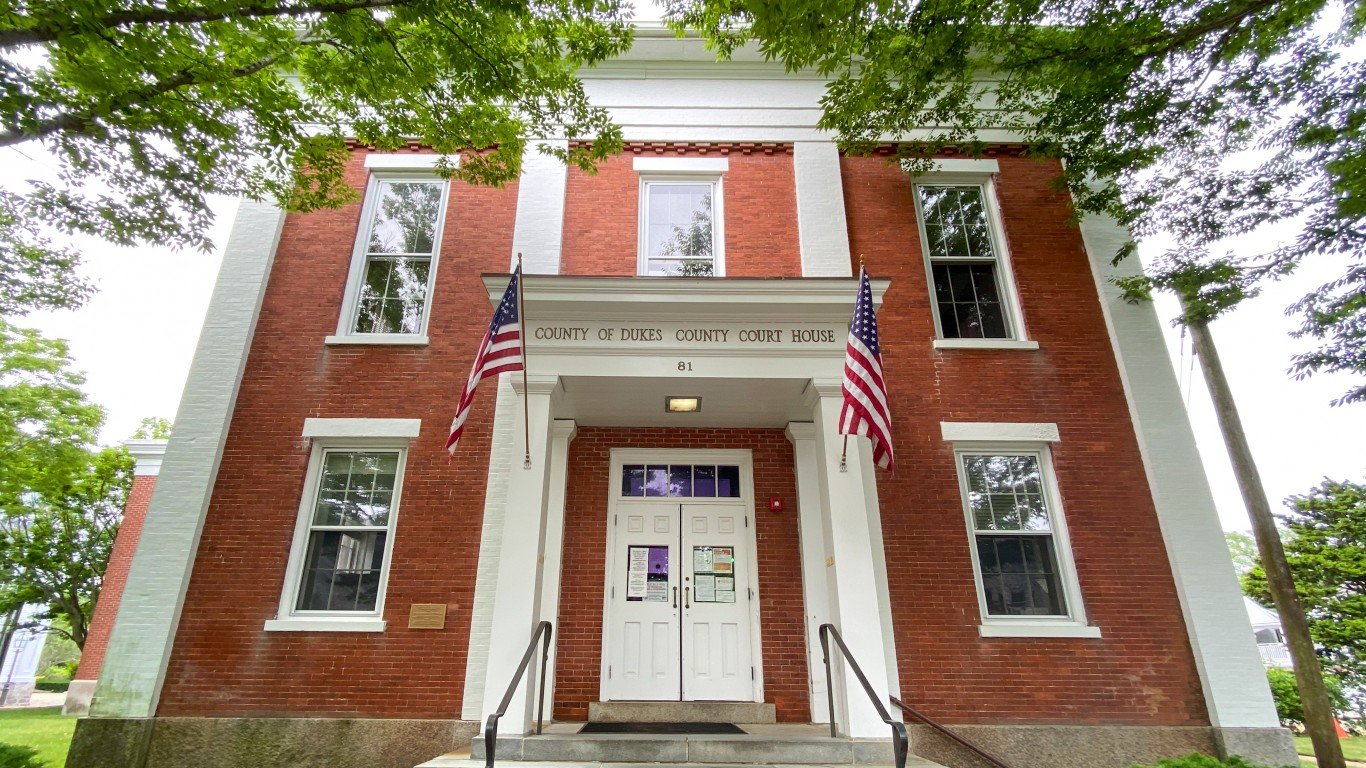
Source: demerzel21 / iStock via Getty Images
Massachusetts: Dukes County
> Avg. new daily cases in Dukes County in week ending Jul 15, 2021: 3.1 per 100,000
> Cumulative confirmed COVID-19 cases in Dukes County as of Jul 15, 2021: 1,418 (8,190.4 per 100,000)
> Cumulative confirmed COVID-19 deaths in Dukes County as of Jul 15, 2021: 0 (0.0 per 100,000)
> Population: 17,313
> Largest place in Dukes County: Vineyard Haven

Source: groveb / iStock via Getty Images
Michigan: Gogebic County
> Avg. new daily cases in Gogebic County in week ending Jul 15, 2021: 4.6 per 100,000
> Cumulative confirmed COVID-19 cases in Gogebic County as of Jul 15, 2021: 1,411 (9,154.0 per 100,000)
> Cumulative confirmed COVID-19 deaths in Gogebic County as of Jul 15, 2021: 52 (337.4 per 100,000)
> Population: 15,414
> Largest place in Gogebic County: Ironwood

Minnesota: Lac qui Parle County
> Avg. new daily cases in Lac qui Parle County in week ending Jul 15, 2021: 7.8 per 100,000
> Cumulative confirmed COVID-19 cases in Lac qui Parle County as of Jul 15, 2021: 760 (11,221.0 per 100,000)
> Cumulative confirmed COVID-19 deaths in Lac qui Parle County as of Jul 15, 2021: 22 (324.8 per 100,000)
> Population: 6,773
> Largest place in Lac qui Parle County: Dawson

Source: thenationalguard / Flickr
Mississippi: Stone County
> Avg. new daily cases in Stone County in week ending Jul 15, 2021: 24.3 per 100,000
> Cumulative confirmed COVID-19 cases in Stone County as of Jul 15, 2021: 1,947 (10,595.9 per 100,000)
> Cumulative confirmed COVID-19 deaths in Stone County as of Jul 15, 2021: 35 (190.5 per 100,000)
> Population: 18,375
> Largest place in Stone County: Wiggins

Source: DenisTangneyJr / iStock via Getty Images
Missouri: Taney County
> Avg. new daily cases in Taney County in week ending Jul 15, 2021: 49.9 per 100,000
> Cumulative confirmed COVID-19 cases in Taney County as of Jul 15, 2021: 6,322 (11,553.4 per 100,000)
> Cumulative confirmed COVID-19 deaths in Taney County as of Jul 15, 2021: 103 (188.2 per 100,000)
> Population: 54,720
> Largest place in Taney County: Branson
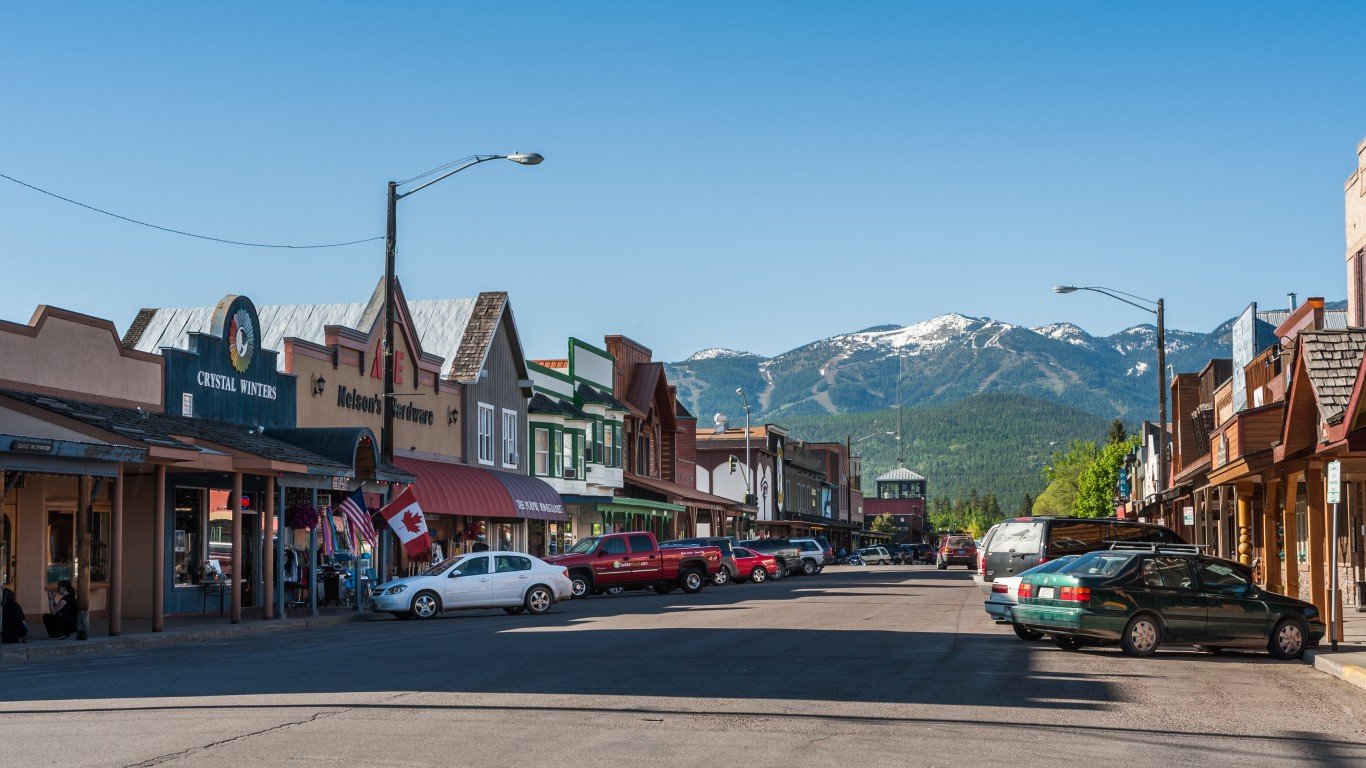
Source: Pierdelune / iStock Editorial via Getty Images
Montana: Flathead County
> Avg. new daily cases in Flathead County in week ending Jul 15, 2021: 8.9 per 100,000
> Cumulative confirmed COVID-19 cases in Flathead County as of Jul 15, 2021: 12,505 (12,749.5 per 100,000)
> Cumulative confirmed COVID-19 deaths in Flathead County as of Jul 15, 2021: 103 (105.0 per 100,000)
> Population: 98,082
> Largest place in Flathead County: Kalispell
Source: Public Domain / Wikimedia Commons
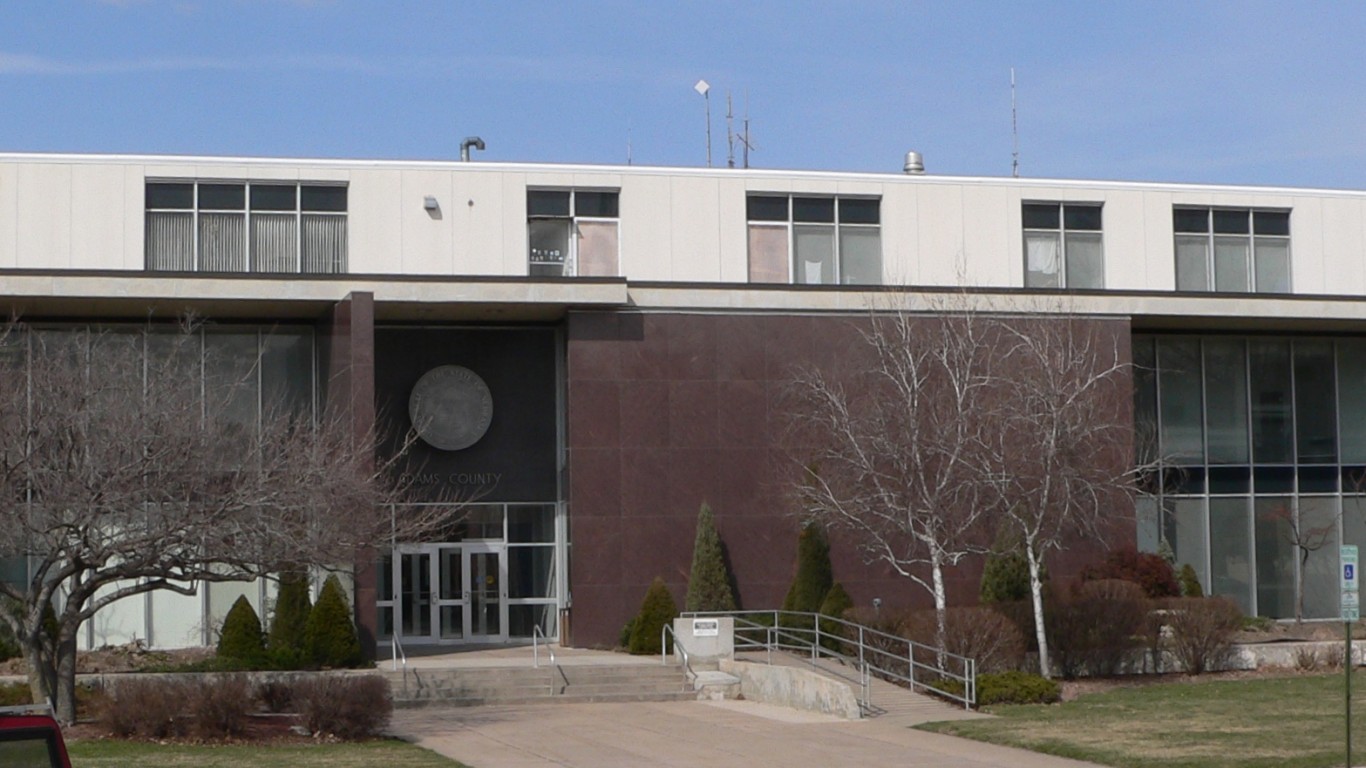
Nebraska: Adams County
> Avg. new daily cases in Adams County in week ending Jul 15, 2021: 0.0 per 100,000
> Cumulative confirmed COVID-19 cases in Adams County as of Jul 15, 2021: 2,993 (9,476.6 per 100,000)
> Cumulative confirmed COVID-19 deaths in Adams County as of Jul 15, 2021: 46 (145.6 per 100,000)
> Population: 31,583
> Largest place in Adams County: Hastings

Source: LPETTET / Getty Images
Nevada: Clark County
> Avg. new daily cases in Clark County in week ending Jul 15, 2021: 15.5 per 100,000
> Cumulative confirmed COVID-19 cases in Clark County as of Jul 15, 2021: 262,481 (12,256.5 per 100,000)
> Cumulative confirmed COVID-19 deaths in Clark County as of Jul 15, 2021: 4,515 (210.8 per 100,000)
> Population: 2,141,574
> Largest place in Clark County: Las Vegas
These are all the counties in Nevada where COVID-19 is slowing (and where it’s still getting worse).

Source: DenisTangneyJr / iStock via Getty Images
New Hampshire: Belknap County
> Avg. new daily cases in Belknap County in week ending Jul 15, 2021: 3.8 per 100,000
> Cumulative confirmed COVID-19 cases in Belknap County as of Jul 15, 2021: 4,192 (6,912.9 per 100,000)
> Cumulative confirmed COVID-19 deaths in Belknap County as of Jul 15, 2021: 100 (164.9 per 100,000)
> Population: 60,640
> Largest place in Belknap County: Laconia

Source: DenisTangneyJr / iStock via Getty Images
New Jersey: Monmouth County
> Avg. new daily cases in Monmouth County in week ending Jul 15, 2021: 4.7 per 100,000
> Cumulative confirmed COVID-19 cases in Monmouth County as of Jul 15, 2021: 76,350 (12,247.6 per 100,000)
> Cumulative confirmed COVID-19 deaths in Monmouth County as of Jul 15, 2021: 1,638 (262.8 per 100,000)
> Population: 623,387
> Largest place in Monmouth County: Long Branch
Source: BOB WESTON / iStock via Getty Images
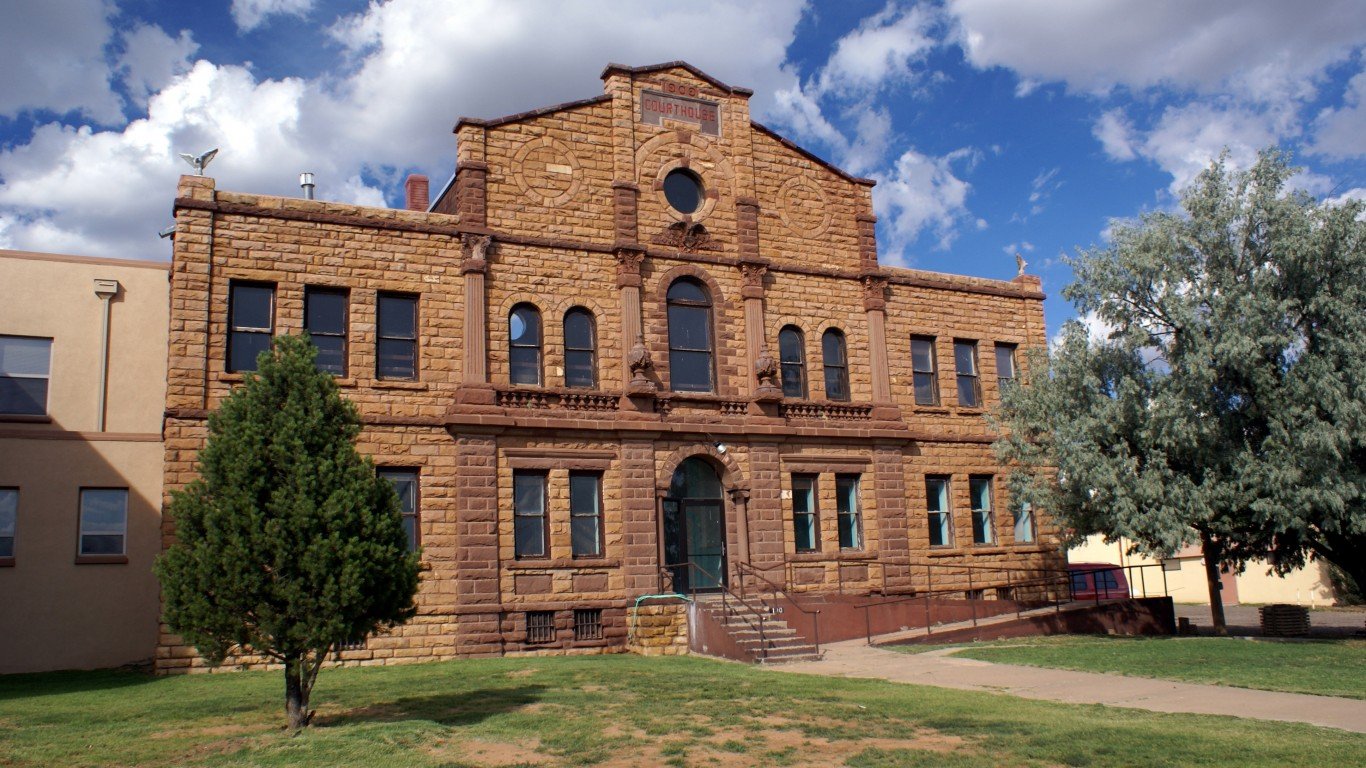
New Mexico: Guadalupe County
> Avg. new daily cases in Guadalupe County in week ending Jul 15, 2021: 7.9 per 100,000
> Cumulative confirmed COVID-19 cases in Guadalupe County as of Jul 15, 2021: 472 (10,771.3 per 100,000)
> Cumulative confirmed COVID-19 deaths in Guadalupe County as of Jul 15, 2021: 12 (273.8 per 100,000)
> Population: 4,382
> Largest place in Guadalupe County: Santa Rosa

Source: thenationalguard / Flickr
New York: Richmond County
> Avg. new daily cases in Richmond County in week ending Jul 15, 2021: 4.5 per 100,000
> Cumulative confirmed COVID-19 cases in Richmond County as of Jul 15, 2021: 75,548 (15,935.0 per 100,000)
> Cumulative confirmed COVID-19 deaths in Richmond County as of Jul 15, 2021: 1,846 (389.4 per 100,000)
> Population: 474,101
> Largest place in Richmond County: New York

Source: thenationalguard / Flickr
North Carolina: Richmond County
> Avg. new daily cases in Richmond County in week ending Jul 15, 2021: 11.8 per 100,000
> Cumulative confirmed COVID-19 cases in Richmond County as of Jul 15, 2021: 4,854 (10,741.6 per 100,000)
> Cumulative confirmed COVID-19 deaths in Richmond County as of Jul 15, 2021: 98 (216.9 per 100,000)
> Population: 45,189
> Largest place in Richmond County: Rockingham

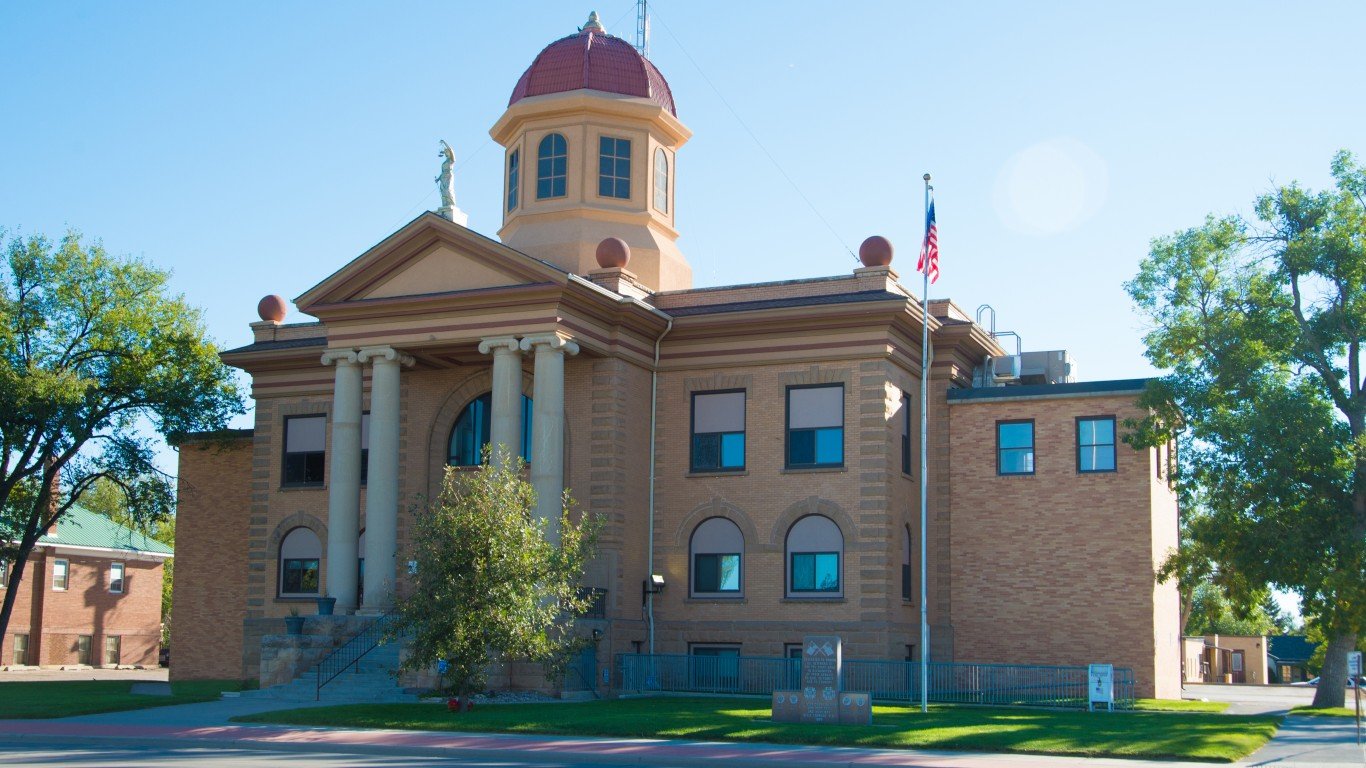
North Dakota: Bowman County
> Avg. new daily cases in Bowman County in week ending Jul 15, 2021: 7.7 per 100,000
> Cumulative confirmed COVID-19 cases in Bowman County as of Jul 15, 2021: 408 (12,770.0 per 100,000)
> Cumulative confirmed COVID-19 deaths in Bowman County as of Jul 15, 2021: 5 (156.5 per 100,000)
> Population: 3,195
> Largest place in Bowman County: Bowman

Ohio: Butler County
> Avg. new daily cases in Butler County in week ending Jul 15, 2021: 10.7 per 100,000
> Cumulative confirmed COVID-19 cases in Butler County as of Jul 15, 2021: 39,547 (10,454.0 per 100,000)
> Cumulative confirmed COVID-19 deaths in Butler County as of Jul 15, 2021: 611 (161.5 per 100,000)
> Population: 378,294
> Largest place in Butler County: Hamilton
These are all the counties in Ohio where COVID-19 is slowing (and where it’s still getting worse).

Source: GracedByTheLight / iStock via Getty Images
Oklahoma: Cimarron County
> Avg. new daily cases in Cimarron County in week ending Jul 15, 2021: 78.3 per 100,000
> Cumulative confirmed COVID-19 cases in Cimarron County as of Jul 15, 2021: 231 (10,552.8 per 100,000)
> Cumulative confirmed COVID-19 deaths in Cimarron County as of Jul 15, 2021: 2 (91.4 per 100,000)
> Population: 2,189
> Largest place in Cimarron County: Boise City
Source: Rex_Wholster / Getty Images
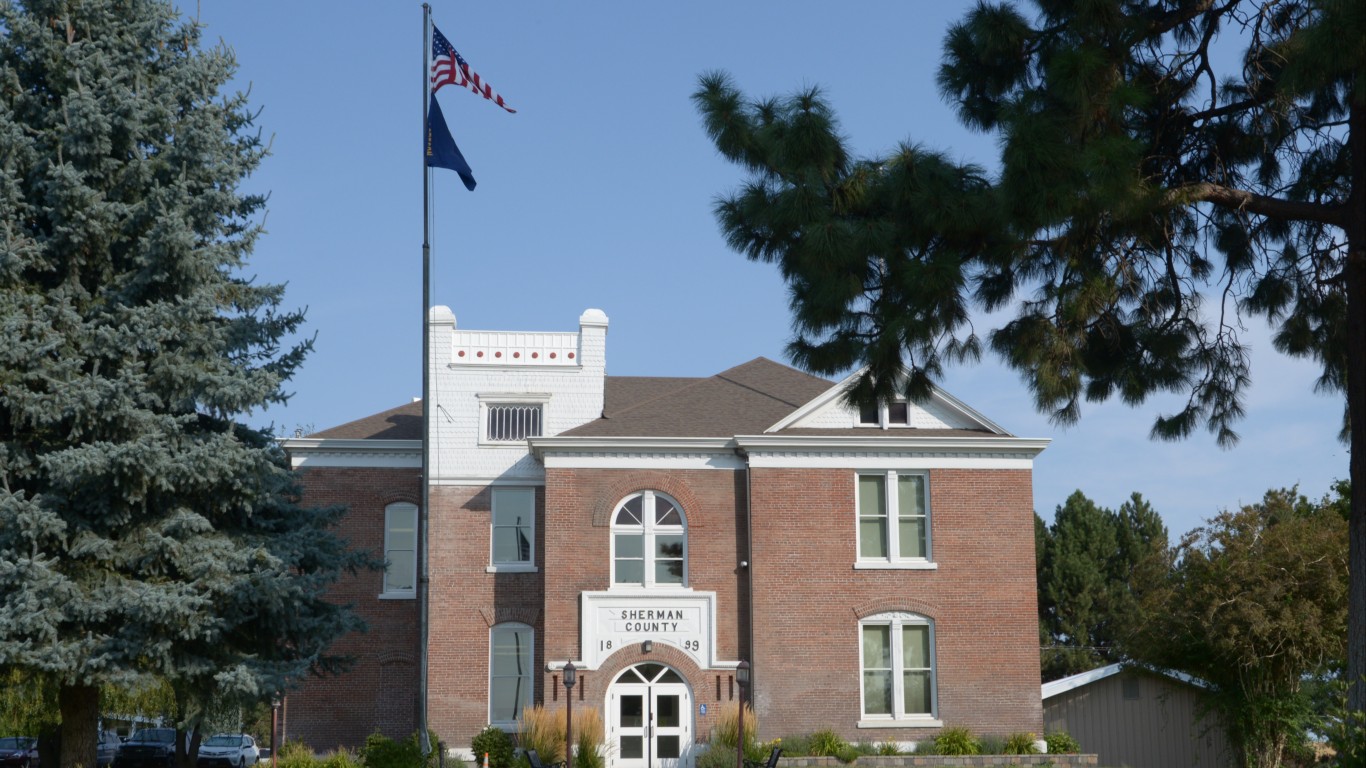
Oregon: Sherman County
> Avg. new daily cases in Sherman County in week ending Jul 15, 2021: 8.9 per 100,000
> Cumulative confirmed COVID-19 cases in Sherman County as of Jul 15, 2021: 71 (4,423.7 per 100,000)
> Cumulative confirmed COVID-19 deaths in Sherman County as of Jul 15, 2021: 1 (62.3 per 100,000)
> Population: 1,605
> Largest place in Sherman County: Wasco
These are all the counties in Oregon where COVID-19 is slowing (and where it’s still getting worse).

Pennsylvania: Fulton County
> Avg. new daily cases in Fulton County in week ending Jul 15, 2021: 5.1 per 100,000
> Cumulative confirmed COVID-19 cases in Fulton County as of Jul 15, 2021: 1,379 (9,506.4 per 100,000)
> Cumulative confirmed COVID-19 deaths in Fulton County as of Jul 15, 2021: 16 (110.3 per 100,000)
> Population: 14,506
> Largest place in Fulton County: McConnellsburg

Source: Sean Pavone / iStock via Getty Images
Rhode Island: Providence County
> Avg. new daily cases in Providence County in week ending Jul 15, 2021: 2.5 per 100,000
> Cumulative confirmed COVID-19 cases in Providence County as of Jul 15, 2021: 99,632 (15,701.6 per 100,000)
> Cumulative confirmed COVID-19 deaths in Providence County as of Jul 15, 2021: N/A (N/A per 100,000)
> Population: 634,533
> Largest place in Providence County: Providence

Source: digidreamgrafix / iStock via Getty Images
South Carolina: York County
> Avg. new daily cases in York County in week ending Jul 15, 2021: 8.6 per 100,000
> Cumulative confirmed COVID-19 cases in York County as of Jul 15, 2021: 32,199 (12,449.3 per 100,000)
> Cumulative confirmed COVID-19 deaths in York County as of Jul 15, 2021: 393 (151.9 per 100,000)
> Population: 258,641
> Largest place in York County: Rock Hill
Source: Rex_Wholster / iStock via Getty Images
South Dakota: Butte County
> Avg. new daily cases in Butte County in week ending Jul 15, 2021: 12.8 per 100,000
> Cumulative confirmed COVID-19 cases in Butte County as of Jul 15, 2021: 1,100 (10,808.7 per 100,000)
> Cumulative confirmed COVID-19 deaths in Butte County as of Jul 15, 2021: 20 (196.5 per 100,000)
> Population: 10,177
> Largest place in Butte County: Belle Fourche

Tennessee: Bledsoe County
> Avg. new daily cases in Bledsoe County in week ending Jul 15, 2021: 10.5 per 100,000
> Cumulative confirmed COVID-19 cases in Bledsoe County as of Jul 15, 2021: 2,230 (15,271.9 per 100,000)
> Cumulative confirmed COVID-19 deaths in Bledsoe County as of Jul 15, 2021: 11 (75.3 per 100,000)
> Population: 14,602
> Largest place in Bledsoe County: Pikeville

Source: BOB WESTON / iStock via Getty Images
Texas: Dimmit County
> Avg. new daily cases in Dimmit County in week ending Jul 15, 2021: 91.5 per 100,000
> Cumulative confirmed COVID-19 cases in Dimmit County as of Jul 15, 2021: 2,639 (24,749.1 per 100,000)
> Cumulative confirmed COVID-19 deaths in Dimmit County as of Jul 15, 2021: 37 (347.0 per 100,000)
> Population: 10,663
> Largest place in Dimmit County: Carrizo Springs
These are all the counties in Texas where COVID-19 is slowing (and where it’s still getting worse).
 by Ken Lund")
Utah: Carbon County
> Avg. new daily cases in Carbon County in week ending Jul 15, 2021: 26.7 per 100,000
> Cumulative confirmed COVID-19 cases in Carbon County as of Jul 15, 2021: 1,805 (8,867.2 per 100,000)
> Cumulative confirmed COVID-19 deaths in Carbon County as of Jul 15, 2021: 17 (83.5 per 100,000)
> Population: 20,356
> Largest place in Carbon County: Price
These are all the counties in Utah where COVID-19 is slowing (and where it’s still getting worse).

Vermont: Essex County
> Avg. new daily cases in Essex County in week ending Jul 15, 2021: 2.3 per 100,000
> Cumulative confirmed COVID-19 cases in Essex County as of Jul 15, 2021: 296 (4,768.0 per 100,000)
> Cumulative confirmed COVID-19 deaths in Essex County as of Jul 15, 2021: 2 (32.2 per 100,000)
> Population: 6,208
> Largest place in Essex County: Island Pond

Source: Drew Angerer / Getty Images News via Getty Images
Virginia: Dickenson County
> Avg. new daily cases in Dickenson County in week ending Jul 15, 2021: 15.0 per 100,000
> Cumulative confirmed COVID-19 cases in Dickenson County as of Jul 15, 2021: 1,001 (6,691.2 per 100,000)
> Cumulative confirmed COVID-19 deaths in Dickenson County as of Jul 15, 2021: 18 (120.3 per 100,000)
> Population: 14,960
> Largest place in Dickenson County: Clintwood
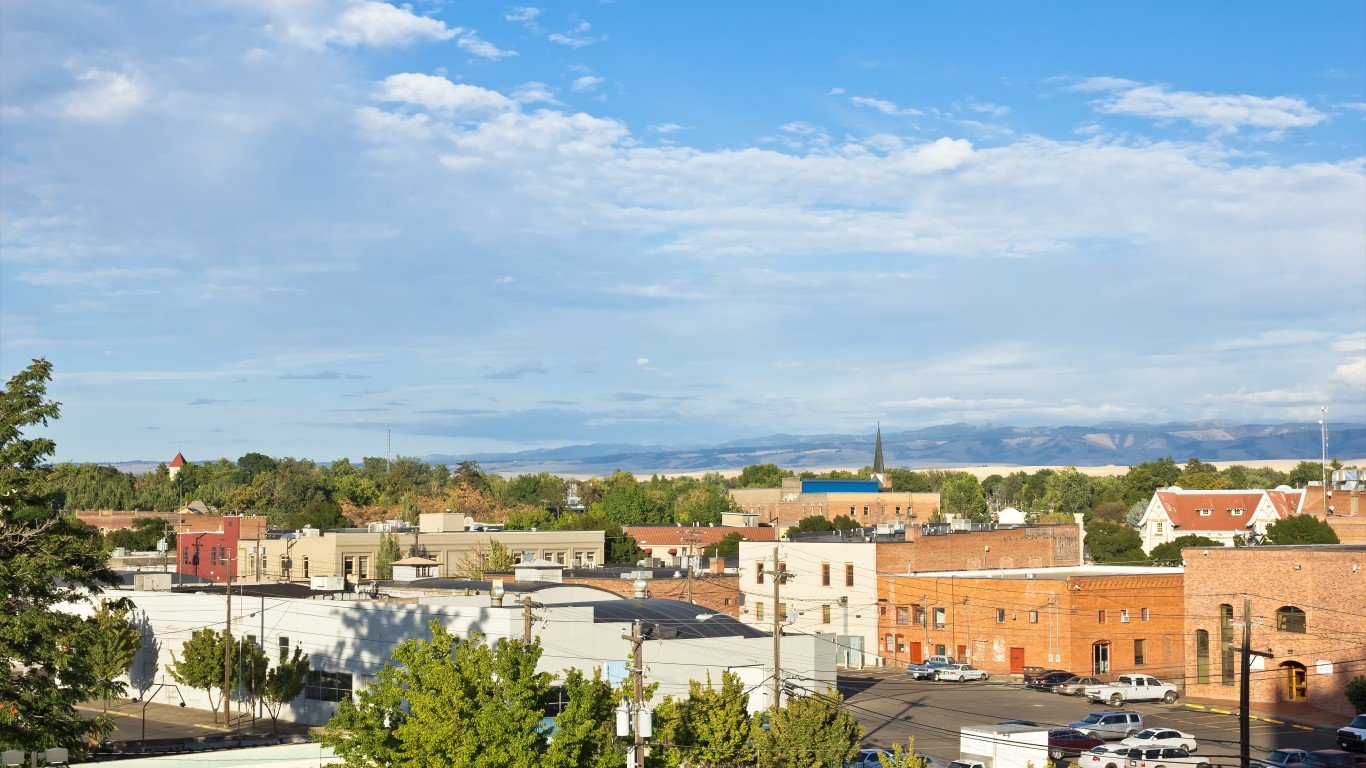
Source: JohnnyH5 / iStock via Getty Images
Washington: Walla Walla County
> Avg. new daily cases in Walla Walla County in week ending Jul 15, 2021: 18.7 per 100,000
> Cumulative confirmed COVID-19 cases in Walla Walla County as of Jul 15, 2021: 5,560 (9,230.4 per 100,000)
> Cumulative confirmed COVID-19 deaths in Walla Walla County as of Jul 15, 2021: 69 (114.5 per 100,000)
> Population: 60,236
> Largest place in Walla Walla County: Walla Walla

Source: thenationalguard / Flickr
West Virginia: Calhoun County
> Avg. new daily cases in Calhoun County in week ending Jul 15, 2021: 11.9 per 100,000
> Cumulative confirmed COVID-19 cases in Calhoun County as of Jul 15, 2021: 396 (5,354.2 per 100,000)
> Cumulative confirmed COVID-19 deaths in Calhoun County as of Jul 15, 2021: 1 (13.5 per 100,000)
> Population: 7,396
> Largest place in Calhoun County: Grantsville

Wisconsin: Dunn County
> Avg. new daily cases in Dunn County in week ending Jul 15, 2021: 4.6 per 100,000
> Cumulative confirmed COVID-19 cases in Dunn County as of Jul 15, 2021: 5,143 (11,557.8 per 100,000)
> Cumulative confirmed COVID-19 deaths in Dunn County as of Jul 15, 2021: 33 (74.2 per 100,000)
> Population: 44,498
> Largest place in Dunn County: Menomonie

Source: Davel5957 / Getty Images
Wyoming: Laramie County
> Avg. new daily cases in Laramie County in week ending Jul 15, 2021: 35.1 per 100,000
> Cumulative confirmed COVID-19 cases in Laramie County as of Jul 15, 2021: 10,763 (11,017.3 per 100,000)
> Cumulative confirmed COVID-19 deaths in Laramie County as of Jul 15, 2021: 123 (125.9 per 100,000)
> Population: 97,692
> Largest place in Laramie County: Cheyenne
Click here to see all coronavirus data for every state.
Sponsored: Find a Qualified Financial Advisor
Finding a qualified financial advisor doesn’t have to be hard. SmartAsset’s free tool matches you with up to 3 fiduciary financial advisors in your area in 5 minutes. Each advisor has been vetted by SmartAsset and is held to a fiduciary standard to act in your best interests. If you’re ready to be matched with local advisors that can help you achieve your financial goals, get started now.
Thank you for reading! Have some feedback for us?
Contact the 24/7 Wall St. editorial team.
Editors' Picks


