
Nearly half of all Americans with health insurance receive coverage through their employer. When the COVID-19 pandemic hit, however, millions of Americans lost their jobs, and nearly 30% of U.S. residents lost their health insurance coverage. While many have returned to employment, health insurance coverage levels are likely still far from the pre-pandemic normal.
It remains to be seen how much of an impact the pandemic has truly had on health coverage in the United States, but there are a number of American cities where even a small loss of insurance coverage would have driven already low coverage levels even lower, certainly below the national figure.
According to the five-year average through 2019, the most recent year for which data is available through the U.S. Census, 10.3% of Americans did not have health insurance coverage. In many American cities, the uninsured rate was far greater, and a number of cities had more than double the uninsured share.
To determine the cities with the worst health insurance coverage in every state, 24/7 Wall St. reviewed five-year estimates of the percentage of the noninstitutionalized civilian population under 65 without health insurance from the U.S. Census Bureau’s 2019 American Community Survey. We looked at the population under 65 because Americans 65 and older are automatically entitled to Medicare benefits. It should be noted that Burlington is the only city in Vermont that meets the population requirements and therefore is the least insured city in the state by default, despite having a relatively highly-insured population.
Health insurance coverage varies substantially from state to state. While, as might be expected, the city in each state with the worst health insurance coverage generally has worse coverage than the national average, there are seven states, not counting Vermont, where in the city with the worst coverage fewer than 10.3% of residents lack health insurance coverage.
Among the other cities to make this list, generally it is the case that in states with worse insurance coverage of the under 65 population, the city to make this list has especially poor health insurance coverage. Texas has the highest uninsured rate in the country, at 19.4% of the population under 65. The city of San Juan in Texas has the third highest uninsured rate of any place to qualify for this ranking, at 37.2%.
Click here to see the city with the worst health insurance coverage in every state.
Click here to see our methodology.

Source: TreyMcGriff / iStock via Getty Images
Alabama: Gadsden
> Adults under 65, no health insurance: 19.0% (Alabama: 11.3%)
> Adults under 65, Medicare coverage (or multiple types): 8.5% (Alabama: 4.9%)
> Adults under 65, Medicaid coverage (or multiple types): 29.8% (Alabama: 20.9%)
> Adults under 65, VA coverage (or multiple types): 1.8% (Alabama: 1.7%)
> Adults under 65, employer-based insurance (or multiple types): 41.9% (Alabama: 57.8%)
> Adults under 65, direct-purchase insurance (or multiple types): 9.8% (Alabama: 10.5%)
> Adults under 65, Tricare/military insurance (or many types): 1.8% (Alabama: 3.3%)
[in-text-ad]
Source: Chilkoot / Getty Images
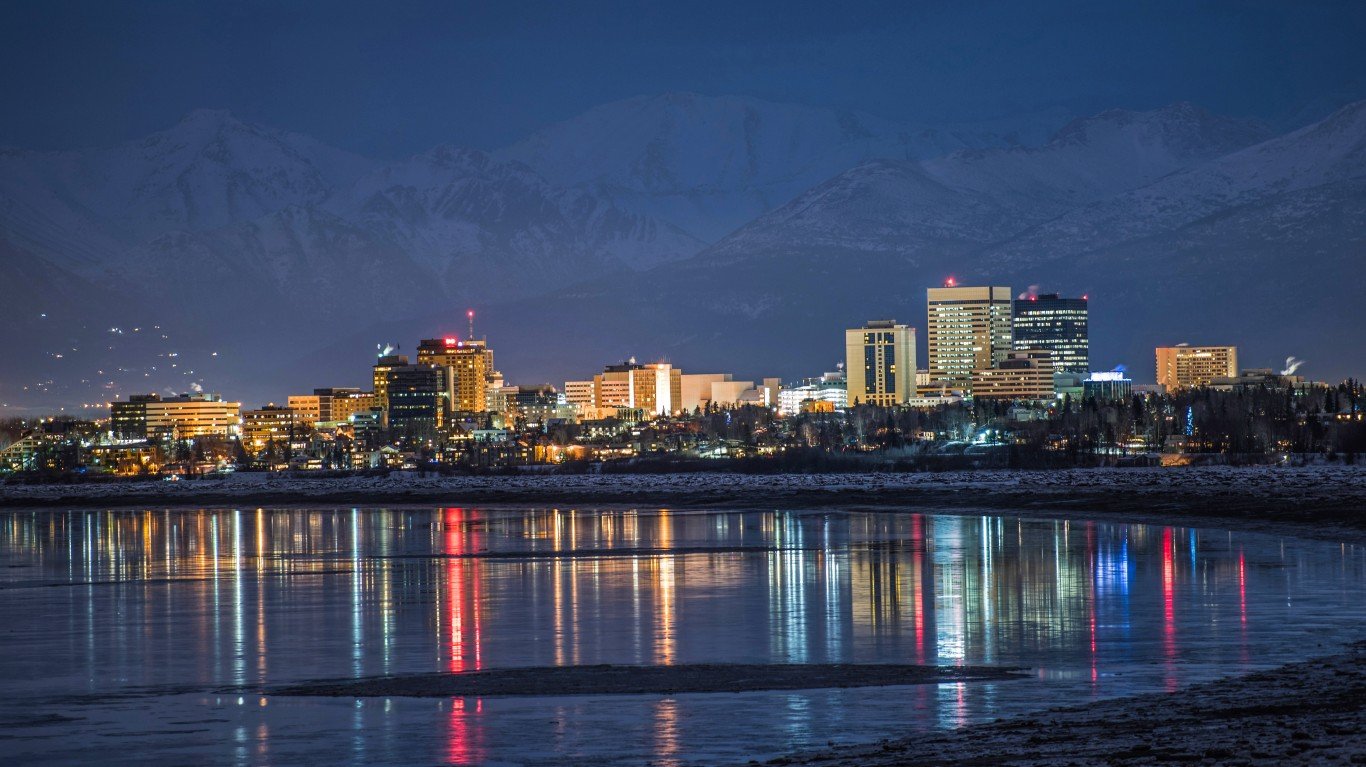
Alaska: Anchorage
> Adults under 65, no health insurance: 12.4% (Alaska: 15.3%)
> Adults under 65, Medicare coverage (or multiple types): 1.9% (Alaska: 1.9%)
> Adults under 65, Medicaid coverage (or multiple types): 18.5% (Alaska: 21.1%)
> Adults under 65, VA coverage (or multiple types): 4.0% (Alaska: 3.0%)
> Adults under 65, employer-based insurance (or multiple types): 58.6% (Alaska: 54.4%)
> Adults under 65, direct-purchase insurance (or multiple types): 7.4% (Alaska: 6.9%)
> Adults under 65, Tricare/military insurance (or many types): 11.4% (Alaska: 9.6%)

Source: kenlund / Flickr
Arizona: San Luis
> Adults under 65, no health insurance: 21.1% (Arizona: 12.4%)
> Adults under 65, Medicare coverage (or multiple types): 1.2% (Arizona: 2.6%)
> Adults under 65, Medicaid coverage (or multiple types): 46.7% (Arizona: 24.1%)
> Adults under 65, VA coverage (or multiple types): 0.0% reported (Arizona: 1.5%)
> Adults under 65, employer-based insurance (or multiple types): 32.1% (Arizona: 55.1%)
> Adults under 65, direct-purchase insurance (or multiple types): 3.4% (Arizona: 9.7%)
> Adults under 65, Tricare/military insurance (or many types): 0.5% (Arizona: 2.4%)
Source: Brandonrush / Wikimedia Commons
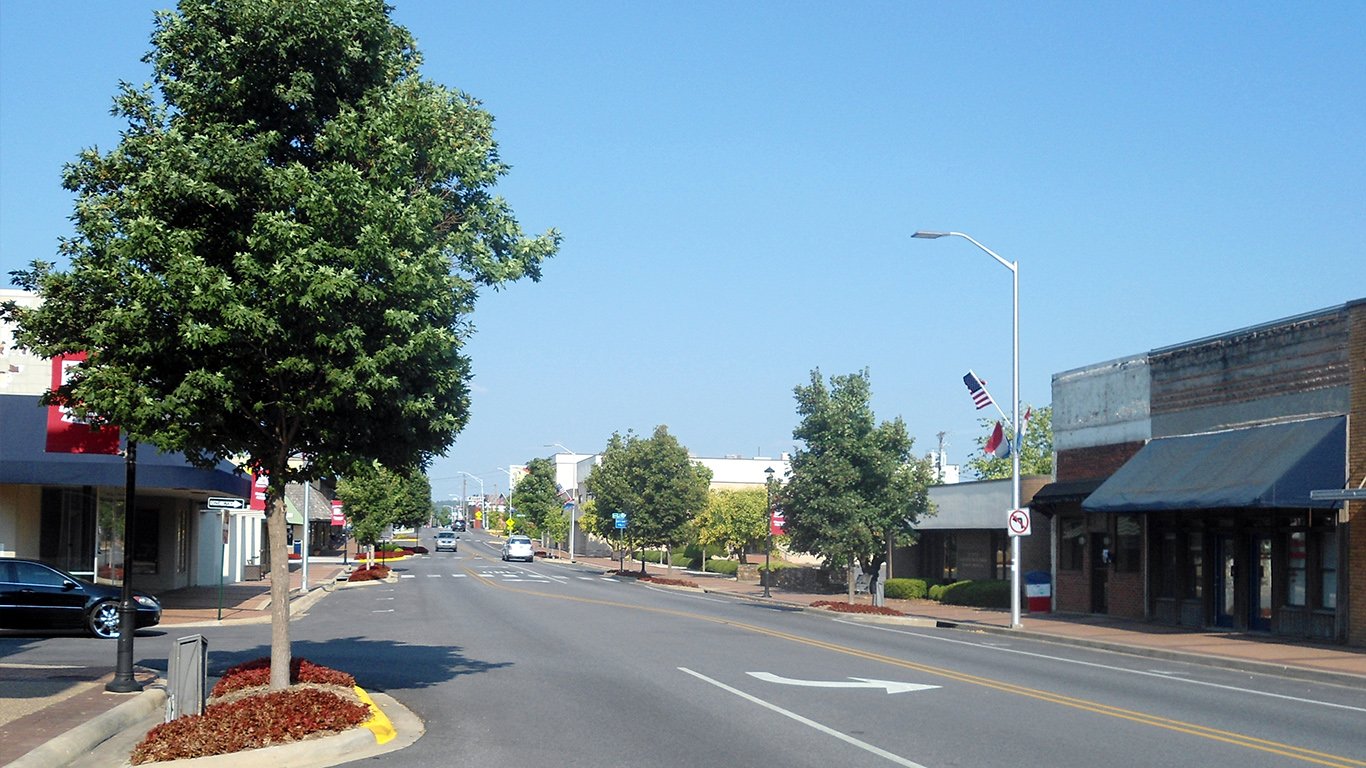
Arkansas: Springdale
> Adults under 65, no health insurance: 19.4% (Arkansas: 10.1%)
> Adults under 65, Medicare coverage (or multiple types): 2.7% (Arkansas: 5.1%)
> Adults under 65, Medicaid coverage (or multiple types): 25.1% (Arkansas: 28.6%)
> Adults under 65, VA coverage (or multiple types): 1.2% (Arkansas: 1.8%)
> Adults under 65, employer-based insurance (or multiple types): 51.3% (Arkansas: 51.8%)
> Adults under 65, direct-purchase insurance (or multiple types): 6.4% (Arkansas: 10.2%)
> Adults under 65, Tricare/military insurance (or many types): 1.0% (Arkansas: 2.3%)
[in-text-ad-2]

Source: JulieHewitt / Getty Images
California: Santa Maria
> Adults under 65, no health insurance: 20.0% (California: 8.6%)
> Adults under 65, Medicare coverage (or multiple types): 2.1% (California: 2.2%)
> Adults under 65, Medicaid coverage (or multiple types): 39.1% (California: 27.1%)
> Adults under 65, VA coverage (or multiple types): 0.6% (California: 0.9%)
> Adults under 65, employer-based insurance (or multiple types): 37.1% (California: 55.7%)
> Adults under 65, direct-purchase insurance (or multiple types): 5.7% (California: 10.9%)
> Adults under 65, Tricare/military insurance (or many types): 0.9% (California: 1.4%)

Source: Faina Gurevich / iStock via Getty Images
Colorado: Aurora
> Adults under 65, no health insurance: 12.5% (Colorado: 8.7%)
> Adults under 65, Medicare coverage (or multiple types): 2.0% (Colorado: 2.1%)
> Adults under 65, Medicaid coverage (or multiple types): 23.9% (Colorado: 19.8%)
> Adults under 65, VA coverage (or multiple types): 1.5% (Colorado: 1.5%)
> Adults under 65, employer-based insurance (or multiple types): 56.5% (Colorado: 60.5%)
> Adults under 65, direct-purchase insurance (or multiple types): 7.4% (Colorado: 11.4%)
> Adults under 65, Tricare/military insurance (or many types): 3.5% (Colorado: 3.5%)
[in-text-ad]

Source: DenisTangneyJr / iStock via Getty Images
Connecticut: Norwalk
> Adults under 65, no health insurance: 19.4% (Connecticut: 6.3%)
> Adults under 65, Medicare coverage (or multiple types): 1.9% (Connecticut: 2.4%)
> Adults under 65, Medicaid coverage (or multiple types): 17.9% (Connecticut: 21.6%)
> Adults under 65, VA coverage (or multiple types): 0.3% (Connecticut: 0.7%)
> Adults under 65, employer-based insurance (or multiple types): 54.0% (Connecticut: 65.1%)
> Adults under 65, direct-purchase insurance (or multiple types): 10.3% (Connecticut: 9.4%)
> Adults under 65, Tricare/military insurance (or many types): 0.2% (Connecticut: 1.0%)
 24/7 Wall St.
Source: pabradyphoto / Getty Images
Delaware: Wilmington
> Adults under 65, no health insurance: 7.1% (Delaware: 6.8%)
> Adults under 65, Medicare coverage (or multiple types): 5.0% (Delaware: 3.3%)
> Adults under 65, Medicaid coverage (or multiple types): 39.5% (Delaware: 22.5%)
> Adults under 65, VA coverage (or multiple types): 0.9% (Delaware: 1.0%)
> Adults under 65, employer-based insurance (or multiple types): 51.2% (Delaware: 64.4%)
> Adults under 65, direct-purchase insurance (or multiple types): 6.7% (Delaware: 8.6%)
> Adults under 65, Tricare/military insurance (or many types): 1.2% (Delaware: 2.6%)

Source: sorsillo / iStock via Getty Images
Florida: Golden Gate
> Adults under 65, no health insurance: 38.3% (Florida: 15.7%)
> Adults under 65, Medicare coverage (or multiple types): 1.9% (Florida: 3.1%)
> Adults under 65, Medicaid coverage (or multiple types): 23.4% (Florida: 19.2%)
> Adults under 65, VA coverage (or multiple types): 0.4% (Florida: 1.6%)
> Adults under 65, employer-based insurance (or multiple types): 27.8% (Florida: 50.6%)
> Adults under 65, direct-purchase insurance (or multiple types): 10.9% (Florida: 14.5%)
> Adults under 65, Tricare/military insurance (or many types): 0.2% (Florida: 2.7%)
[in-text-ad-2]

Source: glenirah / Flickr
Georgia: Chamblee
> Adults under 65, no health insurance: 30.0% (Georgia: 15.2%)
> Adults under 65, Medicare coverage (or multiple types): 1.3% (Georgia: 3.0%)
> Adults under 65, Medicaid coverage (or multiple types): 16.8% (Georgia: 17.9%)
> Adults under 65, VA coverage (or multiple types): 0.4% (Georgia: 1.5%)
> Adults under 65, employer-based insurance (or multiple types): 44.3% (Georgia: 56.9%)
> Adults under 65, direct-purchase insurance (or multiple types): 9.3% (Georgia: 10.2%)
> Adults under 65, Tricare/military insurance (or many types): 0.7% (Georgia: 3.4%)

Source: kenlund / Flickr
Hawaii: Kailua (Honolulu County)
> Adults under 65, no health insurance: 5.0% (Hawaii: 4.6%)
> Adults under 65, Medicare coverage (or multiple types): 1.1% (Hawaii: 1.8%)
> Adults under 65, Medicaid coverage (or multiple types): 10.9% (Hawaii: 19.0%)
> Adults under 65, VA coverage (or multiple types): 1.6% (Hawaii: 1.5%)
> Adults under 65, employer-based insurance (or multiple types): 69.2% (Hawaii: 66.3%)
> Adults under 65, direct-purchase insurance (or multiple types): 11.6% (Hawaii: 9.5%)
> Adults under 65, Tricare/military insurance (or many types): 11.7% (Hawaii: 8.8%)
[in-text-ad]

Source: Mike Worley / iStock via Getty Images
Idaho: Caldwell
> Adults under 65, no health insurance: 15.7% (Idaho: 12.4%)
> Adults under 65, Medicare coverage (or multiple types): 2.6% (Idaho: 2.8%)
> Adults under 65, Medicaid coverage (or multiple types): 32.7% (Idaho: 18.2%)
> Adults under 65, VA coverage (or multiple types): 2.1% (Idaho: 1.6%)
> Adults under 65, employer-based insurance (or multiple types): 44.9% (Idaho: 57.4%)
> Adults under 65, direct-purchase insurance (or multiple types): 8.8% (Idaho: 13.8%)
> Adults under 65, Tricare/military insurance (or many types): 1.2% (Idaho: 2.5%)

Source: Uncle-Ulee / iStock via Getty Images
Illinois: Cicero
> Adults under 65, no health insurance: 19.8% (Illinois: 7.9%)
> Adults under 65, Medicare coverage (or multiple types): 1.4% (Illinois: 2.4%)
> Adults under 65, Medicaid coverage (or multiple types): 36.9% (Illinois: 21.0%)
> Adults under 65, VA coverage (or multiple types): 0.3% (Illinois: 0.8%)
> Adults under 65, employer-based insurance (or multiple types): 39.5% (Illinois: 63.6%)
> Adults under 65, direct-purchase insurance (or multiple types): 4.7% (Illinois: 9.5%)
> Adults under 65, Tricare/military insurance (or many types): 0.1% (Illinois: 0.9%)

Source: BOB WESTON / Getty Images
Indiana: Goshen
> Adults under 65, no health insurance: 17.1% (Indiana: 9.8%)
> Adults under 65, Medicare coverage (or multiple types): 3.0% (Indiana: 3.2%)
> Adults under 65, Medicaid coverage (or multiple types): 23.9% (Indiana: 19.1%)
> Adults under 65, VA coverage (or multiple types): 0.6% (Indiana: 1.2%)
> Adults under 65, employer-based insurance (or multiple types): 53.8% (Indiana: 64.2%)
> Adults under 65, direct-purchase insurance (or multiple types): 7.1% (Indiana: 8.8%)
> Adults under 65, Tricare/military insurance (or many types): 0.6% (Indiana: 1.2%)
[in-text-ad-2]

Source: Cavan Images / iStock via Getty Images
Iowa: Marshalltown
> Adults under 65, no health insurance: 9.1% (Iowa: 5.5%)
> Adults under 65, Medicare coverage (or multiple types): 3.2% (Iowa: 2.5%)
> Adults under 65, Medicaid coverage (or multiple types): 29.3% (Iowa: 20.4%)
> Adults under 65, VA coverage (or multiple types): 1.3% (Iowa: 1.1%)
> Adults under 65, employer-based insurance (or multiple types): 59.9% (Iowa: 67.4%)
> Adults under 65, direct-purchase insurance (or multiple types): 6.3% (Iowa: 10.6%)
> Adults under 65, Tricare/military insurance (or many types): 0.8% (Iowa: 1.3%)

Source: TriggerPhoto / iStock via Getty Images
Kansas: Kansas City
> Adults under 65, no health insurance: 21.0% (Kansas: 10.3%)
> Adults under 65, Medicare coverage (or multiple types): 3.5% (Kansas: 2.7%)
> Adults under 65, Medicaid coverage (or multiple types): 27.5% (Kansas: 14.5%)
> Adults under 65, VA coverage (or multiple types): 1.2% (Kansas: 1.4%)
> Adults under 65, employer-based insurance (or multiple types): 45.8% (Kansas: 65.2%)
> Adults under 65, direct-purchase insurance (or multiple types): 6.8% (Kansas: 11.4%)
> Adults under 65, Tricare/military insurance (or many types): 1.3% (Kansas: 3.4%)
[in-text-ad]

Source: Sean Pavone / iStock via Getty Images
Kentucky: Frankfort
> Adults under 65, no health insurance: 11.5% (Kentucky: 6.7%)
> Adults under 65, Medicare coverage (or multiple types): 3.8% (Kentucky: 5.0%)
> Adults under 65, Medicaid coverage (or multiple types): 24.7% (Kentucky: 28.5%)
> Adults under 65, VA coverage (or multiple types): 1.3% (Kentucky: 1.5%)
> Adults under 65, employer-based insurance (or multiple types): 57.9% (Kentucky: 57.3%)
> Adults under 65, direct-purchase insurance (or multiple types): 6.3% (Kentucky: 8.2%)
> Adults under 65, Tricare/military insurance (or many types): 1.6% (Kentucky: 2.3%)

Source: Photo Italia LLC / iStock via Getty Images
Louisiana: Kenner
> Adults under 65, no health insurance: 16.8% (Louisiana: 11.0%)
> Adults under 65, Medicare coverage (or multiple types): 3.3% (Louisiana: 4.0%)
> Adults under 65, Medicaid coverage (or multiple types): 28.7% (Louisiana: 28.4%)
> Adults under 65, VA coverage (or multiple types): 0.8% (Louisiana: 1.3%)
> Adults under 65, employer-based insurance (or multiple types): 46.8% (Louisiana: 52.3%)
> Adults under 65, direct-purchase insurance (or multiple types): 7.7% (Louisiana: 9.6%)
> Adults under 65, Tricare/military insurance (or many types): 1.3% (Louisiana: 2.2%)

Source: DenisTangneyJr / Getty Images
Maine: Lewiston
> Adults under 65, no health insurance: 13.1% (Maine: 9.8%)
> Adults under 65, Medicare coverage (or multiple types): 5.5% (Maine: 4.5%)
> Adults under 65, Medicaid coverage (or multiple types): 26.4% (Maine: 19.3%)
> Adults under 65, VA coverage (or multiple types): 1.5% (Maine: 1.8%)
> Adults under 65, employer-based insurance (or multiple types): 56.5% (Maine: 61.5%)
> Adults under 65, direct-purchase insurance (or multiple types): 7.3% (Maine: 11.0%)
> Adults under 65, Tricare/military insurance (or many types): 1.3% (Maine: 2.3%)
[in-text-ad-2]

Source: A. Bailey / Wikimedia Commons
Maryland: Chillum
> Adults under 65, no health insurance: 25.8% (Maryland: 6.9%)
> Adults under 65, Medicare coverage (or multiple types): 1.7% (Maryland: 2.6%)
> Adults under 65, Medicaid coverage (or multiple types): 27.8% (Maryland: 19.1%)
> Adults under 65, VA coverage (or multiple types): 0.8% (Maryland: 1.2%)
> Adults under 65, employer-based insurance (or multiple types): 40.0% (Maryland: 65.7%)
> Adults under 65, direct-purchase insurance (or multiple types): 7.5% (Maryland: 9.6%)
> Adults under 65, Tricare/military insurance (or many types): 0.5% (Maryland: 3.1%)

Source: DenisTangneyJr / iStock via Getty Images
Massachusetts: Chelsea
> Adults under 65, no health insurance: 7.9% (Massachusetts: 3.2%)
> Adults under 65, Medicare coverage (or multiple types): 2.4% (Massachusetts: 2.5%)
> Adults under 65, Medicaid coverage (or multiple types): 54.1% (Massachusetts: 24.0%)
> Adults under 65, VA coverage (or multiple types): 0.5% (Massachusetts: 0.6%)
> Adults under 65, employer-based insurance (or multiple types): 36.3% (Massachusetts: 67.5%)
> Adults under 65, direct-purchase insurance (or multiple types): 5.7% (Massachusetts: 9.9%)
> Adults under 65, Tricare/military insurance (or many types): 0.5% (Massachusetts: 0.8%)
[in-text-ad]

Source: RiverNorthPhotography / iStock via Getty Images
Michigan: Pontiac
> Adults under 65, no health insurance: 13.7% (Michigan: 6.5%)
> Adults under 65, Medicare coverage (or multiple types): 5.3% (Michigan: 3.7%)
> Adults under 65, Medicaid coverage (or multiple types): 44.7% (Michigan: 24.2%)
> Adults under 65, VA coverage (or multiple types): 0.7% (Michigan: 1.0%)
> Adults under 65, employer-based insurance (or multiple types): 38.3% (Michigan: 63.3%)
> Adults under 65, direct-purchase insurance (or multiple types): 6.1% (Michigan: 9.1%)
> Adults under 65, Tricare/military insurance (or many types): 0.3% (Michigan: 0.9%)

Source: Courtesy of City of Brooklyn Center, MN
Minnesota: Brooklyn Center
> Adults under 65, no health insurance: 9.7% (Minnesota: 5.2%)
> Adults under 65, Medicare coverage (or multiple types): 2.5% (Minnesota: 2.1%)
> Adults under 65, Medicaid coverage (or multiple types): 35.0% (Minnesota: 19.4%)
> Adults under 65, VA coverage (or multiple types): 0.9% (Minnesota: 1.0%)
> Adults under 65, employer-based insurance (or multiple types): 52.2% (Minnesota: 68.6%)
> Adults under 65, direct-purchase insurance (or multiple types): 7.6% (Minnesota: 9.9%)
> Adults under 65, Tricare/military insurance (or many types): 0.4% (Minnesota: 1.0%)

Source: DenisTangneyJr / Getty Images
Mississippi: Gulfport
> Adults under 65, no health insurance: 20.9% (Mississippi: 14.5%)
> Adults under 65, Medicare coverage (or multiple types): 3.8% (Mississippi: 4.7%)
> Adults under 65, Medicaid coverage (or multiple types): 27.8% (Mississippi: 25.1%)
> Adults under 65, VA coverage (or multiple types): 2.8% (Mississippi: 1.4%)
> Adults under 65, employer-based insurance (or multiple types): 41.3% (Mississippi: 51.2%)
> Adults under 65, direct-purchase insurance (or multiple types): 7.1% (Mississippi: 9.5%)
> Adults under 65, Tricare/military insurance (or many types): 8.2% (Mississippi: 3.0%)
[in-text-ad-2]

Source: reliasd / iStock via Getty Images
Missouri: Grandview
> Adults under 65, no health insurance: 17.9% (Missouri: 11.1%)
> Adults under 65, Medicare coverage (or multiple types): 3.2% (Missouri: 3.8%)
> Adults under 65, Medicaid coverage (or multiple types): 19.3% (Missouri: 15.8%)
> Adults under 65, VA coverage (or multiple types): 1.7% (Missouri: 1.4%)
> Adults under 65, employer-based insurance (or multiple types): 52.1% (Missouri: 62.9%)
> Adults under 65, direct-purchase insurance (or multiple types): 11.2% (Missouri: 10.5%)
> Adults under 65, Tricare/military insurance (or many types): 2.1% (Missouri: 2.0%)

Source: leezsnow / Getty Images
Montana: Great Falls
> Adults under 65, no health insurance: 10.2% (Montana: 10.9%)
> Adults under 65, Medicare coverage (or multiple types): 3.5% (Montana: 3.0%)
> Adults under 65, Medicaid coverage (or multiple types): 25.3% (Montana: 21.4%)
> Adults under 65, VA coverage (or multiple types): 3.2% (Montana: 2.1%)
> Adults under 65, employer-based insurance (or multiple types): 52.2% (Montana: 54.9%)
> Adults under 65, direct-purchase insurance (or multiple types): 8.6% (Montana: 13.9%)
> Adults under 65, Tricare/military insurance (or many types): 9.8% (Montana: 3.0%)
[in-text-ad]

Source: Public Domain / Wikimedia Commons
Nebraska: Grand Island
> Adults under 65, no health insurance: 14.3% (Nebraska: 9.5%)
> Adults under 65, Medicare coverage (or multiple types): 1.9% (Nebraska: 2.2%)
> Adults under 65, Medicaid coverage (or multiple types): 18.9% (Nebraska: 13.4%)
> Adults under 65, VA coverage (or multiple types): 1.6% (Nebraska: 1.4%)
> Adults under 65, employer-based insurance (or multiple types): 62.6% (Nebraska: 66.1%)
> Adults under 65, direct-purchase insurance (or multiple types): 8.0% (Nebraska: 12.9%)
> Adults under 65, Tricare/military insurance (or many types): 0.9% (Nebraska: 2.7%)
 24/7 Wall St.
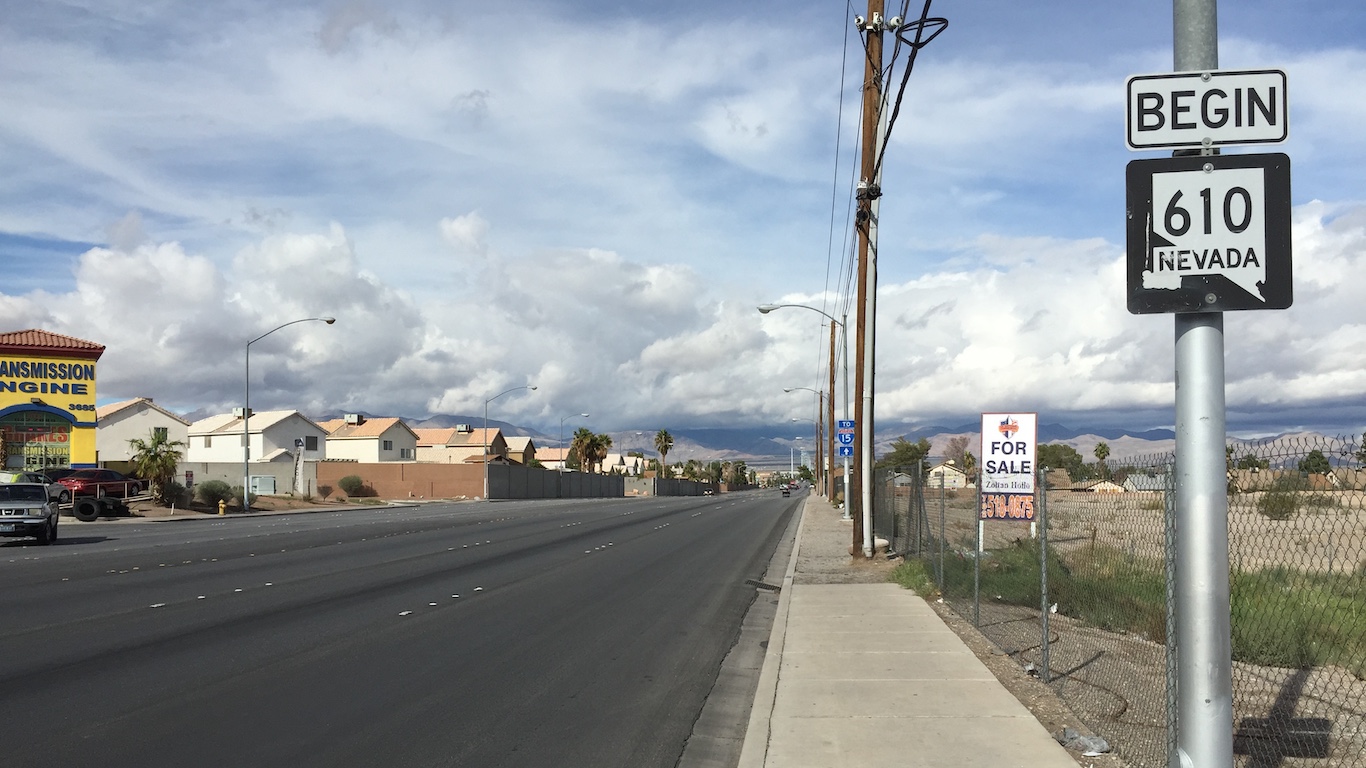
Source: Famartin / Wikimedia Commons
Nevada: Sunrise Manor
> Adults under 65, no health insurance: 19.3% (Nevada: 12.9%)
> Adults under 65, Medicare coverage (or multiple types): 2.9% (Nevada: 2.5%)
> Adults under 65, Medicaid coverage (or multiple types): 30.9% (Nevada: 20.0%)
> Adults under 65, VA coverage (or multiple types): 1.5% (Nevada: 1.7%)
> Adults under 65, employer-based insurance (or multiple types): 45.7% (Nevada: 58.7%)
> Adults under 65, direct-purchase insurance (or multiple types): 5.1% (Nevada: 9.1%)
> Adults under 65, Tricare/military insurance (or many types): 2.1% (Nevada: 2.7%)

Source: DenisTangneyJr / Getty Images
New Hampshire: Manchester
> Adults under 65, no health insurance: 11.3% (New Hampshire: 7.1%)
> Adults under 65, Medicare coverage (or multiple types): 3.9% (New Hampshire: 3.2%)
> Adults under 65, Medicaid coverage (or multiple types): 24.2% (New Hampshire: 14.6%)
> Adults under 65, VA coverage (or multiple types): 1.3% (New Hampshire: 1.3%)
> Adults under 65, employer-based insurance (or multiple types): 57.2% (New Hampshire: 69.8%)
> Adults under 65, direct-purchase insurance (or multiple types): 7.5% (New Hampshire: 9.3%)
> Adults under 65, Tricare/military insurance (or many types): 1.1% (New Hampshire: 1.5%)
[in-text-ad-2]

Source: Public Domain / Wikimedia Commons
New Jersey: Plainfield
> Adults under 65, no health insurance: 28.8% (New Jersey: 9.0%)
> Adults under 65, Medicare coverage (or multiple types): 2.6% (New Jersey: 2.4%)
> Adults under 65, Medicaid coverage (or multiple types): 28.8% (New Jersey: 17.7%)
> Adults under 65, VA coverage (or multiple types): 0.6% (New Jersey: 0.4%)
> Adults under 65, employer-based insurance (or multiple types): 38.0% (New Jersey: 66.5%)
> Adults under 65, direct-purchase insurance (or multiple types): 5.8% (New Jersey: 8.9%)
> Adults under 65, Tricare/military insurance (or many types): 0.6% (New Jersey: 0.7%)

Source: DenisTangneyJr / Getty Images
New Mexico: Santa Fe
> Adults under 65, no health insurance: 16.4% (New Mexico: 11.4%)
> Adults under 65, Medicare coverage (or multiple types): 2.9% (New Mexico: 3.6%)
> Adults under 65, Medicaid coverage (or multiple types): 29.2% (New Mexico: 35.6%)
> Adults under 65, VA coverage (or multiple types): 1.1% (New Mexico: 1.7%)
> Adults under 65, employer-based insurance (or multiple types): 45.2% (New Mexico: 46.4%)
> Adults under 65, direct-purchase insurance (or multiple types): 12.0% (New Mexico: 8.0%)
> Adults under 65, Tricare/military insurance (or many types): 1.2% (New Mexico: 3.3%)
[in-text-ad]
Source: OlegAlbinsky / Getty Images
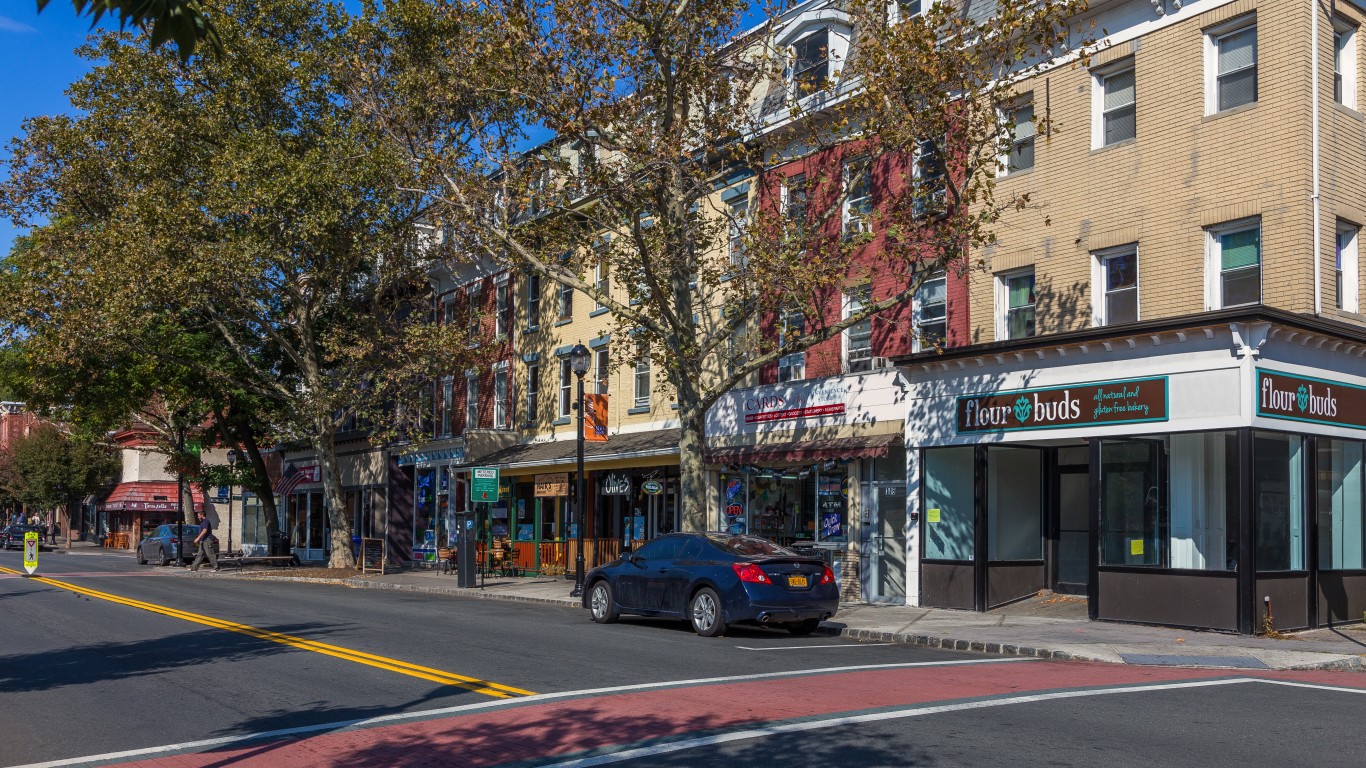
New York: Spring Valley
> Adults under 65, no health insurance: 19.9% (New York: 6.7%)
> Adults under 65, Medicare coverage (or multiple types): 2.7% (New York: 2.8%)
> Adults under 65, Medicaid coverage (or multiple types): 48.6% (New York: 26.9%)
> Adults under 65, VA coverage (or multiple types): 0.1% (New York: 0.6%)
> Adults under 65, employer-based insurance (or multiple types): 27.4% (New York: 59.7%)
> Adults under 65, direct-purchase insurance (or multiple types): 7.2% (New York: 10.8%)
> Adults under 65, Tricare/military insurance (or many types): 0.3% (New York: 0.7%)

Source: Beckycafferylepage / Wikimedia Commons
North Carolina: Monroe
> Adults under 65, no health insurance: 21.3% (North Carolina: 12.6%)
> Adults under 65, Medicare coverage (or multiple types): 2.5% (North Carolina: 3.5%)
> Adults under 65, Medicaid coverage (or multiple types): 27.5% (North Carolina: 19.4%)
> Adults under 65, VA coverage (or multiple types): 0.7% (North Carolina: 1.7%)
> Adults under 65, employer-based insurance (or multiple types): 44.2% (North Carolina: 55.9%)
> Adults under 65, direct-purchase insurance (or multiple types): 7.6% (North Carolina: 11.7%)
> Adults under 65, Tricare/military insurance (or many types): 2.4% (North Carolina: 3.8%)
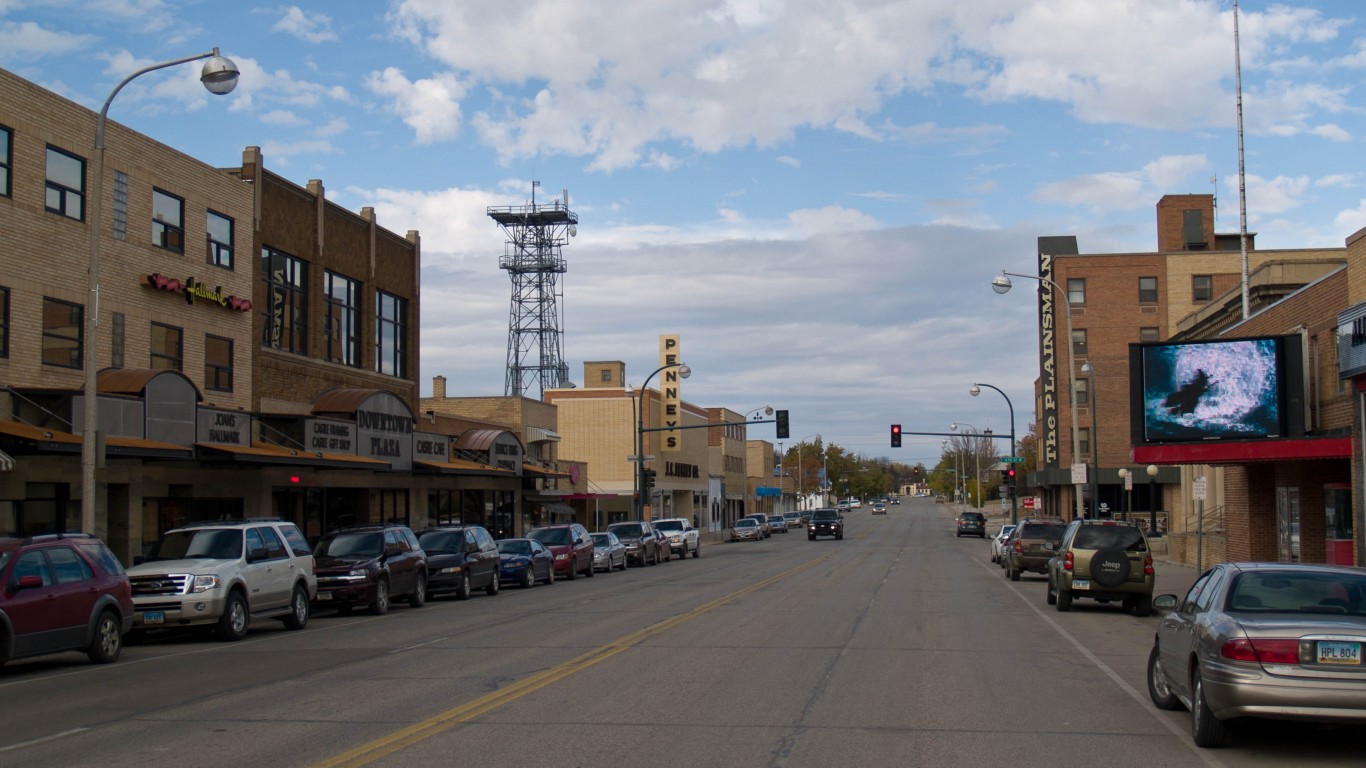
Source: Andrew Filer from Seattle (ex-Minneapolis) / Wikimedia Commons
North Dakota: Williston
> Adults under 65, no health insurance: 15.1% (North Dakota: 8.5%)
> Adults under 65, Medicare coverage (or multiple types): 1.0% (North Dakota: 2.1%)
> Adults under 65, Medicaid coverage (or multiple types): 7.0% (North Dakota: 11.4%)
> Adults under 65, VA coverage (or multiple types): 2.4% (North Dakota: 1.4%)
> Adults under 65, employer-based insurance (or multiple types): 70.8% (North Dakota: 67.6%)
> Adults under 65, direct-purchase insurance (or multiple types): 6.9% (North Dakota: 14.3%)
> Adults under 65, Tricare/military insurance (or many types): 1.5% (North Dakota: 3.4%)
[in-text-ad-2]

Source: Mark Kippes / iStock via Getty Images
Ohio: Barberton
> Adults under 65, no health insurance: 11.7% (Ohio: 7.2%)
> Adults under 65, Medicare coverage (or multiple types): 6.6% (Ohio: 3.3%)
> Adults under 65, Medicaid coverage (or multiple types): 32.7% (Ohio: 22.8%)
> Adults under 65, VA coverage (or multiple types): 1.9% (Ohio: 1.2%)
> Adults under 65, employer-based insurance (or multiple types): 49.7% (Ohio: 64.0%)
> Adults under 65, direct-purchase insurance (or multiple types): 6.7% (Ohio: 7.8%)
> Adults under 65, Tricare/military insurance (or many types): 0.5% (Ohio: 1.2%)

Source: DenisTangneyJr / iStock via Getty Images
Oklahoma: Muskogee
> Adults under 65, no health insurance: 19.4% (Oklahoma: 16.5%)
> Adults under 65, Medicare coverage (or multiple types): 5.4% (Oklahoma: 3.9%)
> Adults under 65, Medicaid coverage (or multiple types): 29.3% (Oklahoma: 18.8%)
> Adults under 65, VA coverage (or multiple types): 3.4% (Oklahoma: 1.8%)
> Adults under 65, employer-based insurance (or multiple types): 43.8% (Oklahoma: 54.4%)
> Adults under 65, direct-purchase insurance (or multiple types): 8.3% (Oklahoma: 9.9%)
> Adults under 65, Tricare/military insurance (or many types): 1.3% (Oklahoma: 3.1%)
[in-text-ad]

Source: benedek / iStock via Getty Images
Oregon: Woodburn
> Adults under 65, no health insurance: 12.2% (Oregon: 8.0%)
> Adults under 65, Medicare coverage (or multiple types): 1.6% (Oregon: 2.8%)
> Adults under 65, Medicaid coverage (or multiple types): 39.6% (Oregon: 24.7%)
> Adults under 65, VA coverage (or multiple types): 0.8% (Oregon: 1.6%)
> Adults under 65, employer-based insurance (or multiple types): 46.5% (Oregon: 59.2%)
> Adults under 65, direct-purchase insurance (or multiple types): 3.6% (Oregon: 11.0%)
> Adults under 65, Tricare/military insurance (or many types): 0.3% (Oregon: 1.4%)

Source: dougtone / Flickr
Pennsylvania: Norristown
> Adults under 65, no health insurance: 17.1% (Pennsylvania: 6.8%)
> Adults under 65, Medicare coverage (or multiple types): 4.2% (Pennsylvania: 3.2%)
> Adults under 65, Medicaid coverage (or multiple types): 35.3% (Pennsylvania: 21.1%)
> Adults under 65, VA coverage (or multiple types): 0.8% (Pennsylvania: 1.0%)
> Adults under 65, employer-based insurance (or multiple types): 45.1% (Pennsylvania: 65.2%)
> Adults under 65, direct-purchase insurance (or multiple types): 5.2% (Pennsylvania: 10.2%)
> Adults under 65, Tricare/military insurance (or many types): 0.1% (Pennsylvania: 1.0%)

Source: DenisTangneyJr / Getty Images
Rhode Island: Providence
> Adults under 65, no health insurance: 8.3% (Rhode Island: 5.3%)
> Adults under 65, Medicare coverage (or multiple types): 3.4% (Rhode Island: 3.4%)
> Adults under 65, Medicaid coverage (or multiple types): 39.3% (Rhode Island: 23.2%)
> Adults under 65, VA coverage (or multiple types): 0.6% (Rhode Island: 1.0%)
> Adults under 65, employer-based insurance (or multiple types): 45.5% (Rhode Island: 64.1%)
> Adults under 65, direct-purchase insurance (or multiple types): 10.6% (Rhode Island: 10.8%)
> Adults under 65, Tricare/military insurance (or many types): 0.4% (Rhode Island: 1.4%)
[in-text-ad-2]

Source: Sean Pavone / Getty Images
South Carolina: Myrtle Beach
> Adults under 65, no health insurance: 23.5% (South Carolina: 12.6%)
> Adults under 65, Medicare coverage (or multiple types): 3.6% (South Carolina: 3.8%)
> Adults under 65, Medicaid coverage (or multiple types): 26.0% (South Carolina: 20.7%)
> Adults under 65, VA coverage (or multiple types): 1.2% (South Carolina: 1.8%)
> Adults under 65, employer-based insurance (or multiple types): 34.4% (South Carolina: 56.5%)
> Adults under 65, direct-purchase insurance (or multiple types): 13.8% (South Carolina: 10.4%)
> Adults under 65, Tricare/military insurance (or many types): 2.4% (South Carolina: 3.7%)

Source: peeterv / Getty Images
South Dakota: Rapid City
> Adults under 65, no health insurance: 14.1% (South Dakota: 11.2%)
> Adults under 65, Medicare coverage (or multiple types): 3.8% (South Dakota: 2.7%)
> Adults under 65, Medicaid coverage (or multiple types): 19.2% (South Dakota: 15.3%)
> Adults under 65, VA coverage (or multiple types): 3.2% (South Dakota: 1.9%)
> Adults under 65, employer-based insurance (or multiple types): 53.6% (South Dakota: 61.1%)
> Adults under 65, direct-purchase insurance (or multiple types): 11.2% (South Dakota: 13.7%)
> Adults under 65, Tricare/military insurance (or many types): 7.4% (South Dakota: 3.4%)
[in-text-ad]

Source: Public Domain / Wikimedia Commons
Tennessee: Morristown
> Adults under 65, no health insurance: 19.7% (Tennessee: 11.4%)
> Adults under 65, Medicare coverage (or multiple types): 7.4% (Tennessee: 3.8%)
> Adults under 65, Medicaid coverage (or multiple types): 36.9% (Tennessee: 21.6%)
> Adults under 65, VA coverage (or multiple types): 1.2% (Tennessee: 1.6%)
> Adults under 65, employer-based insurance (or multiple types): 36.4% (Tennessee: 57.8%)
> Adults under 65, direct-purchase insurance (or multiple types): 6.3% (Tennessee: 10.1%)
> Adults under 65, Tricare/military insurance (or many types): 0.6% (Tennessee: 2.7%)

Source: Justin Hundsnurscher / Wikimedia Commons
Texas: San Juan
> Adults under 65, no health insurance: 37.2% (Texas: 19.4%)
> Adults under 65, Medicare coverage (or multiple types): 4.3% (Texas: 2.2%)
> Adults under 65, Medicaid coverage (or multiple types): 23.9% (Texas: 17.2%)
> Adults under 65, VA coverage (or multiple types): 1.3% (Texas: 1.3%)
> Adults under 65, employer-based insurance (or multiple types): 30.3% (Texas: 54.5%)
> Adults under 65, direct-purchase insurance (or multiple types): 6.3% (Texas: 9.4%)
> Adults under 65, Tricare/military insurance (or many types): 0.8% (Texas: 2.3%)

Source: SSLaker3 / Wikimedia Commons
Utah: South Salt Lake
> Adults under 65, no health insurance: 21.9% (Utah: 10.4%)
> Adults under 65, Medicare coverage (or multiple types): 2.5% (Utah: 1.5%)
> Adults under 65, Medicaid coverage (or multiple types): 14.0% (Utah: 10.7%)
> Adults under 65, VA coverage (or multiple types): 0.4% (Utah: 0.8%)
> Adults under 65, employer-based insurance (or multiple types): 56.6% (Utah: 68.4%)
> Adults under 65, direct-purchase insurance (or multiple types): 9.0% (Utah: 12.5%)
> Adults under 65, Tricare/military insurance (or many types): 0.0% reported (Utah: 1.8%)
[in-text-ad-2]

Source: DenisTangneyJr / Getty Images
Vermont: Burlington*
> Adults under 65, no health insurance: 3.9% (Vermont: 4.8%)
> Adults under 65, Medicare coverage (or multiple types): 3.3% (Vermont: 3.8%)
> Adults under 65, Medicaid coverage (or multiple types): 22.1% (Vermont: 27.1%)
> Adults under 65, VA coverage (or multiple types): 0.6% (Vermont: 1.2%)
> Adults under 65, employer-based insurance (or multiple types): 63.9% (Vermont: 60.5%)
> Adults under 65, direct-purchase insurance (or multiple types): 13.7% (Vermont: 10.1%)
> Adults under 65, Tricare/military insurance (or many types): 0.8% (Vermont: 1.6%)
*Because Burlington is the only eligible city in Vermont, it is the city with the worst health insurance coverage by default.

Source: Brettc23 / Wikimedia Commons
Virginia: Marumsco
> Adults under 65, no health insurance: 23.5% (Virginia: 10.0%)
> Adults under 65, Medicare coverage (or multiple types): 1.9% (Virginia: 2.7%)
> Adults under 65, Medicaid coverage (or multiple types): 14.6% (Virginia: 12.6%)
> Adults under 65, VA coverage (or multiple types): 1.9% (Virginia: 2.1%)
> Adults under 65, employer-based insurance (or multiple types): 52.6% (Virginia: 63.9%)
> Adults under 65, direct-purchase insurance (or multiple types): 8.6% (Virginia: 11.0%)
> Adults under 65, Tricare/military insurance (or many types): 4.0% (Virginia: 7.1%)
[in-text-ad]

Source: BehindTheLens / Getty Images
Washington: Yakima
> Adults under 65, no health insurance: 14.6% (Washington: 7.3%)
> Adults under 65, Medicare coverage (or multiple types): 4.3% (Washington: 2.5%)
> Adults under 65, Medicaid coverage (or multiple types): 38.0% (Washington: 22.0%)
> Adults under 65, VA coverage (or multiple types): 0.8% (Washington: 1.6%)
> Adults under 65, employer-based insurance (or multiple types): 42.1% (Washington: 62.3%)
> Adults under 65, direct-purchase insurance (or multiple types): 7.2% (Washington: 9.7%)
> Adults under 65, Tricare/military insurance (or many types): 0.8% (Washington: 3.6%)

Source: traveler1116 / Getty Images
West Virginia: Huntington
> Adults under 65, no health insurance: 10.4% (West Virginia: 7.4%)
> Adults under 65, Medicare coverage (or multiple types): 6.6% (West Virginia: 5.4%)
> Adults under 65, Medicaid coverage (or multiple types): 35.6% (West Virginia: 30.3%)
> Adults under 65, VA coverage (or multiple types): 1.9% (West Virginia: 1.8%)
> Adults under 65, employer-based insurance (or multiple types): 46.7% (West Virginia: 57.1%)
> Adults under 65, direct-purchase insurance (or multiple types): 8.5% (West Virginia: 6.4%)
> Adults under 65, Tricare/military insurance (or many types): 1.2% (West Virginia: 1.6%)

Wisconsin: Fitchburg
> Adults under 65, no health insurance: 10.7% (Wisconsin: 6.4%)
> Adults under 65, Medicare coverage (or multiple types): 1.2% (Wisconsin: 2.7%)
> Adults under 65, Medicaid coverage (or multiple types): 17.0% (Wisconsin: 18.0%)
> Adults under 65, VA coverage (or multiple types): 0.8% (Wisconsin: 1.1%)
> Adults under 65, employer-based insurance (or multiple types): 66.3% (Wisconsin: 69.1%)
> Adults under 65, direct-purchase insurance (or multiple types): 10.0% (Wisconsin: 9.4%)
> Adults under 65, Tricare/military insurance (or many types): 0.3% (Wisconsin: 1.0%)
[in-text-ad-2]
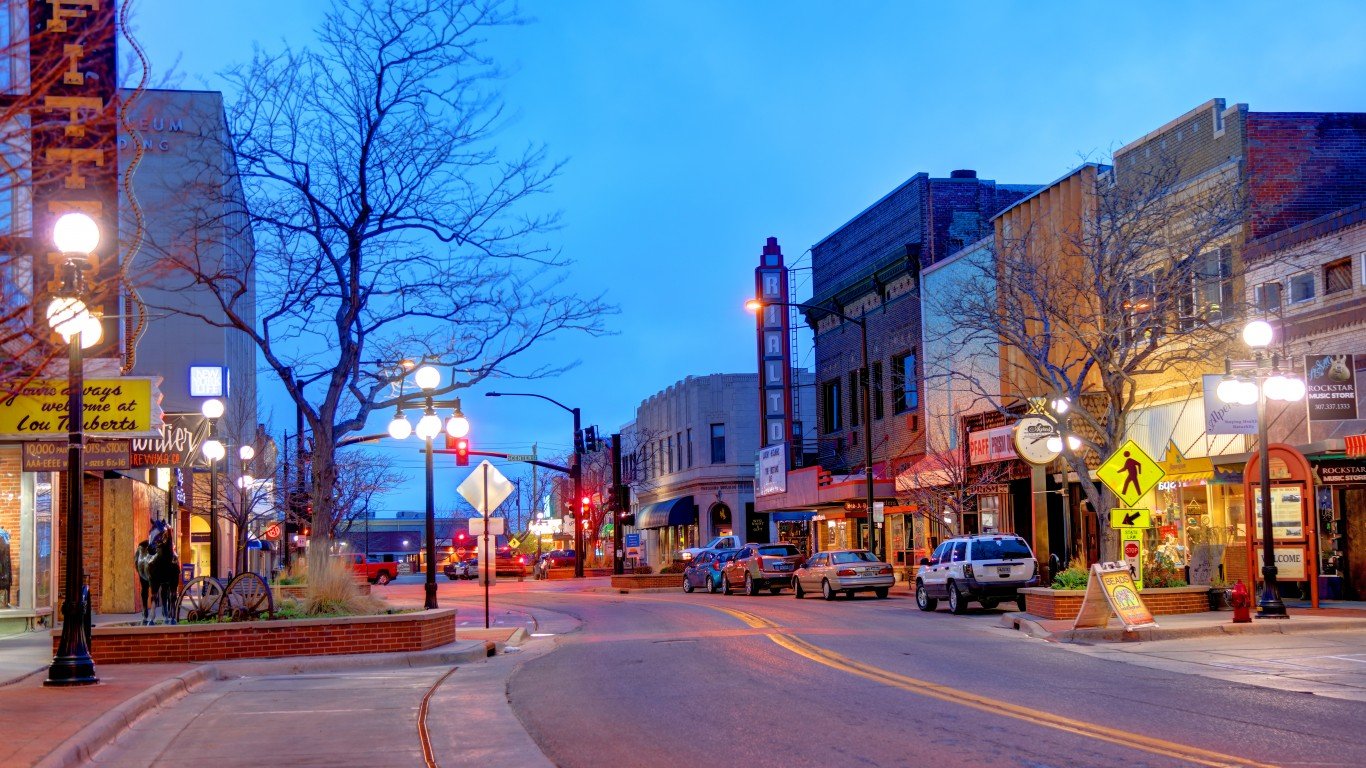
Source: DenisTangneyJr / iStock Unreleased via Getty Images
Wyoming: Casper
> Adults under 65, no health insurance: 15.7% (Wyoming: 13.5%)
> Adults under 65, Medicare coverage (or multiple types): 2.2% (Wyoming: 2.3%)
> Adults under 65, Medicaid coverage (or multiple types): 12.7% (Wyoming: 12.1%)
> Adults under 65, VA coverage (or multiple types): 1.7% (Wyoming: 1.8%)
> Adults under 65, employer-based insurance (or multiple types): 64.1% (Wyoming: 64.1%)
> Adults under 65, direct-purchase insurance (or multiple types): 9.5% (Wyoming: 11.4%)
> Adults under 65, Tricare/military insurance (or many types): 1.7% (Wyoming: 3.0%)
Methodology:
To determine the city with the worst health insurance coverage in every state, 24/7 Wall St. reviewed five-year estimates of the percentage of the noninstitutionalized civilian population under 65 without health insurance from the U.S. Census Bureau’s 2019 American Community Survey.
We used census “place” geographies — a category that includes 29,573 incorporated legal entities and census-designated statistical entities. Of those, 29,319 had boundaries that fell within one of the 50 states, while the rest were in the District of Columbia or Puerto Rico.
We defined cities based on a population threshold — having more than 25,000 people — and 1,774 of the places fell within this threshold.
Cities were excluded if the sampling error associated with a city’s data was deemed too high.
The sampling error was defined as too high if the coefficient of variation — a statistical assessment of how reliable an estimate is — for a city’s under 65 uninsured rate was above 15% and greater than two standard deviations above the mean CV for all cities’ under 65 uninsured rates. We similarly excluded cities that had a sampling error too high for their under 65 noninstitutionalized civilian population, using the same definition.
We selected the under 65 age group because Americans become eligible for Medicare at age 65, and the uninsured rate for the population above this age is less than 1% nationwide. However, because the census does not publish insurance coverage estimates specifically for the under 65 age group, we aggregated the data from more granular age breakouts.
To ensure each aggregate estimate’s sampling error could be assessed using the definition above, we derived a margin of error for each aggregate estimate using the successive differences replication variance estimation methodology recommended and used by the U.S. Census Bureau.
The remaining 1,668 places were ranked within their state based on their under 65 uninsured rates. To break ties, we used the number of insured people in the same population group.
The share of the population covered by each type of insurance — Medicare, Medicaid, VA, employer, direct-purchase, and Tricare/military — are for the same cohort and are also aggregated from five-year ACS estimates. The estimates reflect people who are covered by that type of insurance alone or in combination with other types on the list. So, when a person is covered by more than one type of insurance, they are included in each group.
Sponsored: Find a Qualified Financial Advisor
Finding a qualified financial advisor doesn’t have to be hard. SmartAsset’s free tool matches you with up to 3 fiduciary financial advisors in your area in 5 minutes. Each advisor has been vetted by SmartAsset and is held to a fiduciary standard to act in your best interests. If you’re ready to be matched with local advisors that can help you achieve your financial goals, get started now.
Thank you for reading! Have some feedback for us?
Contact the 24/7 Wall St. editorial team.
Editors' Picks