
In the early months of the COVID-19 pandemic, U.S. home sales slumped. Since then, however, the market has come roaring back — and rising demand, in conjunction with a relatively low supply of housing, has caused home values to surge.
According to estimates from Zillow, a Seattle-based real estate data company, between June 2020 and June 2021, the typical single-family American home appreciated in value from $255,008 to $293,349, a 15.0% increase. Of course, housing markets also respond to local forces, and in some parts of the country, home values have appreciated at more than double the national rate.
In 50 cities and towns with populations of 50,000 or more, home values have appreciated by at least 26.0% over the past year. In some of them, the value of a typical family home has surged by more than 42.7%. Though these communities span the country, they tend to be concentrated in the Western United States.
One factor that can contribute to rapidly climbing home prices at a local level is demand. And demand for housing is often precipitated by a growing population. According to the most recent available Census data, 41 of the 50 cities and towns on this list reported population growth over the last one-year period.
Home prices are also largely dictated by what local residents can afford, and rising home values can often be the result of rising incomes. Of the 50 places on this list for which income data is available, 50 reported year-over-year growth in median household income, based on the most recent available data Census data.

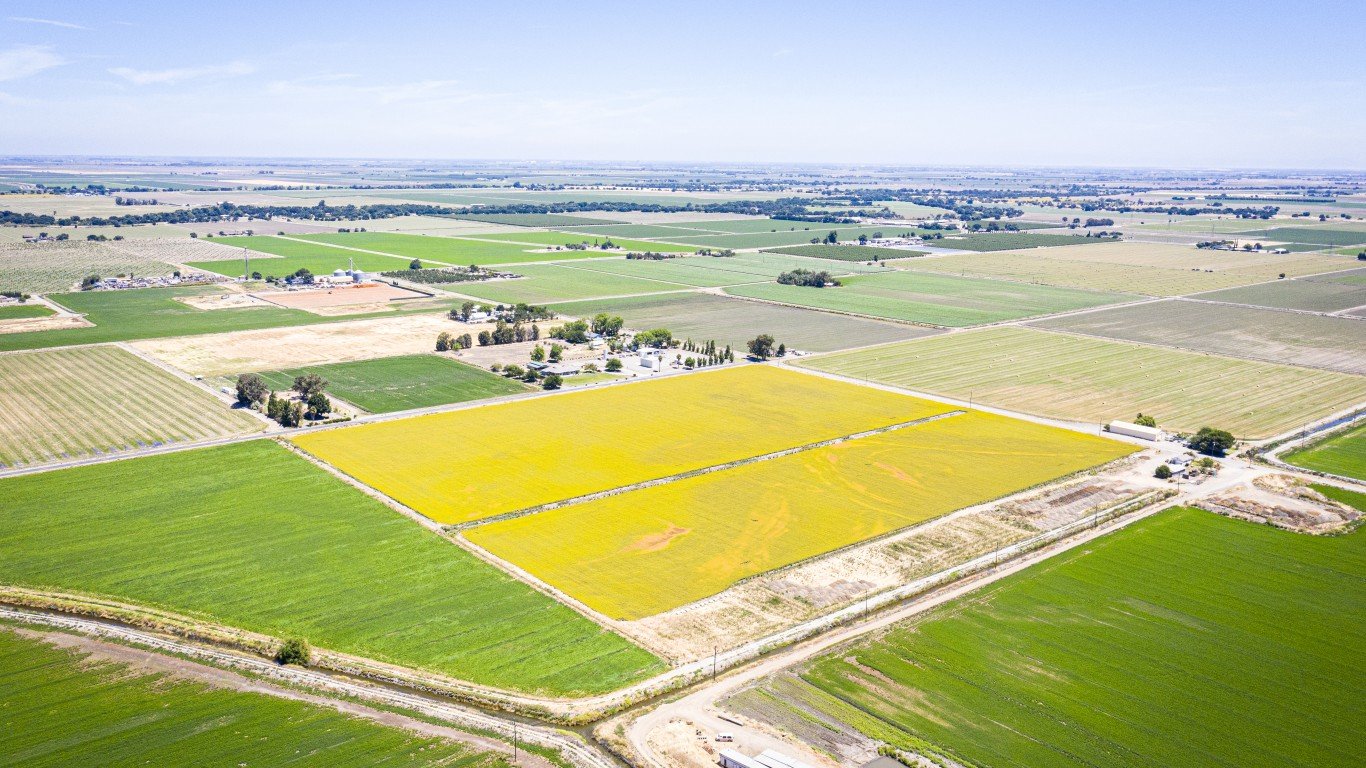
Source: Renphoto / iStock via Getty Images
50. Lehi, Utah
> 1-yr. change in median home value: +26.0% (+$108,644)
> Median home value; June 2021: $526,157
> 1-yr. population change: +4.1% (+2,498)
> Population: 64,006
> 1-yr. change in median household income: +6.8% (+$6,082)
> Median household income: $95,510
These are all the counties in Utah where COVID-19 is slowing (and where it’s still getting worse).
Source: DenisTangneyJr / iStock via Getty Images
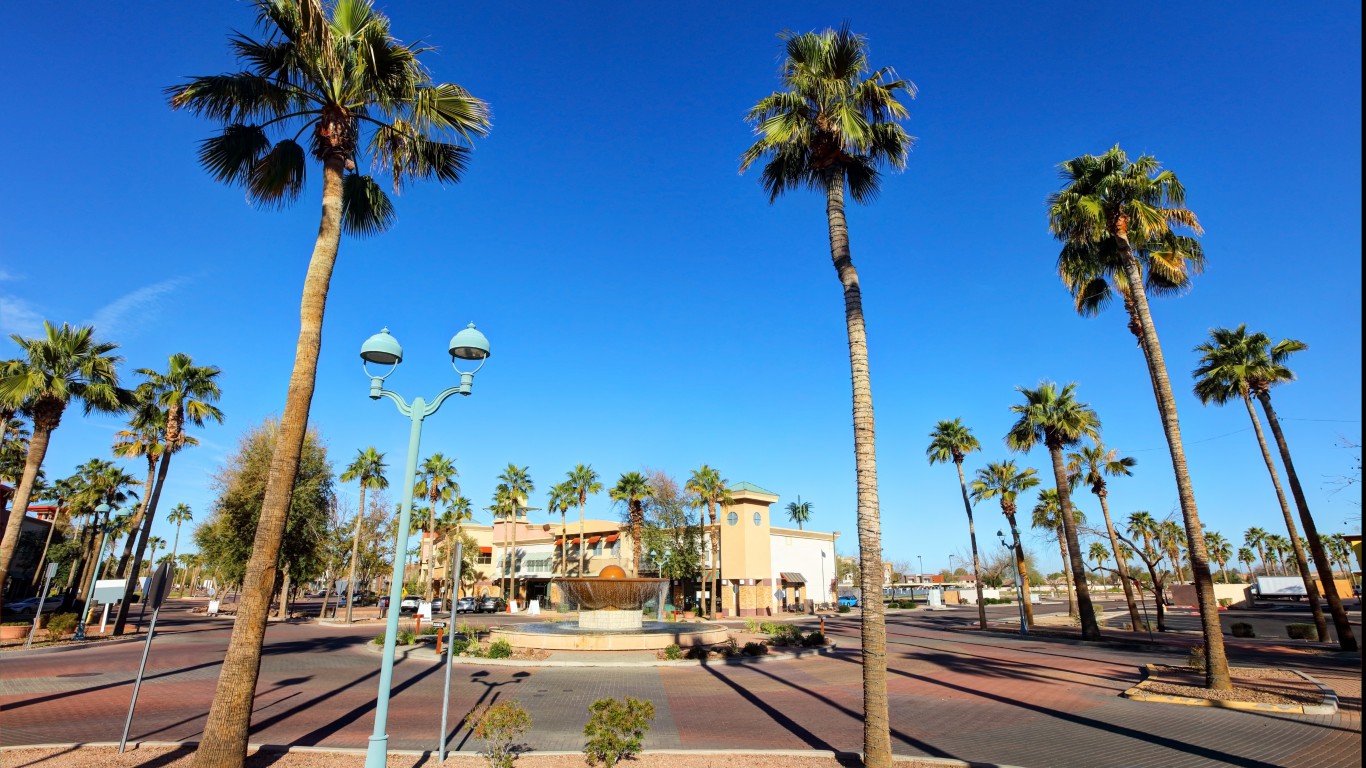
49. Gilbert, Arizona
> 1-yr. change in median home value: +26.1% (+$97,752)
> Median home value; June 2021: $472,655
> 1-yr. population change: +2.4% (+5,770)
> Population: 243,254
> 1-yr. change in median household income: +4.9% (+$4,507)
> Median household income: $96,857

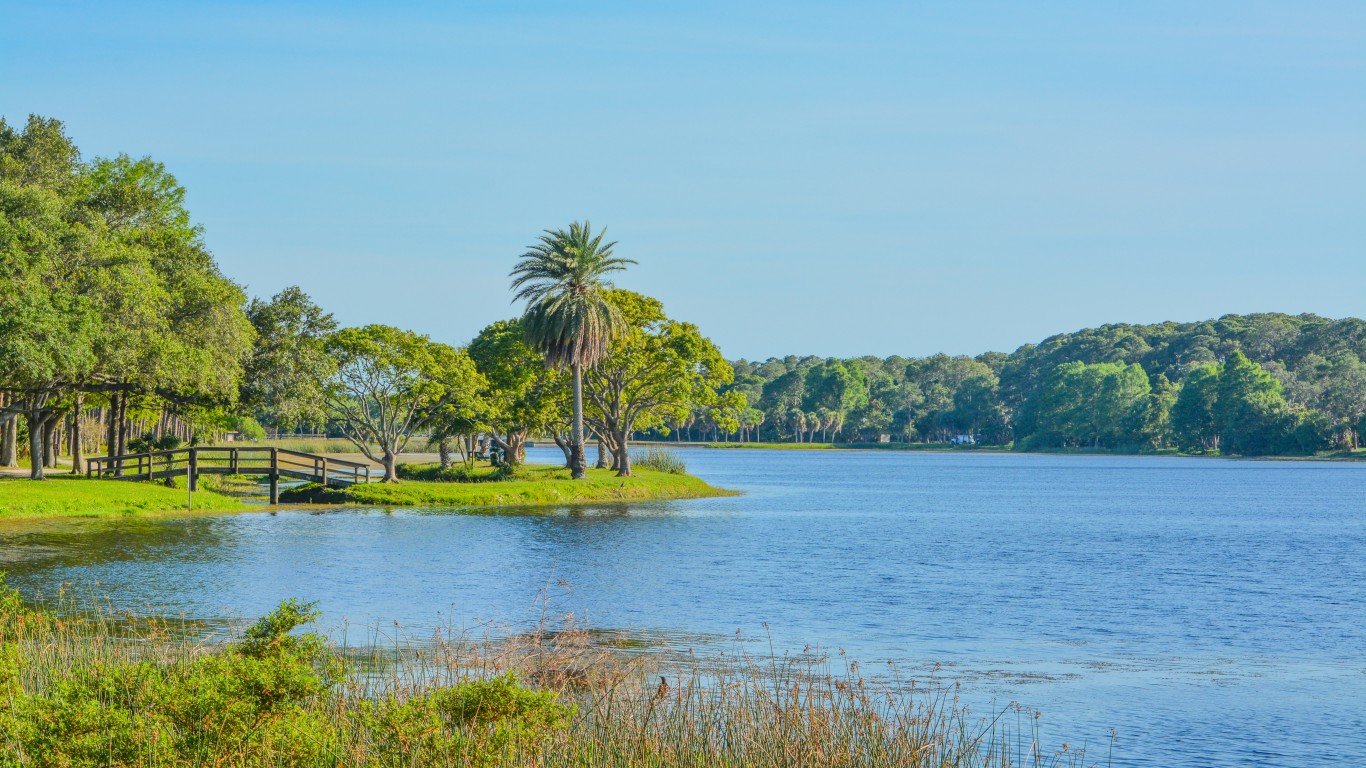
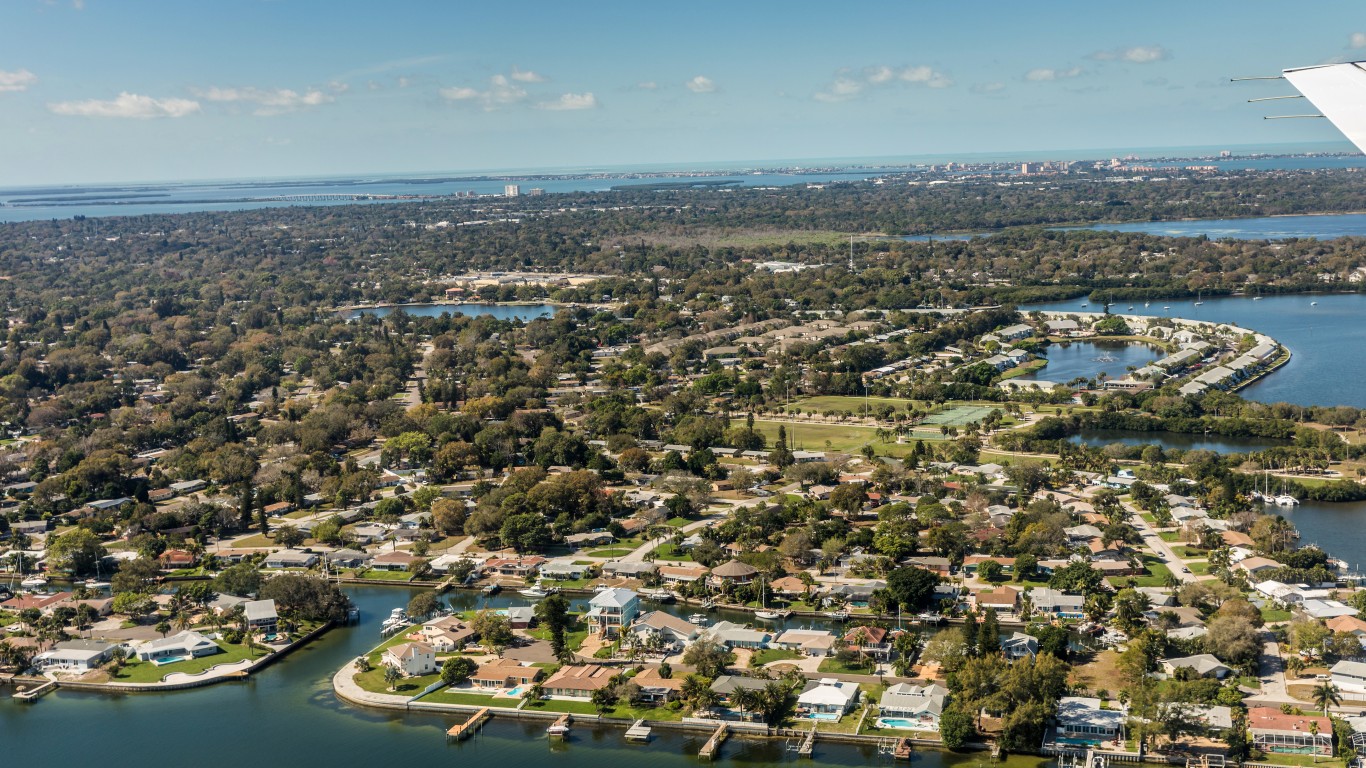
48. Pinellas Park, Florida
> 1-yr. change in median home value: +26.1% (+$48,802)
> Median home value; June 2021: $235,861
> 1-yr. population change: +1.1% (+566)
> Population: 52,857
> 1-yr. change in median household income: +11.1% (+$4,942)
> Median household income: $49,652

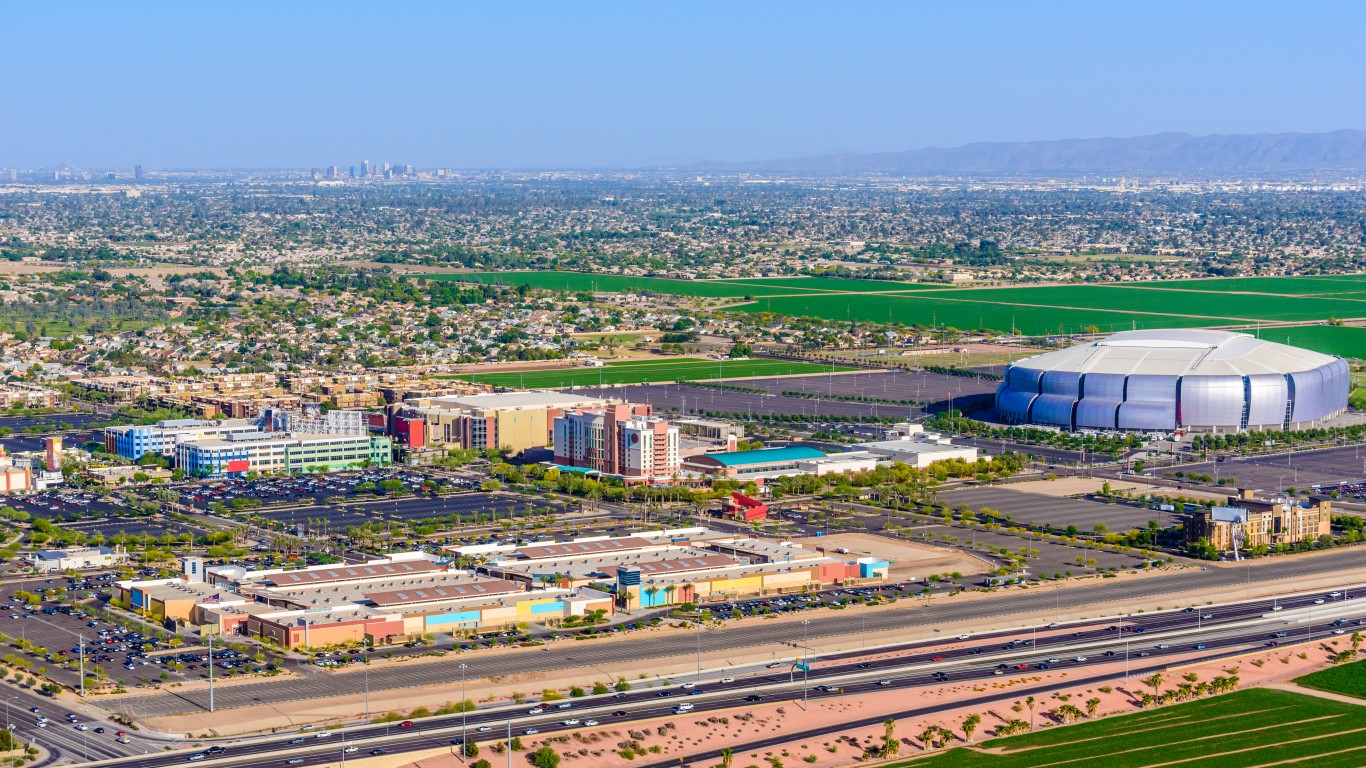
47. Goodyear, Arizona
> 1-yr. change in median home value: +26.2% (+$83,339)
> Median home value; June 2021: $401,764
> 1-yr. population change: +3.7% (+2,895)
> Population: 80,371
> 1-yr. change in median household income: +4.4% (+$3,530)
> Median household income: $83,866

Source: Sundry Photography / iStock via Getty Images
46. Pleasanton, California
> 1-yr. change in median home value: +26.2% (+$296,221)
> Median home value; June 2021: $1,426,417
> 1-yr. population change: +1.1% (+870)
> Population: 81,717
> 1-yr. change in median household income: +5.1% (+$7,548)
> Median household income: $156,400

Source: DenisTangneyJr / E+ via Getty Images
45. Mesa, Arizona
> 1-yr. change in median home value: +26.3% (+$74,517)
> Median home value; June 2021: $358,328
> 1-yr. population change: +1.7% (+8,526)
> Population: 499,720
> 1-yr. change in median household income: +6.4% (+$3,481)
> Median household income: $58,181

Source: Greg Thomsen / iStock via Getty Images
44. Peoria, Arizona
> 1-yr. change in median home value: +26.3% (+$83,049)
> Median home value; June 2021: $399,025
> 1-yr. population change: +2.2% (+3,624)
> Population: 168,196
> 1-yr. change in median household income: +3.1% (+$2,284)
> Median household income: $75,323

Source: gregobagel / Getty Images
43. Spokane, Washington
> 1-yr. change in median home value: +26.3% (+$71,574)
> Median home value; June 2021: $343,686
> 1-yr. population change: +1.2% (+2,549)
> Population: 217,353
> 1-yr. change in median household income: +5.2% (+$2,484)
> Median household income: $50,306

Source: benedek / iStock via Getty Images
42. Spokane Valley, Washington
> 1-yr. change in median home value: +26.6% (+$76,325)
> Median home value; June 2021: $363,620
> 1-yr. population change: +1.6% (+1,492)
> Population: 97,562
> 1-yr. change in median household income: +5.0% (+$2,451)
> Median household income: $51,961
Source: Norm Lane / iStock via Getty Images
41. Largo, Florida
> 1-yr. change in median home value: +26.6% (+$55,475)
> Median home value; June 2021: $263,992
> 1-yr. population change: +1.1% (+887)
> Population: 84,130
> 1-yr. change in median household income: +4.5% (+$1,907)
> Median household income: $44,323

Source: BCFC / Getty Images
40. Scottsdale, Arizona
> 1-yr. change in median home value: +26.7% (+$144,037)
> Median home value; June 2021: $684,324
> 1-yr. population change: +1.9% (+4,576)
> Population: 250,602
> 1-yr. change in median household income: +4.3% (+$3,612)
> Median household income: $88,213
Source: dszc / iStock via Getty Images
39. Glendale, Arizona
> 1-yr. change in median home value: +26.7% (+$70,231)
> Median home value; June 2021: $333,159
> 1-yr. population change: +0.9% (+2,299)
> Population: 247,813
> 1-yr. change in median household income: +5.2% (+$2,706)
> Median household income: $55,020

Source: DenisTangneyJr / Getty Images
38. Bridgeport, Connecticut
> 1-yr. change in median home value: +26.8% (+$56,955)
> Median home value; June 2021: $269,675
> 1-yr. population change: –0.5% (-778)
> Population: 145,639
> 1-yr. change in median household income: +2.7% (+$1,221)
> Median household income: $46,662
Source: Public Domain / Wikimedia Commons
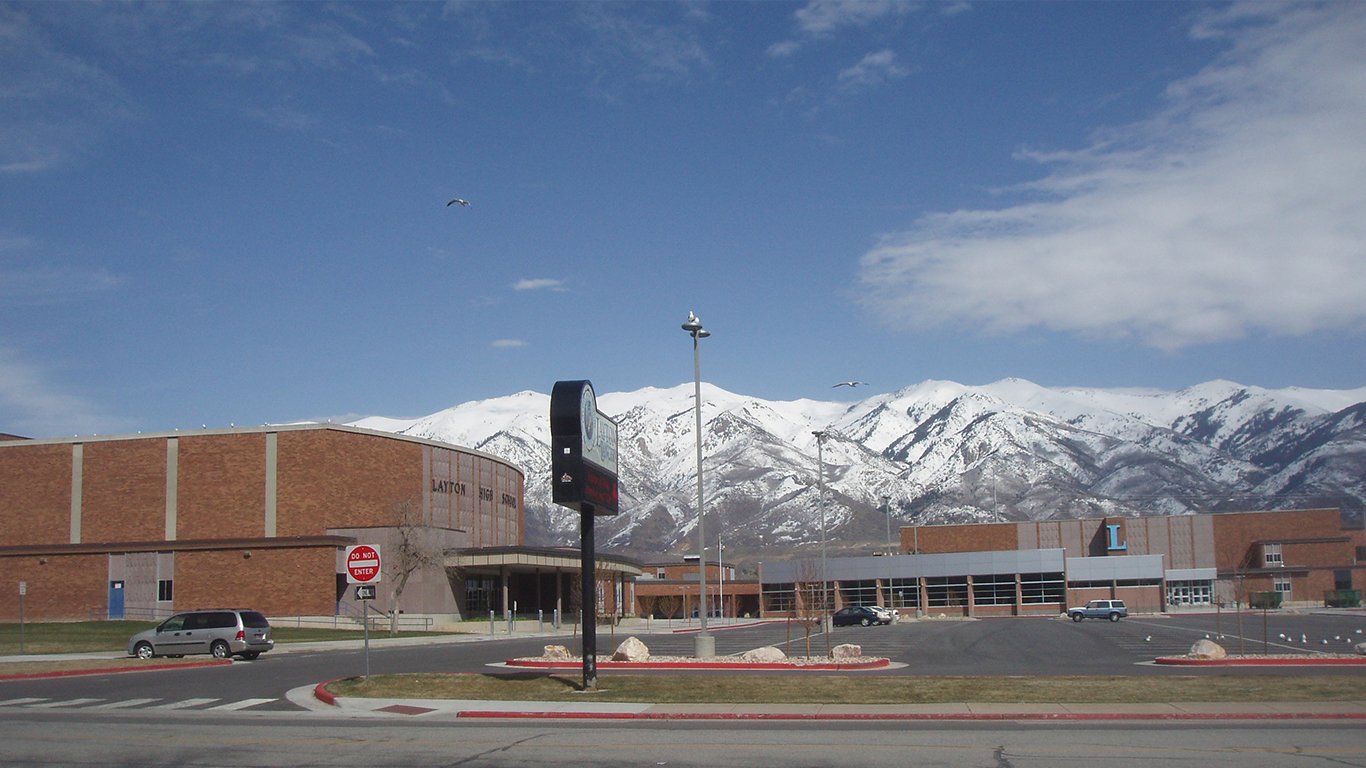
37. Layton, Utah
> 1-yr. change in median home value: +26.8% (+$93,928)
> Median home value; June 2021: $444,203
> 1-yr. population change: +1.5% (+1,091)
> Population: 76,197
> 1-yr. change in median household income: +3.4% (+$2,538)
> Median household income: $77,426
These are all the counties in Utah where COVID-19 is slowing (and where it’s still getting worse).

Source: miroslav_1 / Getty Images
36. Flagstaff, Arizona
> 1-yr. change in median home value: +26.9% (+$107,638)
> Median home value; June 2021: $507,639
> 1-yr. population change: +1.7% (+1,200)
> Population: 72,402
> 1-yr. change in median household income: +4.9% (+$2,733)
> Median household income: $58,748
Source: adamkaz / iStock via Getty Images
35. Tracy, California
> 1-yr. change in median home value: +27.0% (+$142,697)
> Median home value; June 2021: $671,438
> 1-yr. population change: +2.1% (+1,869)
> Population: 90,675
> 1-yr. change in median household income: +4.1% (+$3,656)
> Median household income: $92,046

34. Surprise, Arizona
> 1-yr. change in median home value: +27.0% (+$77,357)
> Median home value; June 2021: $363,701
> 1-yr. population change: +1.9% (+2,546)
> Population: 135,450
> 1-yr. change in median household income: +6.0% (+$3,916)
> Median household income: $69,076

Source: Tomsmith585 / iStock Editorial via Getty Images
33. Castro Valley, California
> 1-yr. change in median home value: +27.1% (+$235,524)
> Median home value; June 2021: $1,105,638
> 1-yr. population change: –0.4% (-275)
> Population: 63,013
> 1-yr. change in median household income: +6.6% (+$6,672)
> Median household income: $108,488
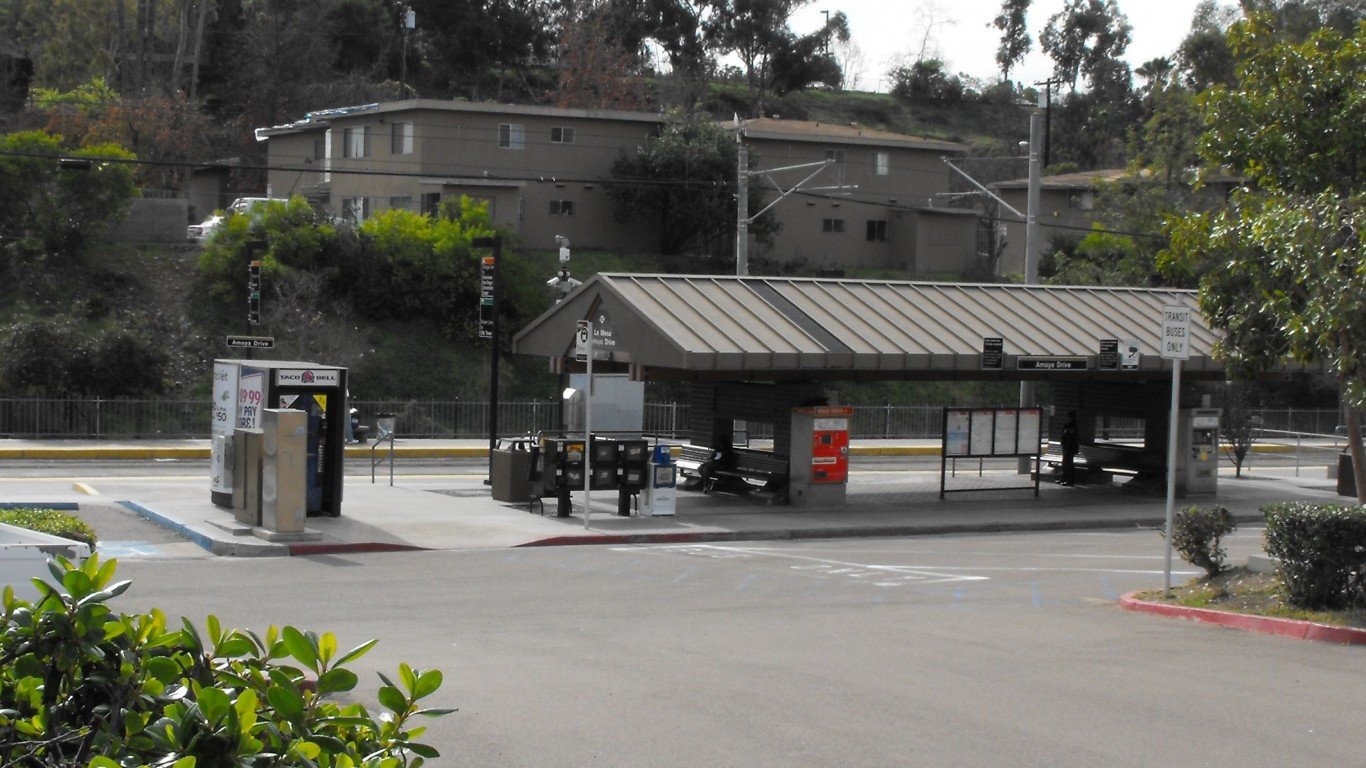
Source: Public Domain / Wikimedia Commons
32. La Mesa, California
> 1-yr. change in median home value: +27.2% (+$162,591)
> Median home value; June 2021: $760,187
> 1-yr. population change: -0.0% (-6)
> Population: 59,556
> 1-yr. change in median household income: +3.3% (+$2,104)
> Median household income: $66,051

31. Orem, Utah
> 1-yr. change in median home value: +27.3% (+$95,250)
> Median home value; June 2021: $444,613
> 1-yr. population change: +1.4% (+1,297)
> Population: 96,725
> 1-yr. change in median household income: +5.2% (+$3,217)
> Median household income: $64,590
These are all the counties in Utah where COVID-19 is slowing (and where it’s still getting worse).

Source: Dreamframer / Getty Images
30. Phoenix, Arizona
> 1-yr. change in median home value: +27.4% (+$75,266)
> Median home value; June 2021: $350,077
> 1-yr. population change: +1.4% (+22,946)
> Population: 1,633,017
> 1-yr. change in median household income: +4.9% (+$2,694)
> Median household income: $57,459
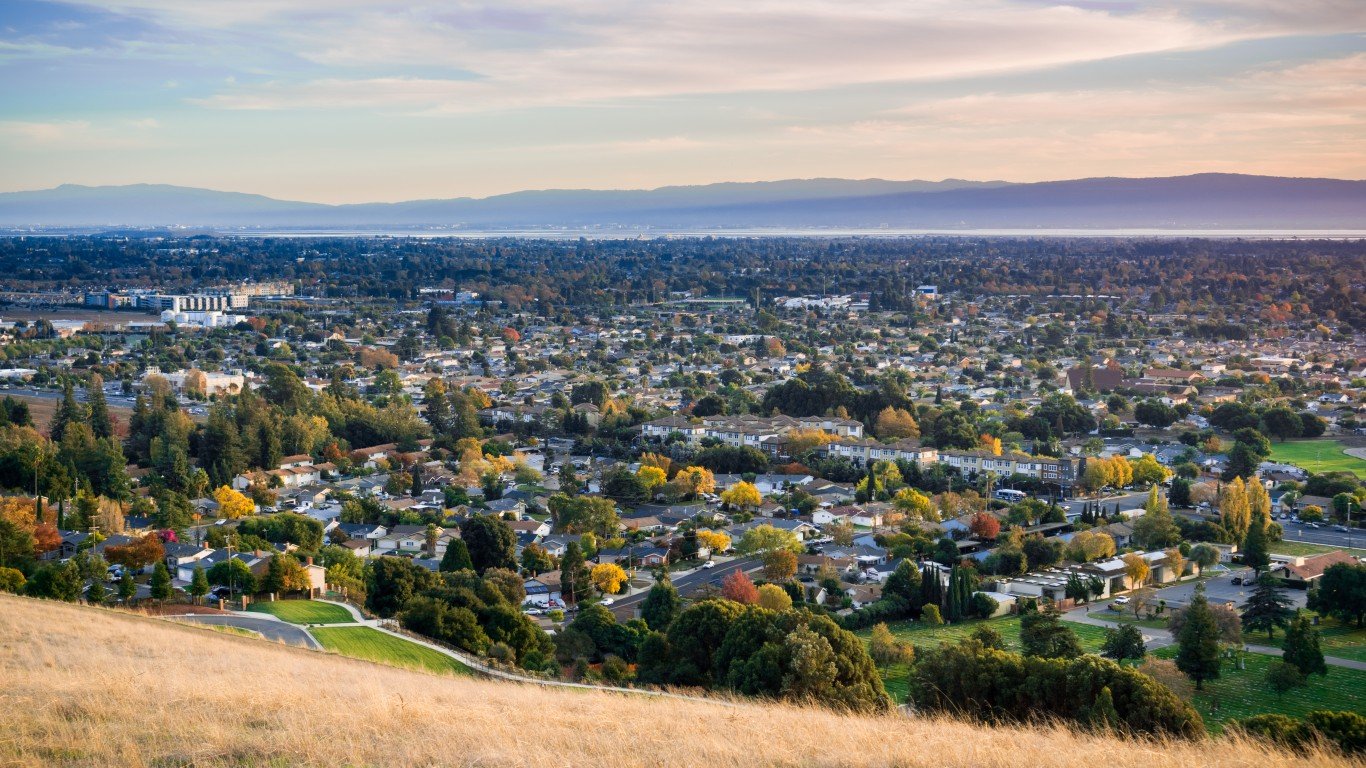
Source: Sundry Photography / iStock via Getty Images
29. Union City, California
> 1-yr. change in median home value: +27.6% (+$251,673)
> Median home value; June 2021: $1,164,901
> 1-yr. population change: +0.2% (+121)
> Population: 74,722
> 1-yr. change in median household income: +8.8% (+$9,233)
> Median household income: $114,681

Source: Cheri Alguire / iStock via Getty Images
28. Casa Grande, Arizona
> 1-yr. change in median home value: +27.8% (+$58,430)
> Median home value; June 2021: $268,895
> 1-yr. population change: +2.5% (+1,337)
> Population: 55,653
> 1-yr. change in median household income: +7.7% (+$3,772)
> Median household income: $52,841

27. Avondale, Arizona
> 1-yr. change in median home value: +27.8% (+$72,604)
> Median home value; June 2021: $333,544
> 1-yr. population change: +1.6% (+1,344)
> Population: 84,736
> 1-yr. change in median household income: +4.9% (+$2,887)
> Median household income: $61,825

Source: jmoor17 / Getty Images
26. Lake Havasu City, Arizona
> 1-yr. change in median home value: +27.8% (+$85,271)
> Median home value; June 2021: $391,544
> 1-yr. population change: +1.0% (+543)
> Population: 54,495
> 1-yr. change in median household income: +4.7% (+$2,418)
> Median household income: $53,605

Source: Sean Pavone / Getty Images
25. Cleveland, Ohio
> 1-yr. change in median home value: +28.1% (+$20,146)
> Median home value; June 2021: $91,757
> 1-yr. population change: –0.5% (-2,116)
> Population: 385,282
> 1-yr. change in median household income: +6.5% (+$1,899)
> Median household income: $30,907
These are all the counties in Ohio where COVID-19 is slowing (and where it’s still getting worse).

Source: johnnya123 / Getty Images
24. Ogden, Utah
> 1-yr. change in median home value: +28.4% (+$71,464)
> Median home value; June 2021: $323,137
> 1-yr. population change: +0.8% (+707)
> Population: 86,833
> 1-yr. change in median household income: +7.0% (+$3,254)
> Median household income: $50,061
These are all the counties in Utah where COVID-19 is slowing (and where it’s still getting worse).
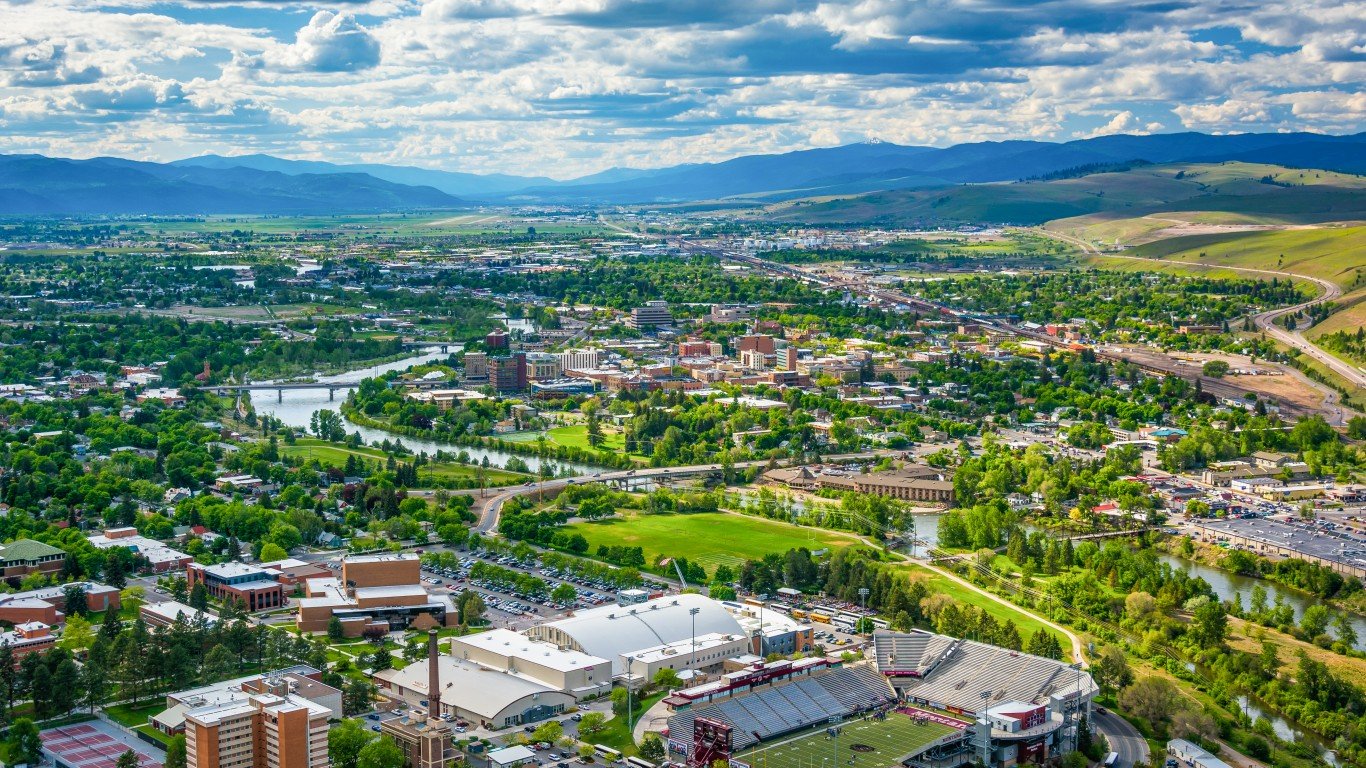
Source: Jon Bilous / iStock via Getty Images
23. Missoula, Montana
> 1-yr. change in median home value: +28.5% (+$103,562)
> Median home value; June 2021: $467,571
> 1-yr. population change: +2.2% (+1,585)
> Population: 73,710
> 1-yr. change in median household income: +5.4% (+$2,416)
> Median household income: $47,426

Source: Stephen Couch / iStock via Getty Images
22. San Tan Valley, Arizona
> 1-yr. change in median home value: +28.8% (+$77,515)
> Median home value; June 2021: $346,235
> 1-yr. population change: +3.7% (+3,462)
> Population: 96,692
> 1-yr. change in median household income: +0.8% (+$531)
> Median household income: $67,880

Source: SeanPavonePhoto / Getty Images
21. Jackson, Mississippi
> 1-yr. change in median home value: +29.1% (+$14,981)
> Median home value; June 2021: $66,445
> 1-yr. population change: –1.5% (-2,479)
> Population: 166,383
> 1-yr. change in median household income: +3.5% (+$1,325)
> Median household income: $38,888
Source: Murmakova / iStock via Getty Images
20. St. Petersburg, Florida
> 1-yr. change in median home value: +29.1% (+$64,246)
> Median home value; June 2021: $284,709
> 1-yr. population change: +0.9% (+2,297)
> Population: 261,338
> 1-yr. change in median household income: +5.9% (+$3,166)
> Median household income: $56,982

19. Buckeye, Arizona
> 1-yr. change in median home value: +29.2% (+$76,035)
> Median home value; June 2021: $336,176
> 1-yr. population change: +6.3% (+4,114)
> Population: 69,744
> 1-yr. change in median household income: +8.8% (+$5,775)
> Median household income: $71,707
Source: JamesBrey / Getty Images
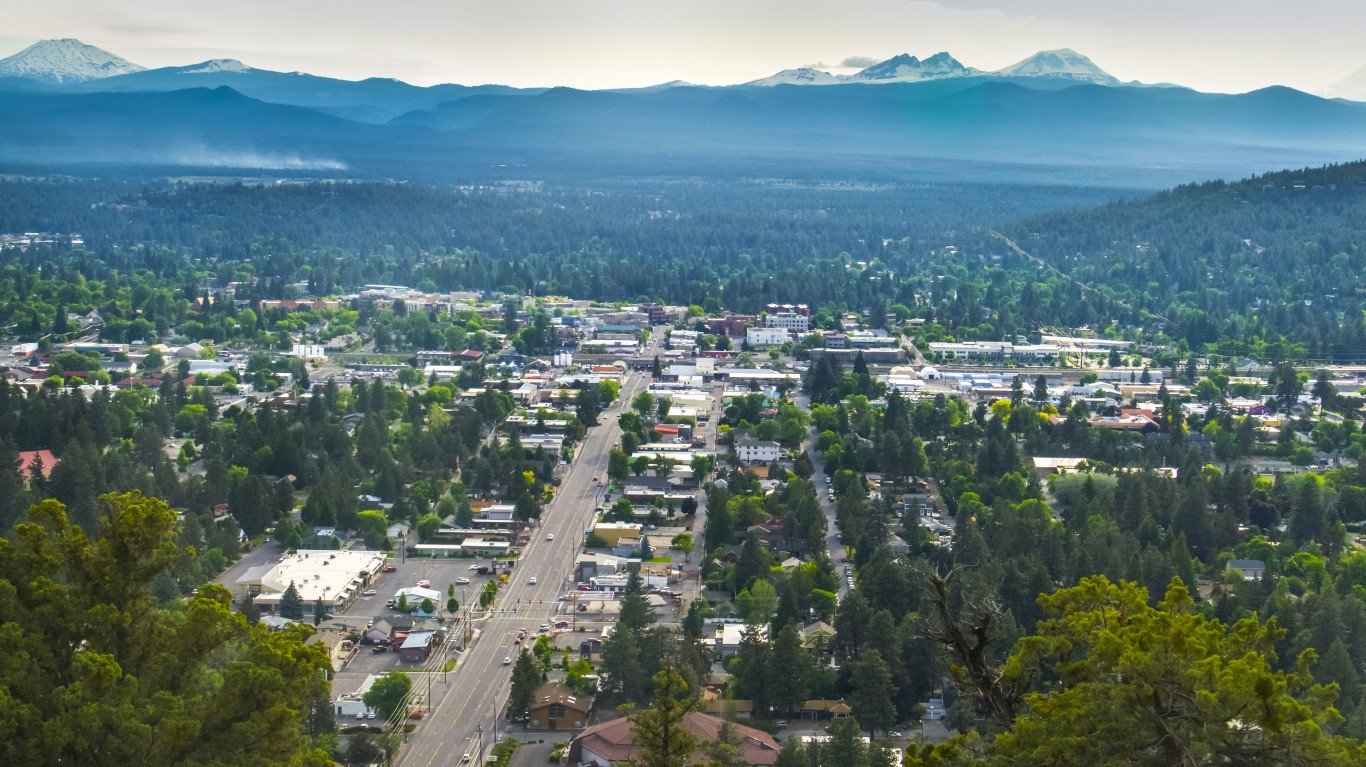
18. Bend, Oregon
> 1-yr. change in median home value: +29.7% (+$147,031)
> Median home value; June 2021: $641,497
> 1-yr. population change: +3.8% (+3,417)
> Population: 93,917
> 1-yr. change in median household income: +3.5% (+$2,194)
> Median household income: $65,662
These are all the counties in Oregon where COVID-19 is slowing (and where it’s still getting worse).

Source: Lisa McCabe / Getty Images
17. Toms River, New Jersey
> 1-yr. change in median home value: +30.7% (+$74,385)
> Median home value; June 2021: $317,016
> 1-yr. population change: +0.6% (+542)
> Population: 89,254
> 1-yr. change in median household income: +3.2% (+$2,488)
> Median household income: $79,889

Source: benedek / Getty Images
16. Coeur d’Alene, Idaho
> 1-yr. change in median home value: +31.1% (+$116,656)
> Median home value; June 2021: $491,257
> 1-yr. population change: +1.9% (+931)
> Population: 50,540
> 1-yr. change in median household income: +4.5% (+$2,180)
> Median household income: $51,073
These are all the counties in Idaho where COVID-19 is slowing (and where it’s still getting worse).

Source: Steven_Kriemadis / Getty Images
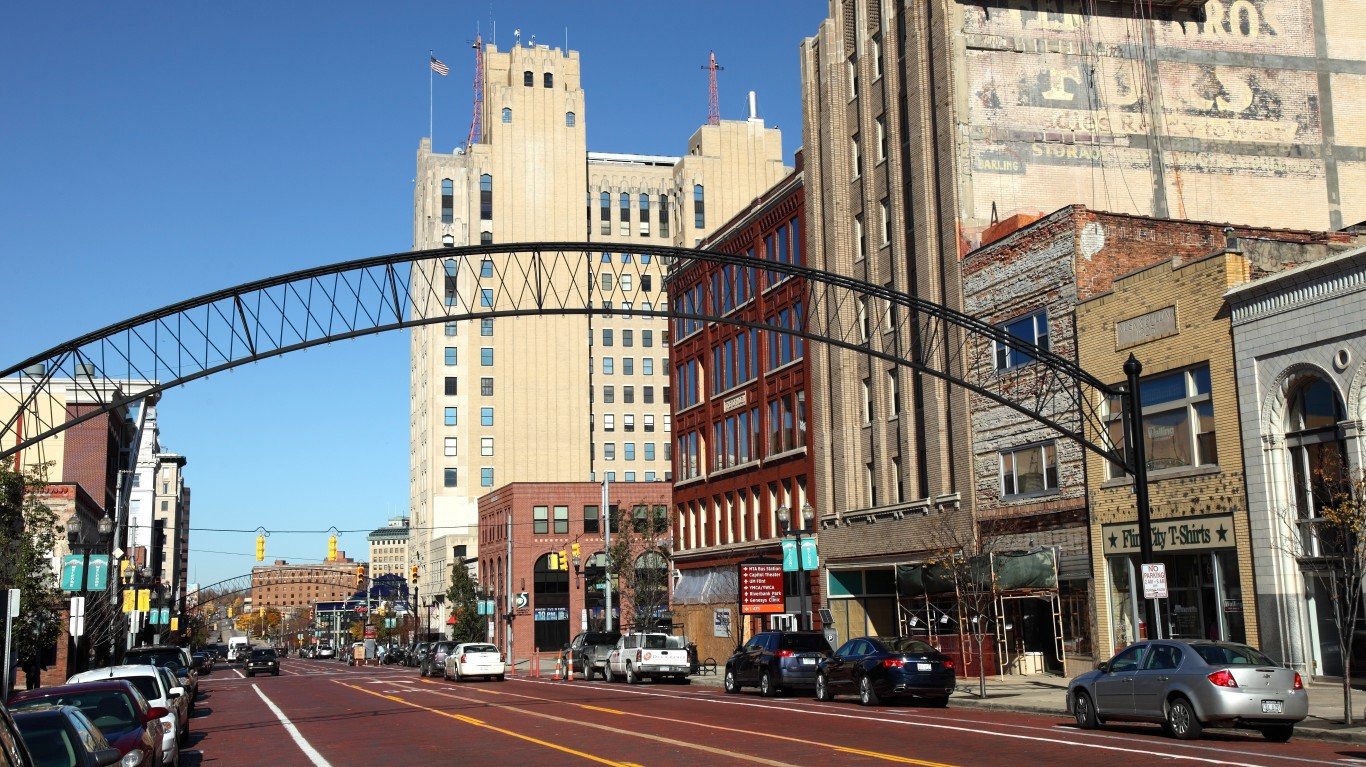
15. Detroit, Michigan
> 1-yr. change in median home value: +31.2% (+$12,596)
> Median home value; June 2021: $52,905
> 1-yr. population change: –0.3% (-2,314)
> Population: 674,841
> 1-yr. change in median household income: +4.8% (+$1,413)
> Median household income: $30,894

Source: DenisTangneyJr / iStock via Getty Images
14. Waterbury, Connecticut
> 1-yr. change in median home value: +32.1% (+$43,350)
> Median home value; June 2021: $178,519
> 1-yr. population change: –0.4% (-396)
> Population: 108,276
> 1-yr. change in median household income: +1.9% (+$784)
> Median household income: $42,401
Source: Davel5957 / Getty Images
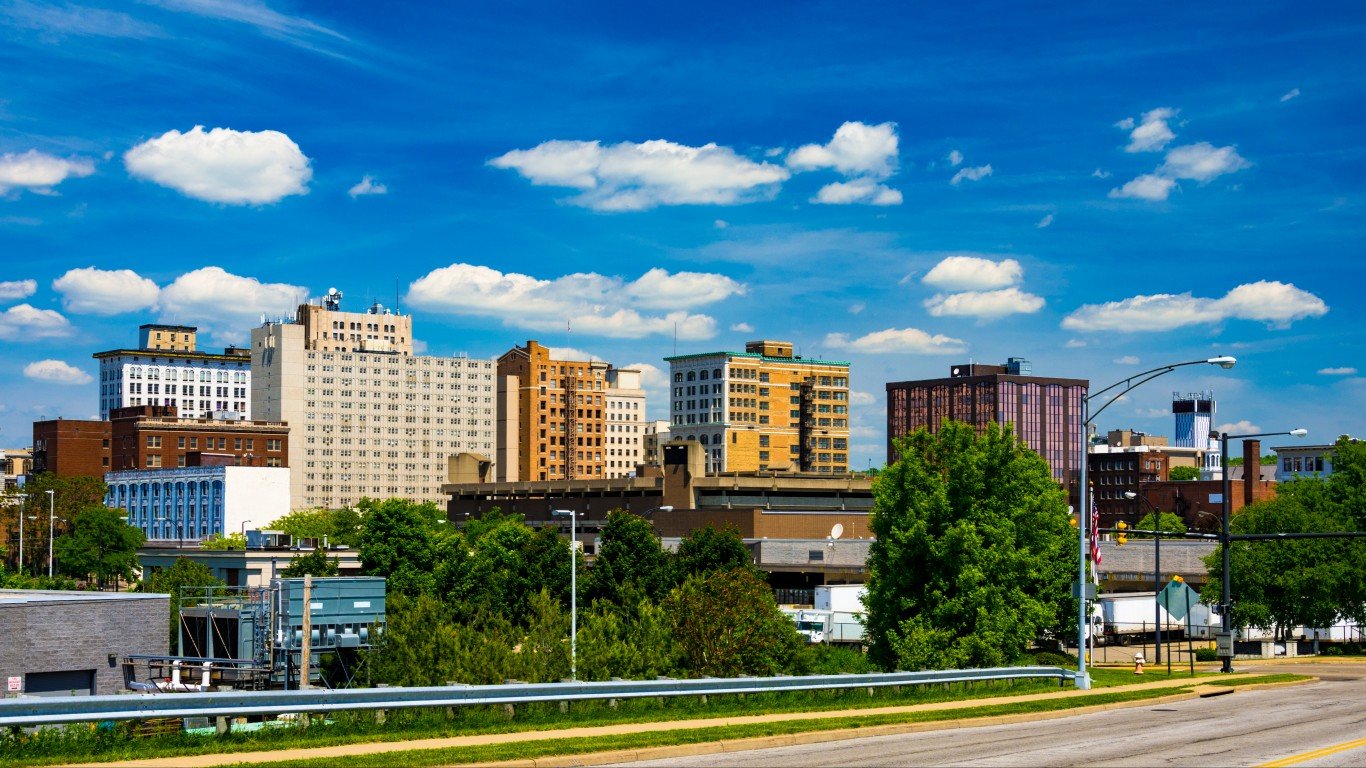
13. Youngstown, Ohio
> 1-yr. change in median home value: +33.9% (+$9,934)
> Median home value; June 2021: $39,229
> 1-yr. population change: +0.1% (+49)
> Population: 64,783
> 1-yr. change in median household income: +6.9% (+$1,871)
> Median household income: $28,822
These are all the counties in Ohio where COVID-19 is slowing (and where it’s still getting worse).

Source: RoschetzkyIstockPhoto / Getty Images
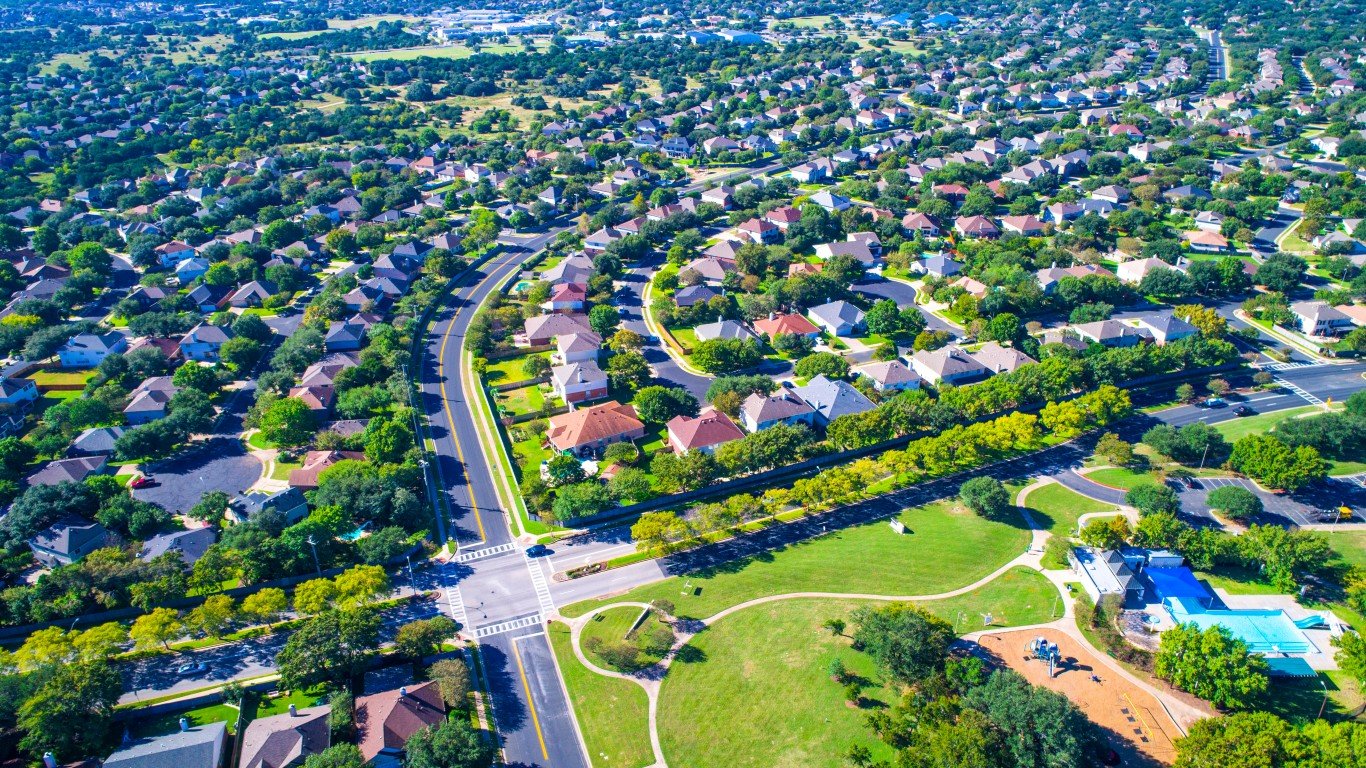
12. Austin, Texas
> 1-yr. change in median home value: +35.7% (+$147,967)
> Median home value; June 2021: $562,723
> 1-yr. population change: +1.6% (+15,052)
> Population: 950,807
> 1-yr. change in median household income: +6.1% (+$4,114)
> Median household income: $71,576
These are all the counties in Texas where COVID-19 is slowing (and where it’s still getting worse).
Source: RoschetzkyIstockPhoto / Getty Images
11. Georgetown, Texas
> 1-yr. change in median home value: +36.8% (+$118,090)
> Median home value; June 2021: $439,217
> 1-yr. population change: +6.3% (+4,200)
> Population: 71,004
> 1-yr. change in median household income: +3.4% (+$2,412)
> Median household income: $73,822
These are all the counties in Texas where COVID-19 is slowing (and where it’s still getting worse).
Source: DenisTangneyJr / Getty Images
10. Flint, Michigan
> 1-yr. change in median home value: +37.4% (+$11,122)
> Median home value; June 2021: $40,882
> 1-yr. population change: –0.6% (-602)
> Population: 96,559
> 1-yr. change in median household income: +4.0% (+$1,117)
> Median household income: $28,834
Source: RoschetzkyIstockPhoto / iStock via Getty Images
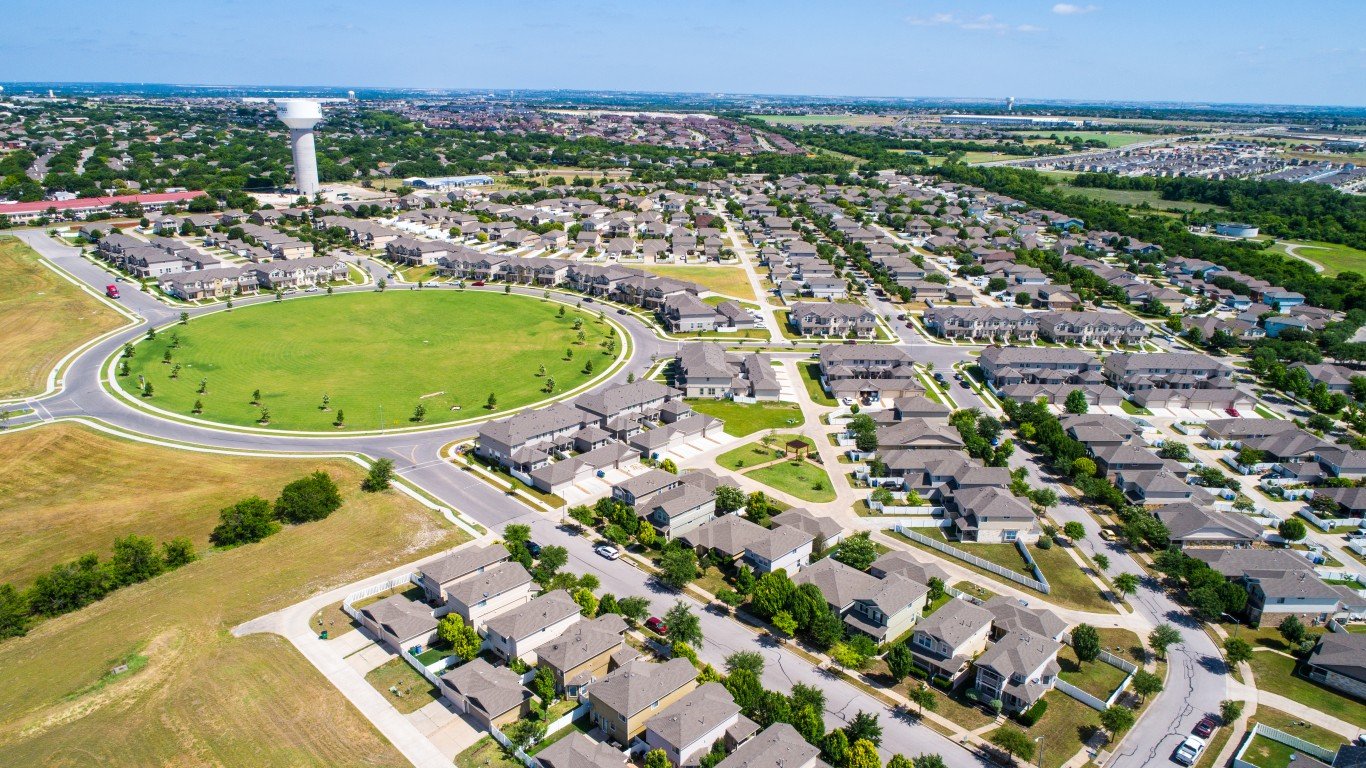
9. Pflugerville, Texas
> 1-yr. change in median home value: +39.7% (+$113,666)
> Median home value; June 2021: $400,254
> 1-yr. population change: +3.3% (+1,980)
> Population: 61,737
> 1-yr. change in median household income: +6.1% (+$5,395)
> Median household income: $93,627
These are all the counties in Texas where COVID-19 is slowing (and where it’s still getting worse).
Source: Dmharris26 / Public Domain / Wikimedia Commons
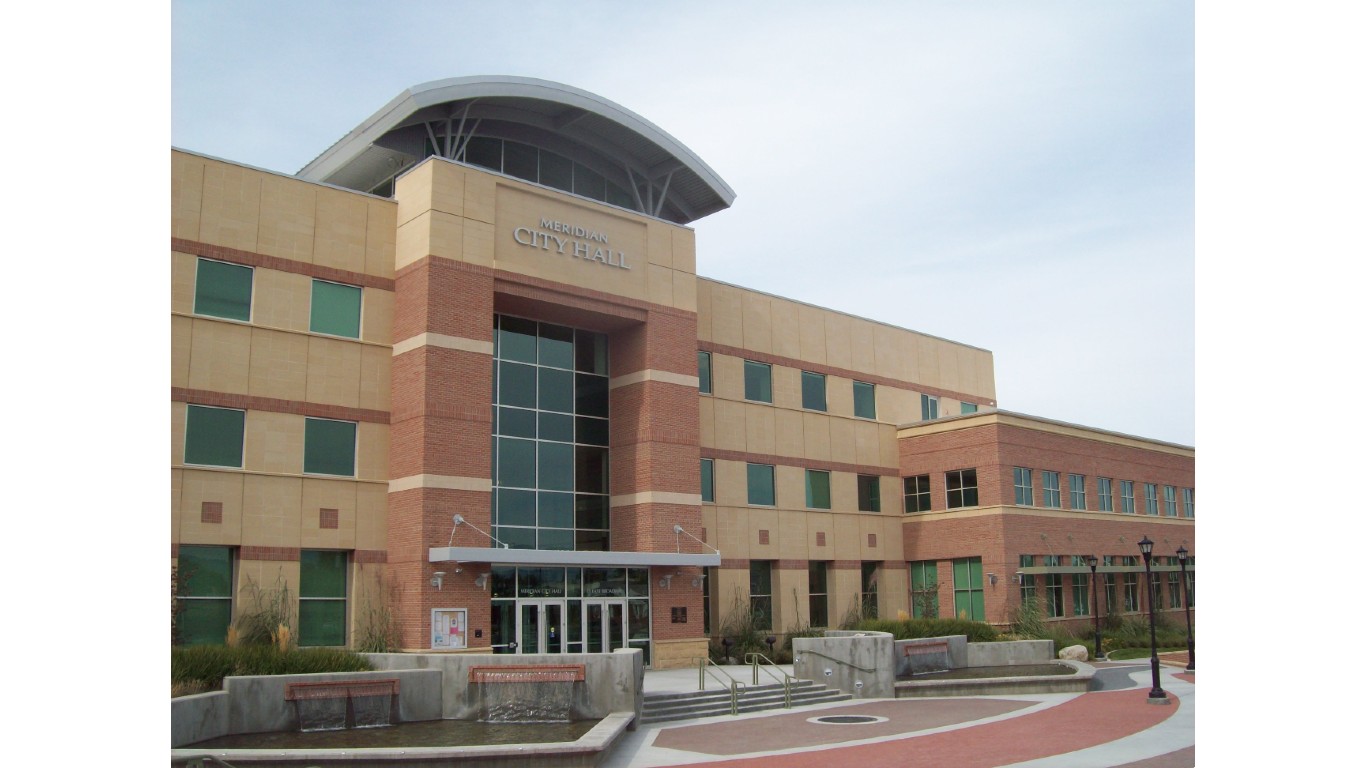
8. Meridian, Idaho
> 1-yr. change in median home value: +39.9% (+$147,489)
> Median home value; June 2021: $517,003
> 1-yr. population change: +5.0% (+4,897)
> Population: 101,905
> 1-yr. change in median household income: +4.8% (+$3,258)
> Median household income: $71,389
These are all the counties in Idaho where COVID-19 is slowing (and where it’s still getting worse).
Source: RoschetzkyIstockPhoto / Getty Images
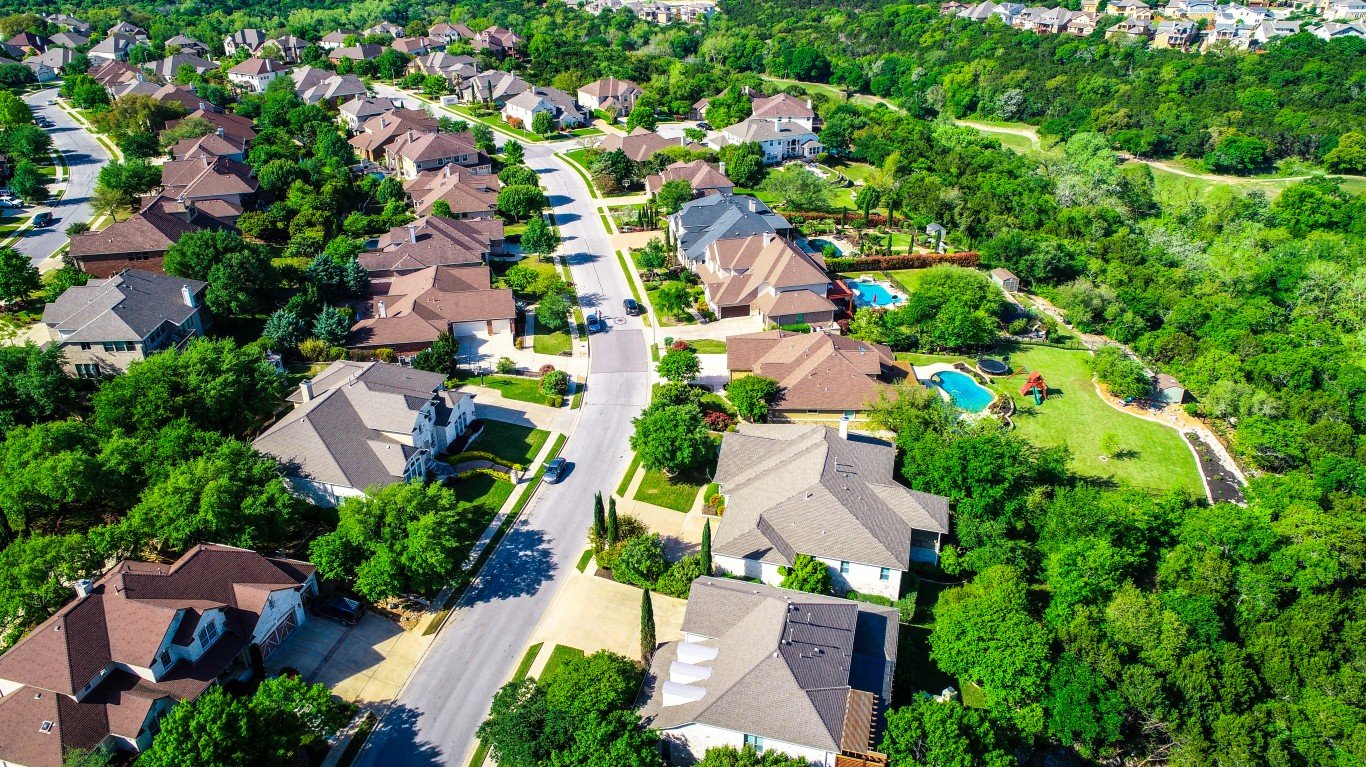
7. Cedar Park, Texas
> 1-yr. change in median home value: +41.0% (+$142,329)
> Median home value; June 2021: $489,474
> 1-yr. population change: +3.3% (+2,399)
> Population: 74,814
> 1-yr. change in median household income: +2.1% (+$2,174)
> Median household income: $104,019
These are all the counties in Texas where COVID-19 is slowing (and where it’s still getting worse).
Source: knowlesgallery / iStock via Getty Images
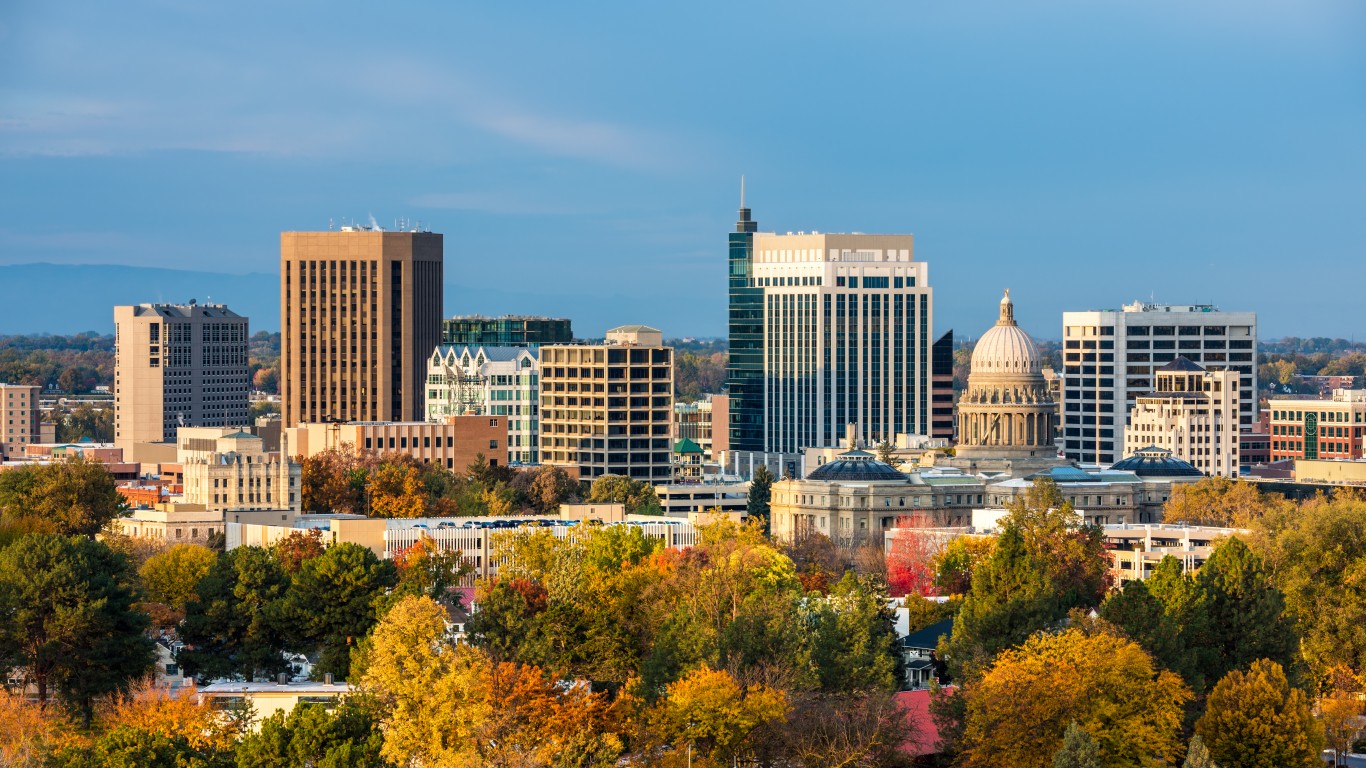
6. Boise City, Idaho
> 1-yr. change in median home value: +41.1% (+$144,307)
> Median home value; June 2021: $495,485
> 1-yr. population change: +0.8% (+1,815)
> Population: 226,115
> 1-yr. change in median household income: +5.7% (+$3,237)
> Median household income: $60,035
These are all the counties in Idaho where COVID-19 is slowing (and where it’s still getting worse).
Source: RoschetzkyIstockPhoto / Getty Images
5. Round Rock, Texas
> 1-yr. change in median home value: +41.7% (+$129,273)
> Median home value; June 2021: $439,069
> 1-yr. population change: +3.6% (+4,277)
> Population: 124,434
> 1-yr. change in median household income: +2.5% (+$2,039)
> Median household income: $82,676
These are all the counties in Texas where COVID-19 is slowing (and where it’s still getting worse).

Source: Mike Worley / iStock via Getty Images
4. Caldwell, Idaho
> 1-yr. change in median home value: +42.6% (+$109,366)
> Median home value; June 2021: $366,380
> 1-yr. population change: +3.2% (+1,682)
> Population: 54,887
> 1-yr. change in median household income: +3.3% (+$1,587)
> Median household income: $49,046
These are all the counties in Idaho where COVID-19 is slowing (and where it’s still getting worse).

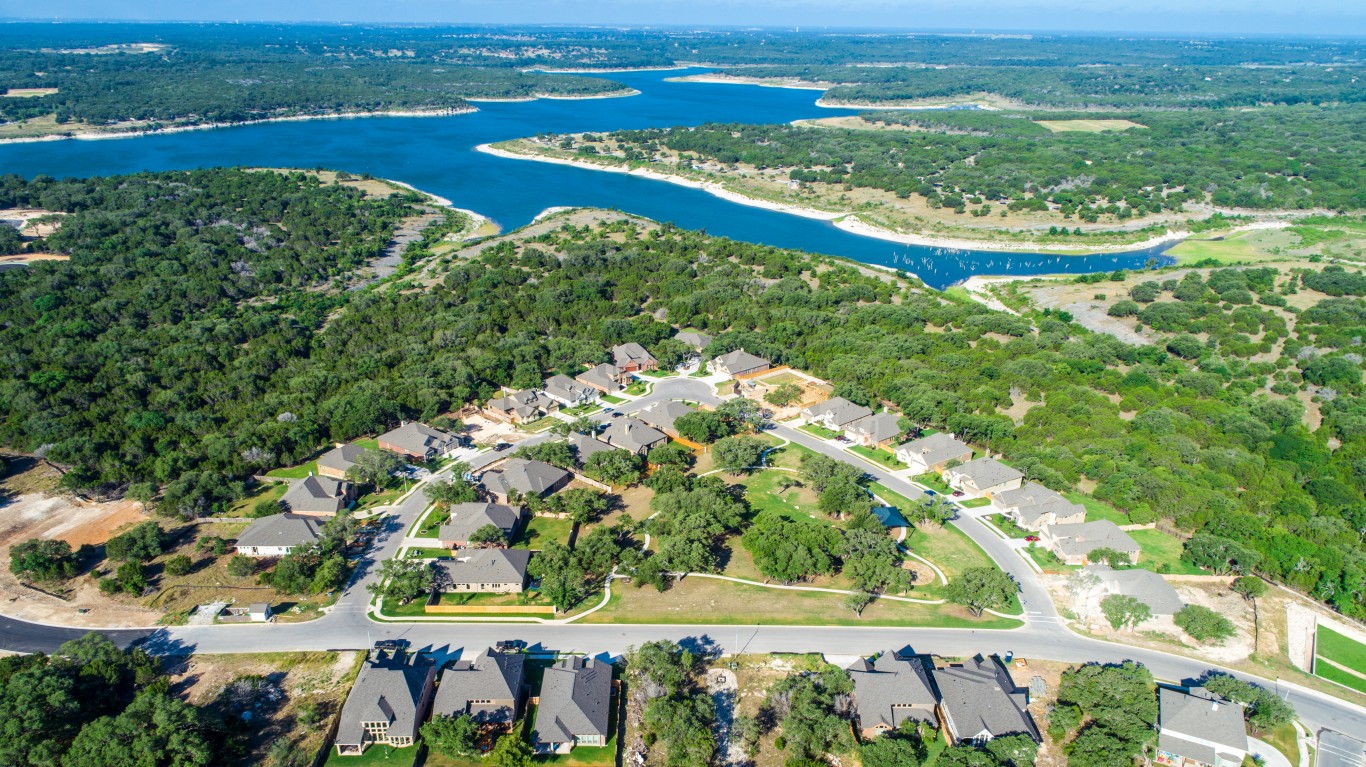
3. Leander, Texas
> 1-yr. change in median home value: +42.7% (+$133,469)
> Median home value; June 2021: $446,367
> 1-yr. population change: +15.7% (+7,297)
> Population: 53,716
> 1-yr. change in median household income: +10.2% (+$9,446)
> Median household income: $101,872
These are all the counties in Texas where COVID-19 is slowing (and where it’s still getting worse).

Source: knowlesgallery / Getty Images
2. Nampa, Idaho
> 1-yr. change in median home value: +42.8% (+$114,752)
> Median home value; June 2021: $382,977
> 1-yr. population change: +2.5% (+2,289)
> Population: 93,952
> 1-yr. change in median household income: +9.3% (+$4,155)
> Median household income: $48,846
These are all the counties in Idaho where COVID-19 is slowing (and where it’s still getting worse).

Source: Davel5957 / Getty Images
1. Rochester, New York
> 1-yr. change in median home value: +47.5% (+$114,369)
> Median home value; June 2021: $355,292
> 1-yr. population change: –0.4% (-930)
> Population: 206,848
> 1-yr. change in median household income: +6.6% (+$2,191)
> Median household income: $35,590
Click here to see all coronavirus data for every state.
Essential Tips for Investing: Sponsored
A financial advisor can help you understand the advantages and disadvantages of investment properties. Finding a qualified financial advisor doesn’t have to be hard. SmartAsset’s free tool matches you with up to three financial advisors who serve your area, and you can interview your advisor matches at no cost to decide which one is right for you. If you’re ready to find an advisor who can help you achieve your financial goals, get started now.
Investing in real estate can diversify your portfolio. But expanding your horizons may add additional costs. If you’re an investor looking to minimize expenses, consider checking out online brokerages. They often offer low investment fees, helping you maximize your profit.
Thank you for reading! Have some feedback for us?
Contact the 24/7 Wall St. editorial team.
Editors' Picks


